")
Back to Journals » OncoTargets and Therapy » Volume 11
Molecular mechanism of activated T cells in breast cancer
Authors Wu J , Li M, Zhang Y, Cai Y, Zhao G
Received 3 May 2018
Accepted for publication 18 June 2018
Published 20 August 2018 Volume 2018:11 Pages 5015—5024
DOI https://doi.org/10.2147/OTT.S173018
Checked for plagiarism Yes
Review by Single anonymous peer review
Peer reviewer comments 3
Editor who approved publication: Dr Federico Perche
Jie Wu,1 Maolan Li,2 Yijian Zhang,2,3 Yan Cai,4 Gaiping Zhao5
1Key Laboratory of Hydrodynamics (Ministry of Education), Department of Engineering Mechanics, School of Naval Architecture, Ocean and Civil Engineering, Shanghai Jiao Tong University, Shanghai, 200240, China; 2Department of General Surgery, Shanghai Research Center of Biliary Tract Disease, Xinhua Hospital Affiliated to Shanghai Jiao Tong University School of Medicine, Shanghai, 200092, China; 3Shanghai Key Laboratory of Biliary Tract Disease Research, Department of General Surgery, Xinhua Hospital Affiliated to Shanghai Jiao Tong University School of Medicine, Shanghai, 200092, China; 4School of Biological Science and Medical Engineering, Southeast University, Nanjing, 210096, China; 5Institute of Medical Instrument Engineering, School of Medical Instrument and Food Engineering, University of Shanghai for Science and Technology, Shanghai, 200093, China
Introduction: This study aimed to explore the effect of activated T cells on breast cancer (BC) cells and provide a theoretical basis for the interaction mechanism studies between BC and immune cells.
Methods: The microarray dataset GSE73527 was downloaded from the Gene Expression Omnibus database. The common differentially expressed mRNAs (co-DEMs) and the common differentially expressed long non-coding RNAs (co-DElncRNAs) were identified between MDA-MB-231 cells and MCF7 activated human T cells, respectively. The RNA–miRNA–lncRNA (ceRNA) network was constructed. Furthermore, the Kyoto encyclopedia of genes and genomes pathway and the gene ontology function analyses were performed on co-DEMs. The protein–protein interaction networks and modules were investigated.
Results: A total of 639 co-DEMs (such as interleukin-6 [IL6] and signal transducer and activator of transcription 1 [STAT1]) were detected in this study. Defense response to other organisms and herpes simplex infection were the most outstanding function and pathway assembled with co-DEMs, respectively. One protein–protein interaction network and three modules were further constructed. A total of 88 mRNA–miRNA–lncRNA relationships such as BTN3A1-has-mir-20b-5p-HCP5 were explored in the ceRNA network.
Conclusion: Activated T cells may play a crucial role in the defense response to other organism functions and herpes simplex infection pathways by upregulating IL6 and STAT1, which further affected the progression of BC. The BTN3A1-has-miR-20b-5p-HCP5 relationship may be the potential interaction mechanism between BC and immune cells.
Keywords: breast cancer, differentially expressed mRNA, function and pathway analysis, protein–protein interaction network, mRNA–miRNAs–lncRNA regulation network
Introduction
Breast cancer (BC) is the most frequently diagnosed cancer in women worldwide, accounting for 25% of all cancer cases1 with 1.68 million new cases and 522,000 deaths in a year.2 BC is typically treated by surgery, which may be followed by chemotherapy, radiation therapy, or other immune-modulating treatments.3 Although increasingly aggressive treatments are employed in clinical applications, the survival rates of BC in developing countries remain poor.1,4
Malignant human tumors are often accompanied by infiltration of immune cells into the region of tumor cell proliferation.5 Activated CD8+ T cells have been shown to play a critical role in the killing of tumor cells, and elevated T-cell activation scores are positively correlated with longer patient survival in BC.6 Additionally, a previous study demonstrated a relationship between tumor-infiltrating lymphocytes (TILs) and BC.7 TILs, which include T cells and B cells, are part of the larger category of “tumor-infiltrating immune cells” that are present in variable proportions.8 A previous study showed that TILs are good prognostic indicators in highly proliferative breast tumors.9 The results of large cohorts indicated an association between the TILs in early stage of BC and high response rates to neoadjuvant chemotherapy.10 TILs are involved in the process of BC via gene expression or pathway regulation.11 Numerous studies have revealed the molecular pathways such as PI3K-Akt-mTOR governing the migration of T lymphocytes into tumor tissue.12,13 In a previous study, Noonepalle et al compared the immunophenotype by mRNA sequencing between MDA-MB-231 cells and MCF7-activated human T cells.14 Their results showed that indoleamine 2,3-dioxygenase 1 (IDO1) methylation regulated anti-immune responses in BC subtypes and can be used as a predictive biomarker for immunotherapy. However, genetic evaluation of TILs in a BC specimen is currently not routine because the genetic relevance remains unclear.
Based on the microarray data provided by Noonepalle et al,14 we performed bioinformatics analysis to identify the common differentially expressed mRNAs (co-DEMs) and common differentially expressed long non-coding RNA (co-DElncRNA) between MDA-MB-231 cells and MCF7-activated human T cells, respectively. Functional and pathway enrichment analysis was performed based on these co-DEMs. Next, the protein–protein interaction (PPI) network and modules were investigated. Furthermore, lncRNAs are reported to act as ceRNAs that regulate the expression of miRNA-targeted genes by sponging miRNAs.15 LncRNAs have also been identified as promising prognostic and metastatic markers in BC.16,17 Thus, an mRNA–miRNA–lncRNA interaction network was constructed. We explored the effect of activated T cells on the expression of BC cell lines and provide a theoretical basis for studying the interaction mechanism between BC and immune cells.
Materials and methods
Data resource and preprocessing
Gene expression profile data in the dataset GSE7352714 were downloaded from the Gene Expression Omnibus database (http://www.ncbi.nlm.nih.gov/geo/). This dataset was produced on the GPL11154 Illumina HiSeq 2000 platform (Homo sapiens). A total of 12 cell samples including 3 MCF7 cell samples (MCF7-control samples), 3 MCF7 samples co-cultured with normal peripheral blood mononuclear cells activated with anti-CD3/CD28 antibodies (MCF-case samples), 3 MDA-MB-231 cell samples (MDA-MB-231-control samples), and 3 MDA-MB-231 samples co-cultured with normal peripheral blood mononuclear cells activated with anti-CD3/CD28 antibodies (MDA-MB-231-case samples) were examined in this profile.
Principal component analysis (PCA) is a statistical procedure that uses an orthogonal transformation to convert a set of observations of possibly correlated variables into a set of values of linearly uncorrelated variables known as principal components (or sometimes, principal modes of variation).18 PCA is widely used in data processing and dimensionality reduction.19 After downloading the standardized data of GSE73527, pattern recognition of data and samples distribution observation were performed by PCA. Next, combined with the protein coding gene annotation information (V25) provided by the Gencode database (https://www.gencodegenes.org/),20 the mRNA expression matrix and the lncRNA expression matrix for subsequent analysis were extracted, and our analysis was mainly based on mRNA expression.
Investigation of DEMs
According to different cell types and processing methods, the samples were grouped and analyzed as follows: MCF7-case vs MCF7-control (MCF7 group) and MDA-MB-231-case vs MDA-MB-231-control (MDA-MB-231 group). The P-value of DEMs in each group was calculated using the empirical Bayes linear model in Linear Models for Microarray Data (limma, http://www.bioconductor.org/packages/release/bioc/html/limma.html) package21 of R (version: 3.32.5) software. The adjusted P-values (adjust.P.value) of DEMs were obtained by multiple checking and correction based on the Benjamini and Hochberg method.22 An adjust.P.value <0.05 and a |log fold change (FC)| >1 were selected as the thresholds for identifying DEMs.
The intersection results for all DEMs (co-DEMs) in both the MCF7 and MDA-MB-231 groups were visualized using a Venn diagram. The expression values of DEMs were visualized using a heat map with pheatmap software23 (clustering distance: Pearson’s correlation, clustering methods: linkage clustering) in R package (version: 1.0.8, https://cran.r-project.org/web/packages/pheatmap).
Gene ontology (GO) and Kyoto Encyclopedia of Genes and Genomes (KEGG) pathway enrichment analysis
GO analysis is commonly used for functional studies of large-scale genomic or transcriptomic data.24 The KEGG pathway database25 contains information regarding how molecules or genes are networked. In this study, the clusterProfiler software26 (version: 3.4.4, https://bioconductor.org/packages/release/bioc/html/clusterProfiler.html) in R package was used to identify over-represented GO categories in biological process and significant KEGG pathways. Next, the Benjamini and Hochberg method27 corrected adjust.P.value <0.05 was selected as the threshold for identification.
PPI network and modules construction
The Search Tool for the Retrieval of Interacting Genes/Proteins (STRING, version: 10.0, http://www.string-db.org/)28 was used to predict PPIs in this study. Based on the information in the STRING database, the PPI network was constructed from up- and downregulated proteins, and then visualized using Cytoscape (version: 3.4.0) software.29 The network topological index (degree) is defined as the number of links incident upon a node.30 The degree was calculated using CytoNCA software (version 2.1.6, http://apps.cytoscape.org/apps/cytonca).31 The key node (hub protein) was determined by the degree score: a higher score indicated a more important location in the network.
A previous study demonstrated that a gene from the same module in a PPI network plays a regulatory role in biological function.32 The MCODE package33 (version 1.4.2, http://apps.cytoscape.org/apps/MCODE) plugin in Cytoscape software (degree cutoff=2, node score cutoff=0.2, K-core=2, Max.Depth=100) was used to analyze modules in this study. Additionally, KEGG pathway enrichment analysis was carried out on outstanding modules. An adjust.P.value <0.05 was selected as the threshold for identification.
Investigation of differentially expressed lncRNAs
According to the method for screening DEMs between groups, the differentially expressed lncRNAs (DElncRNA) were also explored as the adjust.P.value <0.05 and |log FC| >1. Next, the intersection results for all DElncRNAs in both the MCF7 and MDA-MB-231 groups were visualized using a Venn diagram. The expression values of DElncRNAs were visualized as a heat map using pheatmap software (clustering distance: Pearson’s correlation, clustering methods: linkage clustering) in R package.
miRNA associated lncRNA exploration
The miRNA prediction of co-DEMs was performed using miRWalk 2.0 software (http://zmf.umm.uni-heidelberg.de/apps/zmf/mirwalk2/).34,35 Based on the predicted and experimentally confirmed miRNA–gene regulatory relationship in the miRWalk database, the miRNA–co-DEM interactions were further explored.
The starBase v2.0 database provides the most comprehensive CLIP-Seq experimentally supported miRNA–lncRNA interaction networks.36 In this study, the union set of miRNA–lncRNA interactions in both the starBase (version: 2.0) database and InCeDB37 (http://gyanxet-beta.com/lncedb/) database were used as the background for investigating miRNA regulatory factors of co-DElncRNAs.
Based on the miRNA–mRNA interactions, lncRNAs–miRNA interactions, and positive co-expression relationship between mRNA and lncRNAs (correlation coefficient >0.9 and P<0.05), the mRNA–miRNA–lncRNA network (ceRNA) was further explored. Finally, network topology analysis was carried out to identify the key elements in the network.
Results
Differentially expressed analyses
PCA analysis was performed on the downloaded data (Figure 1). The results showed that samples from the same group were clustered together, particularly for the MCF7-control samples and the MDA-MB-231-control samples.
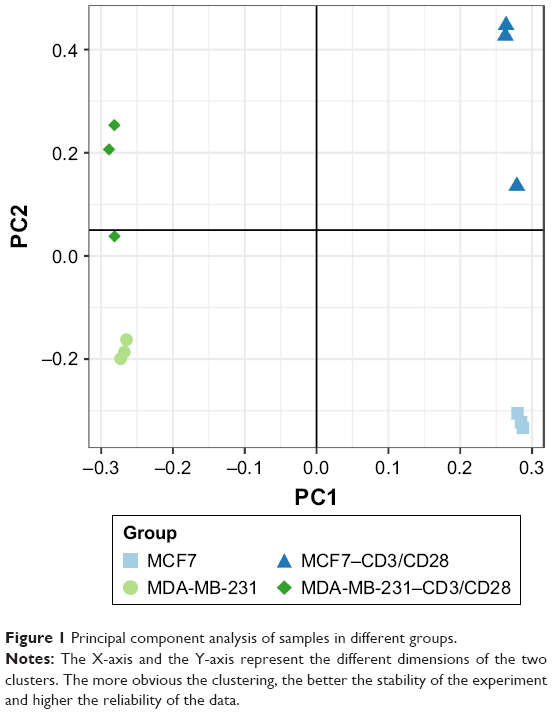 | Figure 1 Principal component analysis of samples in different groups. |
After annotation, 18,984 mRNAs were obtained from the expression matrix. A total of 2,781 DEMs (1,571 upregulated and 1,210 downregulated) were obtained between MCF7-case samples and MCF7-control samples in the MCF7 group. A total of 846 upregulated and 762 downregulated DEMs were detected between MDA-MB-231-case samples and MDA-MB-231-control samples in the MDA-MB-231 group. Furthermore, 438 upregulated co-DEMs (including IDO1) and 201 downregulated co-DEMs in the intersection of two groups were identified (Figure 2A). The clustering heat map for these co-DEMs is shown in Figure 2B, indicating that co-DEMs could distinguish samples from different groups.
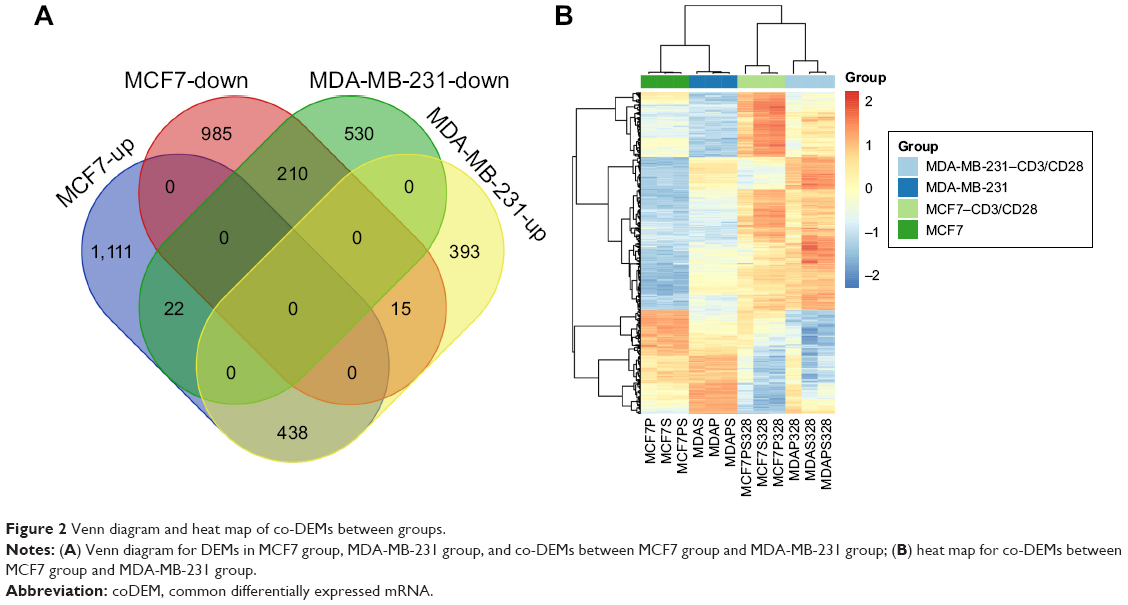 | Figure 2 Venn diagram and heat map of co-DEMs between groups. |
GO function and KEGG pathway enrichment analysis
GO categories in biological process functions enriched by co-DEMs are shown in Figure 3A. The results showed that these co-DEMs were mainly related to functions such as the defense response to other organisms (GO: 0098542, P: 3.68E-25, count: 72, gene: interleukin 6 [IL6], STAT1, 2′–5′-oligoadenylate synthetase 1 [OAS1], interferon regulatory factor 7 [IRF7], 2′–5′-oligoadenylate synthetase 2 [OAS2], etc), response to virus (GO: 0009615, P: 1.88E-28, count: 54, gene: interferon gamma inducible protein 16 [IFI16], OAS1, interferon regulatory factor 7 [IRF7], beta-2-microglobulin [B2M], interleukin 10 receptor subunit beta [IL10RB], etc), and response to interferon-gamma (GO: 0034341, P: 7.24E-46, count: 60, gene: nitric oxide synthase 2 [NOS2], major histocompatibility complex, class II, DR alpha [HLA-DRA], class II major histocompatibility complex transactivator [CIITA], OAS1, IRF7, etc).
 | Figure 3 GO function and KEGG pathway enrichment analyses of co-DEMs. |
KEGG pathway enrichment analysis showed that the co-DEMs were mainly enriched in herpes simplex infection (hsa05168, P: 5.72E-23, gene: C3, OAS1, IRF7, STAT1, IL6, etc), influenza A (hsa05164, P: 1.00E-18, gene: OAS, IRF7, janus kinase 2 [JAK2], caspase 1 [CASP1], suppressor of cytokine signaling 3 [SOCS3], etc), and NOD-like receptor signaling pathway (hsa04621, P: 6.30E-15, gene: MEFV, pyrin innate immunity regulator [MEFV], guanylate binding protein 7 [GBP7], IFI16, OAS1, IRF7, etc), as shown in Figure 3B.
PPI network analysis
To obtain more useful information from the co-DEMs mentioned above, a PPI network was constructed based on the relationships among protein interactions. The results revealed 499 nodes (348 upregulated and 151 downregulated proteins) and 4,769 interactions in the current PPI network. Among these nodes, IL6, STAT1, IRF7, OAS1, and OAS2 were the top five nodes according to the degree score and were considered as hub proteins in the network (Figure 4).
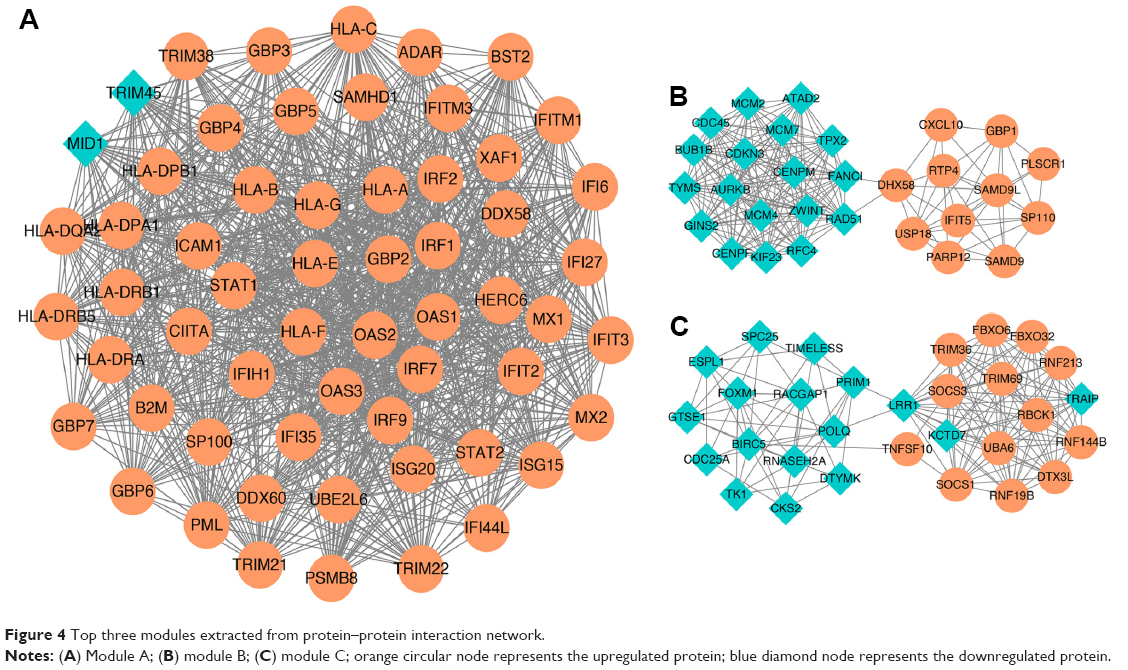 | Figure 4 Top three modules extracted from protein–protein interaction network. |
Modules and related pathway analysis
Three modules with the highest scores were selected for further investigation. The results showed that there were 57 upregulated proteins and 2 downregulated proteins in module A (Figure 4A); these proteins were mainly enriched in pathways such as herpes simplex infection and influenza A (Figure 5). There were 11 upregulated proteins and 18 downregulated proteins in module B (Figure 4B); these proteins were mainly enriched in pathways such as cell cycle and DNA replication (Figure 5). Furthermore, a total of 13 upregulated proteins and 17 downregulated proteins were found in module C (Figure 4C); these proteins were mainly enriched in pathways such as pyrimidine metabolism and DNA replication.
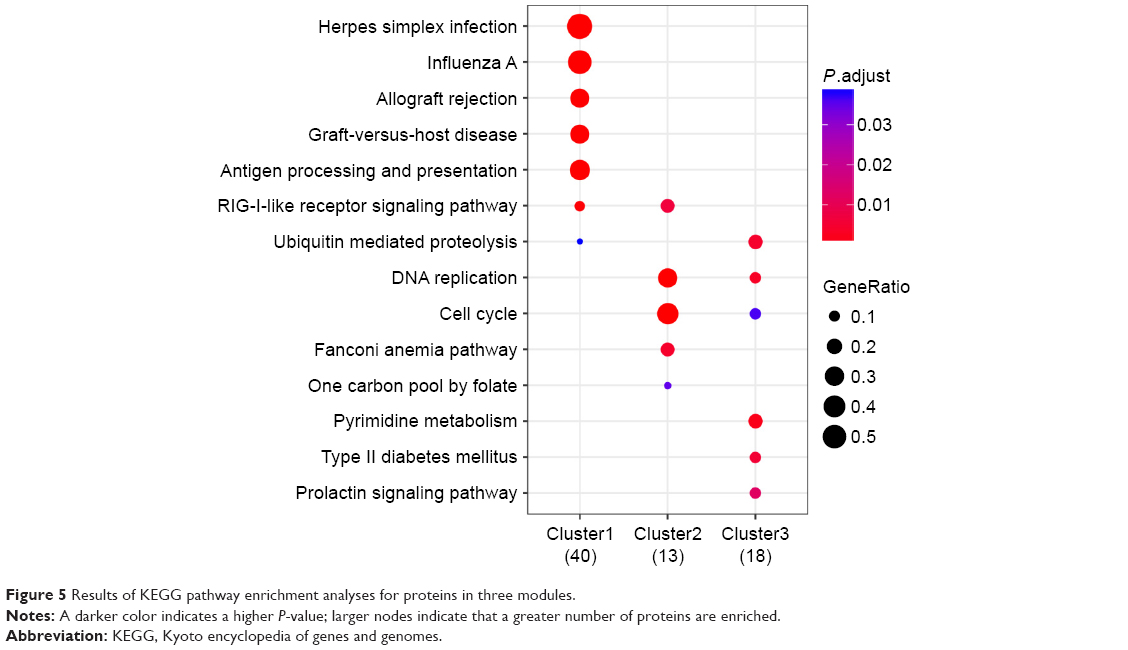 | Figure 5 Results of KEGG pathway enrichment analyses for proteins in three modules. |
LncRNA investigation
After annotation, 11,023 lncRNAs were obtained. Differential expression analysis revealed 134 DElncRNAs (103 upregulated and 31 downregulated) between MCF7-case samples and MCF7-control samples in the MCF7 group. There were 69 DElncRNAs (30 upregulated and 39 downregulated) between MDA-MB-231-case samples and MDA-MB-231-control samples in the MDA-MB-231 group. A total of nine upregulated co-DElncRNAs and three downregulated co-DElncRNAs between the two groups were further obtained from these DElncRNAs.
CeRNA regulatory network analysis
A total of 88 mRNA–miRNA–lncRNA regulation relationships including BTN3A1-has-mir-20b-5p-HCP5 and BTN3A1-has-mir-17–5 p-HCP5 were explored in ceRNA regulatory network analysis (Figure 6). Among these relationships, there were 2 upregulated lncRNAs (RP11-799D4.4 and HLA Complex P5 [HCP5]), 39 upregulated mRNAs (such as Kringle Containing Transmembrane Protein 1 [KREMEN1] and CD47 Molecule [CD47]), and 64 miRNAs (such as hsa-mir-20b-5p and hsa-mir-17–5 p) in the ceRNA network. The results of network topological analysis showed that the most outstanding miRNAs regulating mRNA–lncRNA relationships were hsa-mir-20b-5p, hsa-mir-17–5 p, hsa-mir-93–5 p, and hsa-mir-106b-5p.
 | Figure 6 Competing endogenous RNA regulatory network in the present study. |
Discussion
BC is the most common invasive cancer in women worldwide. Although TILs are related to BC progression, the detailed molecular mechanism of TILs in BC remains unclear. Consistent with the findings by Noonepalle et al,14 our bioinformatics analysis also showed that IDO1 was co-upregulated between MDA-MB-231 cells and MCF7 cells-activated human T cells. Moreover, key co-DEMs including IL6 and STAT1 were detected in this study. GO function and KEGG pathway analysis showed that the defense response to other organisms and herpes simplex infection were the most outstanding functions and pathway assembled with co-DEMs, respectively. Furthermore, 88 mRNA–miRNA–lncRNA relationships including BTN3A1-has-mir-20b-5p-HCP5 and BTN3A1-has-mir-17–5 p-HCP5 were found in the ceRNA network.
A recent study found that infiltration of tissue by immune cells contributes to BC development.38 The extent of T-cell infiltration into invasive BC has been reported to range from 1% to 45% of the total cellular mass.39 In rapidly proliferating tumors, the presence of T lymphocytes at tumor sites is a good prognostic indicator compared to non-immunogenic tumors.39 However, the exact composition of T lymphocyte infiltration varies greatly and may profoundly affect disease progression and overall patient survival.40 Furthermore, certain leukocytes, such as cytotoxic T lymphocytes, play a vital function in constraining tumor development.41 This is supported by epidemiologic data showing an increased incidence of viral-associated cancers.42 In the present study, co-DEMs between T-cell-activated samples and control samples were mainly enriched in immune response functions such as the defense response to other organisms and pathways such as herpes simplex infection. This result indicates that activated T cells affect BC cell lines via the defense response to other organism function and herpes simplex infection pathway. Interestingly, IL6 and SATA1 were two DEMs that were both outstanding in the defense response to other organism function and herpes simplex infection pathway. IL6 is secreted by T cells to stimulate immune responses during infection or other tissue damage, leading to inflammation.43 Kim et al found that normal mammary epithelial cells from healthy women release IL-6, but the expression of IL-6 was abolished in ductal infiltrating carcinomas.44 However, Garcia-Tuñón et al suggested that high expression of IL-6 and its receptors in breast tumors is related to enhanced cell proliferation in BC.45 IL-6 appears to have a dual function in the biology of in vitro BC cells. STAT1 is a member of the STAT family and plays an important role in orchestrating immune reactions.46 The antitumor function of STAT1 through its capacity to control the immune system and promote tumor immune surveillance has been widely examined.47 A previous study shows that interferon-γ restores BC sensitivity to the drug fulvestrant by regulating STAT1 and signaling to caspase-dependent apoptosis.48 In an animal study, Siebler et al showed that STAT1-deficient and T-bet-deficient mice were protected from T-cell-dependent liver injury, suggesting a close relationship between STAT1 and T-cell activation in disease.49 Thus, based on our results, we speculate that the activated T cells may play an important role in the defense response to other organism function and herpes simplex infection pathway by upregulating IL6 and STAT1, which further affect BC progression.
The expression of lncRNAs has recently been reported in tumorigenesis and plays a pivotal role in regulating the malignant behavior of cancers.50 HCP5 is a human endogenous retrovirus, but has now become an integral part of the human genome.51 Liang et al suggested that HCP5 could induce follicular thyroid carcinoma progression via an miRNA sponge.52 Furthermore, Venkatadri et al showed that modulating miRNAs with mimics or inhibitors validated the key roles of miR-542-3 p in MCF-7 and miR-122-5 p in MDA-MB-231 BC cell death.53 As an miRNA, miR-20b may underlie the metastatic heterogeneity of BC.54 Moreover, some genes such as early growth response-1 play an important role in miR-20b regulation during BC progression.55 Butyrophilin subfamily three member A1 (BTN3A1), a member of the butyrophilin gene family, plays a role in T-cell activation, activated T-cell proliferation, and immune response adaption.56 It is widely known that in the ceRNA network of BC, mRNAs can communicate with each other by competing for a limited pool of miRNAs.57 A previous study showed that the 3′ untranslated region of the pseudogene CYP4Z2P promotes tumor angiogenesis in BC by acting as a ceRNA.58 In the present study, has-miR-20b-5p-BTN3A1-HCP5 showed an outstanding miRNA–mRNA–lncRNA regulation relationship in ceRNA regulation network. Thus, the has-miR-20b-5p-BTN3A1-HCP5 relationship may be involved in the interaction mechanism between BC and immune cells.
There were some limitations to this study. First, the sample size was small. Second, there was a lack of experimental verification because human or mouse tumor samples with activated T cells were difficult to obtain. Verification experiments with a large sample size are needed to confirm our results.
Conclusion
Activated T cells may play an important role in the defense response to other organism function and herpes simplex infection pathway by upregulating IL6 and STAT1, which further affect the progression of BC. Furthermore, the has-miR-20b-5p-BTN3A1-HCP5 relationship may be involved in the interaction mechanism between BC and immune cells.
Acknowledgment
This study was supported by the National Natural Science Foundation of China (No 11572200, No 81773043, No 31501127, No 11502146) and Shanghai Key Laboratory of Biliary Tract Disease Research Foundation (No 17DZ2260200).
Disclosure
The authors report no conflicts of interest in this work.
References
Stewart B, Wild C. World Cancer Report 2014. International Agency for Research on Cancer; 2014. | ||
Tao Z, Shi A, Lu C, Song T, Zhang Z, Zhao J. Breast cancer: epidemiology and etiology. Cell Biochem Biophys. 2015;72(2):333–338. | ||
Saini KS, Taylor C, Ramirez AJ, et al. Role of the multidisciplinary team in breast cancer management: results from a large international survey involving 39 countries. Ann Oncol. 2012;23(4):853. | ||
Mungrue K, Ramdath J, Ali S, et al. Challenges to the control of breast cancer in a small developing country. Breast Cancer (Auckl). 2014;8(8):7:BCBCR.S12780. | ||
Whiteside TL. Immune suppression in cancer: effects on immune cells, mechanisms and future therapeutic intervention. Semin Cancer Biol. 2006;16(1):3. | ||
Lu L, Bai Y, Wang Z. Elevated T cell activation score is associated with improved survival of breast cancer. Breast Cancer Res Treat. 2017;164(3):689–696. | ||
Disis ML. Immune regulation of cancer. J Clin Oncol. 2010;28(29):4531. | ||
Gentles AJ, Newman AM, Liu CL, et al. The prognostic landscape of genes and infiltrating immune cells across human cancers. Nat Med. 2015;21(8):938. | ||
Aaltomaa S, Lipponen P, Eskelinen M, et al. Lymphocyte infiltrates as a prognostic variable in female breast cancer. Eur J Cancer. 1992;28A(4–5):859–864. | ||
Loi S, Sirtaine N, Piette F, et al. Prognostic and predictive value of tumor-infiltrating lymphocytes in a Phase III randomized adjuvant breast cancer trial in node-positive breast cancer comparing the addition of docetaxel to doxorubicin with doxorubicin-based chemotherapy: BIG 02-98. J Clin Oncol. 2013;31(7):860–867. | ||
Calabrò A, Beissbarth T, Kuner R, et al. Effects of infiltrating lymphocytes and estrogen receptor on gene expression and prognosis in breast cancer. Breast Cancer Res Treat. 2009;116(1):69–77. | ||
Zhang X, Huang T, Wu Y, et al. Inhibition of the PI3K-Akt-mTOR signaling pathway in T lymphocytes in patients with active tuberculosis. Int J Infect Dis. 2017;59(C):110–117. | ||
Szamel M. Resch K. T-cell antigen receptor-induced signal-transduction pathways-activation and function of protein kinases c in T lymphocytes. Eur J Biochem. 2016;2(1):53–79. | ||
Noonepalle SK, Gu F, Lee EJ, et al. Promoter methylation modulates indoleamine 2,3-dioxygenase 1 induction by activated T cells in human breast cancers. Cancer Immunol Res. 2017;5(4):330. | ||
Kallen AN, Zhou XB, Xu J, et al. The imprinted H19 lncRNA antagonizes let-7 microRNAs. Mol Cell. 2013;52(1):101–112. | ||
Gupta RA, Shah N, Wang KC, et al. Long non-coding RNA HOTAIR reprograms chromatin state to promote cancer metastasis. Nature. 2010;464(7291):1071–1076. | ||
Lu L, Zhu G, Zhang C, et al. Association of large noncoding RNA HOTAIR expression and its downstream intergenic CpG island methylation with survival in breast cancer. Breast Cancer Res Treat. 2012;136(3):875–883. | ||
Ren V, Ma Y, Sastry SS. Generalized Principal Component Analysis. Springer Publishing Company, Incorporated; 2016. | ||
Alizadeh E, Lyons SM, Castle JM, Prasad A. Measuring systematic changes in invasive cancer cell shape using Zernike moments. Integr Biol (Camb). 2016;8(11):1183–1193. | ||
Harrow J, Frankish A, Gonzalez JM, et al. GENCODE: the reference human genome annotation for The ENCODE Project. Genome Res. 2012;22(9):1760–1774. | ||
Smyth GK. Limma: linear models for microarray data. In: Bioinformatics and Computational Biology Solutions Using R and Bioconductor. Springer; New York, NY: 2005:397–420. | ||
Benjamini Y, Hochberg Y. Controlling the false discovery rate: a practical and powerful approach to multiple testing. J R Stat Soc. 1995;57(1):289–300. | ||
Kolde R. Pheatmap: pretty heatmaps. 2015. Available from: https://cran.r-project.org/web/packages/pheatmap/index.html. Accessed July 30, 2018. | ||
Ashburner M, Ball CA, Blake JA, et al. Gene ontology: tool for the unification of biology. The Gene Ontology Consortium. Nat Genet. 2000;25(1):25–29. | ||
Kanehisa M, Goto S. KEGG: Kyoto encyclopedia of genes and genomes. Nucleic Acids Res. 2000;28(1):27–30. | ||
Yu G, Wang LG, Han Y, He QY, Qy H. clusterProfiler: an R package for comparing biological themes among gene clusters. OMICS. 2012;16(5):284–287. | ||
Benjamini Y, Hochberg Y. Controlling the false discovery rate: a practical and powerful approach to multiple testing. J R Stat Soc Series B Stat Methodol. 1995:289–300. | ||
Szklarczyk D, Franceschini A, Wyder S, et al. STRING v10: protein–protein interaction networks, integrated over the tree of life. Nucleic Acids Res. 2015;43(Database issue):D447–D452. | ||
Shannon P, Markiel A, Ozier O, et al. Cytoscape: a software environment for integrated models of biomolecular interaction networks. Genome Res. 2003;13(11):2498–2504. | ||
Sharma D, Surolia A, Centrality D. In: Dubitzky W, Wolkenhauer O, Cho K-H, Yokota H, eds. Encyclopedia of Systems Biology. New York, NY: Springer New York; 2013:558–558. | ||
Yu Tang ML, Wang J, Pan Y, Wu F-X. Cytonca: a cytoscape plugin for centrality analysis and evaluation of biological networks. BioSystems. 2014;11:005. | ||
Wang J, Ren J, Li M, Wu FX, Fx W. Identification of hierarchical and overlapping functional modules in PPI networks. IEEE Trans Nanobioscience. 2012;11(4):386. | ||
Bader GD, Hogue CW. An automated method for finding molecular complexes in large protein interaction networks. BMC Bioinformatics. 2003;4:2. | ||
Breuer K, Foroushani AK, Laird MR, et al. InnateDB: systems biology of innate immunity and beyond – recent updates and continuing curation. Nucleic Acids Res. 2013;41(Database issue):D1228–D1233. | ||
Dweep H, Gretz N. miRWalk2.0: a comprehensive atlas of microRNA-target interactions. Nat Methods. 2015;12(8):697–697. | ||
Li JH, Liu S, Zhou H, Qu LH, Yang JH. starBase v2.0: decoding miRNA–ceRNA, miRNA–ncRNA and protein–RNA interaction networks from large-scale CLIP-Seq data. Nucleic Acids Res. 2014;42(Database issue):D92–D97. | ||
das S, Ghosal S, Sen R, Chakrabarti J. lnCeDB: database of human long noncoding RNA acting as competing endogenous RNA. PLoS One. 2014;9(6):e98965. | ||
Steven A, Seliger B. The role of immune escape and immune cell infiltration in breast cancer. Breast Care (Basel). 2018. | ||
Chin Y, Janseens J, Vandepitte J, et al. Phenotypic analysis of tumor-infiltrating lymphocytes from human breast cancer. Anticancer Res. 1992;12(5):1463–1466. | ||
Li Z, Dong P, Ren M, et al. PD-L1 expression is associated with tumor FOXP3(+) regulatory T-cell infiltration of breast cancer and poor prognosis of patient. J Cancer. 2016;7(7):784–793. | ||
Dunn GP, Old LJ, Schreiber RD. The immunobiology of cancer immunosurveillance and immunoediting. Immunity. 2004;21(2):137–148. | ||
Saville MW, Smith C, Lilly S, Mann KP. AIDS-related malignancies. Cancer Chemother Biol Response Modif. 1997;17(4):408. | ||
Zhou YQ, Liu Z, Liu ZH, et al. Interleukin-6: an emerging regulator of pathological pain. J Neuroinflammation. 2016;13(1):141. | ||
Kim HJ, Krenn V, Steinhauser G, Berek C. Plasma cell development in synovial germinal centers in patients with rheumatoid and reactive arthritis. J Immunol. 1999;162(5):3053–3062. | ||
Garcia-Tuñón I, Ricote M, Ruiz A, et al. IL-6, its receptors and its relationship with bcl-2 and bax proteins in infiltrating and in situ human breast carcinoma. Histopathology. 2005;47(1):82–89. | ||
Hj K, Kim YJ. Signal transducer and activator of transcription proteins: regulators of myeloid-derived suppressor cell-mediated immunosuppression in cancer. Arch Pharm Res. 2016;39(11):1–12. | ||
Koromilas AE, Sexl V. The tumor suppressor function of STAT1 in breast cancer. JAKSTAT. 2013;2(2):e23353. | ||
Ning Y, Riggins RB, Mulla JE, et al. IFNgamma restores breast cancer sensitivity to fulvestrant by regulating STAT1, IFN regulatory factor 1, NF-kappaB, BCL2 family members, and signaling to caspase-dependent apoptosis. Mol Cancer Ther. 2010;9(5):1274–1285. | ||
Siebler J, Wirtz S, Klein S, et al. A key pathogenic role for the STAT1/T-bet signaling pathway in T-cell-mediated liver inflammation. Hepatology. 2003;38(6):1573. | ||
Teng H, Wang P, Xue Y, et al. Role of HCP5-miR-139-RUNX1 feedback loop in regulating malignant behavior of glioma cells. Mol Ther. 2016;24(10):1806-1822. | ||
Vastag B. AIDS abated: genome scans illuminate immune control of HIV. Science News. 2010;172(3):35–35. | ||
Liang L, Xu J, Wang M, et al. LncRNA HCP5 promotes follicular thyroid carcinoma progression via miRNAs sponge. Cell Death Dis. 2018;9(3):372. | ||
Venkatadri R, Muni T, Iyer AK, Yakisich JS, Azad N. Role of apoptosis-related miRNAs in resveratrol-induced breast cancer cell death. Cell Death Dis. 2016;7(2):e2104. | ||
Li JY, Zhang Y, Zhang WH, et al. Differential distribution of miR-20a and miR-20b may underly metastatic heterogeneity of breast cancers. Asian Pac J Cancer Prev. 2012;13(5):1901–1906. | ||
Li D, Ilnytskyy Y, Kovalchuk A, et al. Crucial role for early growth response-1 in the transcriptional regulation of miR-20b in breast cancer. Oncotarget. 2013;4(9):1373–1387. | ||
Btn1a1. Butyrophilin subfamily 1 member a1. Available from: http://www.informatics.jax.org/marker/MGI:103118. Accessed July 30, 2018. | ||
Zhou X, Liu J, Wang W. Construction and investigation of breast-cancer-specific ceRNA network based on the mRNA and miRNA expression data. IET Syst Biol. 2014;8(3):96–103. | ||
Zheng L, Li X, Gu Y, Lv X, Xi T. The 3′UTR of the pseudogene CYP4Z2P promotes tumor angiogenesis in breast cancer by acting as a ceRNA for CYP4Z1. Breast Cancer Res Treat. 2015;150(1):105–118. |
 © 2018 The Author(s). This work is published and licensed by Dove Medical Press Limited. The full terms of this license are available at https://www.dovepress.com/terms.php and incorporate the Creative Commons Attribution - Non Commercial (unported, v3.0) License.
By accessing the work you hereby accept the Terms. Non-commercial uses of the work are permitted without any further permission from Dove Medical Press Limited, provided the work is properly attributed. For permission for commercial use of this work, please see paragraphs 4.2 and 5 of our Terms.
© 2018 The Author(s). This work is published and licensed by Dove Medical Press Limited. The full terms of this license are available at https://www.dovepress.com/terms.php and incorporate the Creative Commons Attribution - Non Commercial (unported, v3.0) License.
By accessing the work you hereby accept the Terms. Non-commercial uses of the work are permitted without any further permission from Dove Medical Press Limited, provided the work is properly attributed. For permission for commercial use of this work, please see paragraphs 4.2 and 5 of our Terms.