")
Back to Journals » Cancer Management and Research » Volume 13
Molecular Heterogeneity of Xp11.2 Translocation Renal Cell Carcinoma: The Correlation Between Split Signal Pattern in FISH and Prognosis
Authors Zhu Y , Pu X, Dong X, Ji C, Guo H, Li D, Zhao X, Gan W
Received 15 December 2020
Accepted for publication 16 February 2021
Published 15 March 2021 Volume 2021:13 Pages 2419—2431
DOI https://doi.org/10.2147/CMAR.S297457
Checked for plagiarism Yes
Review by Single anonymous peer review
Peer reviewer comments 2
Editor who approved publication: Professor Yong Teng
Yiqi Zhu,1,* Xiaohong Pu,2,* Xiang Dong,3 Changwei Ji,1 Hongqian Guo,1 Dongmei Li,4,5 Xiaozhi Zhao,1 Weidong Gan1
1Department of Urology, Nanjing Drum Tower Hospital, The Affiliated Hospital of Nanjing University Medical School, Nanjing, Jiangsu, People’s Republic of China; 2Department of Pathology, Nanjing Drum Tower Hospital, The Affiliated Hospital of Nanjing University Medical School, Nanjing, Jiangsu, People’s Republic of China; 3Department of Urology, Drum Tower Clinical Medical School of Nanjing Medical University, Nanjing, Jiangsu, People’s Republic of China; 4Immunology and Reproduction Biology Laboratory & State Key Laboratory of Analytical Chemistry for Life Science, Medical School, Nanjing University, Nanjing, Jiangsu, People’s Republic of China; 5Jiangsu Key Laboratory of Molecular Medicine, Nanjing University, Nanjing, Jiangsu, People’s Republic of China
*These authors contributed equally to this work
Correspondence: Weidong Gan; Xiaozhi Zhao
Department of Urology, Nanjing Drum Tower Hospital, The Affiliated Hospital of Nanjing University Medical School, 321 Zhongshan Road, Nanjing, Jiangsu, 210008, People’s Republic of China
Tel +86 13305186699
Fax +86 2583307115
Email [email protected]; [email protected]
Purpose: Xp11.2 translocation renal cell carcinoma (Xp11.2 tRCC) is a distinct subtype of renal cell carcinoma (RCC) characterized by chromosomal translocations involving TFE3 gene. TFE3 break-apart fluorescence in situ hybridization (FISH) assay is an effective tool to diagnose Xp11.2 tRCC. The aim of this study is to evaluate the correlation between split signal pattern in FISH and the clinicopathological characteristics of Xp11.2 tRCC.
Patients and Methods: We reviewed 2037 RCC patients who underwent partial nephrectomy or radical nephrectomy from January 2007 to March 2020 in our institution. Forty-nine cases were diagnosed as Xp11.2 tRCC and their split signal patterns were evaluated. X-tile software was used to determine the optimal cut-off value of the percentage of split signal in FISH. Kaplan–Meier analysis and Cox regression analysis were performed to assess the relationship between signal pattern of FISH and the prognosis.
Results: Among the 49 patients, 13 patients and 36 patients were classified into high and low split signal group, respectively. Nine cases showed extra amplification signal pattern and 40 cases showed typical translocation signal pattern. Multivariate analysis demonstrated that high percentage of split signal and amplification signal pattern were the independent predictors for progression-free survival (PFS) whereas only pT stage was associated independently with overall survival (OS).
Conclusion: Xp11.2 tRCC cases with high percentage of split signals or amplification signal pattern may have a worse outcome, and the two indicators need to be highlighted in clinical practice.
Keywords: Xp11.2 translocation renal cell carcinoma, TFE3, FISH, amplification, prognosis
Introduction
Xp11.2 translocation renal cell carcinoma (Xp11.2 tRCC), which was first described as a clinicopathological entity in 2001,1 is a rare subtype of renal cell carcinoma (RCC) associated with translocations of transcription factor E3 (TFE3) gene located at the Xp11.2 locus. It was classified as a distinct entity of RCC by the World Health Organization (WHO) in 20042 and then included into the microphthalmia (MiT) family tRCCs in the 2016 WHO classification of tumors of the urinary system.3 Xp11.2 tRCCs are more frequently seen in children and young adults, accounting for approximately 50% of all pediatric RCCs,4 while they comprise only 1% of adult cases,5,6 which may suggest a discrepancy of its biological properties between adults and children.
The relatively common gene fusions reported initially in Xp11.2 tRCC included ASPL (ASPSCR1)-TFE3,1 PRCC-TFE3,7 SFPQ (PSF)-TFE3,8 CLTC-TFE3.9 Cases with inversion of chromosome X involving NONO (p54nrb)-TFE310 fusion and RBM10-TFE311 fusion were reported subsequently due to the improvement of detection methods. Infrequent gene fusions such as PARP14, KHSRP, LUC7L3, DVL2, MED15, GRIPAP1, ARID1B, MATR3 and FUBP1 were only identified in individual cases.12–17 Recent researches have reported new fusion partners including NEAT1, KAT6A18 and EWSR1.19 Various histologic patterns including papillary, nested, alveolar or tubular architectures have been observed in Xp11.2 tRCC harboring different gene fusions.20 Therefore, more diagnostic evidence is needed for cases with suspected morphological features of Xp11.2 tRCC.
The formation of fusion genes results in overexpression of TFE3 fusion protein, which present with strong nuclear expression in immunohistochemistry (IHC).9 Moderately to strongly positive nuclear immunoreactivity of TFE3 is an important clue to the diagnosis of Xp11.2 tRCCs, while false-negativity and positivity due to different technical methods reduce its reliability.21 Fluorescence in situ hybridization (FISH) assay is an effective tool to identify Xp11.2 tRCCs in most pathology laboratories22 although it may ignore subtle chromosome inversion in RBM10-TFE3 cases.23 The cut-off value of TFE3 break-apart FISH to diagnose Xp11.2 tRCC ranged from 7.15%24 to 20%,25 and the most common threshold was set at 10%.17,21,22,26–30 This setting can help identify most Xp11.2 tRCCs, but as to cases with indistinct histological and immunohistochemical features, borderline results should be interpreted with caution.31 Besides, whether there is any biological difference between Xp11.2 tRCCs with high and low percentage of split signals is equivocal.32
In this study, we divided 49 cases of Xp11.2 tRCCs into two groups on the basis of the percentage of TFE3 split signals (%TFE3 split signals) and compared their clinicopathologic differences. In addition, we further described the heterogeneity of split signal pattern in FISH, which may provide experience to understand the correlation between clinical features and genetic profile in Xp11.2 tRCC.
Patients and Methods
Case Selection
In this study, a total of 2037 consecutive RCC patients who underwent partial nephrectomy or radical nephrectomy from January 2007 to March 2020 at Nanjing Drum Tower Hospital were reviewed. The inclusion criteria for analysis were: (1) Suspicious morphological characteristics of Xp11.2 tRCC (papillary, nested, alveolar or tubular architectures, abundant clear or eosinophilic cytoplasm and psammoma bodies) and/or at least (+) nuclear positivity with TFE3 IHC and/or positive results in TFE3 break-apart FISH. (2) Complete clinical data and follow-up information. (3) Archival formalin-fixed paraffin-embedded (FFPE) tissues were available. The clinicopathological features including age on set, sex, maximum tumor diameter, TNM staging, nuclear grade, follow-up and clinical outcomes were recorded. The TNM stage and nuclear grade were evaluated by the eighth edition of AJCC (American Joint Committee on Cancer) staging system and WHO/ISUP (International Society of Urological Pathology) grading system, respectively. All patients were followed up every 3 months during the initial 2 years, every 6 months thereafter for 3 years, and annually after 5 years until death or loss to follow-up. Overall survival (OS) was defined as the duration from the initiation of operation to the date of death or the last follow-up. Progression-free survival (PFS) was defined as the time interval between the date of operation and the date of disease progression or last follow-up. Local recurrence and distant metastasis were both regarded as disease progression.
IHC Staining
TFE3 IHC was performed on four-μm-thick FFPE sections of the suspicious Xp11.2 RCC cases. Briefly, the FFPE sections were first deparaffinized in a series of xylene and hydrated in graded ethanol concentrations. Then, the sections were treated with 3% H2O2 for 10 minutes at room temperature to quench endogenous peroxidase. Immunoreaction for TFE3 was performed using the rabbit anti-TFE3 monoclonal antibody (ZA-0657, prediluted, ZSGB-BIO, Beijing, China) and diaminobenzidine was used for visualization. Detailed immunohistochemical procedures have been reported before.33
The result was evaluated by two experienced pathologists (Xiaohong Pu and Jun Yang) in a semiquantitative manner to assess the percentage of positive cells as previously described:34 negative, <5% tumor cell positivity; focal or equivocal (+), <10% tumor cell positivity; moderate (++), 11% to 50% tumor cell positivity; strong (+++), >50% tumor cell positivity.
FISH Assay and Assessment of Split Signals
Three-μm -thick FFPE tissue sections were prepared for FISH. The commercial dual-color TFE3 break-apart Probes (LBP, Guangzhou, China) and XY chromosome probes (LBP, Guangzhou, China) were used to detect TFE3 arrangement and chromosome X aneuploidy, respectively. The centromeric side of the TFE3 gene was labeled with green fluorescence and the telomeric TFE3 gene was labeled with red fluorescence in the TFE3 break-apart probe. The chromosome X was labeled with green fluorescence and the chromosome Y was labeled with red fluorescence in XY chromosome probe. For each slide, the tumor region to be probed was first marked by a pathologist according to the matched H&E section. The tumor tissues were deparaffinized with xylene for 30 minutes, washed with absolute ethanol for 10 minutes, and rehydrated in 100%, 85%, and 70% ethanol in turn for 3 minutes. Then, the sections were digested with 10 μL pepsin (4 mg/mL, 0.02M HCl; Sigma-Aldrich, Beijing, China) for 5 min at 37 °C and washed twice in 2× sodium saline citrate (SSC) for 5 minutes. Subsequently, the tissues were dehydrated by immersing in 70%, 85% and 100% ethanol for 3 minutes each at room temperature and then air dried. The probes were applied to the tumor region and the slides containing the probe mixture denatured at 85°C in a humidified atmosphere for 5 minutes and target DNA simultaneously, followed by incubation at 37 °C overnight for hybridization. The sections were washed in 2×SSC for 10 minutes and in 0.1% NP-40/2×SSC for 5 minutes at room temperature. Five microliter 4,6-diamidino-2-phenylindole (DAPI) was applied to counterstain the nuclei on each slide. After hybridization, all slides were preserved from light at 4°C.
FISH results were observed by an Olympus BX51TRF fluorescence microscope (Olympus, Tokyo, Japan) with a triple emission filter (DAPI/FITC/TexasRed) and the FISH analysis software (Imstar, Paris, France). To minimize subjective bias, all slides were examined and scored in a blinded manner by two pathologists (Xiaohong Pu and Jun Yang). For each case, 100 representative tumor nuclei were observed under fluorescence microscopy at ×1000 magnification. In order to avoid false-positive results, only clear FISH signals in nonoverlapping nuclei were included in the count and the split signals (the green and red signal) should be separated by a distance >2 signal diameter. The normal signal was interpreted as one fused signal (or closely adjacent green-red signal) in males and two fused signals in females. The positive results were defined as followed: (1) TFE3 translocation: For males, 1 green 1 red signals (1R1G) or 1 green (1G) or 1 red (1R) signal resulting from section truncation was considered as positive. For females, 1 red,1 green and 1 fusion signal (1R1G1F) or 1 red 1 fusion signal (1R1F) or 1 green 1fusion signal (1G1F) was considered as positive.21,35 (2) TFE3 amplification: The main TFE3 break-apart signal pattern was not only the typical signal and showed other amplification signals (ie: 2R2G1F). Amplification results would be verified by XY chromosome probe. According to previous reports,17,21,22,26–30 a positive result was considered when >10% of the nuclei in the tumor tissue showed split signals. In the positive cases, the percentage of split signals and split signal patterns were recorded.
Statistical Methods
Continuous data are presented as median (range) and categoric data are presented as number (proportion). To evaluate the prognosis under different percentage of split signals, X-tile software (Version: 3.6.1, Copyright Yale University 2003–05)36 was used to investigate an optimal cut-off value. Based on the cut-point, all the Xp11.2 RCC cases were divided into two groups (high % split signal and low % split signal group). Mann–Whitney U-test was performed to analyze the distribution of continuous data and the Pearson chi-square test or Fisher’s exact test was performed to analyze categorical data. Survival data were estimated with Kaplan – Meier method, and statistical comparisons between the two groups were evaluated with a Log rank test. A Cox proportional hazards regression analysis was used to evaluate the independent factors that showed significance in the log-rank test. All the predictors with P < 0.10 in univariate analysis would be included in the multivariate model. A two-sided P < 0.05 was considered statistically significant. Statistical analyses were performed by SPSS software version 26.0 (SPSS, Inc., Chicago, IL, USA) and the survival curves were delineated by GraphPad Prism software version 8.0 (GraphPad Software, San Diego, CA).
Results
Clinicopathologic Characteristics
Among all these patients, 69 suspicious cases were included in the analyses and prepared for TFE3 IHC and FISH assay. Of the 69 suspicious cases, a total of 49 patients were diagnosed as Xp11.2 tRCCs by TFE3 break-apart FISH. Among these patients, 21 patients (42.9%) were male and 28 patients (57.1%) were female. Their ages on set ranged from 7 to 71 years (median, 34 years; mean, 36.8 years) and maximum tumor diameter ranged from 2.2 to 13 cm (median, 5cm; mean, 5.2 cm). The pT1-pT2 stage and pT3-pT4 stage were observed in 38 (77.6%) and 11 (22.4%) patients, respectively. Regional lymph node metastasis was found in 12 patients (24.5%) and 37 patients (75.5%) had no definitive lymph node metastasis at surgery. Only one patient had distant metastasis at diagnosis while distant metastasis was found in 17 patients at presentation.
Pathology Findings
The morphological characteristics of Xp11.2 tRCC vary widely. Twelve cases and seven cases mainly showed papillary architecture and solid-nested architecture, respectively. Around half of the cases showed variable morphologies. Other architecture was shown in 6 cases and psammoma bodies were found in 26 cases. Representative histopathologic features were shown in Figure 1. In the evaluation of nuclear grade, 23 cases were marked as grade 1–2 and 26 cases were marked as grade 3–4. As to the IHC results, 7 cases showed focal or equivocal (+) TFE3 nuclear positivity, 15 cases showed moderate (++) positivity and 27 cases showed strong (+++) positivity. %TFE3 split signals ranged from 12% to 89% with a median percentage of 53% and a mean percentage of 52.1%. Forty cases showed typical translocation signals (Figure 2) and nine cases showed extra amplification signals (Figure 3). Main clinicopathologic features are summarized in Table 1.
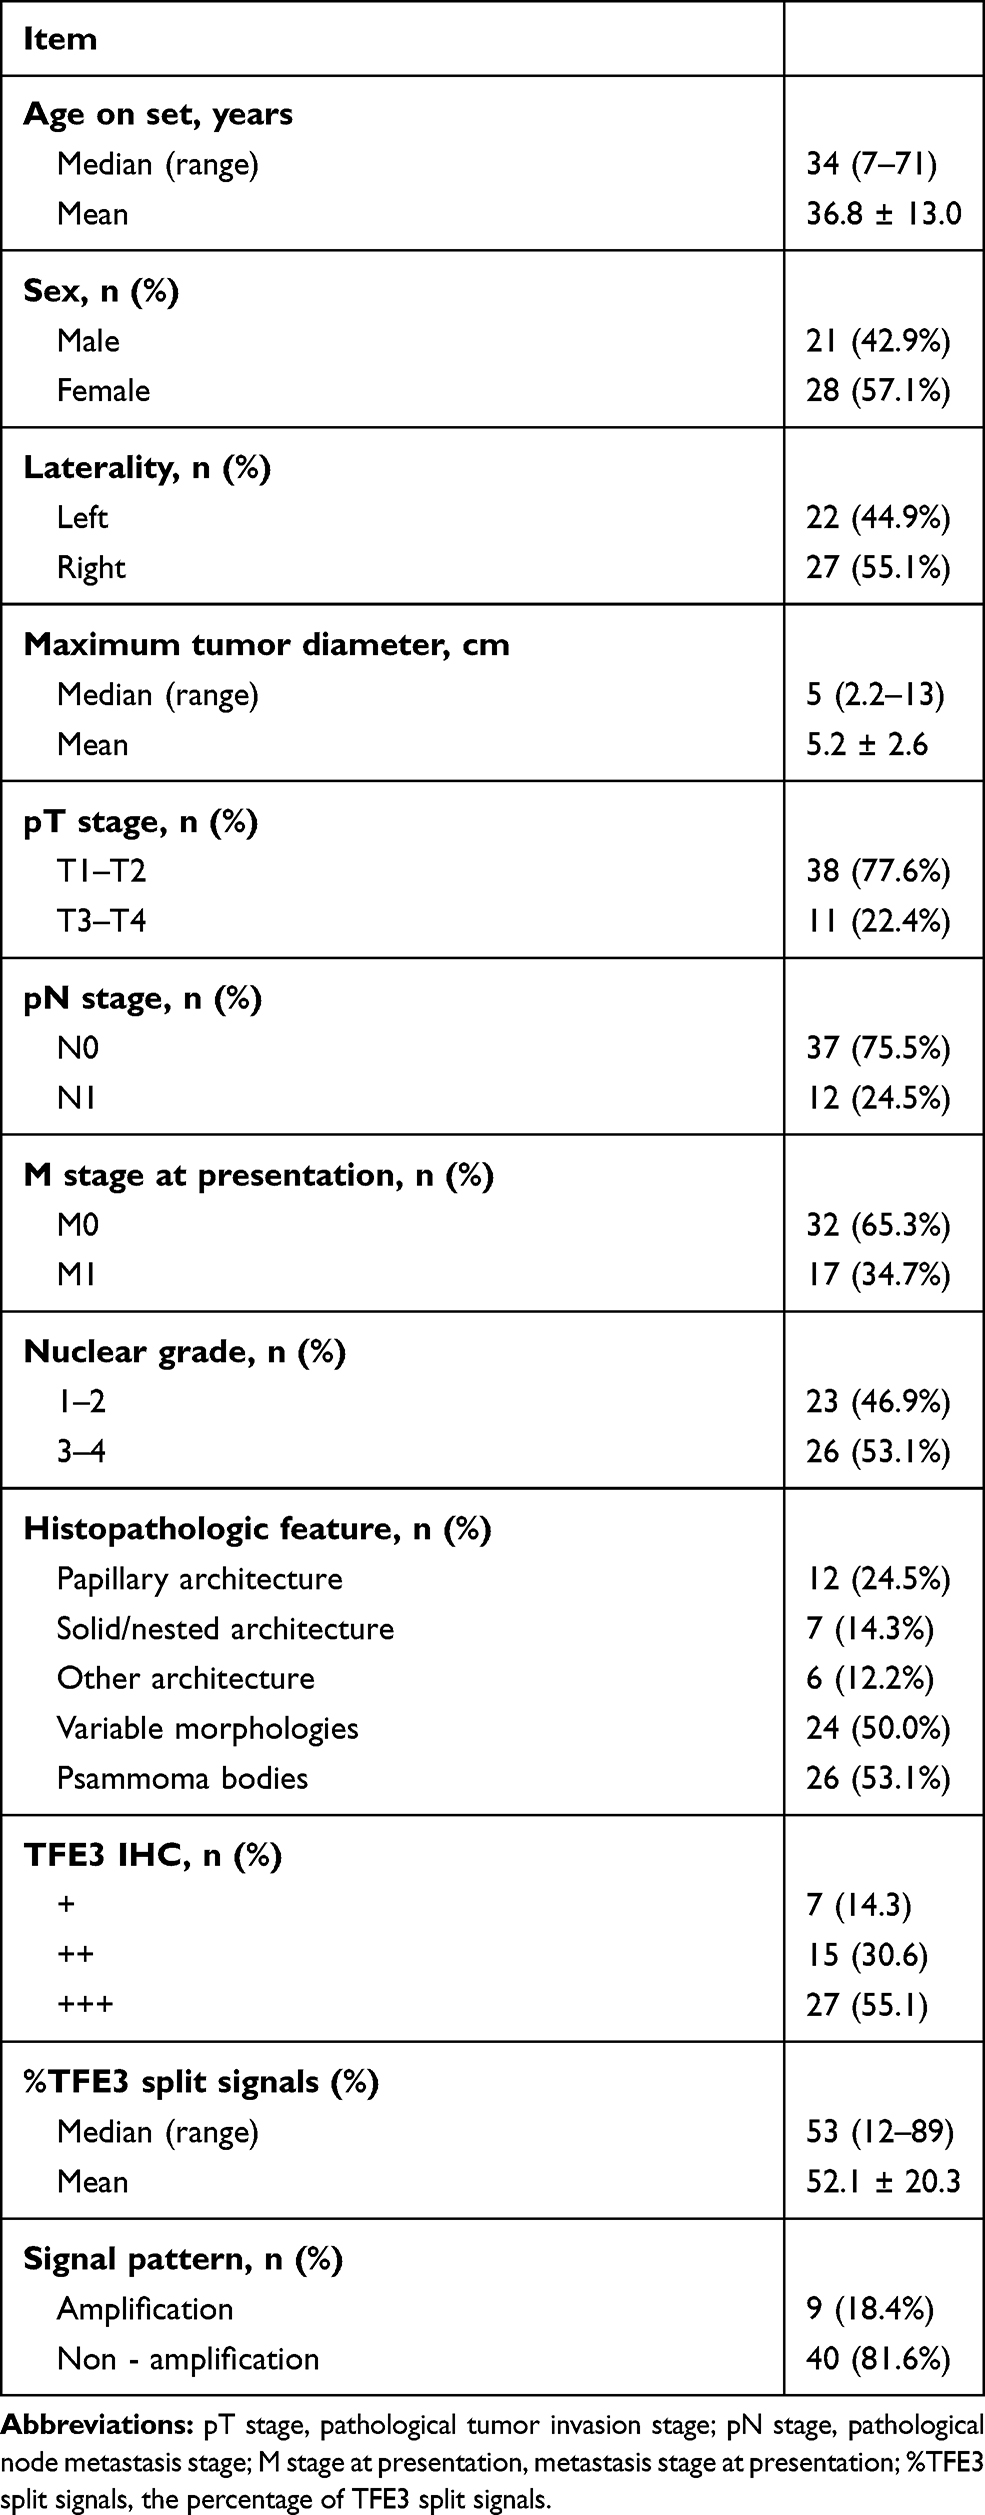 |
Table 1 Summary of Main Clinicopathologic Features of the 49 Xp11.2 tRCC Patients |
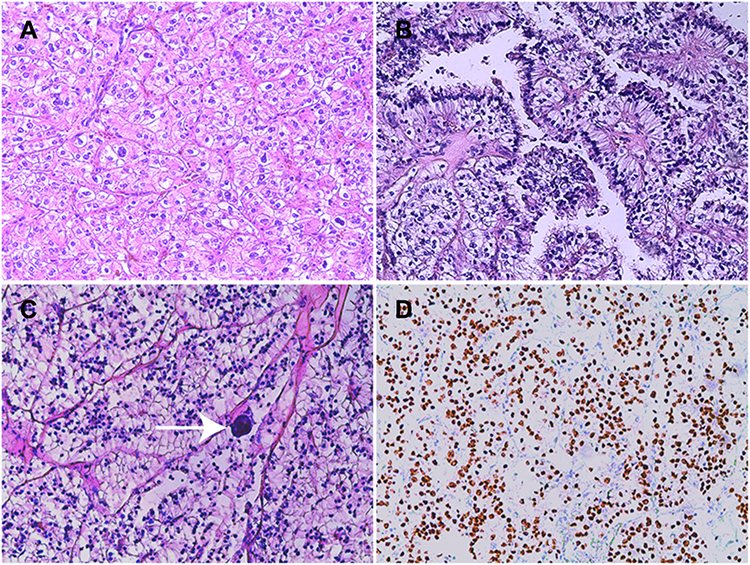 |
Figure 1 Representative images of histopathologic features in Xp11.2 tRCC. Abbreviations: H&E, hematoxylin and eosin; IHC, immunohistochemistry. Notes: (A) Solid-nested architecture, clear to eosinophilic cells with numerous cytoplasm and round nuclei, H&E. (B) Papillary architecture with voluminous clear cells, H&E. (C) Psammoma bodies (arrowhead), H&E. (D) TFE3 nuclear strong positivity. Original magnification: × 100 (A–D). |
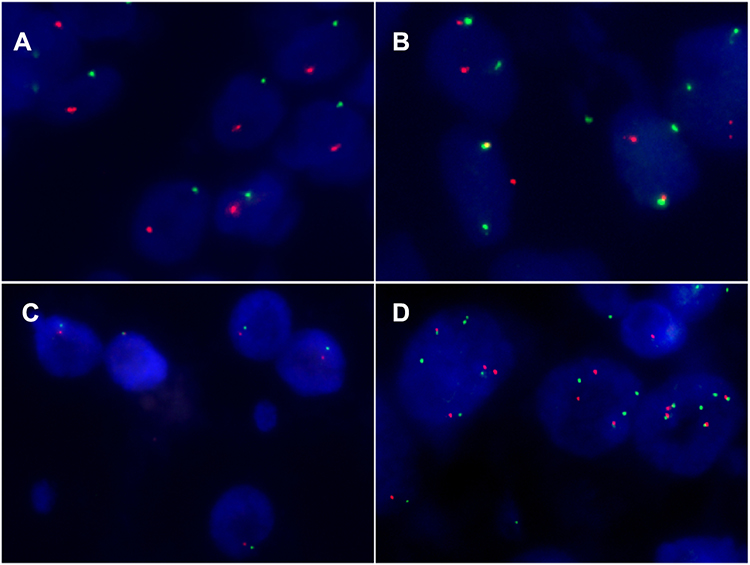 |
Figure 2 Typical signal patterns of TFE3 break-apart FISH in Xp11.2 tRCC cases. Abbreviations: R, red; G, green; F, fusion; FISH, fluorescence in situ hybridization. Notes: (A) 1R1G signals in a male case. (B) 1R1G1F signal in a female case. (C) Equivocal 1R1G signals in a male NONO-TFE3 case. (D) Amplification of TFE3 rearrangement. Original magnification: × 1000 (A–D). |
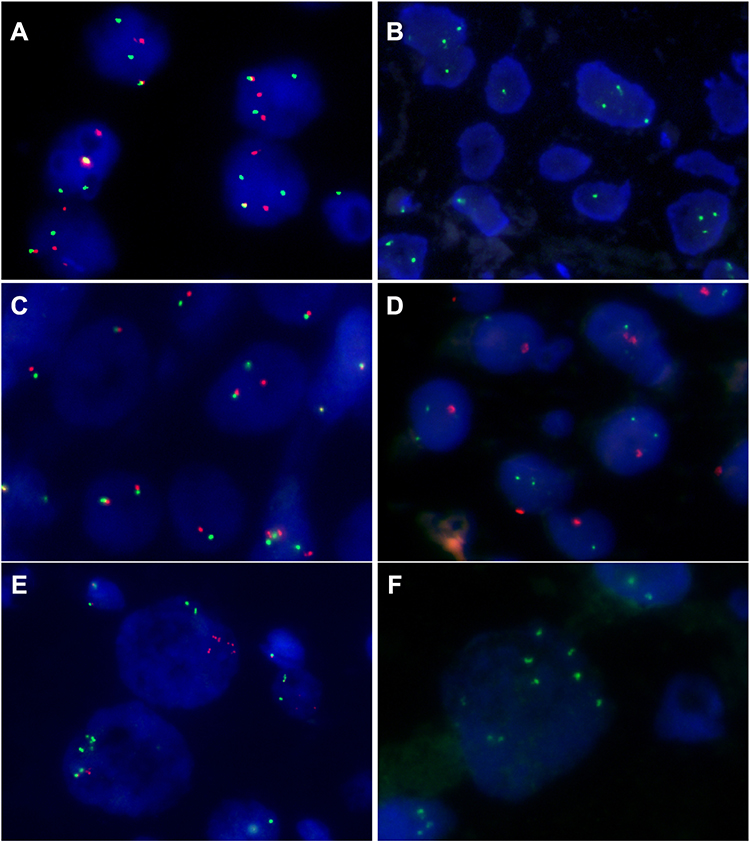 |
Figure 3 Amplification signal pattern of TFE3 break-apart FISH and XY chromosome FISH in Xp11.2 tRCC cases. Abbreviations: R, red; G, green; F, fusion; FISH, fluorescence in situ hybridization. Notes: A female case showed 2R2G1F/2G1R1F (A) and 3G (B) signals. A male case showed 1R1G/1R1G1F/2F (C) and 2G1R (D) signal. Another case showed multiple green and red signals (E) in TFE3 break-apart FISH and multiple green signals (F) in XY chromosome FISH. These results suggested the amplification of TFE3. Original magnification: × 1000 (A–F). |
Analysis of the Optimal Cut-Off Value
To determine the optimal cut-off value of %TFE3 split signal, two survival datasets (PFS and OS) were analyzed. The optimal cut-point was 74% (P < 0.001) based on PFS and 68% (P < 0.001) based on OS. Considering that the best cut-point based on PFS was still statistically different at 68% (P < 0.001), we decided to set %TFE3 split signals = 68% as the optimal cut-point. Then, the whole group was divided into high (%TFE3 split signals ≥68%, n = 13) and low (%TFE3 split signals <68%, n = 36) split signal groups for further study. The analysis of the optimal cut-off value is shown in Figure 4.
 |
Figure 4 Analysis of the optimal cut-off value for %TFE3 split signals by X-tile software. Abbreviations: PFS, progression-free survival; OS, overall survival. Notes: The optimal cut-off value for %TFE3 split signals is automatically chosen by clicking any coloration of the horizontal axis. (A) For OS, the optimal cut-off value is 68%. (C) For PFS, the optimal cut-off value is 74%. (B and D) Histogram of the low and high % split signal groups according to the optimal cut-off value of OS and PFS. The aqua bars represent the low % split signal group and gray bars represent the high % split signal group. |
Clinicopathologic Differences Between High and Low Split Signal Groups
In the high % split signal group, the range of %TFE3 split signals was 68% to 89%, and the median was 77%. In the low % split signal group, the range of %TFE3 split signals was 12–67% and the median was 44%. There was no statistical difference in age (P = 0.313), sex (P = 0.779) and laterality (P = 0.232) between high and low % split signal groups. In contrast, compared with patients in low % split signal group, patients in high % split signal group tended to have larger tumor diameter (P = 0.031) and higher pT stage (P = 0.005). There was a significant difference in pN stage (P = 0.001) at surgery and M stage at presentation (P < 0.001). No statistical difference was found in nuclear grade (P = 0.173) and signal pattern (P = 0.353). Comparisons between high and low % split signal groups are shown in Table 2.
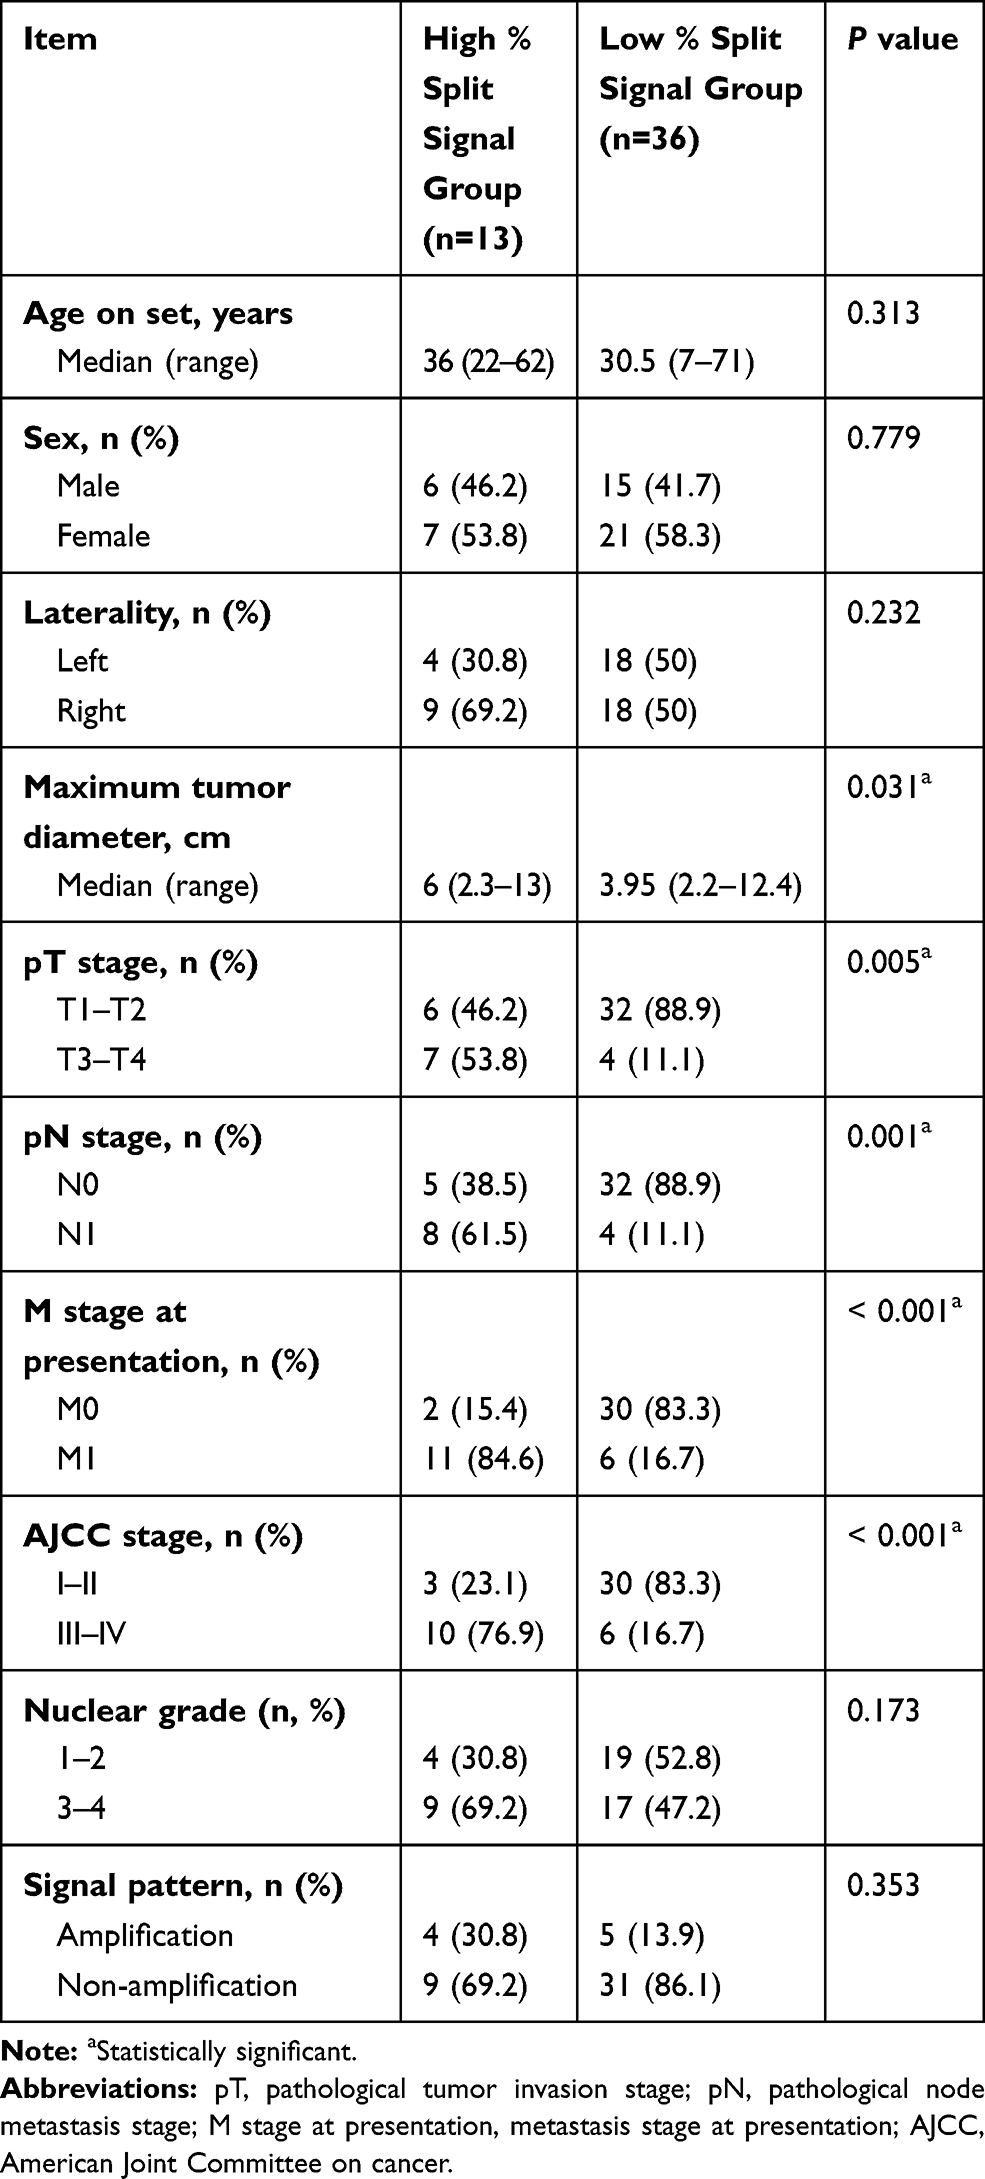 |
Table 2 Clinicopathologic Differences Between High and Low % Split Signal Groups |
Prognosis Analysis for Survival
The follow-up time of the 49 patients ranged from 5 to 161 months with a median period of 39 months. During the follow-up period, 21 (42.9%) patients were alive without evidence of disease, 17 (34.7%) patients were found disease progression and 13 (26.5%) patients died of tumor-related causes. Kaplan – Meier analysis showed that patients in high % split signal group presented with worse outcome for both PFS (median PFS: 11 months vs 40 months, P < 0.001) and OS (median OS: 30 months vs 42.5 months, P < 0.001) than patients in low % split signal group. Compared to cases with typical translocation signal pattern, cases with extra amplification signal pattern had a worse PFS (median PFS: 12 months vs 28 months, P < 0.001), but no statistical significance was observed in OS (median OS: 36.5 months vs 45 months, P = 0.168). The survival curves based on %TFE3 split signals and signal patterns are shown in Figure 5.
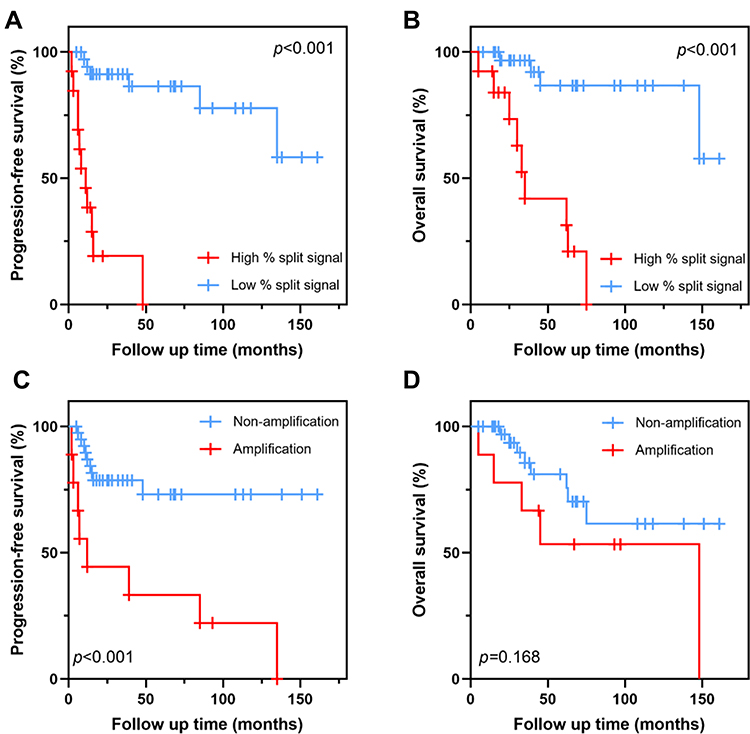 |
Figure 5 Survival curves based on %TFE3 split signals and signal pattern. Abbreviations: %TFE3 split signals, the percentage of TFE3 split signals; PFS, progression-free survival; OS, overall survival. Notes: (A) PFS analysis of high % split signal vs low % split signal. (B) OS analysis of high % split signal vs low % split signal. (C) PFS analysis of non-amplification signal pattern vs amplification signal pattern. (D) OS analysis of non-amplification signal pattern vs amplification signal pattern. |
For PFS, univariate analysis revealed that tumor diameter, pT stage, lymph node metastasis, nuclear grade, %TFE3 split signals and FISH pattern were relevant variables, but nuclear grade was excluded in the multivariable analysis and tumor diameter ≥5cm (P = 0.012), pT3-4 stage (P = 0.009), lymph node metastasis (P = 0.031), %TFE3 split signals ≥68% (P = 0.002) and amplification signal pattern (P = 0.025) were proven to be the independent predictors. For OS, age, tumor diameter, pT stage, lymph node metastasis, %TFE3 split signals were associated with survival in univariate analysis, while multivariable analysis indicated that only pT3-4 stage (P = 0.009) was the independent predictor of worse OS. The univariate analysis and multivariable analysis for PFS and OS are shown in Table 3.
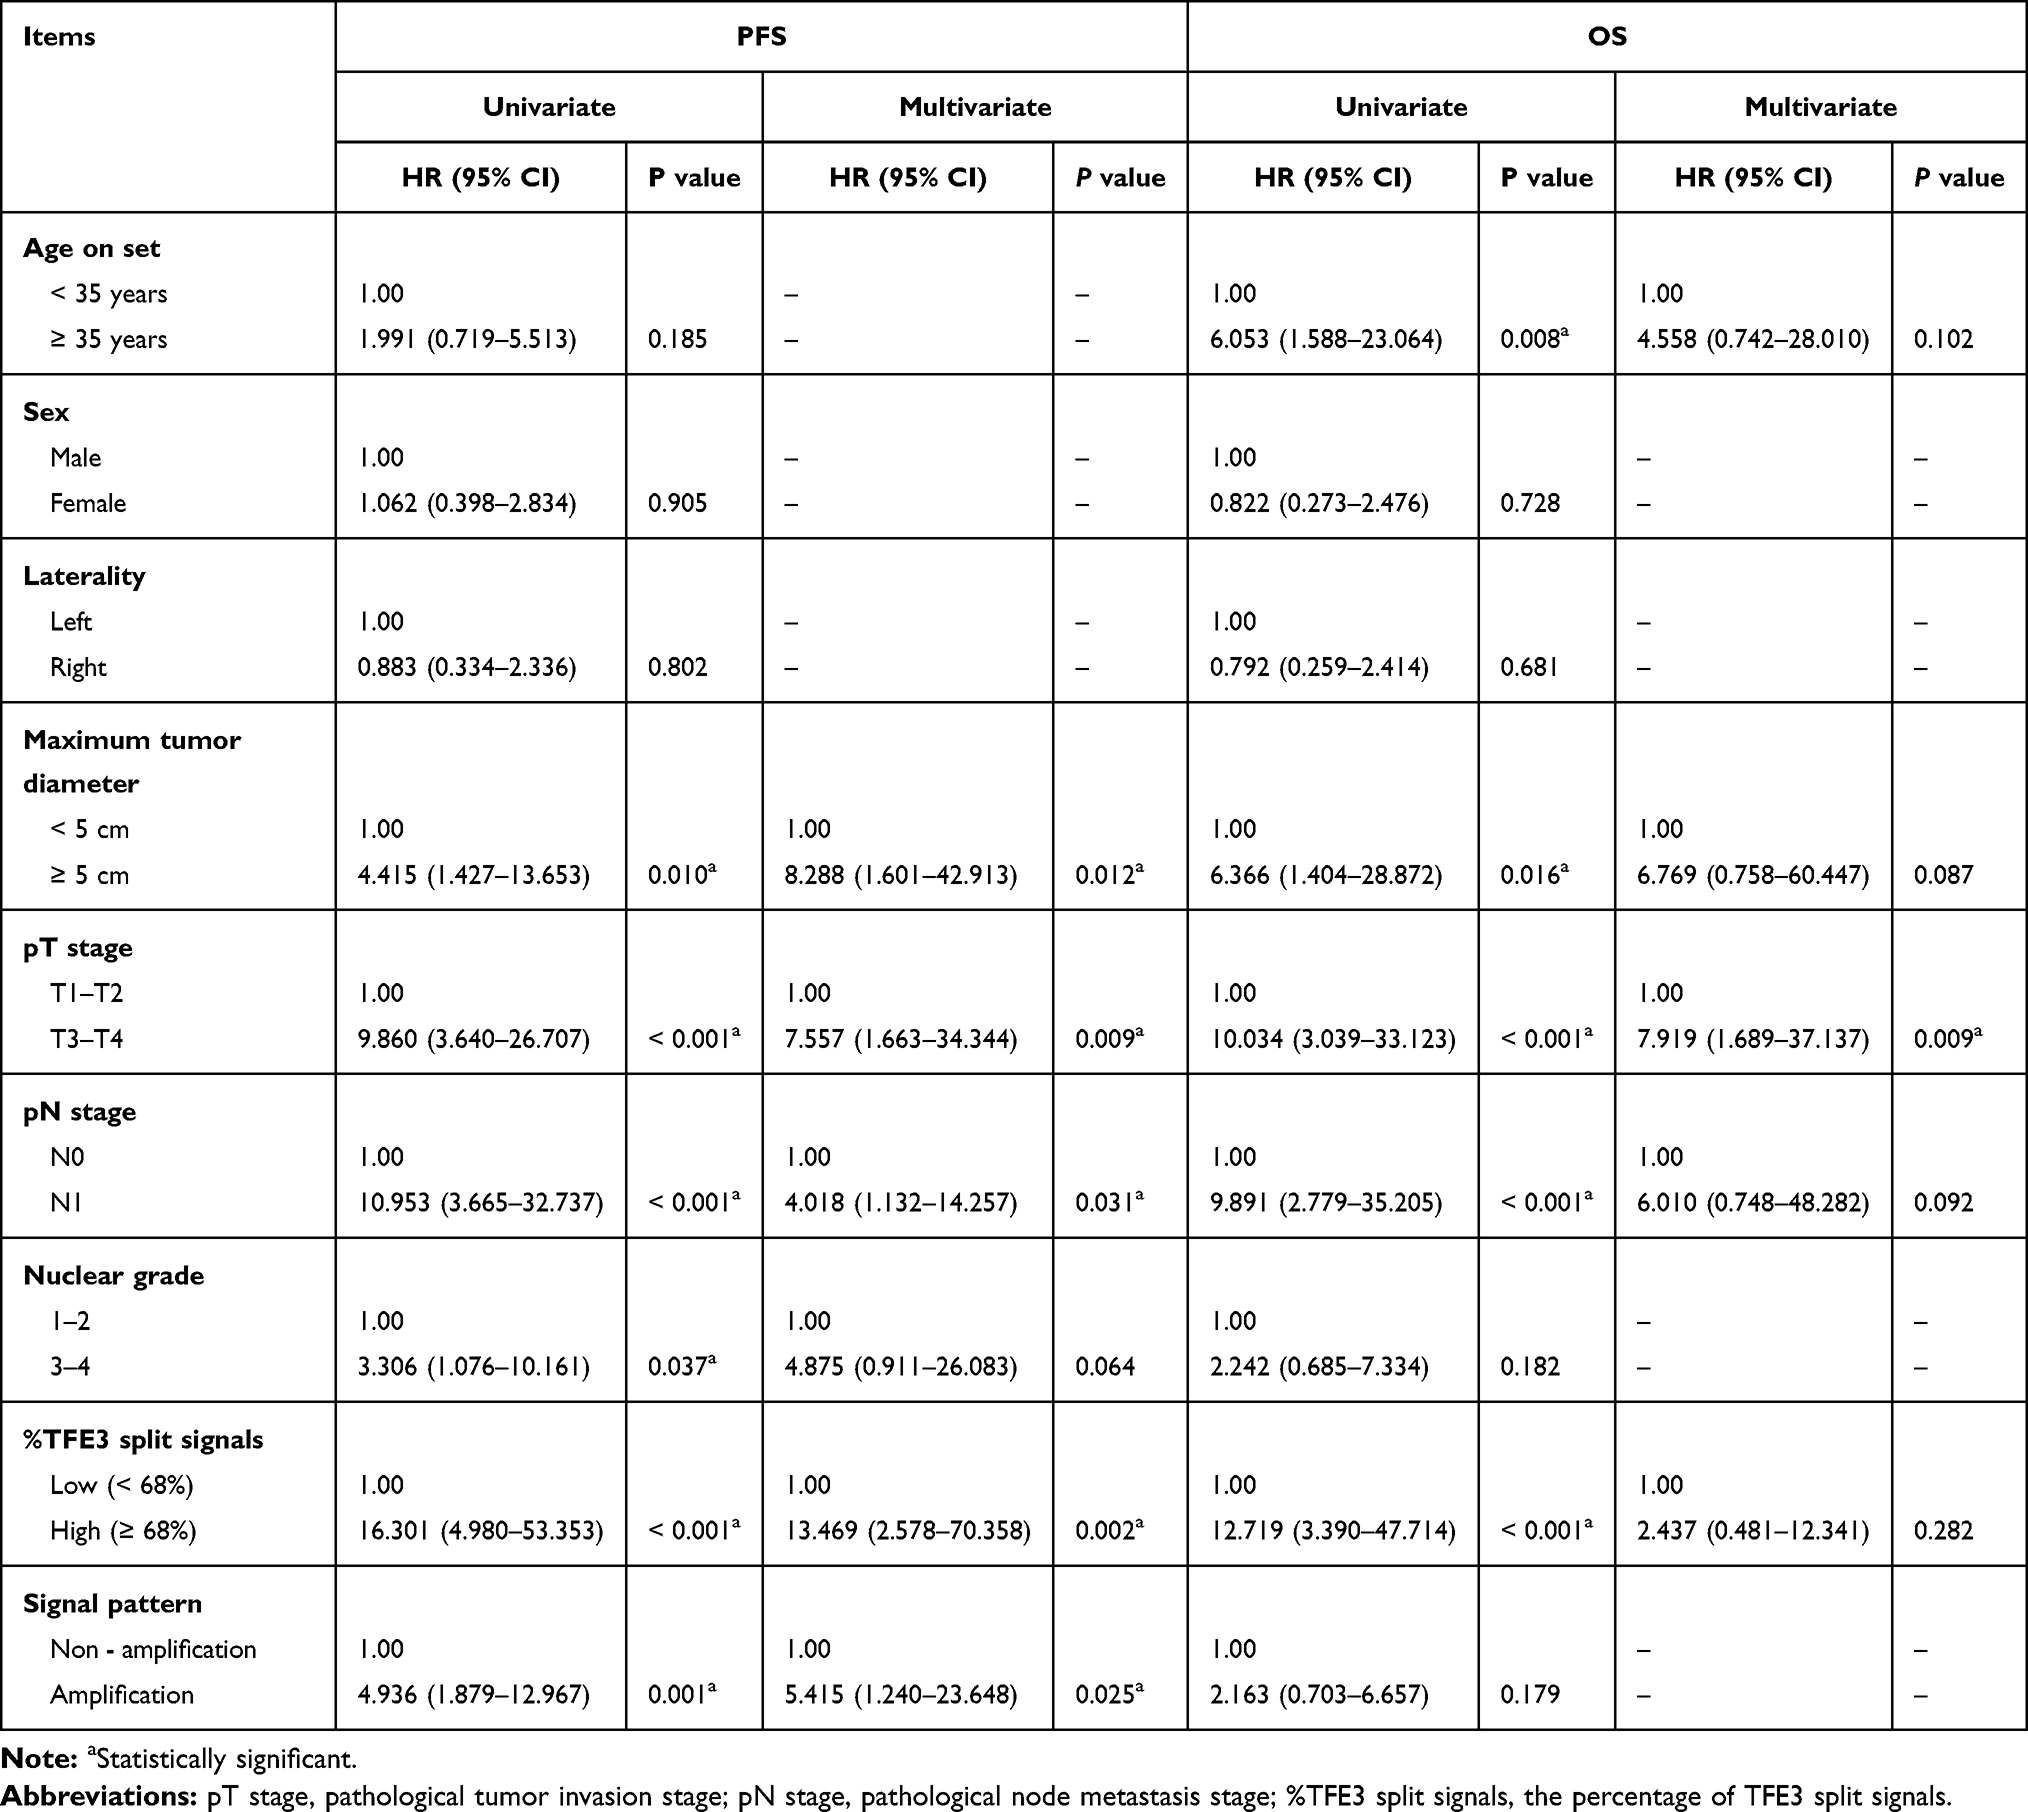 |
Table 3 Prognostic Factors of PFS and OS in Xp11.2 tRCC Patients |
Discussion
Over the past few decades, the morphologic spectrum and IHC features of Xp11.2 tRCCs have been increasingly expanded,17 which made the diagnosis based on morphology and IHC can be equivocal. Reverse transcription-polymerase chain reaction (RT-PCR) and cytogenetic karyotypic analysis are available genetic methods to verify the translocation of TFE3, however, RNA degradation and the requirement of fresh tumor tissues make it difficult to diagnose Xp11.2 tRCCs in archival FFPE tissues.25 Next-generation sequencing is a promising diagnostic method which can discover new fusion partners,17 but it has not been widely used in clinical work. In recent years, TFE3 break-apart FISH has gradually become the gold standard to verify the diagnosis of Xp11.2 tRCCs.29 However, FISH is usually used to confirm the existence of TFE3 arrangements, the split signals pattern was rarely described in clinical practice. To our best knowledge, this study is the first to investigate the clinicopathologic characteristics of Xp11.2 tRCCs with difference %TFE3 split signals and FISH pattern.
There is a grey area in the FISH result to diagnose Xp11.2 tRCC. To determine the threshold of positive cases, setting a negative group as control is the common method.22,25,27,30 It is useful in most cases while a borderline result can be confusing. Calio et al reported the coexistence of TFE3 translocation and succinate dehydrogenase B (SDHB) mutation. In their study, TFE3 translocation was verified by FISH and SDHB mutation was verified by next-generation sequencing. However, the four cases all showed low %TFE3 split signals (range: 12–19%), which lead to the controversy of the FISH result.31 In addition, sample quality and fusion type also affect FISH results. In our study, three cases initially showed negative results in one sample but positive in another, their morphology and IHC features are consistent with Xp11.2 tRCC. This contradictory result was also reported by Green et al, interference of normal stromal cells and poor probe penetration are two possible reasons.22 Cases harboring NONO-TFE3 fusion in our cohort were likely to show relatively low %TFE3 split signals (range: 12–53%), which may be attributed to the subtle split signals resulting from pericentric inversion.10 Notably, as the morphological and genetic characteristics of Xp11.2 tRCC become abundant, more accurate diagnostic methods should be adopted, especially for those undetermined cases.
In our previous study, we have demonstrated that conventional nuclear grading systems (Fuhrman and WHO/ISUP grading system) were not suitable to evaluate the prognosis of Xp11.2 tRCC.37 Considering that Xp11.2 tRCC was defined on a genetic basis rather than morphological feature, prognostic indicators based on genetics needs further exploration. Hence, we attempt to utilize %TFE3 split signals to assess the prognosis and compare the difference between high split signal group and low split signal group. As it is generally considered that TFE3 rearrangement is the key driver event in tumorigenesis,38 we believe that %TFE3 split signals in FISH can represent the biological behavior of tumors to some extent. In our cohort, after the population was divided into two groups at 68%, there were significant differences in maximum tumor diameter, pT stage, lymph node metastasis, distant metastasis and AJCC stage between the two groups, and the PFS and OS of the high % split signal group decreased significantly, suggesting the potential of this index as a prognostic factor.
In addition to the mechanism of TFE3 translocation, TFE3 amplification is not uncommon in Xp11.2 tRCC,22,25,39 which can be reflected as an atypical split signal in FISH. In our study, nine cases present with unusual FISH pattern using TFE3 break-apart probe, which was confirmed by XY chromosome probe. Among these cases, four female cases showed additional green, red or fused signal (2R2G1F/2R1G1F/1R1G2F), two male cases showed additional green or fused signal (1R2G/1R1G1F) and three cases showed multiple signals. Our survival analysis revealed that these cases with amplification signals tend to have a worse PFS although there was no significant difference in OS. A reasonable explanation for this result is that some patients have short follow-up. Another interpretation is that even if there is a lymph node metastasis, young patients are likely to have a better prognosis.40 Macher-Goeppinger et al reported eight cases with TFE3 overexpression caused by amplification, and these cases had worse cancer-specific survival than those caused by TFE3 translocation.39 Pan et al detected four cases with high gene copy number alterations (CNAs) by array comparative genomic hybridization (aCGH), and high-CNA group may have more aggressive behavior than low-CNA group.41 Therefore, we speculated that among these cases with TEF3 overexpression, TFE3 translocation is not the only driving mechanism leading to worse prognosis, which is also likely to be the result of chromosome amplification.
There are many potential factors that can be used to predict the prognosis of Xp11.2 tRCC. Older age and distant metastasis have been proven to be two independent adverse prognosis predictors6,42 whereas they are applicable to many tumors and not specific to Xp11.2 tRCC. Interestingly, although lymph node metastasis at an early stage was often observed in pediatric cases, Xp11.2 tRCCs in these patients showed an indolent clinical course. In contrast, adult patients tend to have a more aggressive process.43 Molecular markers such as ASPL-TFE3 fusion42 and microRNA‐204‐5p44 have not been demonstrated to have a prognostic value. In our Cox proportional hazards model, apart from conventional indicators like larger tumor size, pT stage and lymph node metastasis, %TFE3 split signals and amplification signal pattern can also indicate worse PFS. To our disappointment, only advanced pT stage indicated shorter OS in multivariable analysis.
Our study has some certain limitations. Firstly, because of the rarity of Xp11.2 tRCC, selection bias may be present due to the retrospective design and the small sample size. Secondly, insufficient follow-up period in some patients can affect the observation of the endpoint, further research with longer follow-up periods to assess the survival time. Thirdly, the determination of cut-off value may not be universal in different laboratories due to the difference in experimental conditions. Despite these limitations, a detailed description of TFE3 split signal pattern may provide available prognostic information of Xp11.2 tRCC.
Conclusions
In conclusion, this study demonstrated that high percentage of TFE3 split signals and amplification FISH pattern are two potential indicators of poor prognosis, especially for PFS. Complex split signals in FISH may indicate chromosome aberrations other than TFE3 translocation, which needs to be verified in future studies. It is necessary to note the main signal patterns and their percentage in the report for clinical practice.
Abbreviations
Xp11.2 tRCC, Xp11.2 translocation renal cell carcinoma; TFE3, transcription factor E3; WHO, World Health Organization; MiT, microphthalmia; IHC, immunohistochemistry; FISH, fluorescence in situ hybridization; %TFE3 split signals, the percentage of TFE3 split signals; AJCC, American Joint Committee on Cancer, ISUP, International Society of Urological Pathology; OS, overall survival; PFS, progression-free survival; SSC, sodium saline citrate; DAPI, 4,6-diamidino-2-phenylindole; SDHB, succinate dehydrogenase B; CNAs, copy number alterations; aCGH, array comparative genomic hybridization.
Data Sharing Statement
The dataset analyzed during the current study is not publicly available but is available from the corresponding author on reasonable request.
Ethics Approval and Consent to Participate
This study was approved by the Ethics Committee of Nanjing Drum Tower Hospital and was performed in accordance with the standards of the Declaration of Helsinki. Written informed consent was not required because this was a retrospective study and all data were anonymized.
Acknowledgments
The authors thank Xiaogong Li, Gutian Zhang (Department of Urology, Nanjing Drum Tower Hospital) for providing patient information. We also thank Jun Yang and Ming Chen (Department of Pathology, Nanjing Drum Tower Hospital) for providing technical assistance.
Author Contributions
All authors made substantial contributions to conception and design, acquisition of data, or analysis and interpretation of data; took part in drafting the article or revising it critically for important intellectual content; agreed on the journal to which the article will be submitted; gave final approval of the version to be published; and agree to be accountable for all aspects of the work.
Funding
This research was supported by Nanjing SCI-TECH Development Project (201803025), State Key Laboratory of Analytical Chemistry for Life Science (5431ZZXM2004) and Beijing Ronghe Medical Development Foundation. The funders had no role in study design, data collection and analysis, decision to publish, or preparation of the manuscript.
Disclosure
The authors declare that they have no conflict of interest in this work.
References
1. Argani P, Antonescu C, Illei P, et al. Primary renal neoplasms with the ASPL-TFE3 gene fusion of alveolar soft part sarcoma: a distinctive tumor entity previously included among renal cell carcinomas of children and adolescents. Am J Pathol. 2001;159(1):179–192. doi:10.1016/S0002-9440(10)61684-7
2. Lopez-Beltran A, Scarpelli M, Montironi R, Kirkali Z. 2004 WHO classification of the renal tumors of the adults. Eur Urol. 2006;49(5):798–805. doi:10.1016/j.eururo.2005.11.035
3. Moch H, Cubilla AL, Humphrey PA, Reuter VE, Ulbright TM. The 2016 WHO classification of tumours of the urinary system and male genital organs-Part A: renal, penile, and testicular tumours. Eur Urol. 2016;70(1):93–105. doi:10.1016/j.eururo.2016.02.029
4. Geller JI, Ehrlich PF, Cost NG, et al. Characterization of adolescent and pediatric renal cell carcinoma: a report from the Children’s Oncology Group study AREN03B2. Cancer. 2015;121(14):2457–2464. doi:10.1002/cncr.29368
5. Komai Y, Fujiwara M, Fujii Y, et al. Adult Xp11 translocation renal cell carcinoma diagnosed by cytogenetics and immunohistochemistry. Clin Cancer Res. 2009;15(4):1170–1176. doi:10.1158/1078-0432.CCR-08-1183
6. Sukov WR, Hodge JC, Lohse CM, et al. TFE3 rearrangements in adult renal cell carcinoma: clinical and pathologic features with outcome in a large series of consecutively treated patients. Am J Surg Pathol. 2012;36(5):663. doi:10.1097/PAS.0b013e31824dd972
7. Argani P, Antonescu C, Couturier J, et al. PRCC-TFE3 renal carcinomas: morphologic, immunohistochemical, ultrastructural, and molecular analysis of an entity associated with the t(X;1)(p11.2;q21). Am J Surg Pathol. 2002;26(12):1553–1566. doi:10.1097/00000478-200212000-00003
8. Clark J, Lu Y, Sidhar S, et al. Fusion of splicing factor genes PSF and NonO (p54nrb) to the TFE3 gene in papillary renal cell carcinoma. Oncogene. 1997;15(18):2233–2239. doi:10.1038/sj.onc.1201394
9. Argani P, Lal P, Hutchinson B, Lui MY, Reuter VE, Ladanyi M. Aberrant nuclear immunoreactivity for TFE3 in neoplasms with TFE3 gene fusions: a sensitive and specific immunohistochemical assay. Am J Surg Pathol. 2003;27(6):750–761. doi:10.1097/00000478-200306000-00005
10. Xia Q-Y, Wang Z, Chen N, et al. Xp11.2 translocation renal cell carcinoma with NONO-TFE3 gene fusion: morphology, prognosis, and potential pitfall in detecting TFE3 gene rearrangement. Mod Pathol. 2017;30(3):416–426. doi:10.1038/modpathol.2016.204
11. Argani P, Zhang L, Reuter VE, et al. RBM10-TFE3 renal cell carcinoma: a potential diagnostic pitfall due to cryptic intrachromosomal Xp11.2 inversion resulting in false-negative TFE3 FISH. Am J Surg Pathol. 2017;41(5):655.
12. Malouf GG, Su X, Yao H, et al. Next-generation sequencing of translocation renal cell carcinoma reveals novel RNA splicing partners and frequent mutations of chromatin-remodeling genes. Clin Cancer Res. 2014;20(15):4129–4140. doi:10.1158/1078-0432.CCR-13-3036
13. Huang W, Goldfischer M, Babayeva S, et al. Identification of a novelPARP14-TFE3gene fusion from 10-year-old FFPE tissue by RNA-seq. Genes Chromosomes Cancer. 2015;54(8):500–505. doi:10.1002/gcc.22261
14. Argani P, Zhong M, Reuter VE, et al. TFE3-fusion variant analysis defines specific clinicopathologic associations among Xp11 translocation cancers. Am J Surg Pathol. 2016;40(6):723–737. doi:10.1097/PAS.0000000000000631
15. Antic T, Taxy J, Alikhan M, Segal J. Melanotic translocation renal cell carcinoma with a novel ARID1B-TFE3 gene fusion. Am J Surg Pathol. 2017;41(11):1576–1580. doi:10.1097/PAS.0000000000000927
16. Classe M, Malouf GG, Su X, et al. Incidence, clinicopathological features and fusion transcript landscape of translocation renal cell carcinomas. Histopathology. 2017;70(7):1089–1097. doi:10.1111/his.13167
17. Wang XT, Xia QY, Ye SB, et al. RNA sequencing of Xp11 translocation-associated cancers reveals novel gene fusions and distinctive clinicopathologic correlations. Mod Pathol. 2018;31(9):1346–1360. doi:10.1038/s41379-018-0051-5
18. Pei J, Cooper H, Flieder DB, et al. NEAT1-TFE3 and KAT6A-TFE3 renal cell carcinomas, new members of MiT family translocation renal cell carcinoma. Mod Pathol. 2019;32(5):710–716. doi:10.1038/s41379-018-0191-7
19. Fukuda H, Kato I, Furuya M, et al. A novel partner of TFE3 in the Xp11 translocation renal cell carcinoma: clinicopathological analyses and detection of EWSR1-TFE3 fusion. Virchows Arch. 2019;474(3):389–393. doi:10.1007/s00428-018-2509-8
20. Gandhi J, Malik F, Amin M, Argani P, Bahrami A. MiT family translocation renal cell carcinomas: a 15th anniversary update. Histol Histopathol. 2020;35(2):125–136. doi:10.14670/HH-18-159
21. Rao Q, Williamson SR, Zhang S, Eble JN, Grignon DJ. TFE3 break-apart FISH has a higher sensitivity for Xp11.2 translocation–associated renal cell carcinoma compared with TFE3 or Cathepsin K immunohistochemical staining alone. Am J Surg Pathol. 2013;37(6):6. doi:10.1097/PAS.0b013e31827e17cb
22. Green W, Yonescu R, Morsberger L, et al. Utilization of a TFE3 break-apart FISH assay in a renal tumor consultation service. Am J Surg Pathol. 2013;37(8):1150–1163. doi:10.1097/PAS.0b013e31828a69ae
23. Kato I, Furuya M, Baba M, et al. RBM10-TFE3 renal cell carcinoma characterised by paracentric inversion with consistent closely split signals in break-apart fluorescence in-situ hybridisation: study of 10 cases and a literature review. Histopathology. 2019;75(2):254–265. doi:10.1111/his.13866
24. Pradhan D, Roy S, Quiroga-Garza G, et al. Validation and utilization of a TFE3 break-apart FISH assay for Xp11.2 translocation renal cell carcinoma and alveolar soft part sarcoma. Diagn Pathol. 2015;10(1):179. doi:10.1186/s13000-015-0412-z
25. Hodge JC, Pearce KE, Wang X, Wiktor AE, Oliveira AM, Greipp PT. Molecular cytogenetic analysis for TFE3 rearrangement in Xp11.2 renal cell carcinoma and alveolar soft part sarcoma: validation and clinical experience with 75 cases. Mod Pathol. 2014;27(1):113–127. doi:10.1038/modpathol.2013.83
26. Zhong M, De Angelo P, Osborne L, et al. Dual-color, break-apart FISH assay on paraffin-embedded tissues as an adjunct to diagnosis of Xp11 translocation renal cell carcinoma and alveolar soft part sarcoma. Am J Surg Pathol. 2010;34(6):757. doi:10.1097/PAS.0b013e3181dd577e
27. Kim SH, Choi Y, Jeong HY, Lee K, Chae JY, Moon KC. Usefulness of a break-apart FISH assay in the diagnosis of Xp11.2 translocation renal cell carcinoma. Virchows Arch. 2011;459(3):299–306. doi:10.1007/s00428-011-1127-5
28. Chen X, Yang Y, Gan W, Xu L, Ye Q, Guo H. Newly designed break-apart and ASPL-TFE3 dual-fusion FISH assay are useful in diagnosing Xp11.2 translocation renal cell carcinoma and ASPL-TFE3 renal cell carcinoma: a STARD-compliant article. Medicine (Baltimore). 2015;94(19):e873. doi:10.1097/MD.0000000000000873
29. Yang B, Duan H, Cao W, et al. Xp11 translocation renal cell carcinoma and clear cell renal cell carcinoma with TFE3 strong positive immunostaining: morphology, immunohistochemistry, and FISH analysis. Mod Pathol. 2019;32(10):1521–1535. doi:10.1038/s41379-019-0283-z
30. Calio A, Grignon DJ, Stohr BA, Williamson SR, Eble JN, Cheng L. Renal cell carcinoma with TFE3 translocation and succinate dehydrogenase B mutation. Mod Pathol. 2017;30(3):407–415. doi:10.1038/modpathol.2016.200
31. Chou A, Hes O, Turchini J, Trpkov K, Gill AJ. Do significant TFE3 gene rearrangements occur in succinate dehydrogenase-deficient renal cell carcinoma? Borderline FISH results should be interpreted with caution. Mod Pathol. 2017;30(10):1507–1508. doi:10.1038/modpathol.2017.77
32. Williamson SR, Grignon DJ, Calio A, Stohr BA, Eble JN, Cheng L. Do significant TFE3 gene rearrangements occur in succinate dehydrogenase deficient renal cell carcinoma? Borderline FISH results should be interpreted with caution. Mod Pathol. 2017;30(10):1509–1511. doi:10.1038/modpathol.2017.84
33. Xiong L, Chen X, Liu N, et al. PRCC-TFE3 dual-fusion FISH assay: a new method for identifying PRCC-TFE3 renal cell carcinoma in paraffin-embedded tissue. PLoS One. 2017;12(9):e0185337. doi:10.1371/journal.pone.0185337
34. Rao Q, Liu B, Cheng L, et al. Renal cell carcinomas with t(6;11)(p21;q12): a clinicopathologic study emphasizing unusual morphology, novel alpha-TFEB gene fusion point, immunobiomarkers, and ultrastructural features, as well as detection of the gene fusion by fluorescence in situ hybridization. Am J Surg Pathol. 2012;36(9):1327–1338. doi:10.1097/PAS.0b013e31825aafb5
35. Mosquera JM, Cin PD, Mertz KD, et al. Validation of a TFE3 break-apart FISH assay for Xp11.2 translocation renal cell carcinomas. Diagn Mol Pathol. 2011;20(3):129–137. doi:10.1097/PDM.0b013e31820e9c67
36. Camp R, Dolled-Filhart M, Rimm D. X-tile: a new bio-informatics tool for biomarker assessment and outcome-based cut-point optimization. Clin Cancer Res. 2004;10(21):7252–7259. doi:10.1158/1078-0432.CCR-04-0713
37. Liu N, Gan W, Qu F, et al. Does the Fuhrman or World Health Organization/International Society of Urological Pathology Grading System apply to the Xp11.2 translocation renal cell carcinoma?: a 10-year single-center study. Am J Pathol. 2018;188(4):929–936. doi:10.1016/j.ajpath.2017.12.018
38. Calio A, Segala D, Munari E, Brunelli M, Martignoni G. MiT family translocation renal cell carcinoma: from the early descriptions to the current knowledge. Cancers (Basel). 2019;11(8):1110. doi:10.3390/cancers11081110
39. Macher-Goeppinger S, Roth W, Wagener N, et al. Molecular heterogeneity of TFE3 activation in renal cell carcinomas. Mod Pathol. 2012;25(2):308–315. doi:10.1038/modpathol.2011.169
40. Ma W, Liu N, Zhuang W, et al. Comparative clinicopathologic characteristics and outcomes of paediatric and adult Xp11 translocation renal cell carcinomas: a retrospective multicentre study in China. Sci Rep. 2020;10(1):2249. doi:10.1038/s41598-020-59162-5
41. Pan C, Sung M, Huang H, Yeh K. High chromosomal copy number alterations in Xp11 translocation renal cell carcinomas detected by array comparative genomic hybridization are associated with aggressive behavior. Am J Surg Pathol. 2013;37(7):1116–1119. doi:10.1097/PAS.0b013e318293d872
42. Ellis CL, Eble JN, Subhawong AP, et al. Clinical heterogeneity of Xp11 translocation renal cell carcinoma: impact of fusion subtype, age, and stage. Mod Pathol. 2014;27(6):875–886. doi:10.1038/modpathol.2013.208
43. Argani P, Olgac S, Tickoo S, et al. Xp11 translocation renal cell carcinoma in adults: expanded clinical, pathologic, and genetic spectrum. Am J Surg Pathol. 2007;31(8):1149–1160. doi:10.1097/PAS.0b013e318031ffff
44. Kurahashi R, Kadomatsu T, Baba M, et al. MicroRNA-204-5p: a novel candidate urinary biomarker of Xp11.2 translocation renal cell carcinoma. Cancer Sci. 2019;110(6):1897–1908. doi:10.1111/cas.14026
 © 2021 The Author(s). This work is published and licensed by Dove Medical Press Limited. The full terms of this license are available at https://www.dovepress.com/terms.php and incorporate the Creative Commons Attribution - Non Commercial (unported, v3.0) License.
By accessing the work you hereby accept the Terms. Non-commercial uses of the work are permitted without any further permission from Dove Medical Press Limited, provided the work is properly attributed. For permission for commercial use of this work, please see paragraphs 4.2 and 5 of our Terms.
© 2021 The Author(s). This work is published and licensed by Dove Medical Press Limited. The full terms of this license are available at https://www.dovepress.com/terms.php and incorporate the Creative Commons Attribution - Non Commercial (unported, v3.0) License.
By accessing the work you hereby accept the Terms. Non-commercial uses of the work are permitted without any further permission from Dove Medical Press Limited, provided the work is properly attributed. For permission for commercial use of this work, please see paragraphs 4.2 and 5 of our Terms.