")
Back to Journals » Cancer Management and Research » Volume 10
Molecular characterization of papillary thyroid carcinoma: a potential three-lncRNA prognostic signature
Authors You X, Yang S, Sui J , Wu W, Liu T , Xu S, Cheng Y, Kong X, Liang G, Yao Y
Received 22 May 2018
Accepted for publication 16 July 2018
Published 8 October 2018 Volume 2018:10 Pages 4297—4310
DOI https://doi.org/10.2147/CMAR.S174874
Checked for plagiarism Yes
Review by Single anonymous peer review
Peer reviewer comments 3
Editor who approved publication: Professor Raphael Catane
Xin You,1,2,* Sheng Yang,3,* Jing Sui,3 Wenjuan Wu,3 Tong Liu,3 Siyi Xu,3 Yanping Cheng,3 Xiaoling Kong,3 Geyu Liang,3 Yongzhong Yao1,2
1Department of General Surgery, Nanjing Drum Tower Hospital, The Affiliated Hospital of Nanjing University Medical School, Nanjing, Jiangsu, People’s Republic of China; 2Department of General Surgery, School of Medicine, Southeast University, Nanjing, Jiangsu, People’s Republic of China; 3Key Laboratory of Environmental Medicine Engineering, Ministry of Education, School of Public Health, Southeast University, Nanjing, Jiangsu, People’s Republic of China
*These authors contributed equally to this work
Purpose: Papillary thyroid carcinoma (PTC), the most frequent type of malignant thyroid tumor, lacks novel and reliable biomarkers of patients’ prognosis. In the current study, we mined The Cancer Genome Atlas (TCGA) to develop lncRNA signature of PTC.
Patients and methods: The intersection of PTC lncRNAs was obtained from the TCGA database using integrative computational method. By the univariate and multivariate Cox analysis, key lncRNAs were identified to construct the prognostic model. Then, all patients were divided into the high-risk group and low-risk group to perform the Kaplan–Meier (K–M) survival curves and time-dependent receiver operating characteristic (ROC) curve, estimating the prognostic power of the prognostic model. Functional enrichment analysis was also performed. Finally, we verified the results of the TCGA analysis by the Gene Expression Omnibus (GEO) databases and quantitative real-time PCR (qRT-PCR).
Results: After the comprehensive analysis, a three-lncRNA signature (PRSS3P2, KRTAP5-AS1 and PWAR5) was obtained. Interestingly, patients with low-risk scores tended to gain obviously longer survival time, and the area under the time-dependent ROC curve was 0.739. Furthermore, gene ontology (GO) and pathway analysis revealed the tumorigenic and prognostic function of the three lncRNAs. We also found three potential transcription factors to help understand the mechanisms of the PTC-specific lncRNAs. Finally, the GEO databases and qRT-PCR validation were consistent with our TCGA bioinformatics results.
Conclusion: We built a three-lncRNA signature by mining the TCGA database, which could effectively predict the prognosis of PTC.
Keywords: The Cancer Genome Atlas, long noncoding RNAs, overall survival, risk score
Introduction
Thyroid cancer (TC) is the most common malignant tumor of the thyroid, accounting for about 3%–4% of newly diagnosed tumors annually.1 TC includes four pathological types: papillary thyroid carcinoma (PTC), follicular thyroid carcinoma, anaplastic thyroid carcinoma and medullary thyroid carcinoma.2 PTC represents about 80% of TC with low malignancy and better prognosis,3,4 and its incidence is increasing year by year.5 PTC develops slowly and can be cured by surgery, thyroid hormone therapy and 131I isotope therapy.6 Most PTC patients have good prognosis with the 10-year survival rate reaching 90%.7,8 Because of the serious potential side effects of radioactive iodine and patients’ neglect of the PTC prognosis, some PTC patients suffer from recurrence and some PTCs may develop distant metastases with high mortality. Therefore, to improve the long-term survival time, prevent PTC deterioration and reduce the recurrence incidence, the novel and reliable biomarkers are important for proper treatment and the prognosis of PTC patients.
Long noncoding RNAs (lncRNAs) are conservative with more than 200 nucleotides in length, having no significant protein-coding capacity.9 Nowadays, lncRNAs have become a hot topic in genetic research and plays an important role in many life activities, such as the dosage compensation effect, epigenetic regulation, cell cycle regulation and cell differentiation regulation. Moreover, increasing evidence indicates that lncRNAs play a potential role as novel biomarkers for prognostic prediction in various cancers.10,11 It was found that a number of lncRNAs were correlated with the prognosis of PTC. Liao et al12 reported that BANCR could inhibit tumorigenesis in PTC by performing quantitative real-time PCR (qRT-PCR), cell function and tumor xenograft in nude mice, suggesting that BANCR may serve as a novel prognostic marker. Lan et al13 screened the genome-wide PTC to understand the expression profile and potential functions of lncRNAs. Liyanarachchi et al14 observed the two lncRNAs associated with lymph node metastasis and BRAF mutation in PTC using The Cancer Genome Atlas (TCGA). Another study performed by Zhao et al15 described a PTC competing endogenous RNA (ceRNA) network and found three survival-related lncRNAs in TCGA. Thus, the TCGA dataset provides a possibility for us to find prognostic biomarkers in PTC.
In the current study, the expression of lncRNAs and related information were obtained from the TCGA database. Then, we built an lncRNA signature for predicting the PTC patients’ survival time to provide a potential biomarker of PTC patients’ prognosis.
Patients and methods
TCGA dataset and sample information
Up to October 23, 2017, 503 PTC cases and 59 normal thyroid cases were obtained from the TCGA database. Inclusion criteria were as follows: 1) patients who had a pathological diagnosis of PTC and 2) patients whose expression of genes and clinical feature were available. Exclusive criteria were as follows: 1) patients who suffered from other cancers except PTC and 2) patients who did not die of PTC. Overall, this study embraced 485 eligible samples, including 430 PTC tumor cases and 55 normal thyroid cases. On the basis of the seventh American Joint Committee on Cancer (AJCC) TNM staging system, 243, 46, 89 and 52 PTC patients were in the stages I, II, III and IV, respectively. In addition, there were 214 PTC cases with lymphatic metastasis and 216 PTC cases without lymphatic metastasis.
In addition, 32 paired frozen PTC samples were obtained from Nanjing Drum Tower Hospital, including tumor tissues and adjacent normal tissues. These tissues were stored in RNAlater (GenStar BioSolutions, Beijing, People’s Republic of China) at –80°C immediately after exairesis until further use. Pathology reports and quality assessment reports were required to verify the collected samples. Informed consent agreements were signed by all patients in this study. Our study was approved by the ethics committee of Nanjing Drum Tower Hospital.
Differential analysis of expressed lncRNAs
lncRNA expression profiles (level 3) of PTC patients were obtained from the TCGA data portal, and their raw data were processed and normalized by TCGA RNASeqv2 system. Fold change >2 or <0.5, P-value <0.05 and false discovery rate (FDR) <0.0516 were setup to identify significantly differentially expressed lncRNAs. Then, all samples collected in TCGA database were divided into three groups to select the intersection of lncRNAs, including PTC tumor samples and normal thyroid samples, PTC samples with lymphatic metastasis and without lymphatic metastasis, PTC samples with stage I–II and stage III–IV. Then, the intersection of lncRNAs was obtained for further analysis. Figure S1 shows the flowchart of bioinformatic analysis.
Construction of potential prognostic signatures
To find the prognostic lncRNAs, we performed Cox regression analysis (univariate and multivariate analysis). Then, the risk score model was constructed by corresponding coefficients of the prognostic lncRNAs: risk score = ExplncRNA1 * βlncRNA1 + ExplncRNA2 * βlncRNA2 + …+ ExplncRNAn * βlncRNAn, where Exp is the expression level and β is the regression coefficient derived from the multivariate Cox regression model.
The lower the score, the lower the risk of death outcomes. In addition, all samples were divided into the low-risk score group and the high-risk score group according to the median scores. To identify the distinguishing ability of patients’ outcome, the Kaplan–Meier (K–M) survival curves were performed, and the time-dependent receiver operating characteristic (survival ROC)17 curves were employed to detect the prognostic power of the risk score model. According to all eligible patients’ clinical information, the relationship between the survival time and clinical factor was evaluated using the survival analysis.
The lncRNA signature function
To investigate the function of the risk score model, we first identified the genes that were highly related to the lncRNA signature (Pearson |R|>0.6) in the TCGA. Then, the gene ontology (GO) biological processes and Kyoto Encyclopedia of Genes and Genomes pathways were analyzed using Database for Annotation, Visualization and Integrated Discovery, and we were only interested in the significant level (P-value <0.05 and FDR <0.05). Moreover, the protein–protein interaction (PPI) network was performed to analyze the inter-function among co-related genes using GENets (https://string-db.org/).18
Screening of potential transcription factors
In the current study, to identify the transcription factors of the lncRNA-related genes, FunRich, an analysis tool of transcription factors, was used (http://www.funrich.org).19
The lncRNA signature verification
To confirm the reliability and validity of the risk score model, we first used other cohorts from Gene Expression Omnibus (GEO) databases. The lncRNA data of PTC (GSE35570, GSE60542 and GSE33630) was obtained from the GEO database, which was based on the Platform GPL570.
Second, we used qRT-PCR to examine their actual expression in 32 pairs of PTC samples. Their total RNA was extracted using TRIzol reagent (Invitrogen, Carlsbad, CA, USA) according to the manufacturer’s protocol. After the purity was detected, reverse transcription reactions and RT-PCR were performed as per our previous studies.20,21 Reverse transcription reactions using StarScript II First-strand cDNA Synthesis Mix (GenStar BioSolutions) were conducted in two steps according to its specification. qRT-PCR was carried out to detect the expression levels of candidate lncRNAs with the Step One PlusTM PCR System (Applied Biosystems) using RealStar Green Fast Mixture (GenStar BioSolutions) according to the manufacturer’s protocol. The primer sequences were as follows: GAPDH: forward 5-GGGAGCCAAAAGGGTCATCA-3, reverse 5-TGATGGCATGGACTGTGGTC-3, product size 203 bp; human PRSS3P2: forward 5-TGGGGTGGCGGATGATCTTGG-3, reverse 5-ACAGTGGGTGGTGTCAGCAGG-3, product size 128 bp; human KRTAP5-AS1: forward 5-GCCCTGCCTTCAGCCTCCTCA-3, reverse 5-GAAACGTCGGCCTGGCCTTGT-3, product size 186 bp; human PWAR5: forward 5-GAGACTCAAAGGCAAGAACTA-3, reverse 5-TGATGTGGGTGTTGATACTGT-3, product size 462 bp. Results were normalized to the expression of GAPDH. The results of qRT-PCR were calculated by the 2−∆∆Ct method: ∆Ct = Ct lncRNAs – CtGAPDH and ∆∆Ct = ∆Ct tumor tissues – ∆Ctadjacent non-tumor tissues.
Statistical analysis
All data are expressed as mean ± SD. The threshold of FDR was set as 0.05 to reduce the false positives in multiple tests in bioinformatics analysis. Moreover, the threshold of P-value was set as 0.05 to evaluate the null hypothesis. The key lncRNAs were selected by univariate/multivariate Cox regression model to build the risk score model, and the predicted power was identified by K–M survival curves and survival ROC. The Student’s t-test and the paired t-test were performed to calculate the results of GEO datasets and qRT-PCR. The abovementioned analyses were conducted using SPSS 21.0 (IBM Corporation, Armonk, NY, USA).
Results
Patient characteristics
According to the inclusion and exclusion criteria, 430 patients were included in the current study. These PTC patients were 47.682±15.574 years old. Among them, there were 111 male (25.8%) and 319 (74.2%) female patients. The overall survival (OS) time was 1,195.479±945.363 days, and eleven of 430 (2.6%) PTC patients had died.
Identification of key survival-related lncRNAs
As shown in the flowchart of Figure S1, 83 key lncRNAs were selected through the comparison between the four groups (tissues in stages I–II with non-lymphatic metastases, stages III–IV with non-lymphatic metastases, stages I–II with lymph node metastasis and stages III–IV with lymph node metastasis vs adjacent non-tumorous tissues; Figure 1 and Table S1).
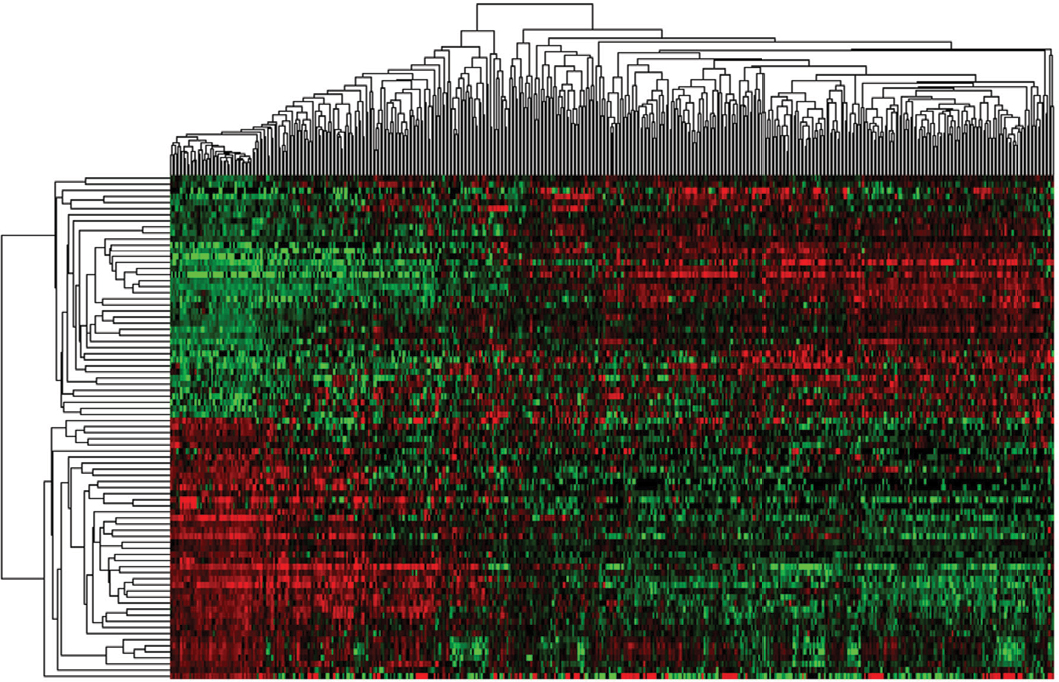 | Figure 1 Cluster analysis of consistent differential lncRNA expression. Note: Red indicates that the lncRNA has higher expression level; green indicates that the lncRNA has lower expression. |
According to the correlation between 83 key lncRNAs and clinical features of 430 PTC patients, nine survival-related lncRNAs were obtained with univariate Cox regression model (Table 1). To improve the robustness of the candidate lncRNAs, three lncRNAs (PRSS3P2, KRTAP5-AS1 and PWAR5) were identified for further analysis after performing multivariate Cox regression analysis, revealing that the three lncRNAs were independent prognostic signatures (Table 2).
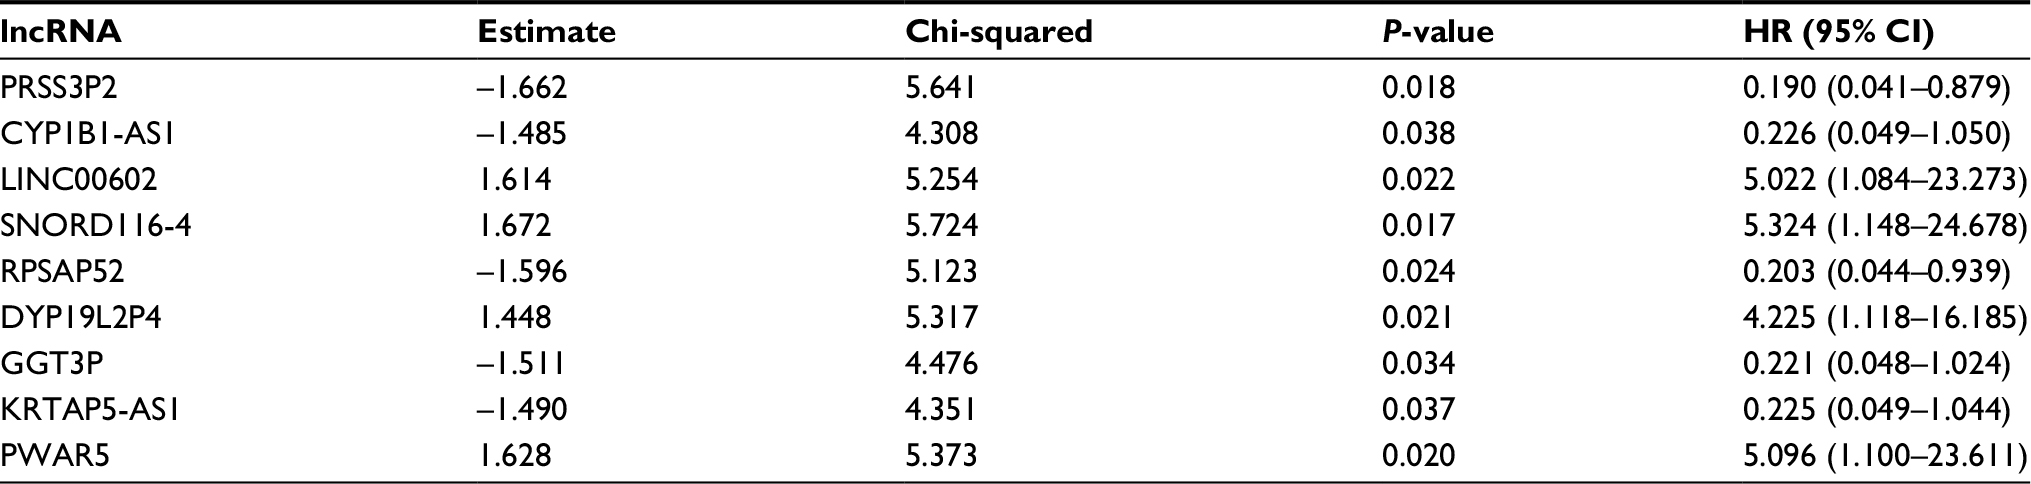 | Table 1 Prognostic value of the differentially expressed lncRNAs by univariate Cox regression analysis |
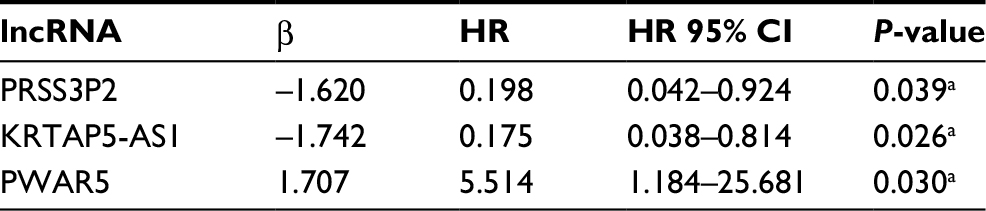 | Table 2 Prognostic value of the differentially expressed lncRNAs by multivariate Cox regression analysis Note: aP<0.05. |
Weighted by their corresponding coefficients, a three-lncRNA prognostic signature was constructed: risk score = ExpPRSS3P2 * (–1.620) + ExpKRTAP5-AS1 * (–1.742) + ExpPWAR5 * 1.707.
As shown in the risk score model, the coefficient of PRSS3P2 and KRTAP5-AS1 was negative, indicating that they were positively related to the OS of PTC patients while the expression of PWAR5 was a negative factor.
To evaluate the predicted power of the risk model, the patients were divided into two groups (high- and low-risk score groups) using the median risk score value as the cutoff (Figure 2). The K–M analysis confirmed that the OS time of the low-risk score patients was 1,216.495±934.724 days and the high-risk score patients was 1,174.657±959.669 days, indicating that the risk score was significantly associated with OS (P=0.022; Figure 3A). Furthermore, the three-lncRNA signature exhibited the strong predicted power of 5-year survival of the PTC patients (the area under the ROC curve was 0.739; Figure 3B), suggesting that the risk score model performed good sensitivity and specificity in predicting the PTC patients’ survival.
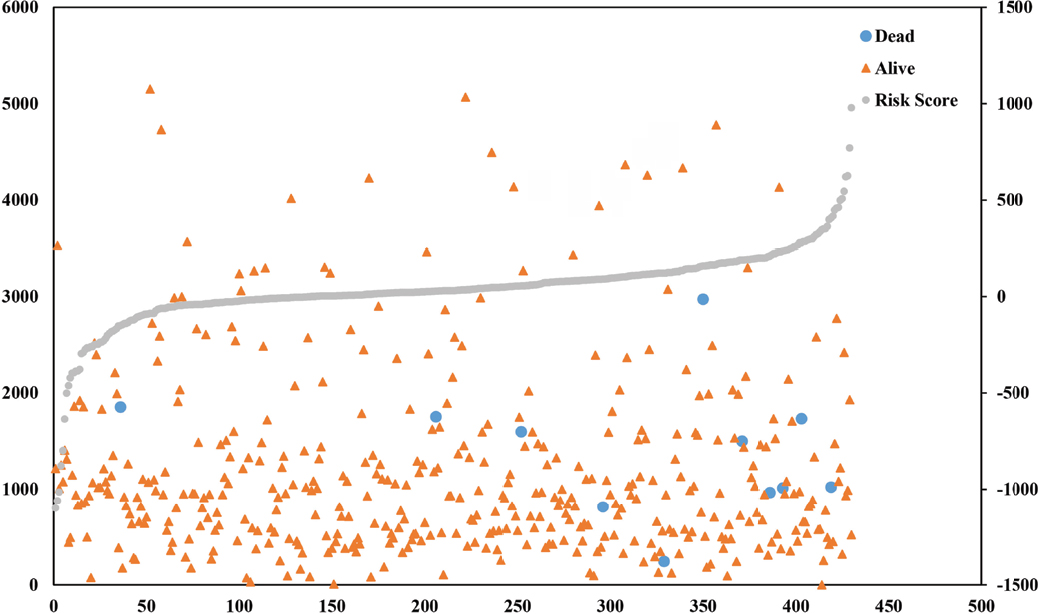 | Figure 2 Risk score analysis of the differentially expressed lncRNA signature of PTC. Note: Survival status and duration of cases and risk score of lncRNA signature. |
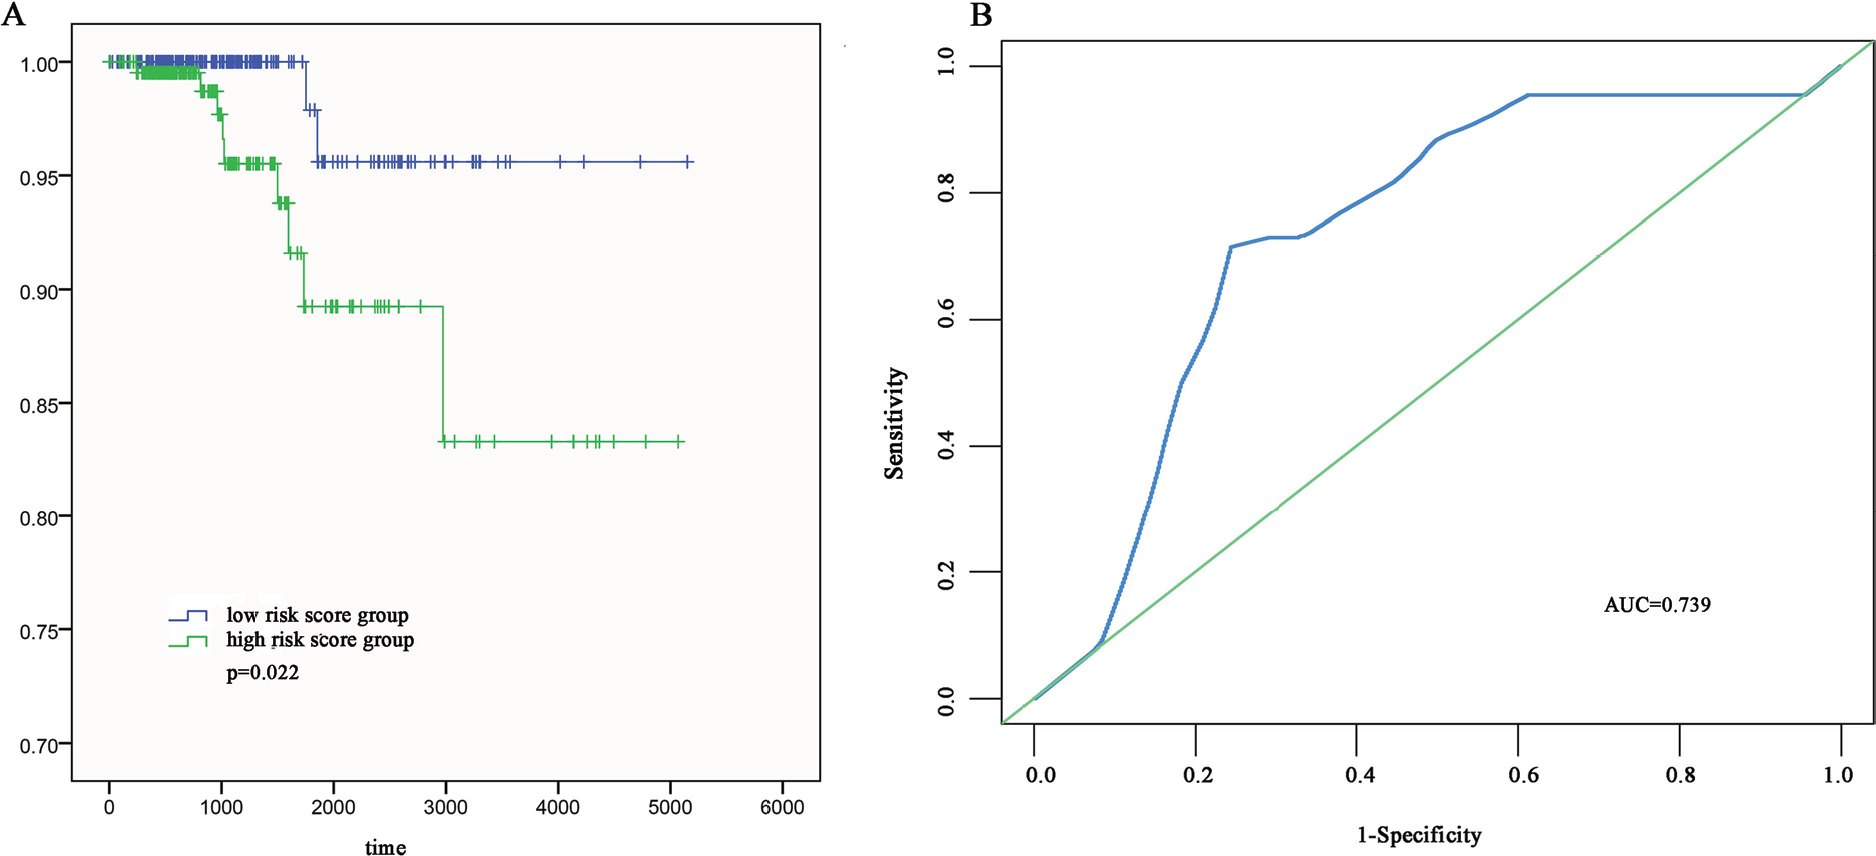 | Figure 3 The three differentially expressed lncRNA signatures of PTC for the outcome. Notes: (A) The risk score is shown by the time-dependent ROC curve for predicting 5-year survival. (B) The K–M test of the risk score for the OS. Abbreviations: AUC, area under the curve; K–M, Kaplan–Meier; OS, overall survival; PTC, papillary thyroid carcinoma; ROC, receiver operating characteristic. |
Correlation between clinical characteristics and survival time
To examine the association between the three-lncRNA signature with clinical features and survival time in PTC patients, survival analysis was performed. The results indicated that tumor stage, residual tumor, age and neoplasm cancer status could predict the poorer survival of PTC patients (Figure S2). In addition, they had prognostic values, including tumor stage (area under the curve [AUC] =0.766, P=0.003), residual tumor (AUC =0.703, P=0.029), age (AUC =0.836, P=0.000) and neoplasm cancer status (AUC =0.807, P=0.010; Figure S2).
Functional assessment of the three-lncRNA signature
A total of 1,098 genes identified in TCGA database co-expressed with lncRNAs of the risk score model (PRSS3P2, KRTAP5-AS1 and PWAR5; |R|>0.6), including 411 genes with PRSS3P2, 90 genes with KRTAP5-AS1 and 597 genes with PWAR5, respectively. A total of 367 GO terms and 73 pathways (P-value <0.05 and an enrichment score of >1.5) were identified. The results showed that the top GO biological process was regulation of transcription, DNA dependent (GO:0006351) and gene expression (GO:0010467; Figure 4A), and the results suggested that these genes were mainly enriched in ribosome and metabolic pathways (Figure 4B). The relationship and function of these genes were revealed in the PPI network (Figure 5).
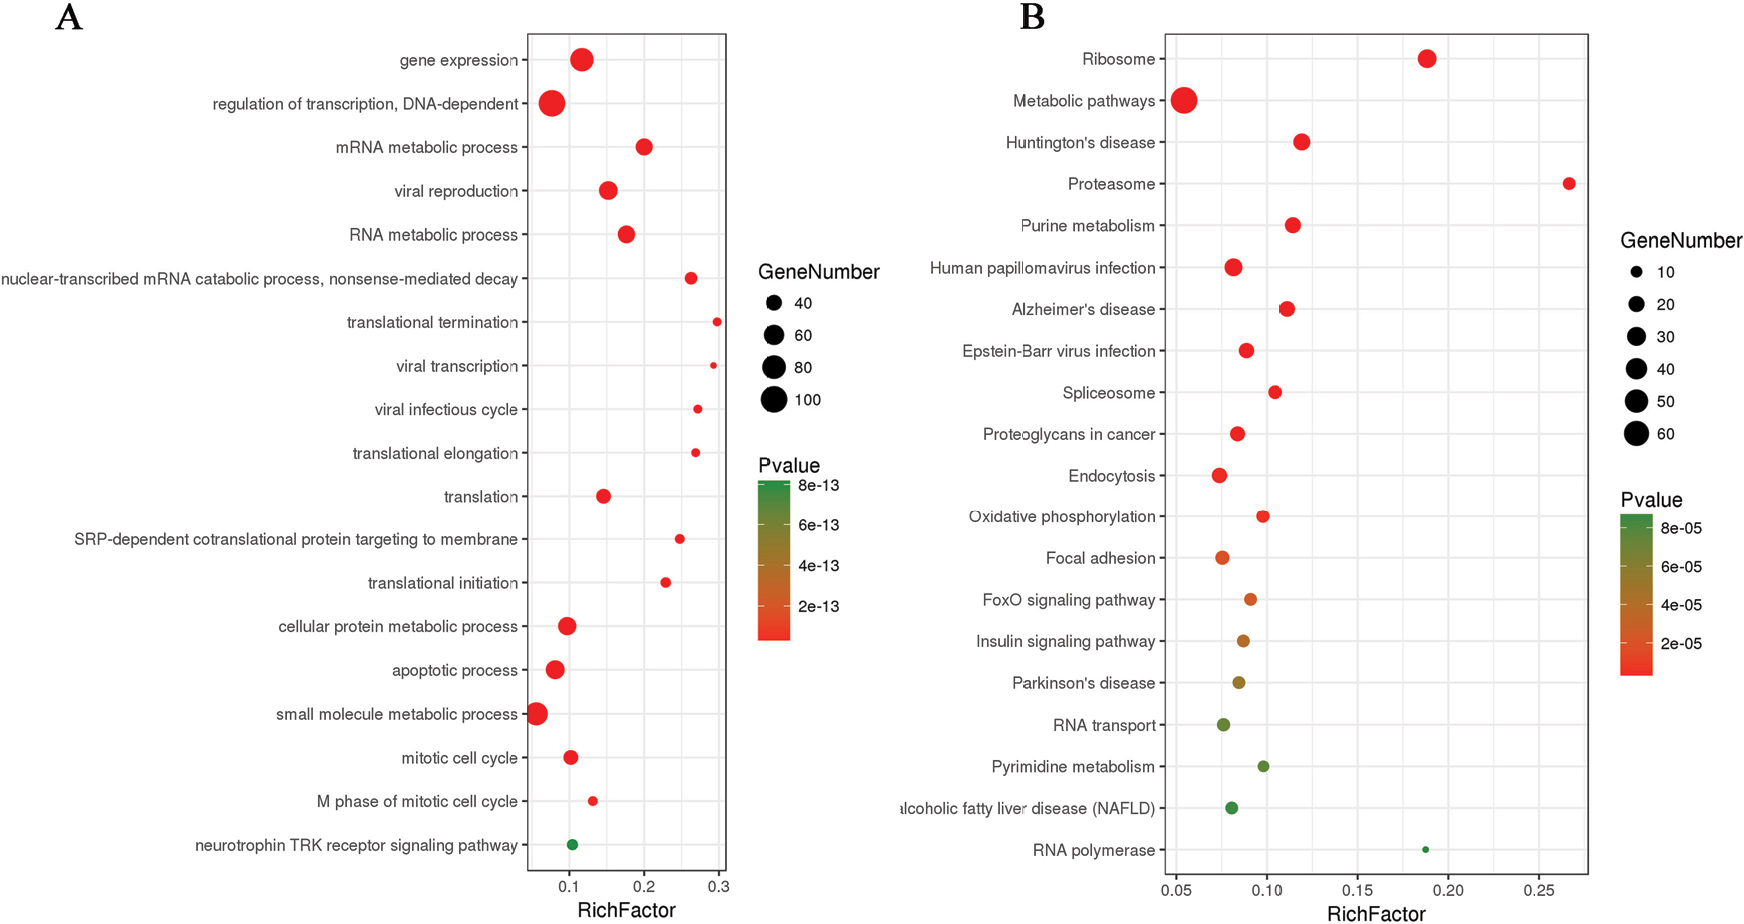 | Figure 4 Enrichment of KEGG pathways and GO terms for co-expressed mRNAs, and the map represents the PPI network of co-expressed genes. Note: (A and B) KEGG and GO analysis of the related genes. Abbreviations: GO, gene ontology; KEGG, Kyoto Encyclopedia of Genes and Genomes; PPI, protein–protein interaction; NAFLD, nonalcoholic fatty liver disease. |
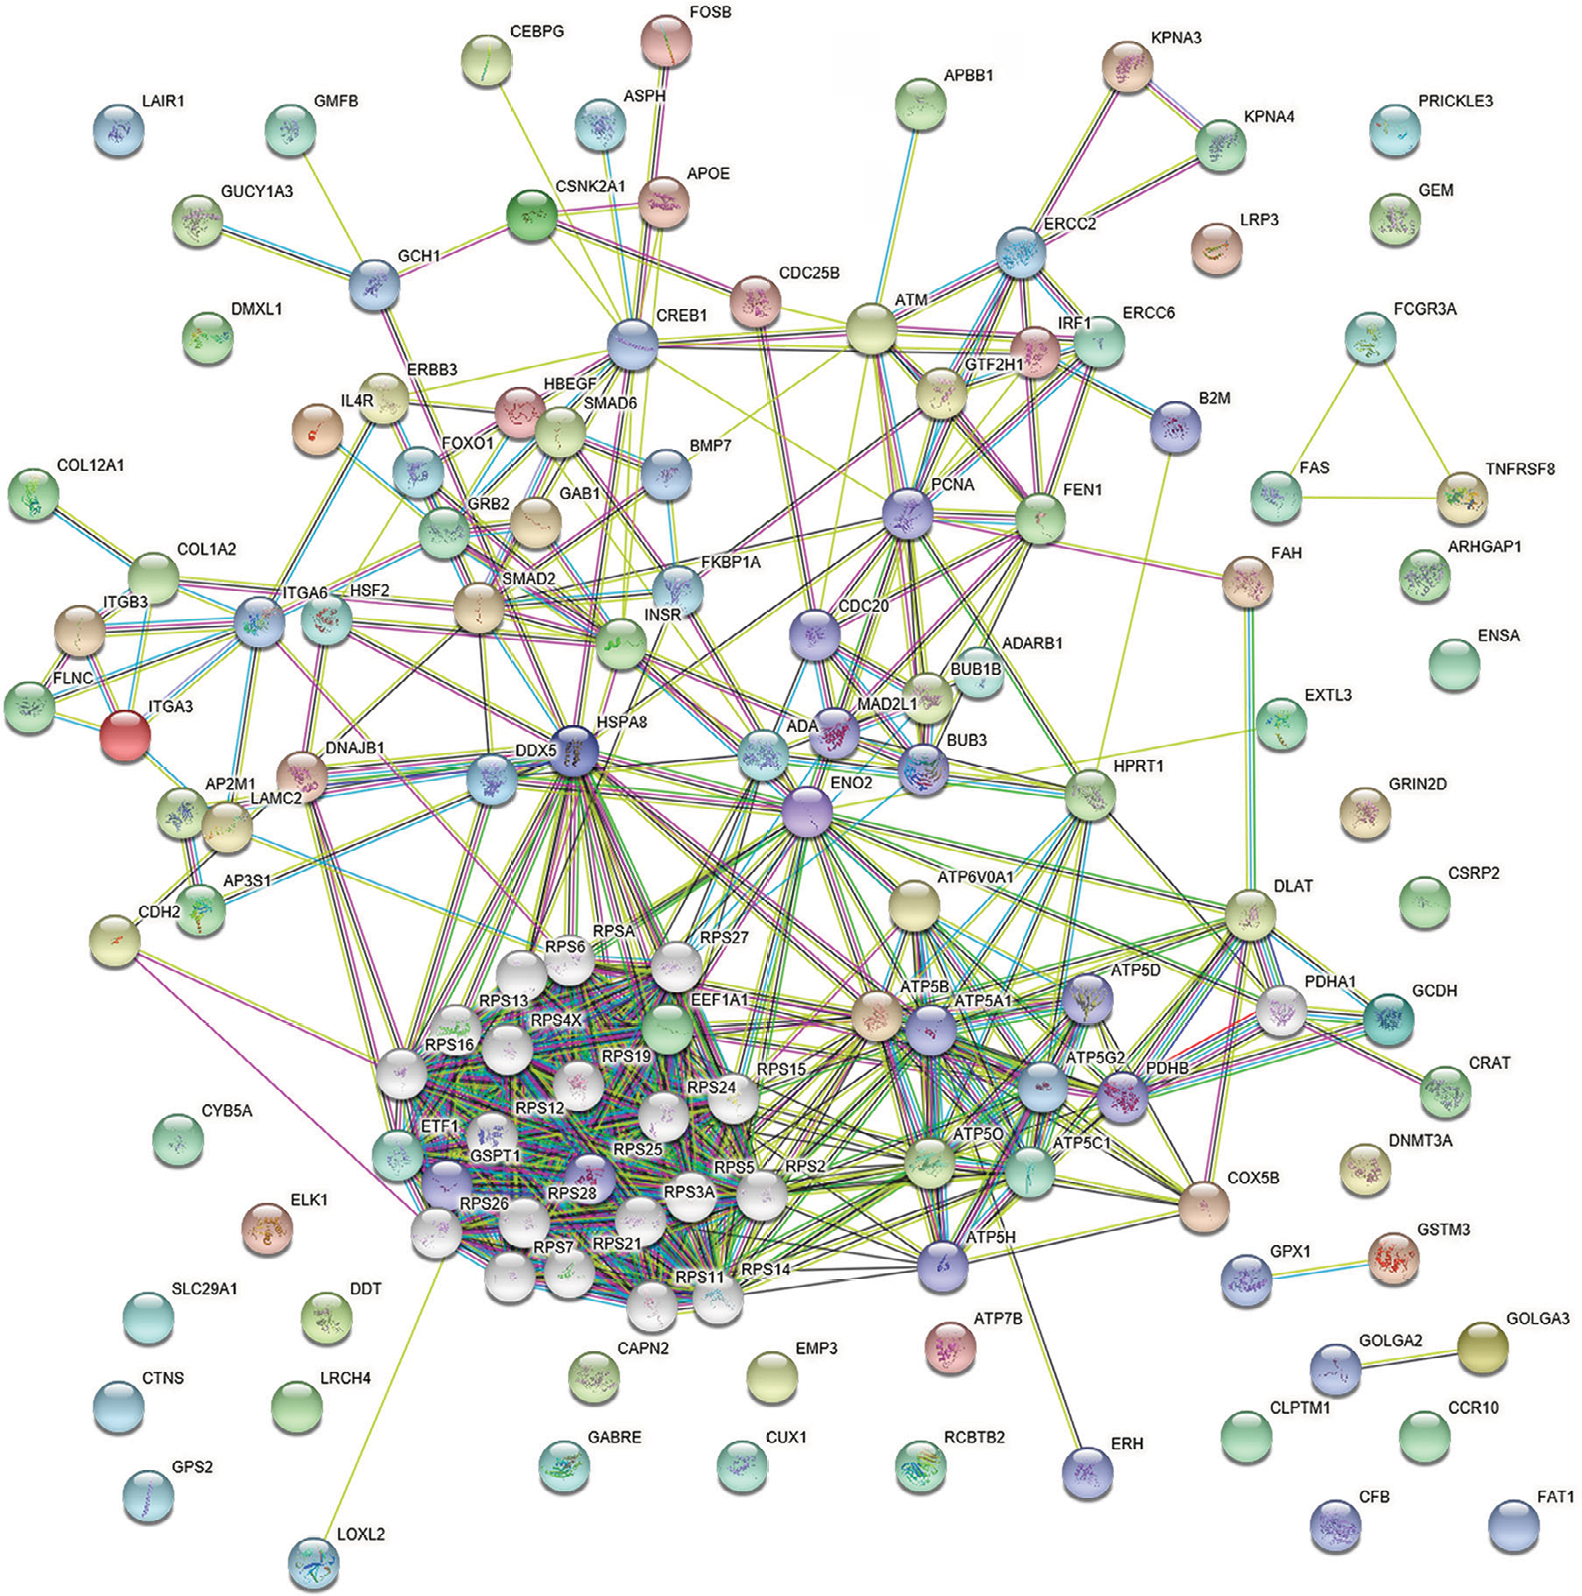 | Figure 5 PPI network of mRNAs. Abbreviation: PPI, protein–protein interaction. |
Screening of potential transcription factors
Based on the data from FunRich, the transcription factors for lncRNA co-expressed genes were ELK1, ETV7 and GABPA, which may be helpful to understand the mechanisms of the co-expressed genes of specific lncRNAs (Figure 6).
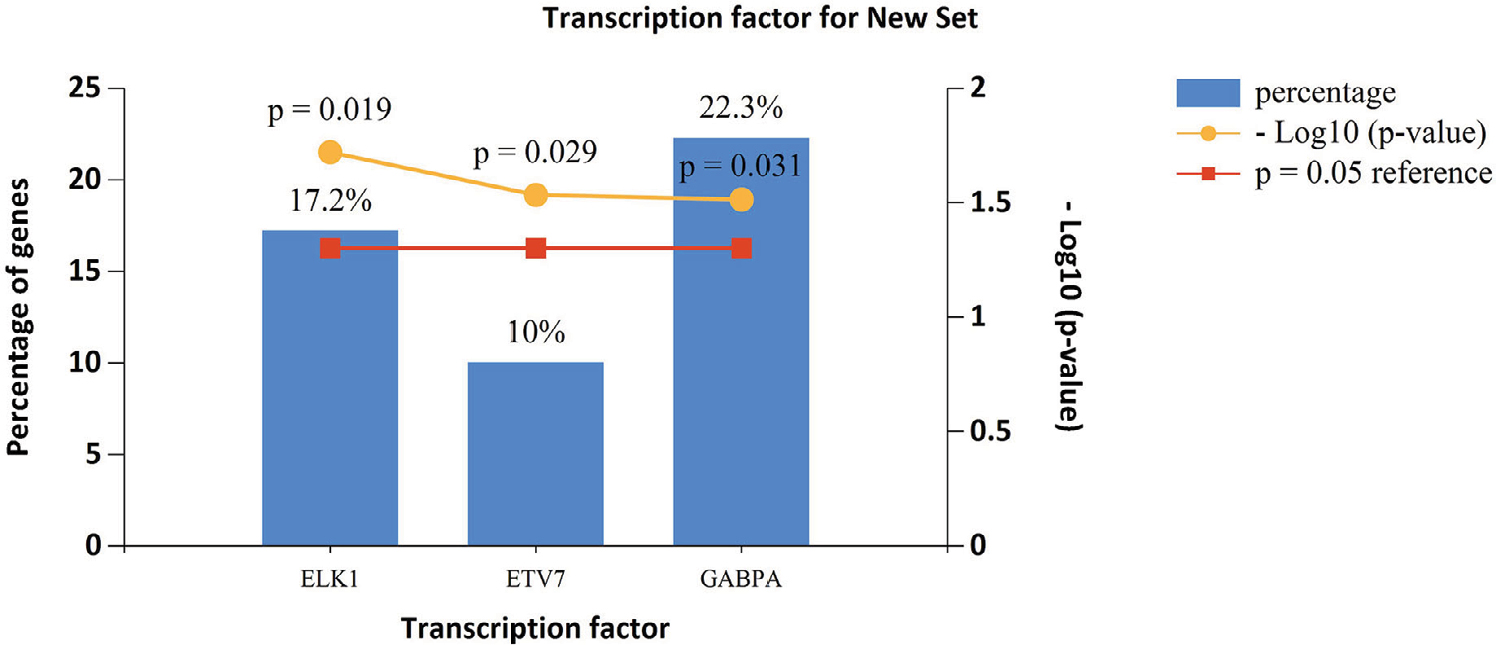 | Figure 6 Enriched transcription factors by lncRNA co-expressed genes. |
GEO dataset and qRT-PCR verification
The expression level of these three lncRNAs is summarized in Table 3. The expression level of PRASS3P2 and PWAR5 was evidently different between the PTC tissues and the normal tissues as shown in GSE35570, GSE60542 and GSE33630. The KRTAP5-AS1 expression in PTC was significantly higher than normal tissues as shown in GSE35570 and GSE33630. The results of GEO dataset were consistent with the abovementioned TCGA results. Unfortunately, no survival information of PTC lncRNA was available in the GEO datasets.
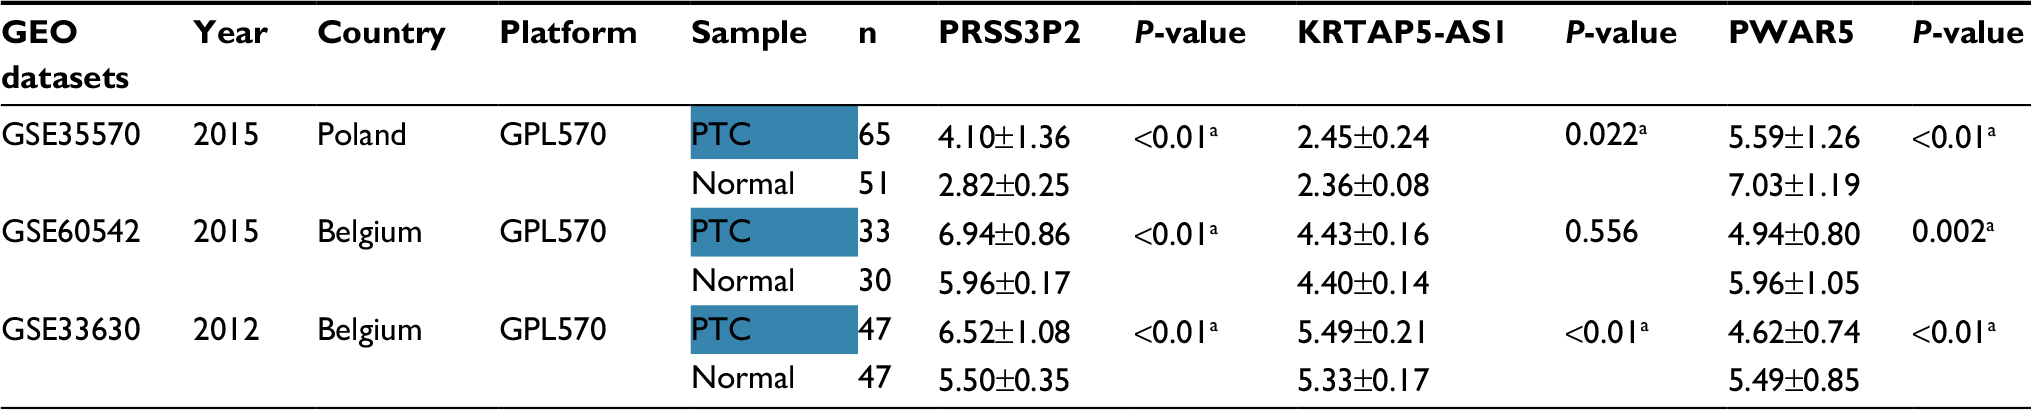 | Table 3 Expression data of three lncRNAs in GEO datasets Note: alncRNAs have significantly different expression (P<0.05). Abbreviations: GEO, Gene Expression Omnibus; PTC, papillary thyroid carcinoma. |
Finally, we performed the qRT-PCR to measure the actual expression of PRSS3P2, KRTAP5-AS1 and PWAR5. The results showed that PWAR5 was downregulated while PRSS3P2 and KRTAP5-AS1 were upregulated in the PTC tissues, which were consistent with the TCGA analysis (Figure 7).
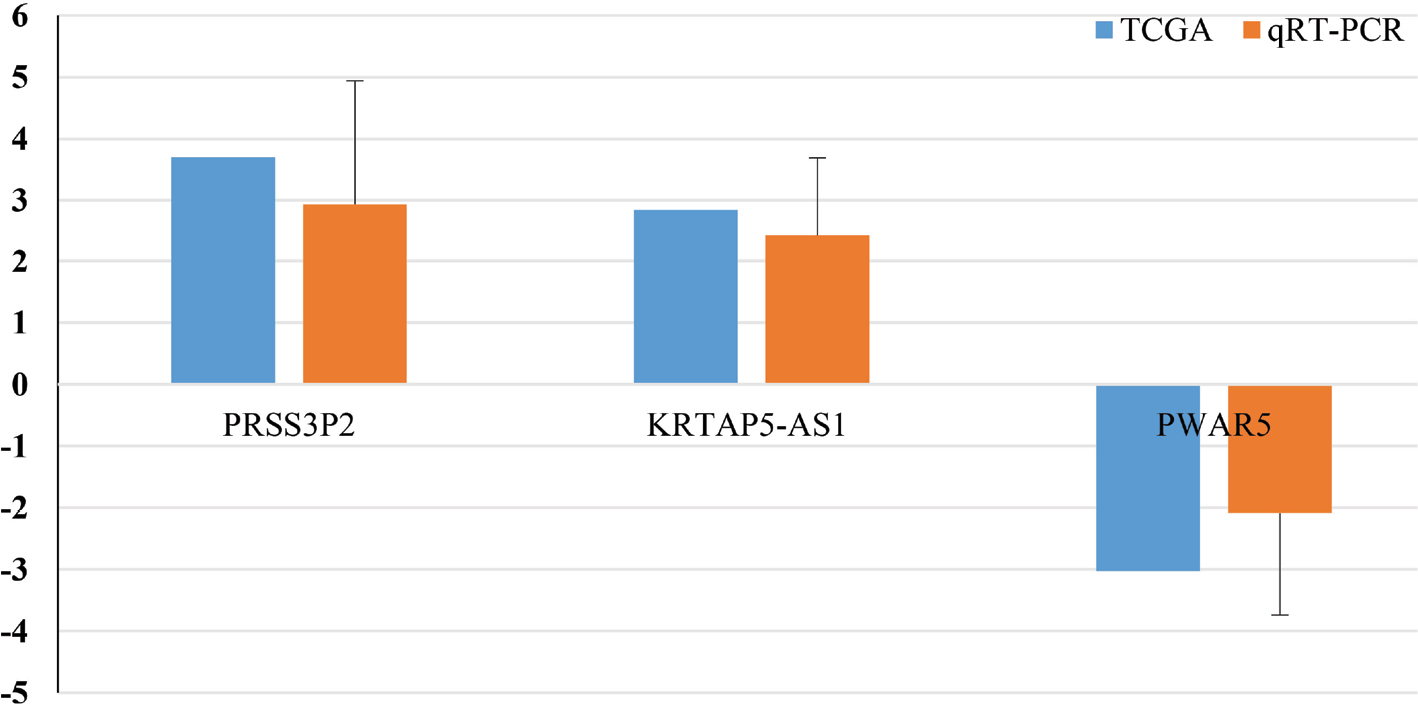 | Figure 7 qRT-PCR validation of the three lncRNAs. Notes: Comparison of fold change (2-∆∆Ct) of lncRNAs between TCGA and qRT-PCR results. Fold change (2-∆∆Ct) of lncRNAs of qRT-PCR results: ∆Ct = CtlncRNAs – CtGAPDH and ∆∆Ct = ∆Cttumor tissues – ∆Ctadjacent non-tumor tissues. Abbreviations: qRT-PCR, quantitative real time PCR; TCGA, The Cancer Genome Atlas. |
Discussion
TC is a common malignant endocrine disorder worldwide with increasing incidence in the past few decades. The “cancer statistics 201,821”22 presented the estimated number of new cases of TC expected in America in 2018, pointing out that about 53,990 cases of TC would be expected to be diagnosed and about 2,060 patients would die of TC. PTC is the most common subtype, constituting 80%–85% of all TC cases.23 In general, PTC has a relatively favorable prognosis with a high 5-year survival rate.24 However, there are still about 5%–10% of patients suffering from the PTC recurrence and facing the aggressive and deathful outcomes.25 Therefore, scholars are committed to find novel survival signatures of PTC. Liu et al26 found that Yes-activated Protein-1 could play as the biomarker and high-risk indicator in PTC. Yi et al27 analyzed the PTC data in TCGA database, suggesting that the ESR1 and ESR ratio (ESR1/ESR) could predict the female patients’ survival and has the potential to be a therapeutic target. A prospective study was performed to show that miR-146b-5p and miR-222 were significantly associated with central lymph node metastases in PTC, indicating that they were the independent predictors of PTC prognosis.28 In the present study, we mined the TCGA data to obtain PTC-specific lncRNAs for predicting the patients’ survival.
To detect the PTC-specific lncRNAs, all cases were divided into four groups (stage I–II with lymphatic metastasis, stage I–II without lymphatic metastasis, stage III–IV with lymphatic metastasis and stage IV without lymphatic metastasis) of patient tumor tissues, and then they were compared with adjacent non-tumor tissues. Then, 83 key lncRNAs were selected for further studies. Among them, several studies that are closely associated with cancers have been reported. Jones et al29 studied in a large sample to find that the telomerase RNA component variation promoted the increased risk of the colorectal cancer. lncRNA FER1L4 was downregulated in tumor tissues and could suppress tumor proliferation in endometrial carcinoma and gastric cancer.30,31 Su et al32 performed the feedback loop study to find that the lncRNA FOXD2-AS1 was correlated with progression and recurrence in bladder cancer. Drawing inspiration from these cancer-specific signatures, we were interested in whether the PTC-specific lncRNAs could predict the patients’ prognosis.
After the Cox regression analysis, three prognosis-related lncRNAs (PRSS3P2, KRTAP5-AS1 and PWAR5) were obtained. It was reported that PRSS3P2, trypsinogen 6, was closely related to chronic pancreatitis.33 Song et al34 constructed ceRNA network of gastric cancer and claimed that lncRNA KRTAP5-AS1 could play the role of ceRNAs to regulate Claudin-4, a biomarker associated with patients’ prognosis. PWAR5, also known as PAR5, could regulate the proliferation and progression of glioma by binding to EZH2.35 In addition, to validate the analyzed results from TCGA data, the expression of the abovementioned three key lncRNAs was measured using qRT-PCR. The results indicated that TCGA analysis and qRT-PCR results from 32 PTC patients were in 100% agreement. Combined with the literature and experimental results, these three PTC-specific lncRNAs had the potential to be prognostic indicators.
Then, we used these three survival-related lncRNAs to construct a three-lncRNA signature, which proved to be a prognostic biomarker of PTC. Based on the risk score model, the high-risk patients had poorer prognosis and the three-lncRNA signature could largely predict the 5-year survival time (AUC =0.739). Similarly, several studies also used the TCGA dataset to build the risk score model to explore the potential signature of PTC prognosis and diagnosis. Han et al36 mined the data in the TCGA database, and then 19 significant gene pairs with high diagnostic ability were detected. Luo et al37 identified a three-lncRNA signature (AC079630.2, CRNDE and CTD-2171N6.1) to predict the PTC patients’ survival. Li et al38 also provided a four-lncRNA signature (RP11-536N17.1, RP11-508M8.1, AC026150.8 and CTD-2139B15.2) to improve the prognosis prediction of PTC patients. However, compared with the previous studies (Luo et al’s and Li et al’s studies), we had some advantages. First, we have considered the tumor stage and lymphatic metastasis which were closely associated with PTC prognosis to obtain the key lncRNAs for further study. Second, if the expression of genes was “0” whose patients were more than 10% of all data, they would be eliminated, which could avoid bias. Third, the power of 5-year survival prediction was detected by the survival ROC, and the risk score model had high prognostic power (AUC =0.739). Fourth, we used “FDR <0.05 and P<0.05” as the inclusion criteria.39 Finally, we used GEO dataset and qRT-PCR to verify the results of TCGA analysis. We also wanted to validate the prognostic value of the three-lncRNA signature using the GEO datasets. Unfortunately, no survival information of PTC lncRNA was available in the datasets.37 Therefore, the candidate lncRNAs in the risk sore model were different in our studies, and the three-lncRNA prognostic signature was credible to be a potential biomarker.
In addition, we investigated the function of the three-lncRNA signature. As shown in Figure 4, the co-expressed genes were mainly associated with the DNA-dependent, gene expression, ribosome and metabolic pathways. Abnormal regulation of these functions is involved in various cancers, such as lung cancer, breast cancer, bladder cancer and colorectal cancer.40–43 Thus, the abnormal regulation of gene function may play a crucial role in the genesis and progress of PTC. Moreover, we identified three important transcription factors (ELK1, ETV7 and GABPA) that may significantly influence the PTC. Bullock et al44 claimed that FOXE1 and ELK1 established a new regulatory pathway to regulate the TCs. Jacques et al45 found that GABPA was closely associated with human thyroid tumors. However, there were no reports about the relation between ETV7 and TCs. In the future study, we can study on these three transcription factors by further research.
Finally, we analyzed the correlation between clinical characteristics and survival time. The results indicated that tumor stage, residual tumor, age and neoplasm cancer status were the risk factors of poor survival. A plenty of evidence supported our results that tumor stage, residual tumor and neoplasm cancer status were tightly bound to the poor prognosis.16,46,47 According to AJCC, 45 years old is a common age-cutoff in PTC. (https://emedicine.medscape.com/article/2006643-overview).48,49 In the current study, the PTC patients aged <45 years have longer survival time, indicating that the younger the PTC patients are, the better the prognosis they had.
Conclusion
By mining the TCGA data, we built a three-lncRNA signature, which could effectively predict the prognosis of PTC. Nevertheless, the present study has some limitations. First, there were only eleven dead PTC cases in the TCGA dataset, which might cause bias to obtain the correct results. Second, the samples of TCGA mostly were white people, and the results should be validated in a proof test of Chinese cohort in the future. Ultimately, we hope that the three-lncRNA signature can help to predict PTC prognosis in the future.
Acknowledgments
This study was supported by the Technology Development Project of Nanjing (YKK10080) and the National Natural Science Foundation of China (81673132 and 81472939). The authors appreciate Mr Cheng Donglin for his technical assistance.
Disclosure
The authors report no conflicts of interest in this work.
References
Lu ZL, Chen YJ, Jing XY, Wang NN, Zhang T, Hu CJ. Detection and identification of serum peptides biomarker in papillary thyroid cancer. Med Sci Monit. 2018;24:1581–1587. | ||
Greco A, Auletta L, Orlandella F, et al. Preclinical imaging for the study of mouse models of thyroid cancer. Int J Mol Sci. 2017;18(12):2731. | ||
Siołek M, Cybulski C, Gąsior-Perczak D, et al. CHEK2 mutations and the risk of papillary thyroid cancer. Int J Cancer. 2015;137(3):548–552. | ||
Lim H, Devesa SS, Sosa JA, Check D, Kitahara CM. Trends in thyroid cancer incidence and mortality in the United States, 1974-2013. JAMA. 2017;317(13):1338–1348. | ||
Cha YJ, Koo JS. Next-generation sequencing in thyroid cancer. J Transl Med. 2016;14(1):322. | ||
Berdelou A, Lamartina L, Klain M, Leboulleux S, Schlumberger M, TUTHTYREF Network. Treatment of refractory thyroid cancer. Endocr Relat Cancer. 2018;25(4):R209–R223. | ||
Nikiforov YE, Nikiforova MN. Molecular genetics and diagnosis of thyroid cancer. Nat Rev Endocrinol. 2011;7(10):569–580. | ||
Quagliariello V, Armenia E, Aurilio C, et al. New treatment of medullary and papillary human thyroid cancer: biological effects of hyaluronic acid hydrogel loaded with quercetin alone or in combination to an inhibitor of aurora kinase. J Cell Physiol. 2016;231(8):1784–1795. | ||
Wu WJ, Shen Y, Sui J, et al. Integrated analysis of long non-coding RNA competing interactions revealed potential biomarkers in cervical cancer: Based on a public database. Mol Med Rep. 2018;17(6):7845–7858. | ||
du L, Duan W, Jiang X, et al. Cell-free lncRNA expression signatures in urine serve as novel non-invasive biomarkers for diagnosis and recurrence prediction of bladder cancer. J Cell Mol Med. 2018;22(5):2838–2845. | ||
Luo Y, Xuan Z, Zhu X, Zhan P, Wang Z. Long non-coding RNAs RP5-821D11.7, APCDD1L-AS1 and RP11-277P12.9 were associated with the prognosis of lung squamous cell carcinoma. Mol Med Rep. 2018;17(5):7238–7248. | ||
Liao T, Qu N, Shi RL, et al. BRAF-activated LncRNA functions as a tumor suppressor in papillary thyroid cancer. Oncotarget. 2017;8(1):238–247. | ||
Lan X, Zhang H, Wang Z, et al. Genome-wide analysis of long noncoding RNA expression profile in papillary thyroid carcinoma. Gene. 2015;569(1):109–117. | ||
Liyanarachchi S, Li W, Yan P, et al. Genome-wide expression screening discloses long noncoding rnas involved in thyroid carcinogenesis. J Clin Endocrinol Metab. 2016;101(11):4005–4013. | ||
Zhao Y, Wang H, Wu C, et al. Construction and investigation of lncRNA-associated ceRNA regulatory network in papillary thyroid cancer. Oncol Rep. 2018;39(3):1197–1206. | ||
Sui J, Xu SY, Han J, et al. Integrated analysis of competing endogenous RNA network revealing lncRNAs as potential prognostic biomarkers in human lung squamous cell carcinoma. Oncotarget. 2017;8(39):65997–66018. | ||
Heagerty PJ, Lumley T, Pepe MS. Time-dependent ROC curves for censored survival data and a diagnostic marker. Biometrics. 2000;56(2):337–344. | ||
von Mering C, Jensen LJ, Snel B, et al. STRING: known and predicted protein-protein associations, integrated and transferred across organisms. Nucleic acids research. Jan 1 2005;33(Database issue):D433-437. | ||
Pathan M, Keerthikumar S, Ang CS, et al. FunRich: An open access standalone functional enrichment and interaction network analysis tool. Proteomics. 2015;15(15):2597–2601. | ||
Sui J, Li YH, Zhang YQ, et al. Integrated analysis of long non-coding RNA-associated ceRNA network reveals potential lncRNA biomarkers in human lung adenocarcinoma. Int J Oncol. 2016;49(5):2023–2036. | ||
Yang S, Sui J, Liang G. Diagnosis value of aberrantly expressed microRNA profiles in lung squamous cell carcinoma: a study based on the Cancer Genome Atlas. PeerJ. 2017;5:e4101. | ||
Siegel RL, Miller KD, Jemal A. Cancer statistics, 2018. CA Cancer J Clin. 2018;68(1):7–30. | ||
Liang J, Cai W, Feng D, et al. Genetic landscape of papillary thyroid carcinoma in the Chinese population. J Pathol. 2018;244(2):215–226. | ||
Gambardella C, Tartaglia E, Nunziata A, et al. Clinical significance of prophylactic central compartment neck dissection in the treatment of clinically node-negative papillary thyroid cancer patients. World J Surg Oncol. 2016;14(1):247. | ||
Haugen BR, Alexander EK, Bible KC, et al. 2015 American thyroid association management guidelines for adult patients with thyroid nodules and differentiated thyroid cancer: the american thyroid association guidelines task force on thyroid nodules and differentiated thyroid cancer. Thyroid. 2016;26(1):1–133. | ||
Liu Z, Zeng W, Maimaiti Y, et al. High expression of yes-activated protein-1 in papillary thyroid carcinoma correlates with poor prognosis. Appl Immunohistochem Mol Morphol. 2017:1. | ||
Yi JW, Kim SJ, Kim JK, Jw Y, Kim JK, et al. Upregulation of the ESR1 gene and ESR ratio (ESR1/ESR2) is associated with a worse prognosis in papillary thyroid carcinoma: the impact of the estrogen receptor α/β expression on clinical outcomes in papillary thyroid carcinoma patients. Ann Surg Oncol. 2017;24(12):3754–3762. | ||
Han PA, Kim HS, Cho S, et al. Association of BRAF V600E mutation and microRNA expression with central lymph node metastases in papillary thyroid cancer: a prospective study from four endocrine surgery centers. Thyroid. 2016;26(4):532–542. | ||
Jones AM, Beggs AD, Carvajal-Carmona L, et al. TERC polymorphisms are associated both with susceptibility to colorectal cancer and with longer telomeres. Gut. 2012;61(2):248–254. | ||
Qiao Q, Li H. LncRNA FER1L4 suppresses cancer cell proliferation and cycle by regulating PTEN expression in endometrial carcinoma. Biochem Biophys Res Commun. 2016;478(2):507–512. | ||
Xia T, Chen S, Jiang Z, et al. Long noncoding RNA FER1L4 suppresses cancer cell growth by acting as a competing endogenous RNA and regulating PTEN expression. Sci Rep. 2015;5:13445. | ||
Su F, He W, Chen C, et al. The long non-coding RNA FOXD2-AS1 promotes bladder cancer progression and recurrence through a positive feedback loop with Akt and E2F1. Cell Death Dis. 2018;9(2):233. | ||
Rygiel AM, Beer S, Simon P, et al. Gene conversion between cationic trypsinogen (PRSS1) and the pseudogene trypsinogen 6 (PRSS3P2) in patients with chronic pancreatitis. Hum Mutat. 2015;36(3):350–356. | ||
Song YX, Sun JX, Zhao JH, et al. Non-coding RNAs participate in the regulatory network of CLDN4 via ceRNA mediated miRNA evasion. Nat Commun. 2017;8(1):289. | ||
Wang XP, Shan C, Deng XL, Li LY, Ma W. Long non-coding RNA PAR5 inhibits the proliferation and progression of glioma through interaction with EZH2. Oncol Rep. 2017;38(5):3177–3186. | ||
Han LO, Li XY, Cao MM, Cao Y, Zhou LH. Development and validation of an individualized diagnostic signature in thyroid cancer. Cancer Med. 2018;7(4):1135–1140. | ||
Luo YH, Liang L, He RQ, Rq H, et al. RNA-sequencing investigation identifies an effective risk score generated by three novel lncRNAs for the survival of papillary thyroid cancer patients. Oncotarget. 2017;8(43):74139–74158. | ||
Li Q, Li H, Zhang L, Zhang C, Yan W, Wang C. Identification of novel long non-coding RNA biomarkers for prognosis prediction of papillary thyroid cancer. Oncotarget. 2017;8(28):46136–46144. | ||
Kulkarni AS, Brutsaert EF, Anghel V, et al. Metformin regulates metabolic and nonmetabolic pathways in skeletal muscle and subcutaneous adipose tissues of older adults. Aging Cell. 2018;17(2):e12723. | ||
Klein C, Dokic I, Mairani A, et al. Overcoming hypoxia-induced tumor radioresistance in non-small cell lung cancer by targeting DNA-dependent protein kinase in combination with carbon ion irradiation. Radiat Oncol. 2017;12(1):208. | ||
Korde LA, Lusa L, Mcshane L, et al. Gene expression pathway analysis to predict response to neoadjuvant docetaxel and capecitabine for breast cancer. Breast Cancer Res Treat. 2010;119(3):685–699. | ||
Wong YH, Li CW, Chen BS. Evolution of network biomarkers from early to late stage bladder cancer samples. Biomed Res Int. 2014;2014:159078. | ||
Fan X, Rao J, Zhang Z, et al. Macranthoidin B modulates key metabolic pathways to enhance ROS generation and induce cytotoxicity and apoptosis in colorectal cancer. Cell Physiol Biochem. 2018;46(4):1317–1330. | ||
Bullock M, Lim G, Li C, et al. Thyroid transcription factor FOXE1 interacts with ETS factor ELK1 to co-regulate TERT. Oncotarget. 2016;7(52):85948–85962. | ||
Jacques C, Fontaine JF, Franc B, et al. Death-associated protein 3 is overexpressed in human thyroid oncocytic tumours. Br J Cancer. 2009;101(1):132–138. | ||
Miao Y, Sui J, Xu SY, Liang GY, Pu YP, Yin LH, Sy X, Yp P. Comprehensive analysis of a novel four-lncRNA signature as a prognostic biomarker for human gastric cancer. Oncotarget. 2017;8(43):75007–75024. | ||
Shukla S, Evans JR, Malik R, et al. Development of a RNA-seq based prognostic signature in lung adenocarcinoma. J Natl Cancer Inst. 2017;109(1):djw200. | ||
Nixon IJ, Kuk D, Wreesmann V, et al. Defining a valid age cutoff in staging of well-differentiated thyroid cancer. Ann Surg Oncol. 2016;23(2):410–415. | ||
Edge SB, Compton CC. The American Joint Committee on Cancer: the 7th edition of the AJCC cancer staging manual and the future of TNM. Annals of surgical oncology. Jun 2010;17(6):1471–1474. |
Supplementary materials
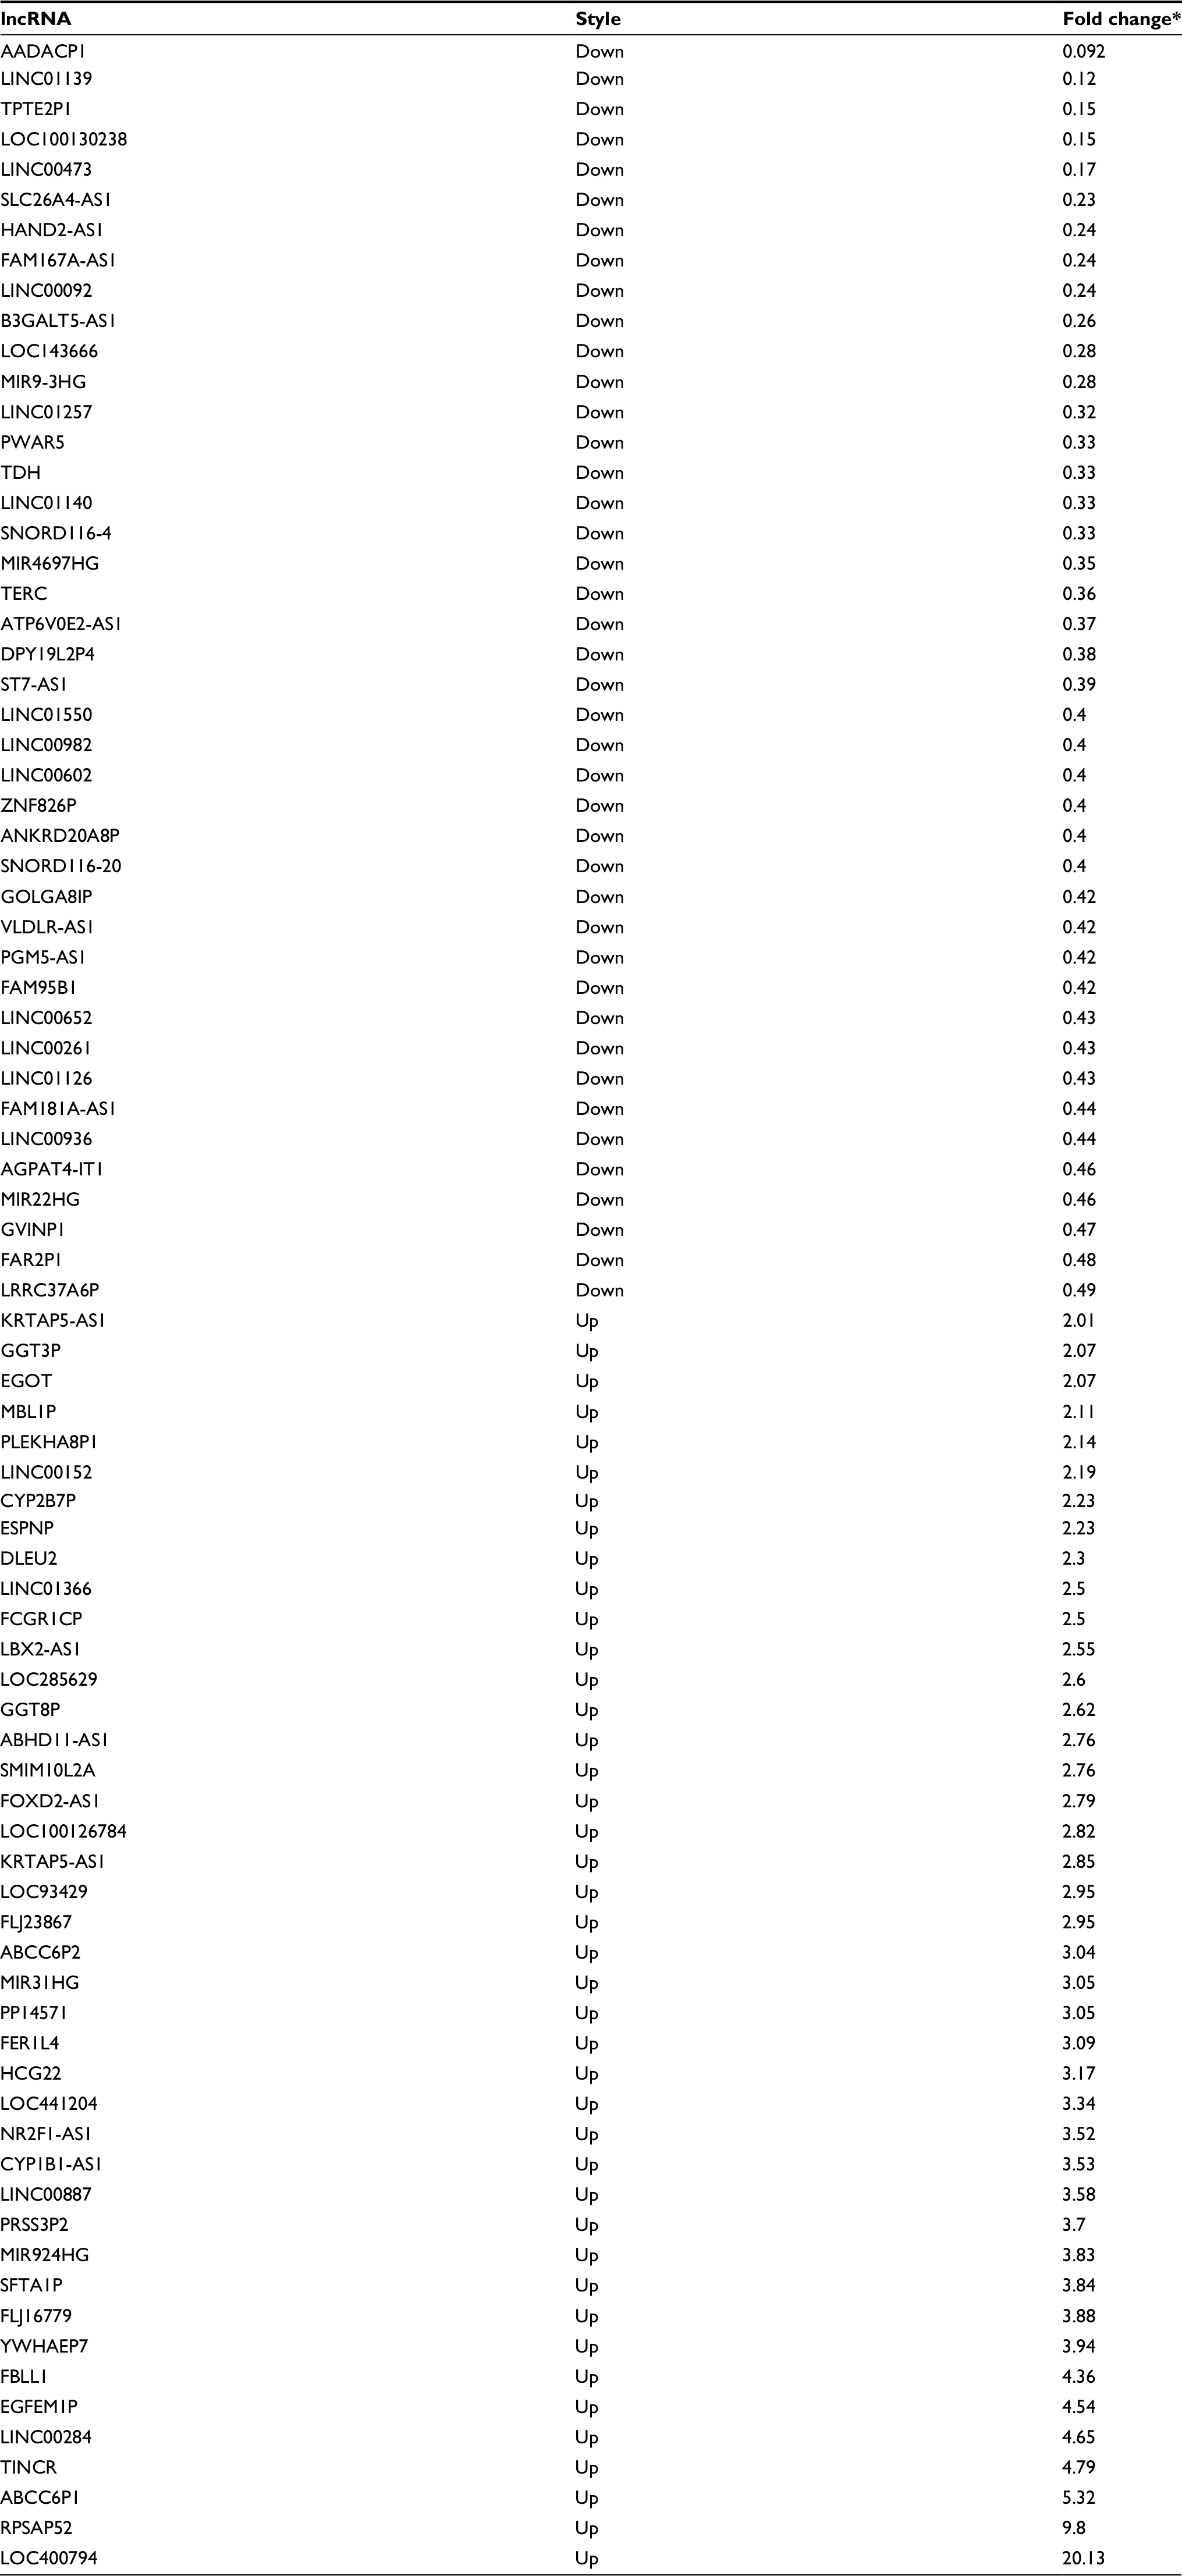 | Table S1 Abnormal expression of the intersection of lncRNAs in PTC Note: *These lncRNAs have significantly different expression (fold change ≥2 or ≤0.5, and P-value <0.01). Abbreviations: PTC, papillary thyroid carcinoma. |
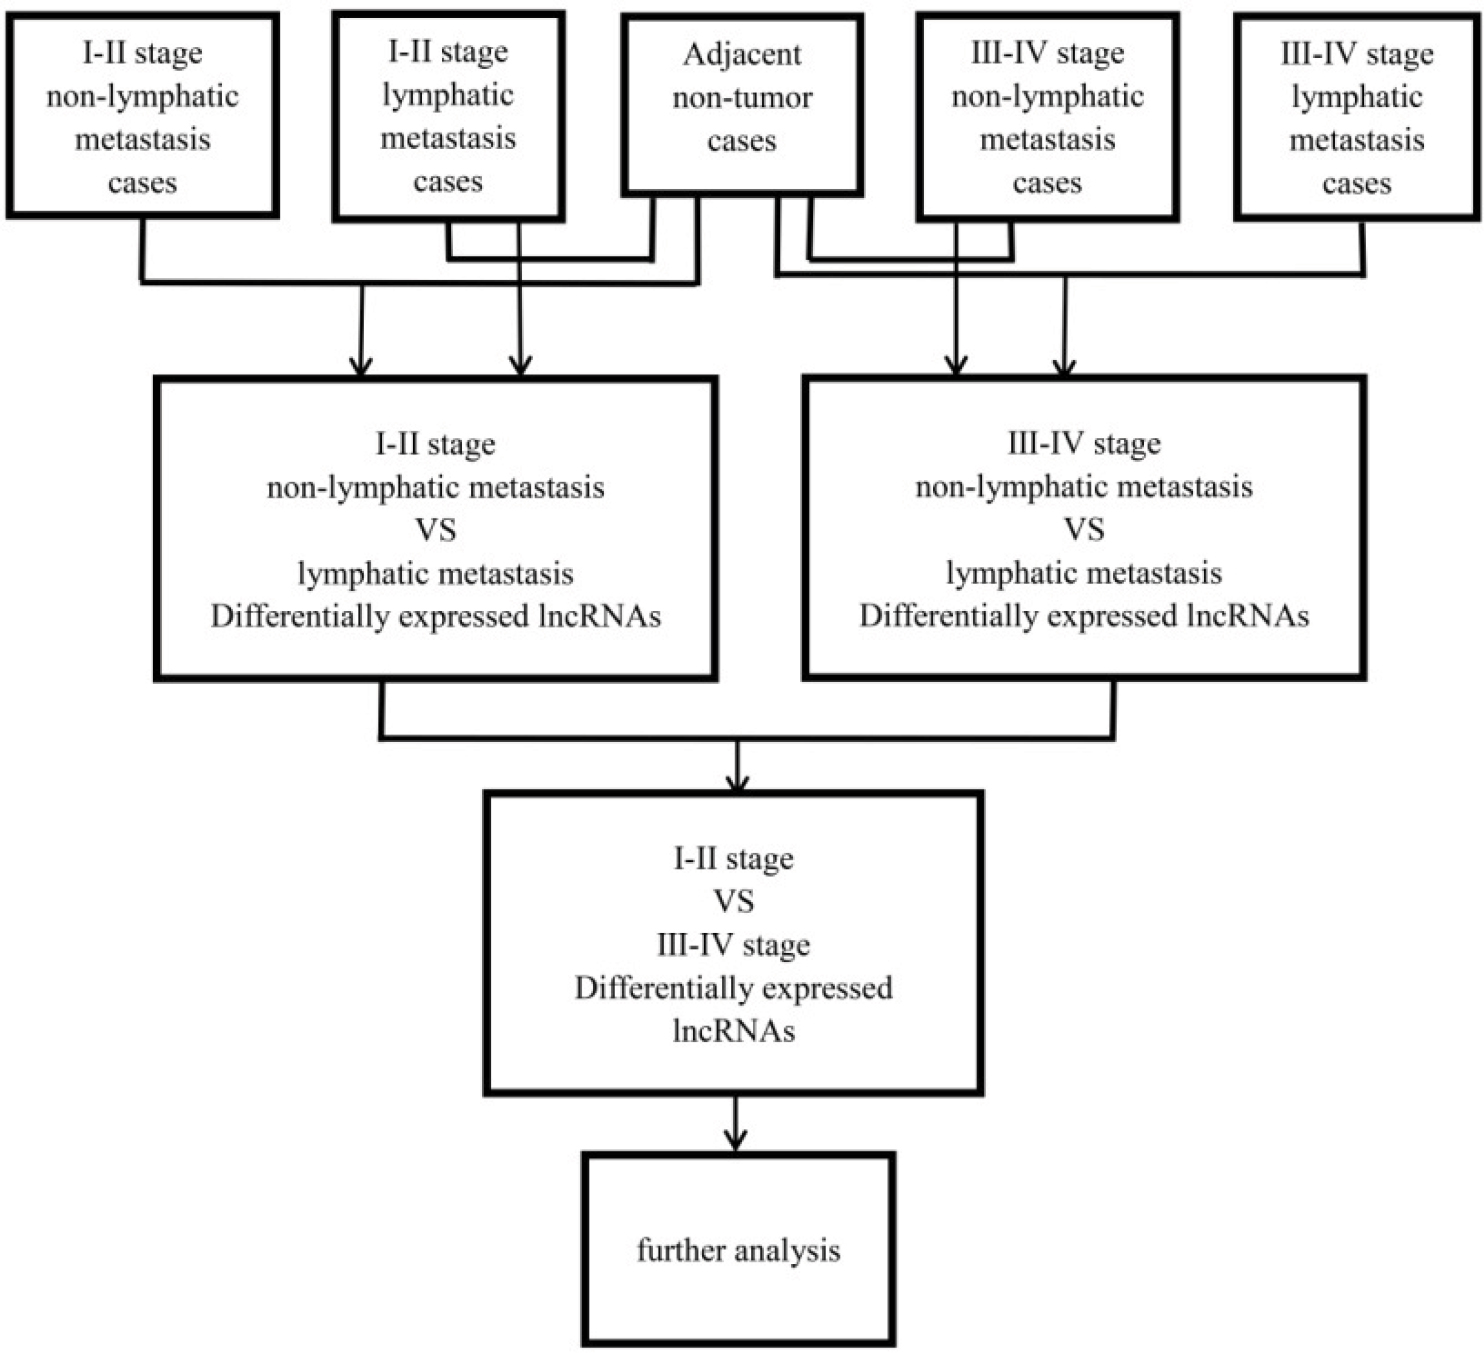 | Figure S1 Flowchart of bioinformatic analysis. |
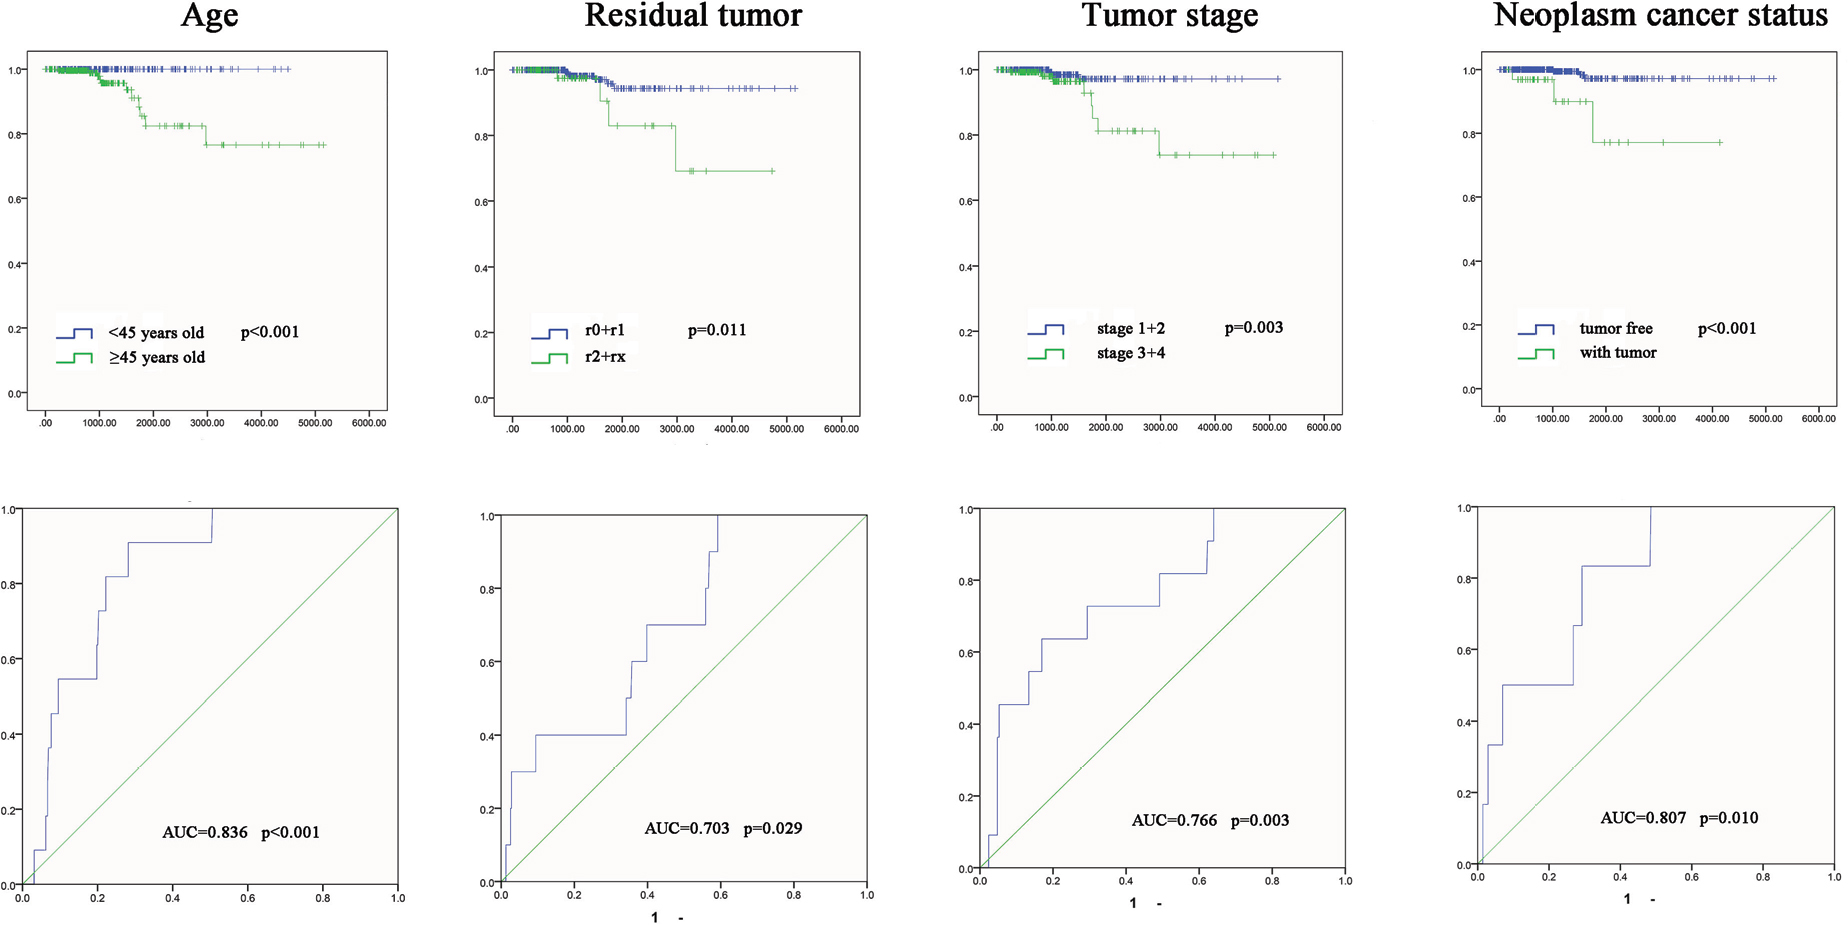 | Figure S2 The K–M curves and predictive value of the risk score for clinical features. Notes: The prognostic value of different clinical features for the OS of PTC patients. ROC curve is used to predict different clinical features. Abbreviations: AUC, area under the curve; K–M, Kaplan–Meier; OS, overall survival; PTC, papillary thyroid carcinoma; ROC, receiver operating characteristic. |
 © 2018 The Author(s). This work is published and licensed by Dove Medical Press Limited. The full terms of this license are available at https://www.dovepress.com/terms.php and incorporate the Creative Commons Attribution - Non Commercial (unported, v3.0) License.
By accessing the work you hereby accept the Terms. Non-commercial uses of the work are permitted without any further permission from Dove Medical Press Limited, provided the work is properly attributed. For permission for commercial use of this work, please see paragraphs 4.2 and 5 of our Terms.
© 2018 The Author(s). This work is published and licensed by Dove Medical Press Limited. The full terms of this license are available at https://www.dovepress.com/terms.php and incorporate the Creative Commons Attribution - Non Commercial (unported, v3.0) License.
By accessing the work you hereby accept the Terms. Non-commercial uses of the work are permitted without any further permission from Dove Medical Press Limited, provided the work is properly attributed. For permission for commercial use of this work, please see paragraphs 4.2 and 5 of our Terms.