")
Back to Journals » International Journal of General Medicine » Volume 15
Molecular Characterization of m6A Modifications in Non-Clear Cell Renal Cell Carcinoma and Potential Relationship with Pathological Types
Authors Xiang X, Guo Y, Chen Z, Mo Z
Received 17 November 2021
Accepted for publication 27 January 2022
Published 15 February 2022 Volume 2022:15 Pages 1595—1608
DOI https://doi.org/10.2147/IJGM.S348343
Checked for plagiarism Yes
Review by Single anonymous peer review
Peer reviewer comments 2
Editor who approved publication: Dr Scott Fraser
Xuebao Xiang, Yi Guo, Zhongyuan Chen, Zengnan Mo
Center for Genomic and Personalized Medicine, Guangxi Key Laboratory for Genomic and Personalized Medicine, Guangxi Collaborative Innovation Center for Genomic and Personalized Medicine, Guangxi Medical University, Nanning, Guangxi, People’s Republic of China
Correspondence: Zengnan Mo, Email [email protected]
Background: N6-Methyladenosine (m6A) modification is a eukaryotic mRNA modification that modulates the fate of modified RNA and, therefore, the expression of proteins. m6A modifications are associated with important roles in several cancers. Most studies related to m6A modification are based on clear cell renal cell carcinoma (ccRCC) and little is known about its role in non-ccRCC.
Methods: We summarized the molecular features of different m6A modification patterns in non-ccRCC based on The Cancer Genome Atlas database and correlated them with phenotypes such as immune patterns and prognosis. We also computed the m6Ascore and assessed its prognostic value using multivariate Cox regression analysis.
Results: We found the immune-excluded phenotype to be predominant in non-ccRCC patients. We also found that in non-clear cell carcinoma, different m6A modification profiles determine different immune patterns and are associated with different prognosis. m6AgeneCluser typing strongly associated with pathological status. Based on our findings, we suggest that the m6Ascore can be used as an independent prognostic value for prognostic assessment in non-ccRCC.
Conclusion: This study confirms the important role of m6A modifications in non-ccRCC, reveals the heterogeneity of tumor immunity, and highlights the promise of non-ccRCC therapy.
Keywords: N6-methyladenosine, RNA modification, non-clear cell renal cell carcinoma, m6A score, immune patterns, renal cell carcinoma
Introduction
Renal cell carcinoma (RCC) originates from the renal tubular epithelium and is currently recognized as one of the 10 most common cancers, killing approximately 180,000 individuals worldwide each year.1–3 In recent years, the classification of renal cancer has been repeatedly revised based on its histological and genomic molecular features,4–7 and 16 different disease subtypes have been designated in the latest classification.7 Of these RCC subtypes, clear cell RCC is the most common, accounting for approximately 70–80% of the total cases,8,9 while papillary RCC (pRCC) (10–20%) and chromophobe RCC (chRCC) (> 5%) are predominant among non-ccRCC.10,11 Other subtypes, with an incidence of less than 1%, are rare and include translocation Xp11.2 or 6p21 RCC, collecting duct carcinoma, renal medullary carcinoma, and oncocytoma, among others.12
All RCCs in the lining of the proximal convoluted tubule, and even though they are clinically treated similarly, the complex heterogeneity between or within subtypes leads to different clinical outcomes.13–17 Several studies have used the epigenomics and gene transcriptomics approach to explore ccRCC, while non-ccRCC has received relatively less attention. However, non-ccRCC has a more complex tissue phenotype, intra-tumor heterogeneity, poor immunotherapy response, and prognosis. Therefore, studies evaluating the mechanisms underlying non-ccRCC are essential and may be beneficial for developing individualized treatment strategies and improving the clinical benefit of RCC patients.
RNA modifications are widely observed in nature. More than 170 types of RNA modifications in different types of RNAs, such as mRNA, tRNA, rRNA, snRNA, miRNA, and lncRNA, have been identified. N6-methyladenosine (m6A) is the most common form of RNA modification, accounting for approximately 60% of all modifications; it is dynamic and reversible.18–20 The m6A RNA modification involves three types of regulatory proteins—methyltransferases (writers), m6A binding proteins (readers), and demethylases (erasers).21
Methyltransferases are responsible for catalyzing the modification of m6A sites, while the demethylases play an opposite role and mediate the reversal of m6A modification. The m6A-binding proteins are mainly involved in the recognition of m6A methylation sites.22,23 m6A modifications are associated with several biological functions, including translation,24 nuclear export,25 RNA stability,24 and alternative splicing.26,27 In addition, m6A is also involved in regulating key cellular processes, such as stem cell renewal, cell differentiation, and DNA damage response.28
Several studies have reported that m6A modifications promote the development and progression of various malignancies by regulating gene expression and play a fundamental role in prognosis.18,29 However, little is known about the function of m6A modification and their associated genes in non-ccRCC. In this study, we systematically investigated the roles of 23 m6A regulators in non-ccRCC based on relevant data from The Cancer Genome Atlas (TCGA) database using bioinformatics scores.
Materials and Methods
Data Acquisition
All non-ccRCC-related data (RNA-seq transcriptome, genetic mutations, and corresponding clinical datasets) were obtained from the public network TCGA37 (https://portal.gdc.cancer.gov/repository), including 291 kidney renal papillary cell carcinoma (KIRP) samples and 113 kidney Chromophobe (KICH) samples. Copy number variation (CNV) data were obtained from the shared database (https://xena.ucsc.edu/). A total of 23 regulators were extracted from previous studies, including eight writers21 (METTL3, METTL14, METTL16, WTAP, VIRMA, ZC3H13, RBM15/RBM15B), 13 readers22 (YTHDC1/YTHDC2, YTHDF1/YTHDF2/YTHDF3, HNRNPC, FMR1, LRPPRC, HNRNPA2B1, IGFBP1/IGFBP2/IGFBP3, RBMX), and two erasers30 (FTO and ALKBH5).
Cluster Analysis Based on m6A Regulators
Gene expression levels were quantified using the metric log2 (TPM +1). Clustering analysis based on the expression levels of 23 m6A regulators was conducted using the ‘ConsensusClusterPlus 1.57.0’ R package. The optimal number of clusters was determined based on the Bayesian information criterion.
Estimation of Immune Infiltrating Cells
The single-sample gene-set enrichment analysis (ssGSEA) algorithm was used to quantify the relative abundance of each type of infiltrated immune cell in the non-ccRCC tumor microenvironment. The enrichment scores calculated by ssGSEA analysis were utilized to represent the relative abundance of each TME infiltrating cell in each sample. Based on a similar study by Charoen Tong, we evaluated a total of 22 types of immune cells,38,39 including activated CD8 T cell, natural killer T cell, regulatory T cell, activated dendritic cell, macrophage and so on.
Gene Set Variation Analysis (GSVA) and Functional Annotation
We used the “GSVA 1.41.3” R package to analyze the differences in pathways and biological processes with the different m6A modification patterns. Gene sets of “c2.cp.kegg.v7.4.symbols.gmt” and “c5.go.v7.4.symbols.gmt” were downloaded from the Molecular Signatures Database (MSigDB) (https://www.gsea-msigdb.org/gsea/index.jsp). P-values less than 0.05, after adjustment, were considered statistically significant.
Identification of Differentially Expressed Genes (DEGs) Among m6A Clusters
To identify m6A-related DEGs between different modification patterns, we used the Limma R package to perform a differential analysis of the two groups of m6A clusters.40 The significance criteria for determining DEGs were set as an adjusted P-value < 0.001.
Construction of the m6A Gene Signature
We computed the m6Ascore to quantify the m6A modification pattern in a single non-ccRCC sample. First, we performed a univariate Cox analysis on the DEGs of two m6A clusters (in the case of multiple clusters, considered the overlapping genes of every two clusters first and then the intersections) to clarify the relationship between the DEGs and prognosis. DEGs that significantly correlated with clinical prognosis were used for subsequent analyses (P < 0.001). We then performed principal component analysis (PCA) to construct the m6A correlation signature. Both principal components 1 and 2 were selected to act as signature scores. Finally, similar to the genomic grade index (GGI) approach, an m6Ascore was obtained for each sample.

Correlation Between m6Ascore and Other Relevant Phenotypes
The correlation between m6Ascore and other phenotypes was determined using Spearman correlation analysis. Clinical correlation survival analysis was performed based on the Kaplan-Meier curve using the Survival R package.
Statistical Analysis
The correlation between m6A regulators and immune infiltrating cells was calculated based on Spearman correlation analysis. One-way ANOVA and Kruskal–Wallis tests were used to compare differences among three or more groups.41 The optimal cut-off points for each data set subgroup were determined using the Survminer R package. The Kaplan-Meier method was used to plot prognosis-related survival curves, and the Log rank test was used to assess the significance of the differences. Univariate and multiple Cox regression models were used to assess the risk ratios between m6A-associated modifier genes and various phenotypes. The visualization of mutation data and CNV was done using the Maftools and RCircos R package, respectively. The aforementioned operations were performed using R software version 4.1.0, the statistical P values were all bilateral, and P < 0.05 was considered statistically significant.
Results
Molecular Characterization of m6A Regulators in Non-ccRCC
Based on previous studies, we identified 23 m6A regulators, including eight writers21 (METTL3, METTL14, METTL16, WTAP, VIRMA, ZC3H13, RBM15/RBM15B), 13 readers22 (YTHDC1/YTHDC2, YTHDF1/YTHDF2/YTHDF3, HNRNPC, FMR1, LRPPRC, HNRNPA2B1, IGFBP1/IGFBP2/IGFBP3, RBMX), and two erasers30 (FTO and ALKBH5). We first analyzed the prevalence of somatic mutations and CNV in the 23 m6A regulators in non-ccRCC. We found that the frequency of both, somatic mutations and CNV in non-ccRCC, was low, and only a few genes showed copy number amplification or deletion (Figure 1A and B, Figure S1A). KIRP has a higher mutation frequency than KICH (Figure S1B), however, the total mutation rate in KIRP samples did not exceed 8% (Figure 1C). In addition, we compared the differential expression of m6A regulators in normal and tumor tissues in non-ccRCC. We found that expression levels of 17 out of the 23 regulators were significantly different in non-ccRCC (Figure 1D). The above results suggest significantly heterogenous tumorigenesis in patients with non-ccRCC and that gene mutations and CNV are not always the main causes of non-ccRCC, and instead, aberrant modifications of m6A regulators may be crucial in non-ccRCC. We also explored the correlation between m6A regulators and non-ccRCC prognosis and constructed a prognostic correlation network graph (Figure 1E). We found that 17 out of the 23 m6A regulator expression variants had significant oncogenic properties associated with the poor prognosis of non-ccRCC and a synergistic relationship was observed among m6A readers, erasers, and writers. Of these 17 regulators, abnormal modifications of IGFBP2/IGFBP3, VIRMA, RBM15, and RBMX genes play an important role in non-ccRCC and are strongly associated with poor prognosis.
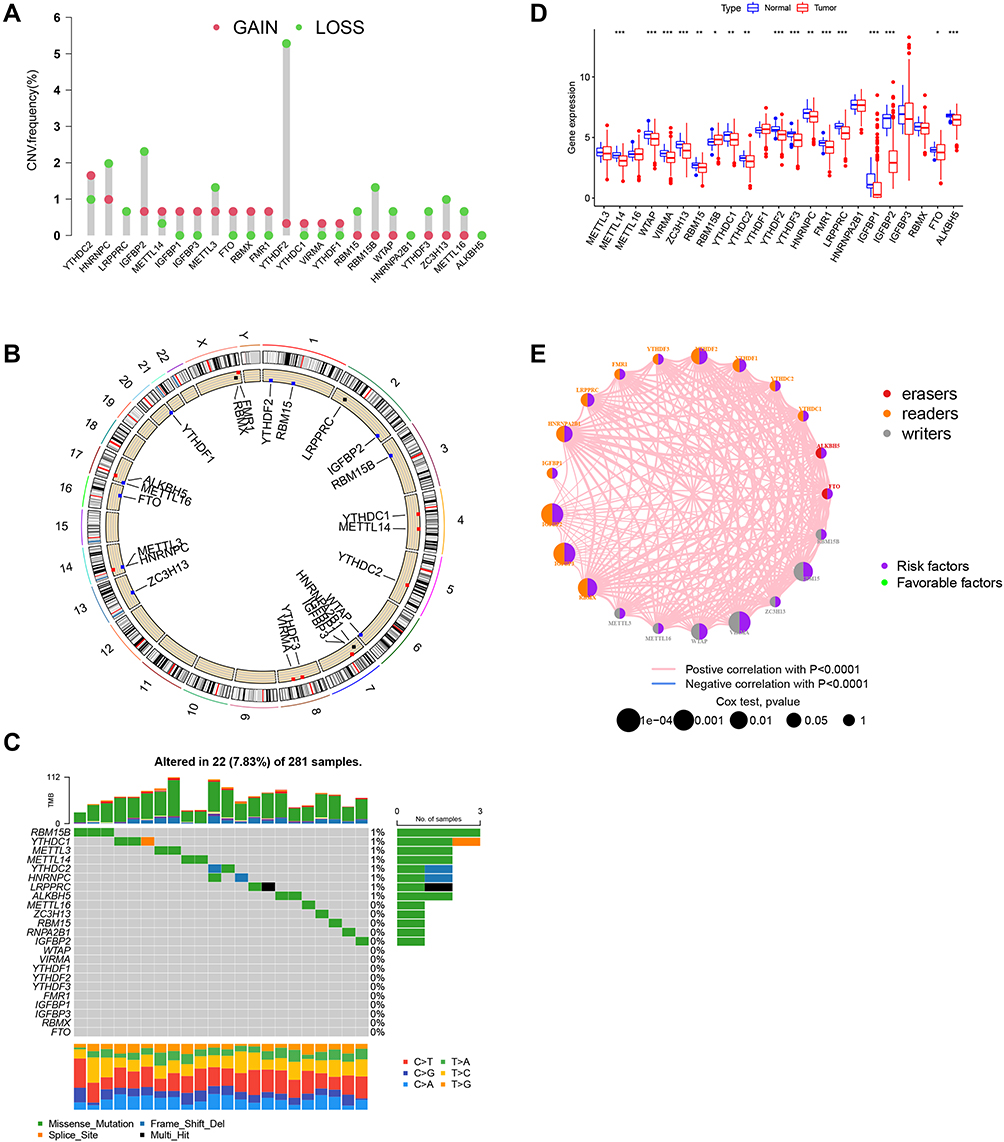 |
Figure 1 Molecular characteristics and clinical relevance of m6A regulators in non-ccRCC. (A) Dumbbell plot depicting the copy number variation (CNV) alteration frequency of m6A regulators in kidney renal papillary cell carcinoma. Amplification frequencies are marked with red dots and deletion frequencies are marked with blue dots. (B) CNV alterations of m6A regulators on 23 chromosomes in the TCGA-KIRP cohort. (C) Mutation frequency of m6A regulators in KIRP. (D) Gene expression alterations among m6A regulators. (E) Interaction of m6A regulators in ccRCC. Erasers are indicated in red readers are indicated in yellow, and writers are indicated in blue. The size of each circle represents the survival impact of each m6A regulator. Green dots represented favorable and purple represent risk factors of overall survival. The lines connecting m6A regulators present their interactions, and the thickness of the lines correspond to the correlation strength among the. regulators. Positive correlation is indicated in red and negative in blue. *P < 0.05; **P < 0.01; ***P < 0.001. |
Sample Clustering Based on 23 m6A Regulators
Based on the expression levels of the 23 m6A regulators, we clustered the non-ccRCC samples (Figure 2A–C). The 357 samples were split into two clusters (m6A cluster_A and m6A cluster_B). To investigate the clinical significance of the two subtypes, we first performed a survival analysis of the two sample groups. We found that m6Acluster_A had a significant (P < 0.001) survival advantage over m6A cluster_B (Figure 2D). We then investigated the expression of m6A regulators in the two clusters. As shown in Figure 2E, almost all the m6A regulators were highly expressed in m6A cluster_B. To further investigate whether there are differences in relevant functions and pathways between the different subtypes, we next conducted a GSVA. We found that gene transcription, cell differentiation, and other related pathways including the cell cycle, basal transcription factors, spliceosome, RNA degradation, regulation of gene expression, epigenetics, mRNA transport, and Notch signaling pathway (Figure 2F and G), were abnormally enriched in samples that formed the m6A cluster_B. The m6A cluster_A was mainly enriched in some metabolism-related pathways, such as phenylalanine metabolism, tyrosine metabolism, and drug metabolism. This suggests that in non-ccRCC patients, aberrant modifications of RNA have different functions that affect transcriptional activity by regulating upstream pathways on the one hand and that affect metabolism by regulating downstream pathways on the other. Therefore, we postulate that aberrant RNA modifications that regulate upstream pathways have a higher malignant potential and affect prognosis more than those that regulate downstream pathways.
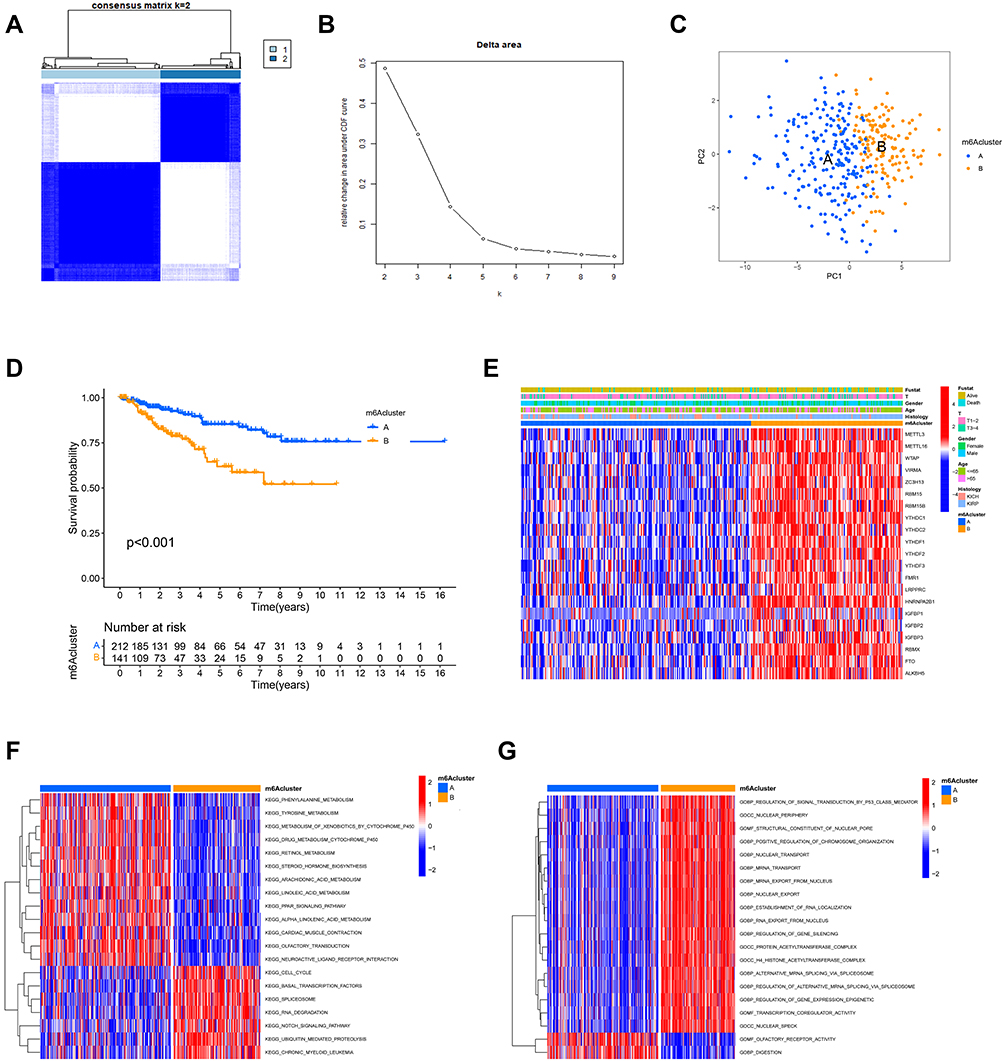 |
Figure 2 Typing and biological properties of m6A methylation modifications in non-ccRCC. (A) Consensus clustering matrix for k = 2. (B) Relative change in area under the CDF curve for k = 2–9. (C) Principal component analysis of non-ccRCC samples from TCGA dataset. (D) Survival curve for the two clusters (m6A cluster-A, blue; m6A cluster-B, yellow) of non-ccRCC patients. (E) Comparison of heatmap and clinicopathological features between different subtypes. Red indicates upregulated regulators and green indicates downregulated regulators. The intensity of the shade corresponds to the expression. The m6A cluster, fustat, T stage, gender, age, and histology were used as patient annotations. (F and G) Heat map demonstrating the differences in biological processes between different m6A clusters. Red indicates activation and blue indicates inhibition of biological processes. F shows the KEGG and G shows the BP analysis respectively. |
Immunological Characteristics in Different Subtypes of m6A
To determine whether infiltrating immune cells between the different m6Aclusters in the non-ccRCC tumor microenvironment (TME) are different, we conducted a ssGSVA. We found that the immune cell infiltration characteristics in the two m6A modification patterns were different (Figure 3). The m6Acluster_A was abundant in natural immune infiltrating cells, including activated CD8+ T cells, monocytes, CD56 dim/bright natural killer cells (NK), and eosinophils. The m6Acluster_B was abundant in acquired immune cells, including Th17 cells, Th2 cells, immature dendritic cells (DCs), neutrophils, and plasmacytoid dendritic cells. This may explain the better survival advantage of cluster A patient. It has previously been reported that the degree of Th2 cell infiltration and IGF2BP3 expression are positively correlated with and impaired survival is observed in anti-PD-1 cohorts.31 Our observation in the m6Acluster_B corroborates this finding. In conclusion, different m6A modification patterns lead to different patterns of immune cell infiltration that ultimately alter the prognostic outcome of patients.
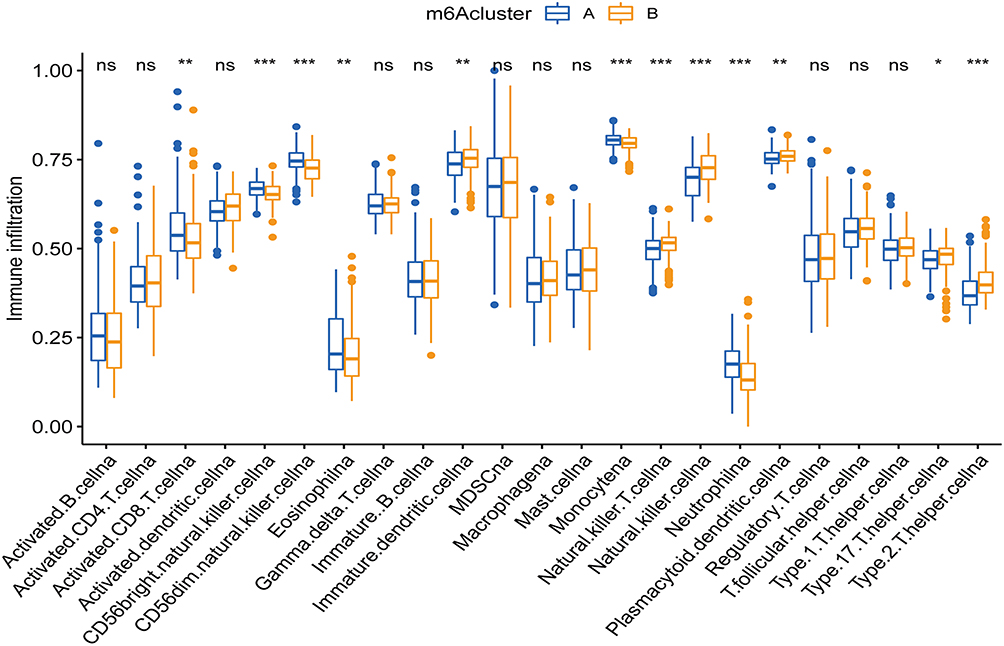 |
Figure 3 Box plot comparing the abundance of immune cell infiltrates between different m6Aclusters. The upper and lower ends of the boxes represented the interquartile range. The lines in the boxes represented median value, and blue(yellow) dots indicate outliers. The asterisks represent the statistical p-value. *P < 0.05; **P < 0.01; ***P < 0.001. |
Genomic Typing and Clinical Features of m6A Characteristic Genes
To investigate the potential biological consequences under different m6A modification patterns, we identified 1251 phenotypically related differential genes based on the Limma R package and conducted Gene Ontology (GO) and Kyoto Encyclopedia of Genes and Genomes (KEGG) enrichment analysis. Notably, we observed an enrichment of tumor-associated biological behaviors such as cell development, proliferation, differentiation, and migration, including the development of the renal system, ameboidal-type cell migration, PI3K-Akt signaling pathway, and TGF-β signaling pathway (Figure 4A and B, Figure S1C). Additionally, we found considerable activation of the cellular matrix environment, such as cellular matrix organization, cytoarchitectonic organization, skeletal system development, cell-substrate adhesion, and growth factor binding (Figure S1D). We then subjected 1251 identified differential genes to unsupervised clustering analyses and successfully classified the samples into three genomic subtypes (gene Cluster A-C) (Figure 4C). Although the clustering grouping with m6A modification pattern was slightly different, we found that (Figure 4D) geneCluster C had the same m6A modification pattern as m6A cluster_B, and geneCluster A-B had the same modification pattern as m6A cluster A. Notably, all TCGA-KICH samples were distributed in geneCluster_A with the same methylation modification pattern. Whereas TCGA-KIRP samples were distributed in different gene clusters (B-C) with different m6A modification patterns. These results suggest that there are different RNA methylation modification patterns and regulatory mechanisms in the same pathological subtype of RCC (pRCC) and highlight again, the obvious heterogeneity of tumorigenesis. The survival analysis of the three gene clusters also showed significant survival differences, with geneCluster A-B having a significant survival advantage over geneCluster_C (Figure 4E). Significant variability in the expression of m6A regulators was also observed (Figure 4F), which is consistent with the expected results for the m6A methylation modification pattern.
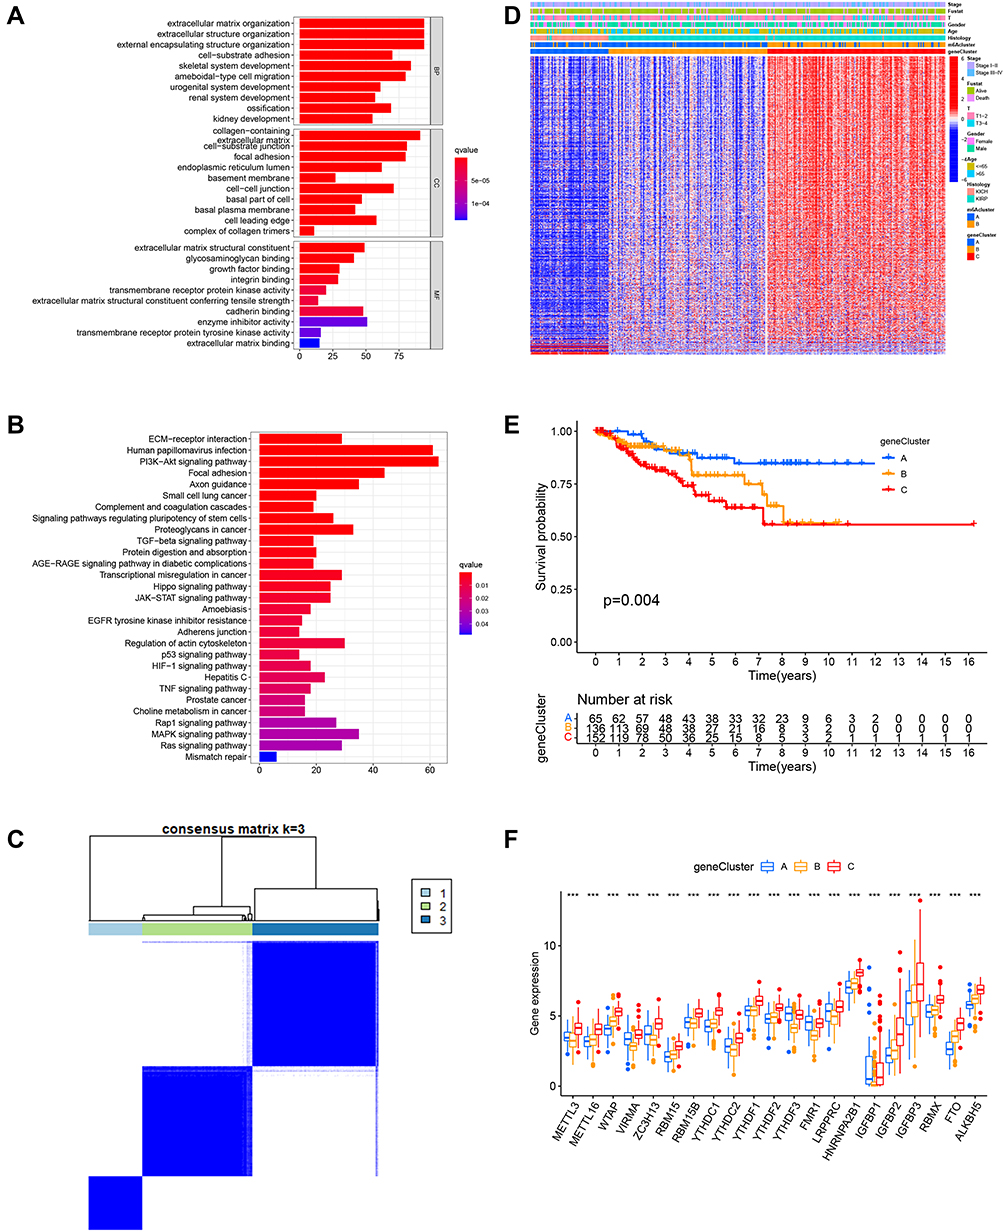 |
Figure 4 Genomic typing and clinical features of m6A characteristic genes. (A and B) Depict GO and KEGG analysis of m6A characteristic differential genes, respectively. (C) Consensus clustering matrix for k = 3. (D) Heat map of unsupervised clustering of characteristically different genes dividing the sample into geneCluster A–C. The m6Acluster, fustat, stage, gender, age, and histology were used as patient annotations. (E) Survival curve for geneClusters (geneCluster_A, blue; geneCluster_B, yellow; geneCluster_C, red) of non-ccRCC patients. (F) Box plot of differential expression of m6A-related regulators in genecluster A–C. The lines in the boxes represented median value, and blue(red) dots indicate outliers. The asterisks represented the statistical p-value. ***P < 0.001. |
m6Ascore Signature and Related Prognostic Value
Considering that the aforementioned findings are based on population studies and cannot accurately predict the m6A methylation modification patterns in individual samples, we computed the m6Ascore to further assess the m6A modification patterns of individual non-ccRCC patients. Univariate Cox regression analysis was first performed on 1251 differential genes associated with m6Acluster typing, and 714 prognosis-associated genes were extracted (P < 0.001) for conducting a PCA to establish the m6Agene signature. Samples were divided into two groups—high-m6Ascore and low-m6Ascore, according to the optimal cutoff value. Survival analysis (Figure 5A) revealed that the low-m6Ascore group showed significantly better survival than the high-m6Ascore group (P < 0.01), with a significant difference in 5-year survival (70% vs 20%), suggesting that the m6Ascore signature has potential prognostic value as a biomarker. Furthermore, including m6Ascore, clinical stage, sex, and age in multivariate Cox analysis, the m6Ascore was able to act as an independent prognostic factor for non-ccRCC (Figure 5B). Visualizing the relationship between m6Acluster, m6Ascore, and survival status of non-ccRCC patients (Figure 5C), we observed that almost all samples in the m6Acluster_B group were distributed in the high-m6Ascore region, while the highest proportion of patients who died originated from the high-m6Ascore group. Subsequently, we analyzed the correlation of m6Ascore with immune cells (Figure 5F). The results showed that the m6Ascore was positively correlated with Th17 and Th1 and negatively correlated with eosinophils, CD56dim NK cells, and neutrophils. In addition, both m6Acluster_B and geneCluster C had a higher m6Ascore than the other subtypes, and the difference was significant (Figure 5D and E). Investigating the correlation between m6Ascore and mutational load we found a significant survival impairment in the H-TMB+H-m6Ascore group (P < 0.01) (Figure 6A). We further analyzed the correlation between m6Ascore and clinical phenotype, and significant differences were also observed (Figure 6B–D). To further explore the response of non-ccRCC to immunotherapy, we compared the differential PD-L1 expression between the high- and low-m6Ascore subgroups. The results did not reveal any significant differences in expression (Figure 6E).
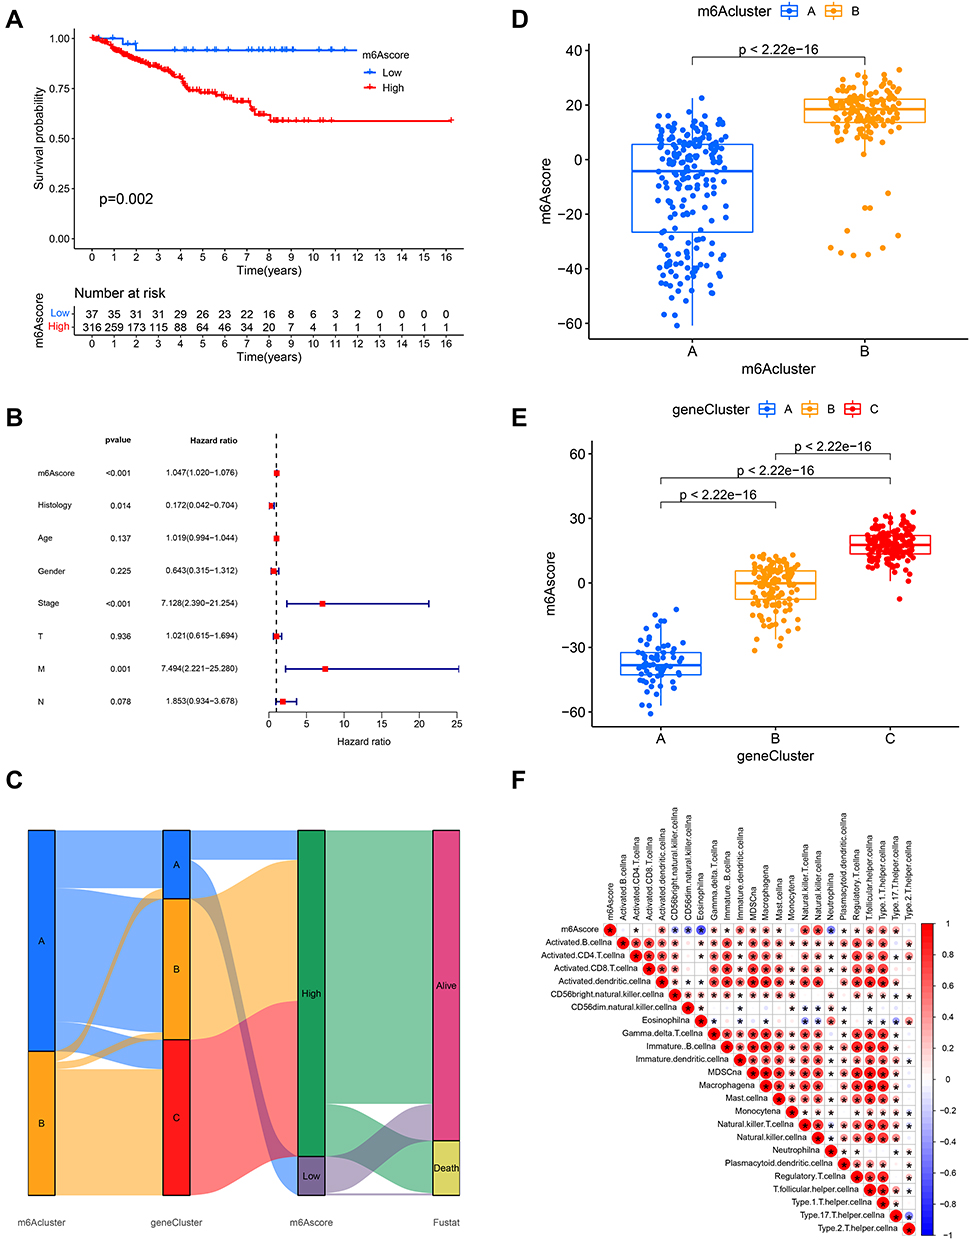 |
Figure 5 m6Ascore signature and related prognostic value. (A) Survival curve based on m6Ascore (blue, low- m6Ascore group; red, high-m6Ascore group). (B) Forest plot of multivariate Cox regression analysis for m6Ascore in TCGA (non-ccRCC) cohort. (C) Alluvial diagram depicting the relationship between m6Aclusters, geneClusters, m6Ascore, and fustat. (D and E) Differences in m6Ascore between m6Aclusters (geneClusters) in TCGA cohort. P < 0.001, Kruskal–Wallis test. (F) Relationship between m6Ascore and immune cells, red represents positive and blue represents negative correlation. |
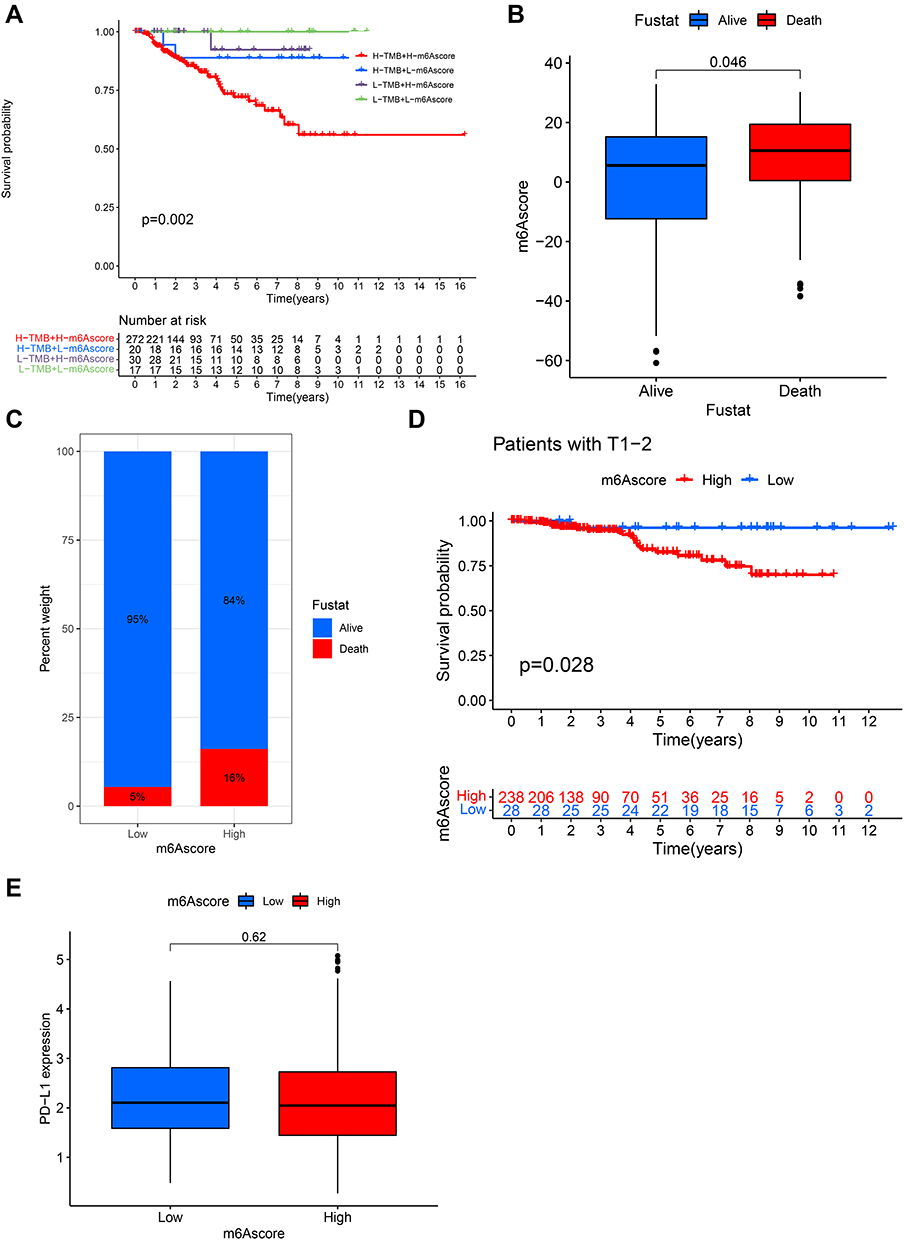 |
Figure 6 Clinical phenotypes associated with the m6Ascore. (A) Survival curves based on H/L-TMB and H/L-m6Ascore grouping. (B) Comparison of differences in m6Ascore between different survival states. (C) Comparison of survival rates between the high- and low-m6Ascore groups. (D) Comparison of survival differences between the high- and low-m6Ascore groups in T1-2 staging. (E) Comparison of differential PD-L1 expression between the high-m6A and low-m6Ascore groups. |
Discussion
Several studies have reported the fundamental role of m6A modifications in development of various diseases, including cancers. However, most studies have mainly focused on the effect of a single m6A regulon on tissue morphological phenotypes or disease phenotypes. A comprehensive understanding of how multiple regulators synergistically influence disease phenotypes is lacking. Clarifying the interrelationship between different regulators, methylation patterns, and disease phenotypes can help us gain a comprehensive understanding of pathogenesis, as well as, facilitate the formulation of individualized medical strategies for better prognosis.
In this study, we first identified two m6A-RNA modification patterns in non-ccRCC based on 23 m6A regulators. Subsequently, we clustered the samples into three gene clusters based on differentially expressed m6A signature genes. Notably, m6A_geneCluster C had the same methylation modification pattern and poorer prognosis as m6ACluster_B, while m6A_geneCluste A-B had the same methylation modification pattern and better prognosis as m6Acluster_A (Figure 4D). Surprisingly, all pathological types of chRCC (KICH) fit almost perfectly with m6A_geneClusterA. This suggests that the methylation modification pattern of RNA in non-ccRCC cells is consistent with the pathological tissue phenotype. We also observed that pathological tissue typing for pRCC (KIRP) corresponded to two methylation modification patterns, as well as m6A_geneCluste B-C.
According to the 2016 version of the WHO renal tumor classification, pRCC can be divided into pRCC-I and pRCC-II; pRCC-I has a better prognosis than pRCC-II. In this context, we speculate that geneClusterB and geneClusterC may correspond to the clinicopathological types of pRCC-I and pRCC-II, respectively. This further suggests that m6A methylation modifications play a decisive role in regulating the histopathological phenotype as well as the prognostic process of tumors. In addition, we found that the methylation modification pattern and prognosis of gene cluster_B was closer to that of gene cluster_A among the three gene clusters. That is, some samples of pRCC (probably pRCC- I) and chRCC have similar modification patterns and prognoses. This suggests that the use of methylation modification patterns as a typing criterion in histotyping may more accurately reflect the prognosis of patients with non-ccRCC.
The unexpected finding of our study that m6A-based genetic cluster typing is highly compatible with non-ccRCC pathological types may not be just a coincidence but some as yet unknown correspondence between m6A genotypes and extrinsic pathological phenotypes. It is well known that pathological type is inextricably linked to clinical prognosis, and m6A is reversibly modified, whether the survival prognosis of patients can be improved by changing m6A modification is unknown, but from the perspective of scientific research, this may provide a novel idea for future individualized treatment of tumors. In addition, m6A-based genotyping for non-ccRCC may have more prognostic value than clinicopathological classification and may serve as an important reference for new non_ccRCC typing.
Analysis of non-ccRCC TME immune-infiltrated cells revealed that the relative enrichment of natural immune cells in m6Acluster_A was associated with better prognosis, while the relative enrichment of acquired immune cells in m6Acluster_B was associated with poorer prognosis. However, no enrichment of immune-related pathways was observed when GSVA was performed. This is in contrast to ccRCC, where infiltration of a large number of immune cells (immunoinflammatory phenotype),32–34 as well as considerable enrichment of immune activation-related pathways,35 is observed. Notably, in the subsequent GO/KEGG analysis of m6A characteristic differential genes (Figure 4B), we observed a significant enrichment of the TGF-β signaling pathway, which is thought to be a major contributor to the immune-excluded phenotype. The immune rejection phenotype is characterized by significant immunosuppression. Although rejection phenotype is also infiltrated with abundant immune cells, they are mainly distributed in the stroma around the tumor rather than in the tumor parenchyma and do not exert an effective anti-tumor effect, and the immune-excluded phenotype is also associated with a lack of activated T cells.32 We also observed a significant enrichment of biological processes such as matrix activation in the GO analysis (Figure 4A), and previous studies have confirmed that matrix activation has an immunosuppressive profile. In addition, we observed a significant increase in Th2 cell content in m6Acluster_B. Th2 cell infiltration, a marker of immune tolerance has been reported to be positively associated with methylation modifications mediated by high IGF2BP3 expression and to influence poor prognosis after PD-1 blockade.36 This suggests a fundamental role of m6A modification in the development of an immune-excluded phenotype in non-ccRCC. We also revealed the relationship between different m6A modification patterns and tumor immune infiltration heterogeneity. Whether altering m6A modification or inhibiting matrix activation may improve the sensitivity of immunotherapy to improve survival rates in patients with immune rejection such as non-ccRCC has not yet been established but may be a potential treatment in the future.
We used the m6Ascore to assess methylation patterns in individual samples and to eliminate the effect of heterogeneous factors in the overall sample. The combined analysis revealed that m6Ascore had the ability to independently predict patient survival and show significant survival differences across patients with different T stages (Figure 6D). Although there was no direct correlation between the m6Ascore and tumor burden mutation (Figure S1E), H-TMB combined with H-m6Ascore showed a significant survival disadvantage. We also analyzed the relationship between m6Ascore and PDL1 expression and no significant correlation was found between the high or low m6Ascore and PDL1 expression. These results suggest that ccRCC and non-ccRCC may have different m6A methylation modification patterns, regulating different immune phenotypes. Our study is limited in that it does not involve a larger sample size due to the low prevalence of non-ccRCC, as well as because our data included only pRCC and chRCC under non-ccRCC.
Conclusions
Overall, our study unravels the important role of m6A methylation modifications in non-ccRCC and deepens the understanding of the pattern of immune infiltration in non-ccRCC. In particular, m6A-based gene clusters were found to be highly correlated with clinicopathological types, as well as significant prognostic differences. This provides a new perspective for the development of individualized medical strategies.
Abbreviations
m6A, N6-methyladenosine; ccRCC, clear cell renal cell carcinoma; TCGA, The Cancer Genome Atlas; TME, tumor microenvironment; KEGG, Kyoto Encyclopedia of Genes and Genomes.
Data Sharing Statement
All analyzed or generated data have been incorporated in the published paper and its Supplementary Material file.
Ethics Approval
The experiments were conducted under protocols approved by the Ethics committee of Guangxi Medical University.
Acknowledgments
We thank the staff in the Centre for Genomic and Personalized medicine Guangxi Medical University for supporting the research.
Author Contributions
All authors contributed to data analysis, drafting or revising the article, have agreed on the journal to which the article was submitted, gave final approval of the version to be published, and agree to be accountable for all aspects of the work.
Funding
This work was funded by grant from Guangxi Autonomous Region Health Care Commission self-financed research projects (No. Z20200131).
Disclosure
The authors report no conflicts of interest for this work and declare that the research was conducted in the absence of any commercial or financial relationships that could be construed as a potential conflict of interest.
References
1. Bray F, Ferlay J, Soerjomataram I, Siegel R, Torre L, Jemal A. Global cancer statistics 2018: GLOBOCAN estimates of incidence and mortality worldwide for 36 cancers in 185 countries. CA Cancer J Clin. 2018;68(6):394–424.
2. Siegel R, Miller K, Jemal A. Cancer statistics, 2018. CA Cancer J Clin. 2018;68(1):7–30.
3. Saad A, Gad M, Al-Husseini M, Ruhban I, Sonbol M, Ho T. Trends in renal-cell carcinoma incidence and mortality in the United States in the last 2 decades: a SEER-based study. Clin Genitourin Cancer. 2019;17(1):46–57. doi:10.1016/j.clgc.2018.10.002
4. Kovacs G, Akhtar M, Beckwith B, et al. The Heidelberg classification of renal cell tumours. J Pathol. 1997;183(2):131–133. doi:10.1002/(SICI)1096-9896(199710)183:2<131:AID-PATH931>3.0.CO;2-G
5. Lopez-Beltran A, Scarpelli M, Montironi R, Kirkali Z. 2004 WHO classification of the renal tumors of the adults. Eur Urol. 2006;49(5):798–805. doi:10.1016/j.eururo.2005.11.035
6. Srigley J, Delahunt B, Eble J, et al. The International Society of Urological Pathology (ISUP) vancouver classification of renal neoplasia. Am J Surg Pathol. 2013;37(10):1469–1489. doi:10.1097/PAS.0b013e318299f2d1
7. Moch H, Cubilla A, Humphrey P, Reuter V, Ulbright T. The 2016 WHO classification of tumours of the urinary system and male genital organs-part A: renal, penile, and testicular tumours. Eur Urol. 2016;70(1):93–105. doi:10.1016/j.eururo.2016.02.029
8. Chen F, Zhang Y, Şenbabaoğlu Y, et al. Multilevel genomics-based taxonomy of renal cell carcinoma. Cell Rep. 2016;14(10):2476–2489. doi:10.1016/j.celrep.2016.02.024
9. Ricketts C, De Cubas A, Fan H, et al. The cancer genome atlas comprehensive molecular characterization of renal cell carcinoma. Cell Rep. 2018;23(1):313–326.
10. Lee BH. Commentary on: “Comprehensive molecular characterization of papillary renal-cell carcinoma.” Cancer Genome Atlas Research Network.: N Engl J Med. 2016 Jan 14;374(2):135-45. Urol Oncol. 2017;35(9):578–579. doi:10.1016/j.urolonc.2017.07.022
11. Davis C, Ricketts C, Wang M, et al. The somatic genomic landscape of chromophobe renal cell carcinoma. Cancer Cell. 2014;26(3):319–330. doi:10.1016/j.ccr.2014.07.014
12. Chen Y, Xu J, Skanderup A, et al. Molecular analysis of aggressive renal cell carcinoma with unclassified histology reveals distinct subsets. Nat Commun. 2016;7:13131.
13. Gerlinger M, Rowan A, Horswell S, et al. Intratumor heterogeneity and branched evolution revealed by multiregion sequencing. N Engl J Med. 2012;366(10):883–892. doi:10.1056/NEJMoa1113205
14. Gerlinger M, Horswell S, Larkin J, et al. Genomic architecture and evolution of clear cell renal cell carcinomas defined by multiregion sequencing. Nat Genet. 2014;46(3):225–233. doi:10.1038/ng.2891
15. Sankin A, Hakimi AA, Mikkilineni N, et al. The impact of genetic heterogeneity on biomarker development in kidney cancer assessed by multiregional sampling. Cancer Med. 2014;3(6):1485–1492. doi:10.1002/cam4.293
16. Hsieh JJ, Chen D, Wang PI, et al. Genomic biomarkers of a randomized trial comparing first-line everolimus and sunitinib in patients with metastatic renal cell carcinoma. Eur Urol. 2017;71(3):405–414. doi:10.1016/j.eururo.2016.10.007
17. Choueiri TK, Motzer RJ. Systemic therapy for metastatic renal-cell carcinoma. N Engl J Med. 2017;376(4):354–366. doi:10.1056/NEJMra1601333
18. Chen Y, Zhou C, Sun Y, He X, Xue D. m(6)A RNA modification modulates gene expression and cancer-related pathways in clear cell renal cell carcinoma. Epigenomics. 2020;12(2):87–99. doi:10.2217/epi-2019-0182
19. Zhao BS, Roundtree IA, He C. Post-transcriptional gene regulation by mRNA modifications. Nat Rev Mol Cell Biol. 2017;18(1):31–42.
20. Chen M, Nie ZY, Wen XH, Gao YH, Cao H, Zhang SF. m6A RNA methylation regulators can contribute to malignant progression and impact the prognosis of bladder cancer. Biosci Rep. 2019;39:12. doi:10.1042/BSR20192892
21. Yang Y, Hsu PJ, Chen YS, Yang YG. Dynamic transcriptomic m(6)A decoration: writers, erasers, readers and functions in RNA metabolism. Cell Res. 2018;28(6):616–624.
22. Chen XY, Zhang J, Zhu JS. The role of m(6)A RNA methylation in human cancer. Mol Cancer. 2019;18(1):103. doi:10.1186/s12943-019-1033-z
23. Li Y, Xiao J, Bai J, et al. Molecular characterization and clinical relevance of m(6)A regulators across 33 cancer types. Mol Cancer. 2019;18(1):137. doi:10.1186/s12943-019-1066-3
24. Wang X, Lu Z, Gomez A, et al. N6-methyladenosine-dependent regulation of messenger RNA stability. Nature. 2014;505(7481):117–120. doi:10.1038/nature12730
25. Roundtree IA, Luo GZ, Zhang Z, et al. YTHDC1 mediates nuclear export of N(6)-methyladenosine methylated mRNAs. eLife. 2017;6:e31311.
26. Bartosovic M, Molares HC, Gregorova P, Hrossova D, Kudla G, Vanacova S. N6-methyladenosine demethylase FTO targets pre-mRNAs and regulates alternative splicing and 3’-end processing. Nucleic Acids Res. 2017;45(19):11356–11370.
27. Xiao W, Adhikari S, Dahal U, et al. Nuclear m(6)A reader YTHDC1 regulates mRNA splicing. Mol Cell. 2016;61(4):507–519. doi:10.1016/j.molcel.2016.01.012
28. Pinello N, Sun S, Wong JJ. Aberrant expression of enzymes regulating m(6)A mRNA methylation: implication in cancer. Cancer Biol Med. 2018;15(4):323–334. doi:10.20892/j.issn.2095-3941.2018.0365
29. Dominissini D, Moshitch-Moshkovitz S, Schwartz S, et al. Topology of the human and mouse m6A RNA methylomes revealed by m6A-seq. Nature. 2012;485(7397):201–206. doi:10.1038/nature11112
30. Tong J, Flavell R, Li H. RNA mA modification and its function in diseases. Front Med. 2018;12(4):481–489. doi:10.1007/s11684-018-0654-8
31. Zhong J, Liu Z, Cai C, Duan X, Deng T, Zeng G. mA modification patterns and tumor immune landscape in clear cell renal carcinoma. J Immunother Cancer. 2021;9:2. doi:10.1136/jitc-2020-001646
32. Chen DS, Mellman I. Elements of cancer immunity and the cancer-immune set point. Nature. 2017;541(7637):321–330. doi:10.1038/nature21349
33. Turley SJ, Cremasco V, Astarita JL. Immunological hallmarks of stromal cells in the tumour microenvironment. Nat Rev Immunol. 2015;15(11):669–682.
34. Gajewski TF, Woo SR, Zha Y, et al. Cancer immunotherapy strategies based on overcoming barriers within the tumor microenvironment. Curr Opin Immunol. 2013;25(2):268–276. doi:10.1016/j.coi.2013.02.009
35. Zhang B, Wu Q, Li B, Wang D, Wang L, Zhou YL. m(6)A regulator-mediated methylation modification patterns and tumor microenvironment infiltration characterization in gastric cancer. Mol Cancer. 2020;19(1):53. doi:10.1186/s12943-020-01170-0
36. Chtanova T, Mackay CR. T cell effector subsets: extending the Th1/Th2 paradigm. Adv Immunol. 2001;78:233–266.
37. Colaprico A, Silva TC, Olsen C, et al. TCGAbiolinks: an R/Bioconductor package for integrative analysis of TCGA data. Nucleic Acids Res. 2016;44(8):e71. doi:10.1093/nar/gkv1507
38. Charoentong P, Finotello F, Angelova M, et al. Pan-cancer immunogenomic analyses reveal genotype-immunophenotype relationships and predictors of response to checkpoint blockade. Cell Rep. 2017;18(1):248–262. doi:10.1016/j.celrep.2016.12.019
39. Barbie DA, Tamayo P, Boehm JS, et al. Systematic RNA interference reveals that oncogenic KRAS-driven cancers require TBK1. Nature. 2009;462(7269):108–112. doi:10.1038/nature08460
40. Ritchie ME, Phipson B, Wu D, et al. limma powers differential expression analyses for RNA-sequencing and microarray studies. Nucleic Acids Res. 2015;43(7):e47. doi:10.1093/nar/gkv007
41. Hazra A, Gogtay N. Biostatistics series module 3: comparing groups: numerical variables. Indian J Dermatol. 2016;61(3):251–260. doi:10.4103/0019-5154.182416
 © 2022 The Author(s). This work is published and licensed by Dove Medical Press Limited. The full terms of this license are available at https://www.dovepress.com/terms.php and incorporate the Creative Commons Attribution - Non Commercial (unported, v3.0) License.
By accessing the work you hereby accept the Terms. Non-commercial uses of the work are permitted without any further permission from Dove Medical Press Limited, provided the work is properly attributed. For permission for commercial use of this work, please see paragraphs 4.2 and 5 of our Terms.
© 2022 The Author(s). This work is published and licensed by Dove Medical Press Limited. The full terms of this license are available at https://www.dovepress.com/terms.php and incorporate the Creative Commons Attribution - Non Commercial (unported, v3.0) License.
By accessing the work you hereby accept the Terms. Non-commercial uses of the work are permitted without any further permission from Dove Medical Press Limited, provided the work is properly attributed. For permission for commercial use of this work, please see paragraphs 4.2 and 5 of our Terms.