")
Back to Journals » Cancer Management and Research » Volume 12
Molecular Alterations in Circulating Cell-Free DNA in Patients with Colorectal Adenoma or Carcinoma
Authors Hu Y, Chen Y, Guo H, Yu J, Chen Y, Liu Y, Lan L, Li J, Wang H, Zhang H
Received 2 January 2020
Accepted for publication 27 April 2020
Published 30 June 2020 Volume 2020:12 Pages 5159—5167
DOI https://doi.org/10.2147/CMAR.S244520
Checked for plagiarism Yes
Review by Single anonymous peer review
Peer reviewer comments 2
Editor who approved publication: Dr Antonella D'Anneo
Ying Hu,1,* Yawei Chen,2,* Hao Guo,2 Jianing Yu,2 Yanhui Chen,3 Yang Liu,2 Ling Lan,4 Jian Li,5 Huaqing Wang,6 Henghui Zhang3
1Center of Integrative Medicine, Beijing Ditan Hospital, Capital Medical University, Beijing 100015, People’s Republic of China; 2Genecast Precision Medicine Technology Institute, Beijing 100000, People’s Republic of China; 3Institute of Infectious Diseases, Beijing Ditan Hospital, Capital Medical University, Beijing Key Laboratory of Emerging Infectious Diseases, Beijing 100015, People’s Republic of China; 4Department of Gastroenterology, Zhengzhou University People’s Hospital, Zhengzhou 450003, People’s Republic of China; 5Department of General Surgery, The Affiliated Cancer Hospital of Zhengzhou University (Henan Cancer Hospital), Zhengzhou 450000, People’s Republic of China; 6Department of Medical Oncology, Tianjin Union Medical Center, The Affiliated Hospital of Nankai University, Tianjin 300000, People’s Republic of China
*These authors contributed equally to this work
Correspondence: Huaqing Wang; Henghui Zhang Email [email protected]; [email protected]
Purpose: The aim of this study was to evaluate the clinical value of plasma cell-free DNA (cfDNA) in the diagnosis of colorectal cancer (CRC).
Patients and Methods: The plasma cfDNA and tissue DNA mutation profiles were investigated in 77 patients (9 colon polyps, 18 colon adenoma, 26 colon cancer, and 24 rectal cancer) by a cancer gene-targeted NGS panel.
Results: During the progression from adenoma to carcinoma, mutations occur in genes such as RAS, Wnt, Hippo, Nrf2, TGFβ, PI3K, Notch, and P53, as well as in those encoding cell cycle pathway components. The somatic mutation burden and plasma cfDNA concentration were significantly higher in the colon carcinoma group than in the adenoma and colon polyp groups. The combination of plasma cfDNA concentration, CEA, and cfDNA had a significantly greater area under the curve than cfDNA or CEA alone. Right-sided colon cancer tissues showed a greater distribution of somatic mutations among more genes than left-sided colon cancer tissues. In addition, tissue tumor mutational burden (TMB) was higher in the right-sided colon cancer group than in the rectal cancer or left-sided colon cancer group (P< 0.05).
Conclusion: These results may indicate that somatic mutations in plasma cfDNA are potential biomarkers for the diagnosis of CRC. In addition, somatic mutations may be distributed in more genes and pathways in right-sided colon cancer than in left-side colon cancer.
Keywords: molecular alterations, cell-free DNA, diagnosis, colorectal adenoma, colorectal cancer
Introduction
Colorectal cancer (CRC) has become one of the most common malignancies in the world. Approximately 85% of CRCs are thought to arise from adenomas.1 Sequencing studies have illustrated that somatic mutations in driver genes play a key role in the adenoma-to-carcinoma progression of CRC through the chromosomal instability and microsatellite instability pathways. Most CRC cases are diagnosed at a late stage. Researchers have recently begun to focus on investigating noninvasive biomarkers of molecular alterations to promote screening and detection in the early stages of CRC.
In 1948, plasma circulating cell-free DNA (cfDNA, non-cell-bound nucleic acid) was observed in the blood circulation of a person with cancer for the first time.2 It has been demonstrated that plasma cfDNA can serve as a biomarker for screening for diagnosis, predicting the treatment response, monitoring the tumor burden and making an early diagnosis of relapse.3–5
The plasma DNA changes that occur during progression from the polyp and adenoma stages to the carcinoma stage remain poorly understood. In this study, we explored plasma DNA mutations that occur with CRC progression and evaluated the clinical value of plasma cfDNA in the diagnosis of CRC. In addition, we aimed to illustrate the different mutation profiles of left-sided and right-sided colon and rectal carcinoma.
Patients and Methods
Subjects and Sample Collection
All subjects were patients at Tianjin Union Medical Center, the Affiliated Hospital of Nankai University, between March 2016 and January 2017. This patient series included 9 cases of colon polyps, 18 cases of colon adenoma, 26 cases of colon cancer, and 24 cases of rectal cancer.
Plasma Cell-Free DNA Extraction
Blood samples were collected in cfDNA BCT tubes containing a formaldehyde-free preservative reagent that could stabilize nucleated blood cells.6,7 Plasma was separated by centrifugation (1600 xg for 10 min) and then transferred to 1.5 mL Eppendorf tubes (Axygen, NY, USA) for further centrifugation at 16,000 xg for 10 min at 4°C. Plasma cfDNA was isolated from 1–2 mL plasma with the Mag MAXTM cell-free DNA isolation kit (Life Technologies, CA, USA). DNA was extracted from white blood cells with the TIANamp blood DNA kit (TIANGEN, Beijing, China). Tumor DNA was extracted from formalin-fixed, paraffin-embedded (FFPE) specimens with the blackPREP FFPE DNA kit (Analytik Jena, Jena, Germany). The concentration of DNA was quantified by the Qubit DNA dsDNA assay kit (Life Technologies, CA, USA).
Library Preparation
For cfDNA samples, 10–50 ng DNA was used for library construction. For the blood cell and FFPE DNA samples, 200–500 ng DNA was sheared into 200-bp fragments with a Covaris M220 ultrasonicator (Covaris, MA, USA) according to the recommended protocol. Libraries were prepared with a KAPA Hyper Preparation kit (Kapa Biosystems, MA, USA). According to the DNA quality prior to PCR, the ligated fragments were amplified for 6–11 cycles. DNA was purified by using Agencourt AMPure XP beads (Beckman-Coulter, CA, USA), and double size selection was conducted during library preparation. The Qubit DNA dsDNA assay kit (Life Technologies, CA, USA) was used to quantify the libraries, and a 2100 bioanalyzer with the DNA 1000 kit (Agilent, CA, USA) was used to determine fragment length.
Targeted Region Capture and Sequencing
NimbleGen SeqCap Hybridization and Wash kits (Roche NimbleGen, Switzerland) were used according to the technical note for targeted region selection. The hybridized probes can capture 1 µg library DNA from 8–12 indexed Illumina libraries. The probe library was designed using the Nimble Design portal (Version 02) and the genome build kit hg19 NCBI Build 37.1/GRCh37. The captured DNA fragments were divided into two 50-µL reactions (14 PCR cycles). Agencourt AMPure XP beads (Beckman-Coulter, CA, USA) were used to pool and purify these reactions. The Qubit DNA dsDNA assay kit (Life Technologies, CA, USA) was used to quantify the libraries, and then, the captured product was sequenced by using 150-bp paired-end runs on an Illumina HiSeq X10. A 2100 bioanalyzer with the DNA 1000 kit (Agilent, CA, USA) was used to determine fragment length.
Bioinformatic Pipeline
Paired-end sequencing was performed by Illumina HiSeq X-Ten. The hg19 reference genome was used for read mapping with BWA 0.7.12 (default parameters). The resulting alignments were sorted, filtered and indexed using SAMtools. To distinguish somatic SNPs from indels, the obtained BAM files from both blood cell and plasma samples for each patient were processed for pairwise variant calling using VarScan (v2.4.2) according to the following rules: i) For calling somatic variants, the minimum coverage was 6 in plasma samples and 8 in blood cell samples; the P-value threshold to call a somatic site was 0.05. ii) Variants with ≤ 90% strand bias were retained for further study.7 The refGene and Exome Aggregation Consortium (ExAC) databases are included in ANNOVAR packages, which were used for variant annotation to obtain population and gene region information. Patient blood cell samples were used to construct a copy number baseline that was used as a negative control. CNVkit was used to call copy number variations (CNVs) in the plasma samples from each patient.
We used the VarScan (v2.4.2) somatic module to identify somatic mutations for all patients.8 For each patient, the pairwise variant calling procedure was used with blood cell samples as the normal control to eliminate germline mutations in the corresponding plasma samples. We used the ANNOVAR software tool to annotate the identified candidate mutations.9 The ExAC and dbNSFP databases were used to filter out population polymorphic sites and benign mutations with pp2_hdiv score ≤ 0.452. Finally, nonsynonymous mutations in exons were retained. The mutation burden of each patient was defined as the average mutant allele frequency of each gene for which a somatic mutation was identified.
By using the targeted sequencing reads and nonspecifically captured off-target reads, the software package CNVkit can help reduce bias related to library preparation and to target capture efficiency in targeted sequencing and improve the detection resolution of somatic CNVs. Three main sources of bias, GC content, target footprint size and spacing, and repetitive sequences, which can introduce extraneous variability in sequencing read depth, were evaluated and corrected.
Statistical Analysis
Data are presented as the mean ± standard error of the mean (SEM). Group values were analyzed for a normal distribution. Student’s t-test was used to analyze normally distributed data. Nonparametric tests were used for data that were not normally distributed. P < 0.05 was considered to indicate statistical significance. Statistical analysis was performed using standard statistical software (SPSS version 16.0, Inc., Chicago, IL, USA).
Results
Molecular Alterations in Adenoma-to-Carcinoma Progression
To investigate molecular alterations in adenoma-to-carcinoma progression, we collected tumor tissues and blood samples from 77 patients, including 9 with colon polyps, 18 with colon adenoma, 26 with colon cancer, and 24 with rectal cancer (clinical characteristics shown in Table 1). Plasma cfDNA, white blood cell DNA, and tumor tissue DNA were sequenced by a cancer gene-targeted NGS panel. Significantly mutated genes were identified using the MutSig2CV algorithm (P<0.05). As shown in Figure 1, genes involved in 9 driver signaling pathways were mutated during the progression from adenoma to carcinoma: the RAS, Wnt, Hippo, Nrf2, TGFβ, PI3K, Notch, P53, and cell cycle pathways. The KRAS, BRAF, APC, CTNNB1, FAT3, FAT4, SMAD4, FBXW7, and TP53 genes were frequently mutated in both colorectal adenoma and CRC. The ATM, PIK3CA, and PTEN genes were wild type in the colorectal adenoma group but were frequently mutated in the CRC group. These findings indicate that the KRAS, BRAF, APC, CTNNB1, FAT3, FAT4, SMAD4, FBXW7, and TP53 genes are mutated during CRC initiation and that the ATM, PIK3CA, and PTEN genes are mutated during CRC progression. Compared with adenomas and polyps, colon cancer and rectal cancer tissues harbored more copy number alterations. In CRC, the EGFR, FGFR1, BRAF, STK11, Notch1, and RB1 genes were detected as CNV gains, and the SMAD4 and CDKN2A genes were detected as CNV losses. In the tumor tissue samples, there were significantly more mutated genes in the CRC group than in the colon polyp and adenoma groups (P<0.05) (Figure 2A), but no significant differences were found in the plasma samples (Figure 2B). Venn diagrams showed the common and different mutated genes in tissue DNA and plasma cfDNA from polyp, adenoma, colon cancer, and rectal cancer patients (Figure 2C and D).
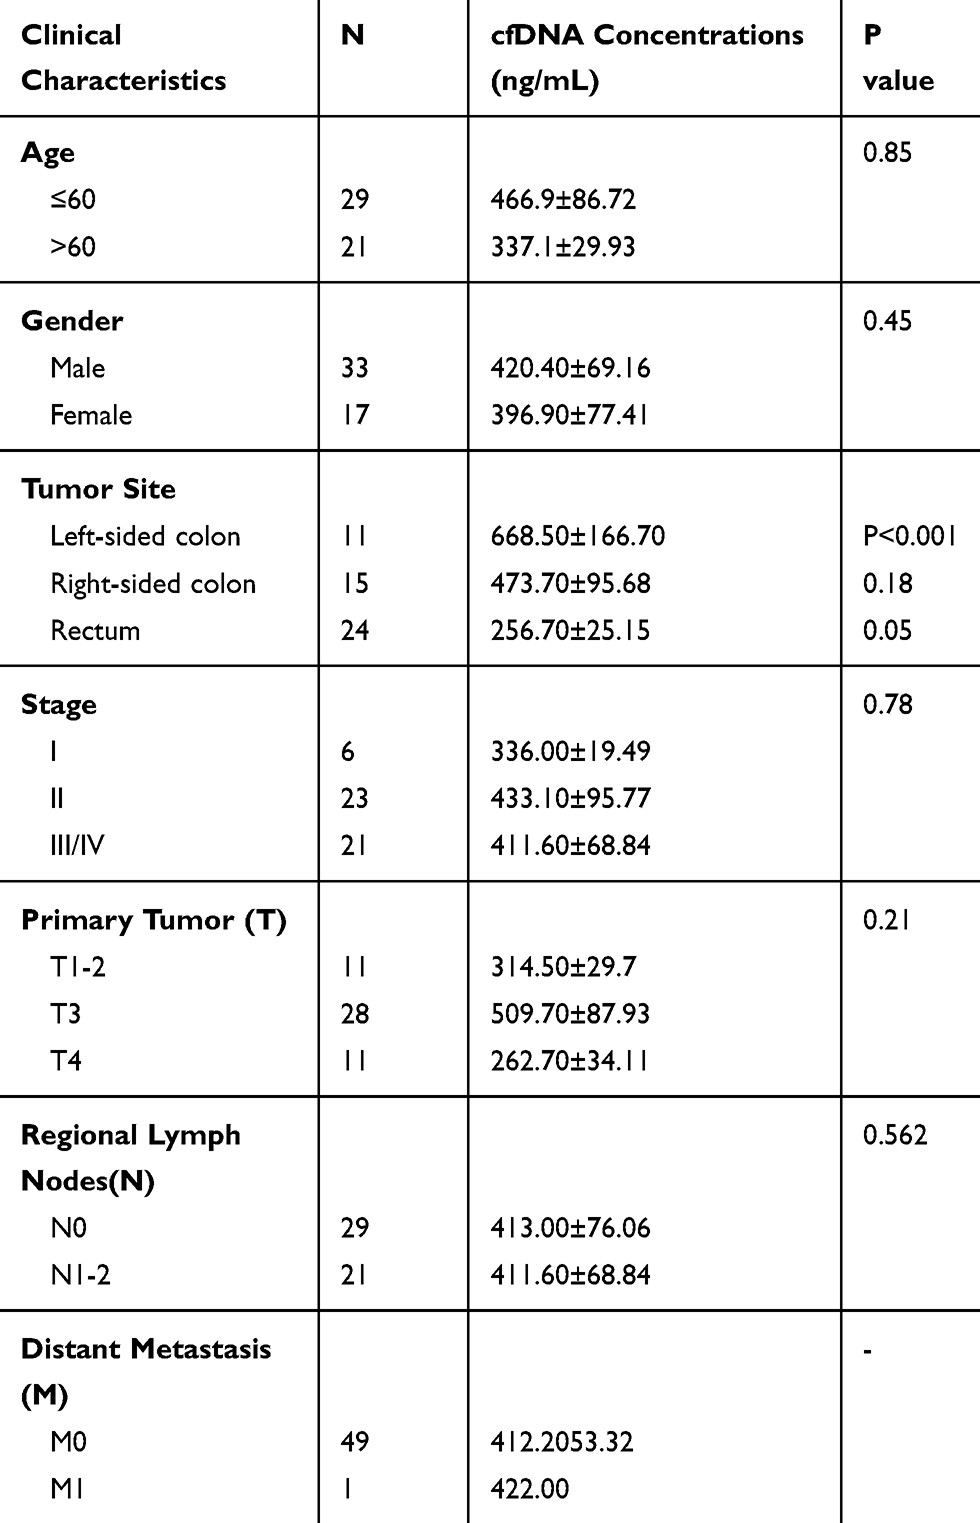 |
Table 1 Clinical Characteristics and Association with cfDNA Concentrations of Patients with Colorectal Cancer |
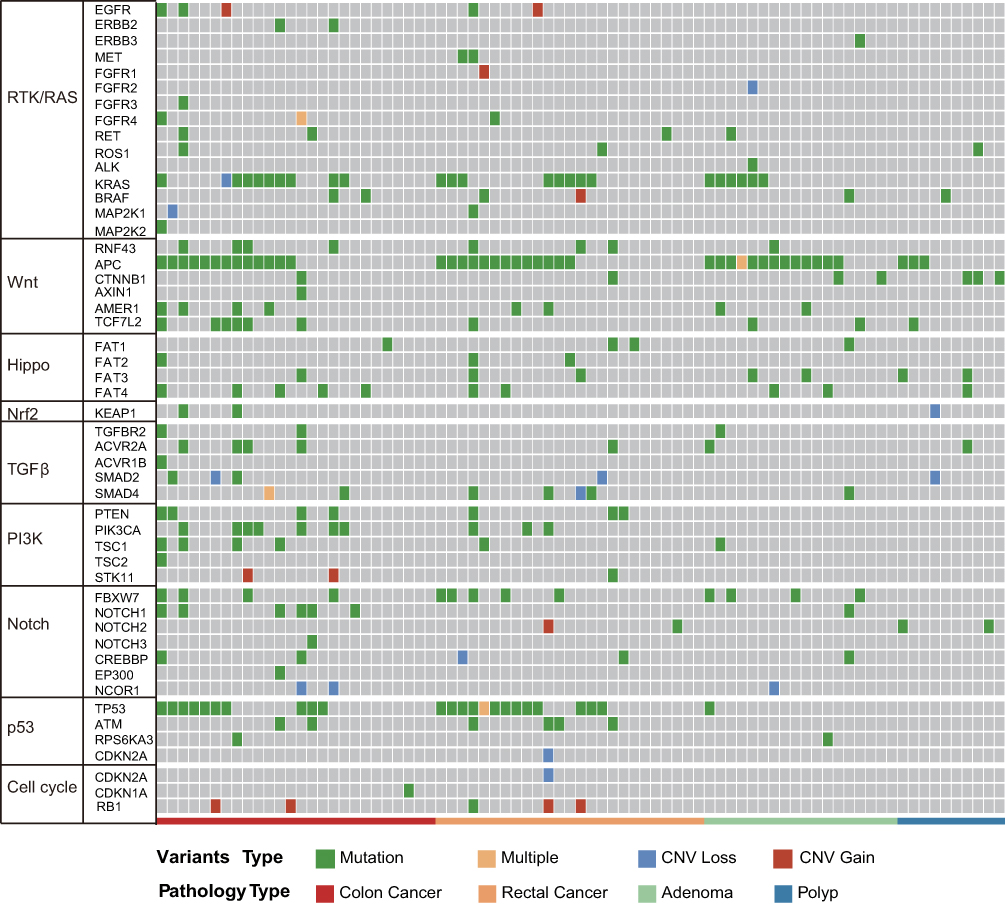 |
Figure 1 Molecular profiles of tumor tissue DNA and cfDNA from patients with colorectal adenoma or CRC. Genes with significant mutation levels and mutation types in tumor tissue DNA (MutSig2CV algorithm, false discovery rate<0.1). Significantly mutated genes were identified in tissue DNA from patients with colorectal adenoma and CRC using the MutSig2CV algorithm (P<0.05) and ranked in order of decreasing mutation frequency. |
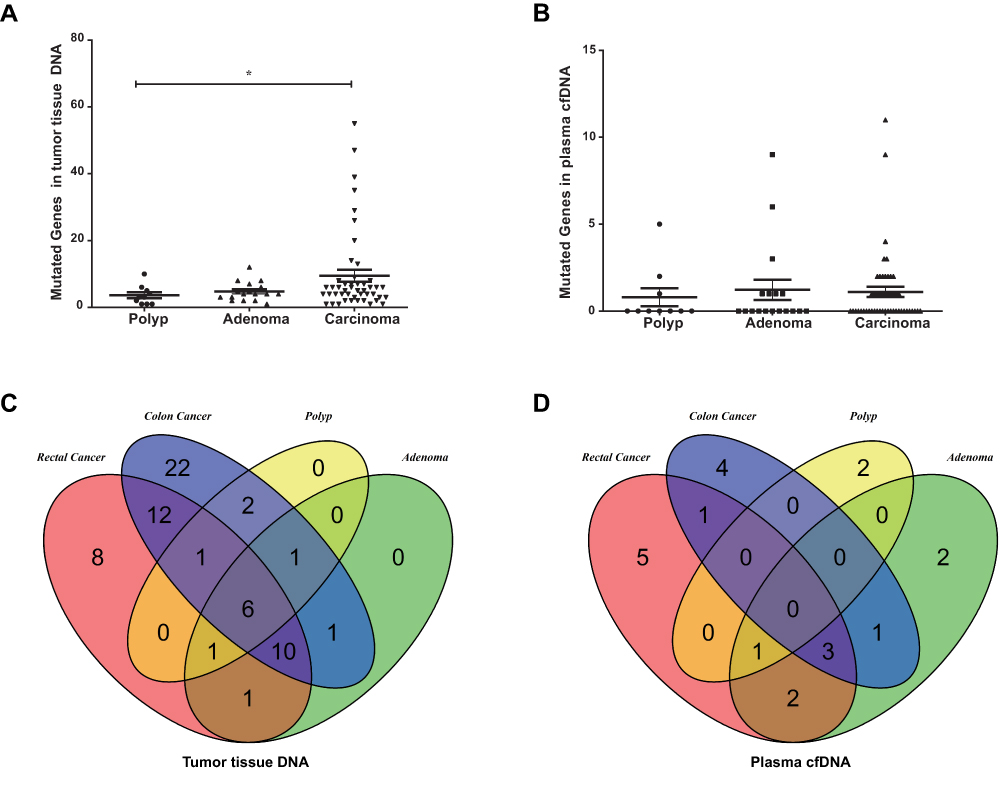 |
Figure 2 Mutated genes in patients with colorectal adenoma or CRC. (A) Mutated genes in tissue DNA from patients with polyps, adenoma, colon cancer, or rectal cancer (*P<0.05). (B) Mutated genes in plasma cfDNA from patients with polyps, adenoma, colon cancer, or rectal cancer. (C) Venn diagrams showing the common and differentially mutated genes in tissue DNA from patients with polyps, adenoma, colon cancer, or rectal cancer. (D) Venn diagrams showing the common and differentially mutated genes in plasma cfDNA from patients with polyps, adenoma, colon cancer, or rectal cancer. |
The Diagnostic Power of a Combination Model Based on Plasma cfDNA TMB and CEA
cfDNA concentrations were significantly higher in the colon carcinoma group than in the colon polyp and adenoma groups (P<0.05) (Figure 3A). As shown in Figure S1, the cfDNA in the colon carcinoma group was shorter than that in the colon polyp group (P<0.05). The tumor mutational burden (TMB) in tumor tissue DNA was positively correlated with that in cfDNA (r=0.618, P<0.01) (Figure 3B). Compared with the burden in adenomas and polyps, the somatic mutation burden in CRCs was higher (Figure 3C and D). The combination of CEA, plasma cfDNA concentration, and cfDNA TMB yielded an area under the receiver operating characteristic curve (AUC) of 0.80 for the diagnosis of CRC, with 63.2% specificity and 80.0% sensitivity. CEA had an AUC of 0.75, with 80.0% sensitivity and 53.2% specificity (Figure 3E and F). The diagnostic power of the combination model was superior to that of CEA alone.
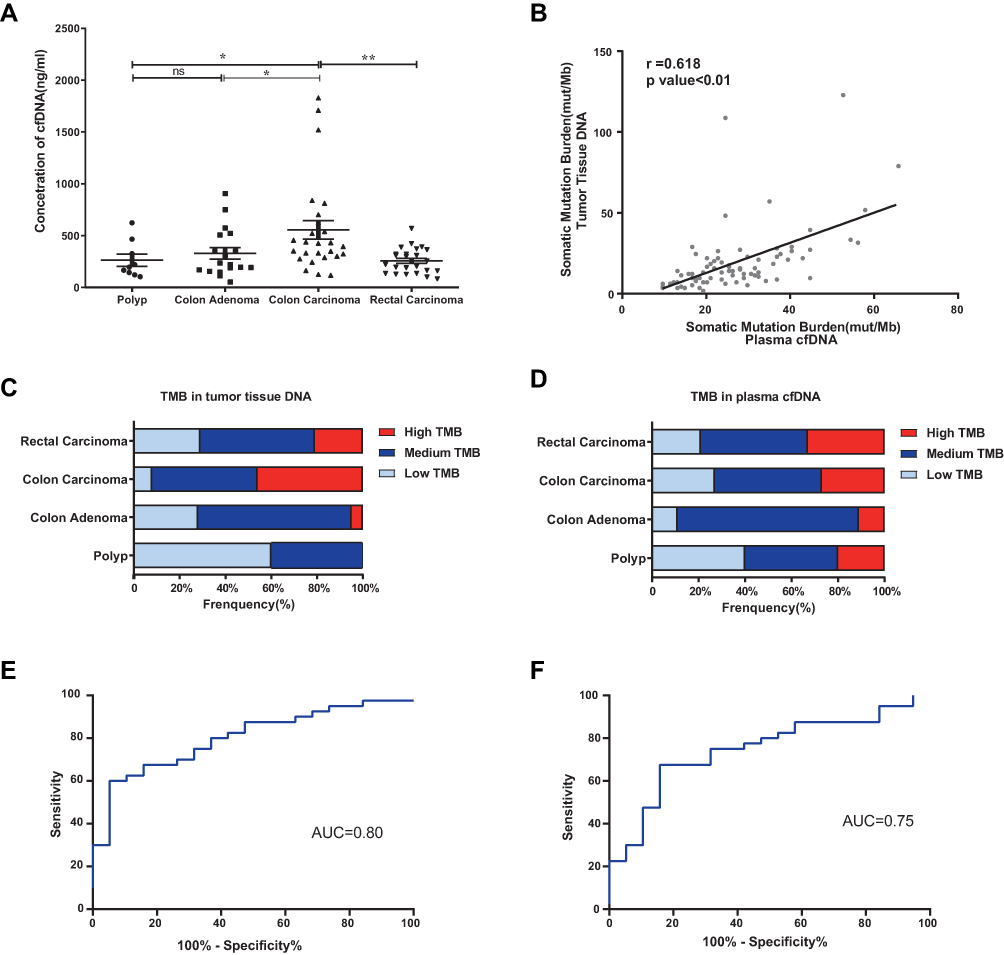 |
Figure 3 The mutation burden in tumor tissue DNA and cfDNA from patients with colorectal adenoma or CRC. *P ≤0.05, **P ≤0.01, ns: P >0.05. (A) The cfDNA concentration was significantly higher in the colon carcinoma group than in the colon polyp and adenoma groups (P<0.05). Data are presented as the mean±SEM. (B) Correlation analysis of the TMB between tumor tissue DNA and cfDNA in matched CRC samples (r=0.618, P<0.01). (C) TMB of tissue DNA from patients with polyps, adenoma, colon cancer, or rectal cancer. (D) TMB of plasma cfDNA from patients with polyps, adenoma, colon cancer, or rectal cancer. (E) Receiver operating characteristic (ROC) curve of the combined parameters (CEA, plasma cfDNA concentration, and cfDNA TMB) (AUC=0.80, P<0.01). (F) ROC curve of CEA (AUC=0.75, P<0.01). |
Differences in Molecular Alterations Among Left-Sided Colon, Right-Sided Colon and Rectal Cancers
As shown in Figure 4, the distribution of somatic DNA alterations differed among the left-sided, right-sided, and rectal cancer groups. Venn diagrams showed the common and different mutated genes in tissue DNA among the left-sided colon cancer, right-sided colon cancer, and rectal cancer groups (Figure 5A). Compared with left-sided colon cancer tissue, right-sided colon cancer tissue contained somatic mutations in more genes (Figure 5B). In addition, the tissue TMB value was significantly higher in the right-sided colon cancer group than in the left-sided colon and rectal cancer groups (P<0.05) (Figure 5C).The plasma cfDNA TMB were not significantly altered in the right-sided colon, the left-sided colon, and rectal cancer groups (P>0.05) (Figure 5D).
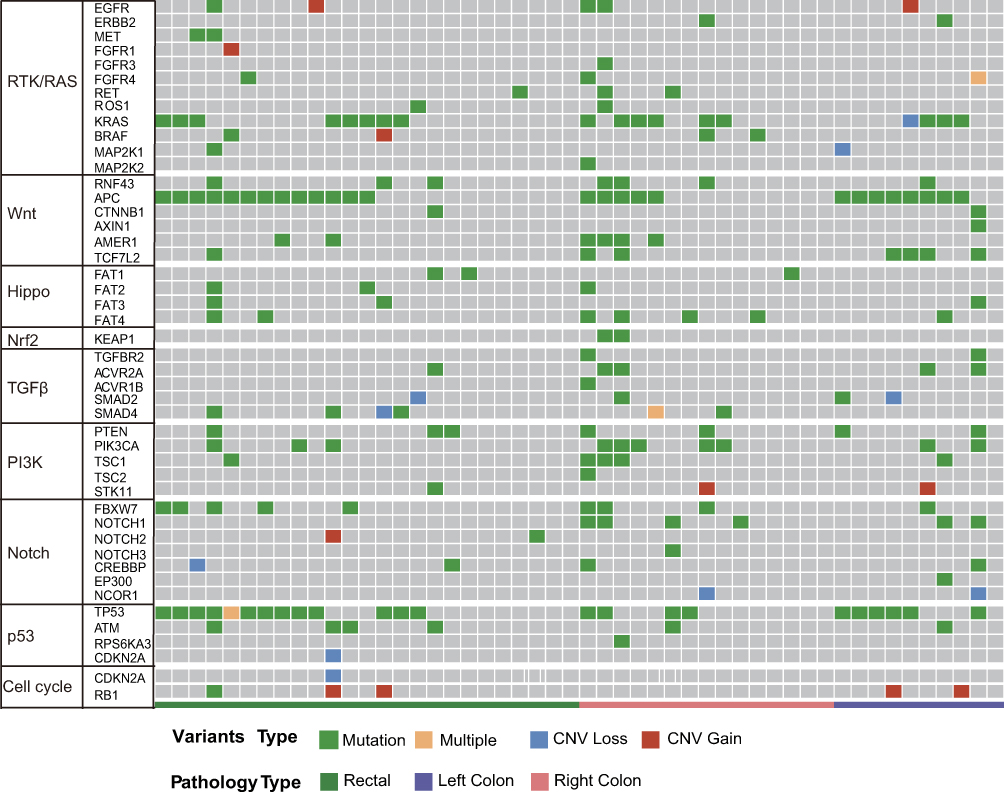 |
Figure 4 Molecular profiles of the left-sided colon cancer, right-sided colon cancer, and rectal cancer groups. Significantly mutated genes were detected in tissue DNA from patients with left-sided colon cancer, right-sided colon cancer, or rectal cancer using the MutSig2CV algorithm (P<0.05) and ranked in order of decreasing mutation frequency. |
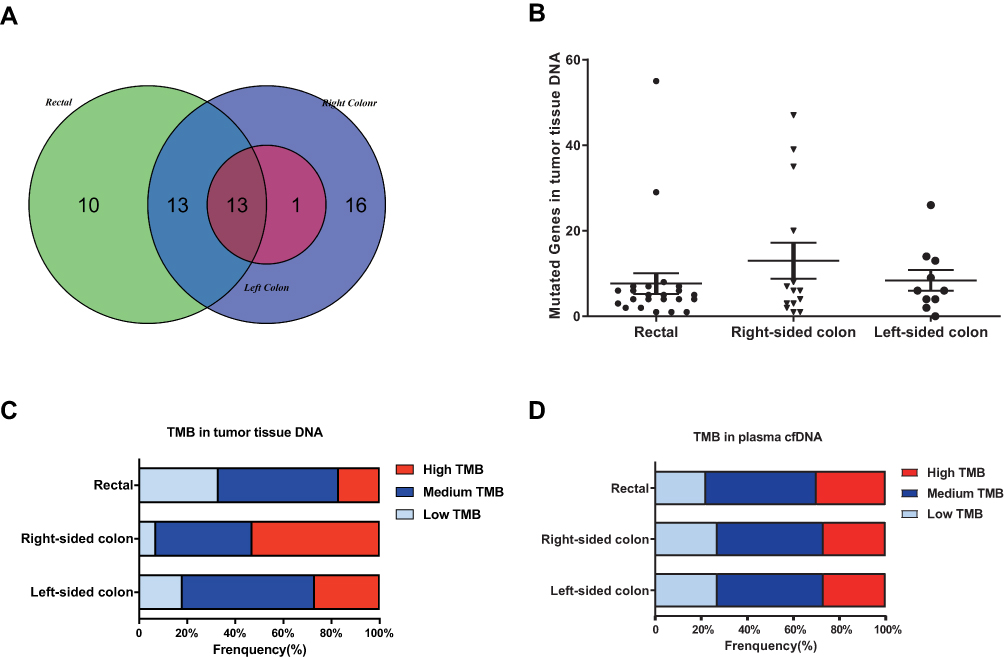 |
Figure 5 The mutation burden in the left-sided colon cancer, right-sided colon cancer, and rectal cancer groups. (A) Venn diagrams showing the common and differentially mutated genes in tissue DNA from the left-sided colon cancer, right-sided colon cancer, and rectal cancer groups. (B) Mutated genes in tissue DNA from patients with polyps, adenoma, colon cancer, or rectal cancer. (C) TMB of tissue DNA from the left-sided colon cancer, right-sided colon cancer, and rectal cancer groups. (D) TMB of plasma cfDNA from the left-sided colon cancer, right-sided colon cancer, and rectal cancer groups. |
Discussion
This study presents the plasma mutation profile during adenoma-to-carcinoma progression obtained with a cancer gene-targeted NGS panel. In addition, we identified genetic changes in the left-sided colon cancer, right-sided colon cancer, and rectal carcinoma groups.
The noninvasive biomarker circulating cfDNA has been used for the early diagnosis and monitoring of the TMB. Several studies have found that cfDNA levels are higher in cancer patients than in healthy people.10,11 We found that the cfDNA concentration was significantly higher in the colon carcinoma group than in the colon polyp and adenoma groups. In addition, the cfDNA concentration was positively correlated with tumor size in patients with colorectal carcinoma.
Circulating cfDNA originates from both tumor cell and normal cell DNA, which limits the ability to use circulating cfDNA to diagnose early cancer. The low abundance of tumor-derived cfDNA in early tumors may make detection difficult. Previous studies of plasma cfDNA from hepatocellular carcinoma patients showed that cfDNA from tumor cells might be shorter than that from nonmalignant cells.12 We also found that cfDNA from colon carcinoma was shorter than that from colon polyps. Furthermore, we identified differences between the tumor-derived DNA and nontumoral background DNA mutation profiles, mutation burdens and copy number alterations by comparing plasma DNA from polyp, adenoma, and carcinoma patients. Compared with the somatic mutation burden in the adenoma and polyp groups, that in the CRC group was increased. During adenoma-to-carcinoma progression, the mutated genes were involved in 9 driver signaling pathways: the RAS, Wnt, Hippo, Nrf2, TGFβ, PI3K, Notch, P53, and cell cycle pathways. Somatic mutations in cfDNA may provide information to distinguish benign from malignant tumors. We found that for the diagnosis of CRC, combining the parameters CEA, cfDNA concentration, and cfDNA TMB increased the specificity to 63.2% with 80.0% sensitivity.
The TMB was defined as the number of somatic mutations per megabase of genome examined. Clinical data indicate that immunotherapy has enhanced activity in patients with a high TMB.13 However, most TMB data are based on tumor tissue analyses. In this study, we found that the TMB in tumor tissue DNA was positively correlated with the TMB in cfDNA, suggesting that the plasma cfDNA TMB is a potential biomarker to monitor the real-time TMB in patients.
A meta-analysis reported that a left-sided primary tumor location was associated with a significantly reduced risk of death independent of stage, race, adjuvant chemotherapy, study year, number of participants, and quality of the included studies. Recent studies have indicated differences in molecular subtype and prognosis between left-sided and right-sided colon cancer groups.14 The Venn diagram showed that right-sided colon cancers had more gene mutations than left-sided colon cancers, and furthermore, patients with right-sided colon cancer had more mutated genes. In addition, right-sided colon cancers had greater heterogeneity than that left-sided colon cancers, which may explain the worse prognosis of patients with right-sided colon cancer. Interestingly, we found that tissue TMB was higher in right-sided colon cancer than in left-sided colon cancer. TMB as a good measure to assess the genomic instability and neoantigens is coming to be an emerging biomarker of sensitivity to immune checkpoint inhibitors and is effective in many different types of tumors.15–17 The right-sided colon cancer which has a higher TMB may benefit from immune checkpoint inhibitor therapy.
Conclusion
Our study results indicate that somatic mutations in plasma cfDNA are potential diagnostic biomarkers for CRC and provide alternative biomarkers for monitoring the TMB of CRC. Compared with left-sided colon cancer, right-sided colon cancer harbors somatic mutations in more genes and pathways. This increased heterogeneity may underlie the poor prognosis of patients with right-sided colon cancer.
Ethics Statement
This work was approved by the Ethics Committee of Tianjin Union Medical Center, the Affiliated Hospital of Nankai University, under reference number 2016B06 and was performed in accordance with the principles of the Declaration of Helsinki. All subjects gave written informed consent.
Acknowledgments
This work was supported in part by the National Key Sci-Tech Special Project of China (No. 2018ZX10302207).
Author Contributions
All authors made substantial contributions to study conception and design or data acquisition, analysis and interpretation; participated in drafting the article or revising it critically for important intellectual content; gave final approval of the version to be published, agreed on the journal to which the article has submitted; and agree to be accountable for all aspects of the work.
Disclosure
The authors report no conflicts of interest in this work.
References
1. Strum WB. Colorectal Adenomas. New Engl J Med. 2016;374(11):1065–1075. doi:10.1056/NEJMra1513581
2. Mandel P, Metais P. [Les acides nucléiques du plasma sanguin chez l'homme]. C R Seances Soc Biol Fil. 1948;142(3–4):241–243. French.
3. Newman AM, Bratman SV, To J, et al. An ultrasensitive method for quantitating circulating tumor DNA with broad patient coverage. Nat Med. 2014;20(5):548–554. doi:10.1038/nm.3519
4. Siravegna G, Mussolin B, Buscarino M, et al. Clonal evolution and resistance to EGFR blockade in the blood of colorectal cancer patients. Nat Med. 2015;21(7):795–801. doi:10.1038/nm.3870
5. Xu RH, Wei W, Krawczyk M, et al. Circulating tumour DNA methylation markers for diagnosis and prognosis of hepatocellular carcinoma. Nat Mater. 2017;16(11):1155–1161. doi:10.1038/nmat4997
6. Norton SE, Lechner JM, Williams T, et al. A stabilizing reagent prevents cell-free DNA contamination by cellular DNA in plasma during blood sample storage and shipping as determined by digital PCR. Clin Biochem. 2013;46(15):1561–1565. doi:10.1016/j.clinbiochem.2013.06.002
7. Das K, Fernando MR, Basiaga S, et al. Effects of a novel cell stabilizing reagent on DNA amplification by PCR as compared to traditional stabilizing reagents. Acta Histochem. 2014;116(1):55–60. doi:10.1016/j.acthis.2013.05.002
8. Koboldt DC, Zhang Q, Larson DE, et al. VarScan 2: somatic mutation and copy number alteration discovery in cancer by exome sequencing. Genome Res. 2012;22(3):568–576. doi:10.1101/gr.129684.111
9. Wang K, Li M, Hakonarson H. ANNOVAR: functional annotation of genetic variants from high-throughput sequencing data. Nucleic Acids Res. 2010;38(16):e164. doi:10.1093/nar/gkq603
10. Hao TB, Shi W, Shen XJ, et al. Circulating cell-free DNA in serum as a biomarker for diagnosis and prognostic prediction of colorectal cancer. Br J Cancer. 2014;111(8):1482–1489. doi:10.1038/bjc.2014.470
11. Spindler KL, Appelt AL, Pallisgaard N, et al. Cell-free DNA in healthy individuals, noncancerous disease and strong prognostic value in colorectal cancer. Int J Cancer. 2014;135(12):2984–2991. doi:10.1002/ijc.28946
12. Jiang P, Chan CW, Chan KC, et al. Lengthening and shortening of plasma DNA in hepatocellular carcinoma patients. Natl Acad ScI USA. 2015;112(11):E1317–1325. doi:10.1073/pnas.1500076112
13. Gandara DR, Paul SM, Kowanetz M, et al. Blood-based tumor mutational burden as a predictor of clinical benefit in non-small-cell lung cancer patients treated with atezolizumab. Nat Med. 2018;24(9):1441–1448. doi:10.1038/s41591-018-0134-3
14. Petrelli F, Tomasello G, Borgonovo K, et al. Prognostic survival associated with left-sided vs right-sided colon cancer: a systematic review and meta-analysis. JAMA Oncol. 2016.
15. Chalmers ZR, Connelly CF, Fabrizio D, et al. Analysis of 100,000 human cancer genomes reveals the landscape of tumor mutational burden. Genome Med. 2017;9(1):34. doi:10.1186/s13073-017-0424-2
16. Yarchoan M, Hopkins A, Jaffee EM. Tumor Mutational Burden and Response Rate to PD-1 Inhibition. N Engl J Med. 2017;377(25):2500–2501. doi:10.1056/NEJMc1713444
17. Chan TA, Yarchoan M, Jaffee E, et al. Development of tumor mutation burden as an immunotherapy biomarker: utility for the oncology clinic. Ann Oncol. 2019;30(1):44–56. doi:10.1093/annonc/mdy495
 © 2020 The Author(s). This work is published and licensed by Dove Medical Press Limited. The full terms of this license are available at https://www.dovepress.com/terms.php and incorporate the Creative Commons Attribution - Non Commercial (unported, v3.0) License.
By accessing the work you hereby accept the Terms. Non-commercial uses of the work are permitted without any further permission from Dove Medical Press Limited, provided the work is properly attributed. For permission for commercial use of this work, please see paragraphs 4.2 and 5 of our Terms.
© 2020 The Author(s). This work is published and licensed by Dove Medical Press Limited. The full terms of this license are available at https://www.dovepress.com/terms.php and incorporate the Creative Commons Attribution - Non Commercial (unported, v3.0) License.
By accessing the work you hereby accept the Terms. Non-commercial uses of the work are permitted without any further permission from Dove Medical Press Limited, provided the work is properly attributed. For permission for commercial use of this work, please see paragraphs 4.2 and 5 of our Terms.