")
Back to Journals » Neuropsychiatric Disease and Treatment » Volume 14
Modulatory interactions of resting-state brain functional connectivity in major depressive disorder
Authors Tu Z, Jia YY, Wang T, Qu H, Pan JX , Jie J, Xu XY, Wang HY, Xie P
Received 12 February 2018
Accepted for publication 3 July 2018
Published 28 September 2018 Volume 2018:14 Pages 2461—2472
DOI https://doi.org/10.2147/NDT.S165295
Checked for plagiarism Yes
Review by Single anonymous peer review
Peer reviewer comments 2
Editor who approved publication: Professor Wai Kwong Tang
Zhe Tu,1–4,* Yuan Yuan Jia,2,5,* Tao Wang,2,3,* Hang Qu,2,3 Jun Xi Pan,2,3 Jie Jie,2,3 Xiao Yan Xu,2,3 Hai Yang Wang,2,3 Peng Xie1–3
1Department of Neurology, Yongchuan Hospital, Chongqing Medical University, Chongqing, China; 2Department of Neurology, the First Affiliated Hospital, Chongqing Medical University, Chongqing, China; 3Chongqing Key Laboratory of Neurobiology, Chongqing Medical University, Chongqing, China; 4Department of Radiology, The First Affiliated Hospital of Chongqing Medical University, Chongqing, China; 5The College of Medical Informatics, Chongqing Medical University, Chongqing, China
*These authors contributed equally to this work
Background: Major depressive disorder (MDD) is mediated by chronic dysregulation of complex neural circuits, particularly the specific neurotransmitters or other neural substrates. Recently, both increases and decreases in resting-state functional connectivity have been observed in patients with MDD. However, previous research has only assessed the functional connectivity within a specific network or some regions of interests, without considering the modulatory effects of the entire brain regions. To fill in the research gap, this study employed PPI (physiophysiological interaction) to investigate the functional connectivity in the entire brain regions. Apart from the traditional PPI used for cognitive research, current PPI analysis is more suitable for exploring the neural mechanism in MDD patients. Besides, this PPI method does not require a new cognitive estimation task and can assess the modulatory effects on different part of brain without prior setting of regions of interest.
Methods: First, we recruited 76 outpatients with major depressive disorder, and conducted MRI scan to acquire structural and functional images. As referred to the previous study of resting-state networks, we identified eight well-defined intrinsic resting-state networks by using independent component analysis. Subsequently, we explored the regions that exhibited synchronous modulatory interactions within the network by executing PPI analysis.
Results: Our findings indicated that the modulatory effects between healthy crowed and patient are different. By using PPI analysis in neuroimaging can help us to understand the mechanisms of neural disruptions in MDD patients. In addition, this study provides new insight into the complicated relationships between three or more regions of brain, as well as different brain networks functions in external and internal.
Conclusion: Furthermore, the functional connectivity may deepen our knowledge regarding the complex brain functions in MDD patients and suggest a new multimodality treatment for MDD including targeted therapy and transcranial magnetic stimulation.
Keywords: major depressive disorder, physiophysiological, modulatory effects, resting-state networks
Introduction
Major depressive disorder (MDD) is one of the psychiatric disorders with a high prevalence, which draws global attention to clinicians and researchers alike.1 The common manifestations of depressive patients are low energy, loss of reward, and cognitive disorder. MDD has a debilitating impact on the patient’s lives, resulting from its persistent and recurrent nature. With the advancement of magnetic resonance imaging (MRI) techniques, the correlation between of nerve cells and modulatory effects of depression has drawn a great deal of interest in recent years.
Brain imaging studies suggest that most of the brain regions are responsible for mood regulation, and exhibited a disrupted function in depression.2 Functional magnetic resonance imaging (fMRI) has been applied to examine the differential activation of certain networks within regions between MDD patients and healthy controls, either in resting state or in response to a specific task.3,4 The fMRI allows the detection of fluctuations in blood oxygenation level dependent (BOLD) signals, and its advantages for studying resting states include the spatial and temporal resolution of noninvasive imaging technologies.5 The functional connectivity measures are based on the assumption that a stable relationship is existed between regions within a network over time by determining the temporal correlation of resting-state fMRI time series.6
Psychophysiological interaction is a commonly used method for studying task related functional connectivity by using fMRI data. This method utilizes a linear regression model to detect the interaction between a time series of seed region (physiological variable) and a task (psychological variable). Through voxel-wise analysis, the regions that modulate connectivity with task and seed regions can be identified. Subsequent modification may include the deconvolution of hemodynamic response.7 The psychophysiological interaction method has been validated by several simulation studies,8 especially in block designed experiments,9 to examine whether the correlation in network activity between two distant brain regions is different in terms of psychological contexts. In other words this method can be used to determine the interaction between psychological state and functional coupling among two brain regions.
Resting-state MRI (rs-MRI) analysis, is a method basing on the temporal correlations of BOLD with synchronous contrast MRI signals, rs-MRI is commonly used to identify a set of internal functional connectivity through a predefined reference seed region of interest (ROI) and other brain regions.10 The fMRI can simultaneously provide information by analyzing time-series data regarding the task-related activity and the connectivity (functional or effective) between brain regions and the behavioral or physiologic states.
There are several networks emerging from rest-state fMRI, such as resting-state networks (RSNs). RSNs are commonly identified by independent component analysis (ICA). The complex functional connectivity is constant with both stimulus-evoked and co-activation patterns in sensory and motor cortices, language and memory systems and high-level cognitive control networks.11–14 RSNs are restricted to gray matter regions,14,15 and they have become a consensus supported by many scientists, which reflect the functional system for core perception and cognitive process. Therefore, the connectivity between cortico-cerebellar and cortico-subcortical can be explored, and potentially achieved with structural connectivity measures. The application of RSNs has uncovered many interesting phenomena for the patterns of spontaneous connectivity altered in different mental disorders. However, the majority of approaches for analyzing resting-state fMRI data are based on spatially model-driven with a priori hypothesis that the functional connectivity of ROIs existed in the brain or individual voxels.16
To date, many studies have been reported on the emotional and cognitive dysfunctional of MDD,17 characterized by the structural and functional abnormalities in an affective network (AN) and some others network.18 Consequently, these studies have identified the default mode network of brain regions. Notably, the network brain’s regions are closely related and are most likely to modulate to each other, across cerebrum of MDD patients with different functional connectivity.19,20
Accordingly, these functional connectivity can provides a bridge between different networks in healthy individuals via PPI analysis.21 PPI analysis has revealed that the positive modulatory interactions are mostly observed in the brain regions involved in the same network, when considering two ROIs for each networks. These findings suggest that the network activity may be associated with a smaller connectivity of the competitive networks, which has been validated by several simulation studies, especially in block designed experiments.8,22
To the best of our knowledge, no study has been conducted on a combination of aforementioned methods for examining the networks of resting-state abnormalities in MDD patients. Conversely, the studies of MDD related with fMRI are often based on task block methods. In the present study, we focused on the resting-state without performing complex tasks to allow the analysis of brain regions in a natural manner. Besides, it is assumed that MDD patients may not cooperate with tasks when they are emotional.
Therefore, in this study, we investigated the modulatory interactions of different brain regions within the well-defined resting-state networks23 and identified the specific regions that exhibit synchronous modulatory interactions within the network. In addition we explored the atypical regions exhibiting RSNs, and compared our findings with the previous results by using ICA.23,24 We hypothesized that the modulatory interactions in MDD patients may be different from healthy individuals, even in the field of resting-state.21 Furthermore, this study provides new insight into the functional connectivity within and between intrinsic brain networks in MDD patients.
Material and methods
Participants
A total of 76 outpatients with MDD were consecutively recruited. All patients were right handed and aged from 18 to 60 years. They were diagnosed through an interview with experienced doctors in according to the Structured Clinical Interview for Diagnostic and Statistical Manual of Mental Disorders Fourth Edition for Axis I Disorders. The following criteria were used to eliminate study heterogeneity: 1) historically/currently undergoing any course of antidepression therapy (antidepressant, psychotherapy); 2) comorbidity of other Axis-I disorders; 3) current major medical and/or neurological conditions; 4) history of head injury and/or substance abuse; 5) history of manic, hypomanic and/or psychotic symptoms; and 6) contraindications to MRI scanning. The severity of depression was assessed using the Structured Interview Guide for 17-Item Hamilton Depression Rating Scale (17-HDRS) and the Beck Depression Inventory-II (BDI-II). The study was performed in accordance with the Helsinki Declaration, and approved by the Institutional Review Board of Chongqing Medical University for the protection of human subjects. Informed consent with signature was obtained from each participant.
Imaging protocol
MRI was performed with a 3.0 tesla Siemens Trio MRI scanner using a 12-channel whole-brain coil (Siemens Medical, Erlangen, Germany). High-resolution T1-weighted structural images were acquired using magnetization-prepared rapid gradient echo sequence (echo time =2.52 ms; repetition time =1,900 ms; inversion time =900 ms; flip angle =9°; slices =176; field of view =256×256; voxel size =1×1×1 mm3). A total of 242 whole brain volume images were collected for each subject in the resting-state with sampling rate of TR =2 s. During the resting-state scan, the subjects were instructed to close their eyes, not to fall asleep, and the efforts to achieve inner peace. The resolution of the fMRI images was 3.4×*3.4×*3.9 mm with 64*64*32 voxels. The quality of images underwent rigorous inspected by neurologists and radiologists. The initial number of participants was 76, but 4 patients were excluded because of the low quality of images (excessive head motion), therefore 72 patients were in the final analysis.
Functional MRI data analysis
Preprocessing
The fMRI images were preprocessed under SPM8 package (http://www.fil.ion.ucl.ac.uk/spm/) executed by MATLAB 2010b environment (http://www.mathworks.com). For each group of patient’s image, the first ten functional images were discarded to account for signal equilibrium and for the patients to get used to the MRI scanning environment, by which 232 images were remained for each patient. The functional images at the rest-stating were operated at head-motion correction and co-registered to their high resolution structural image. Subsequently, the patient’s structural images were normalized to the T1 normal template supported by SPM package within Montreal Neurological Institute (MNI) space. Next, the obtained normalization parameters were used to normalize the functional images from individual space into MNI space. All functional images were resampled into 3×3×3 mm3 voxels. Finally, the processed functional images were smoothed by using a Gaussian kernel with 6 mm full-width at half-maximum, which was doubled the resolution the resampled images.
Spatial ICA
Spatial ICA was used to define intrinsic networks and ROIs for PPI analysis with the Group ICA of fMRI Toolbox (GIFT; http://icatb.sourceforge.net/).25 ICA separated the independent signals from the whole brain to some discrete components with statistically independent temporal courses for extracting spatially distributed networks. Although ICA does not require a priori selection of a seed region, it still needed to distinguish noise from physiological signals. By using this approach, we successfully extracted 20 components. The resulting maps of components were visually inspected to identify the well-defined networks. As a result, default mode network, dorsal attention, left and right executive, salience, auditory, primary visual, extrastriate visual, and motor networks were all found in our group.23
PPI analysis
The PPI analysis was processed under a voxel-wise statistical level, by constructing a general linear model (GLM) framework in SPM8 package. Two ROIs were defined to represent the activity of a network. PPI analyze discerned regions that connected to one selected ROI and correlated with the increasing or decreasing activity of the second ROI. Specifically, for each GLM in the PPI analysis, two ROIs were set within each specific inherent network derived from the ICA analysis (Table 1). Thus, PPI analysis can seek out the regions in whole brain volume which connected to the ROIs selected from the same network due to the activity of these regions. This analysis may provide a deep insight about the dynamic change of a given network with regard to its connectivity.
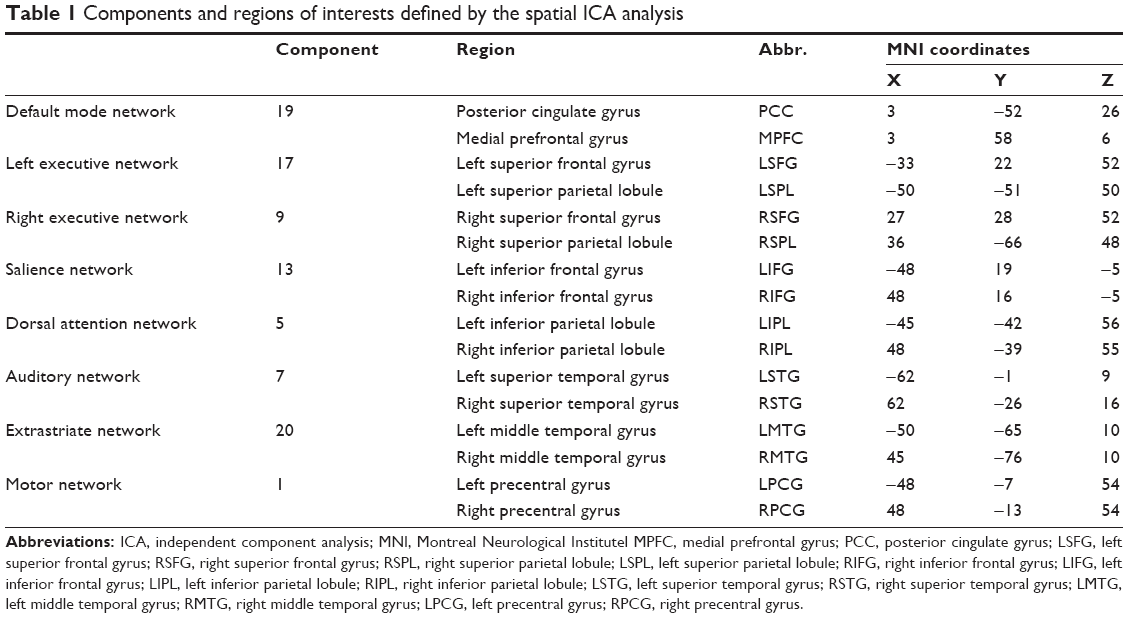 | Table 1 Components and regions of interests defined by the spatial ICA analysis |
In order to set ROIs, the same coordinates were selected from previous study,21 which was in MNI template. The z map of each inherent network obtained from ICA analysis was thresholded at z >2.3. All the coordinates were included in the separate components of resting-state networks, within the brain structures of interest (Table 1 and Figure 1).26
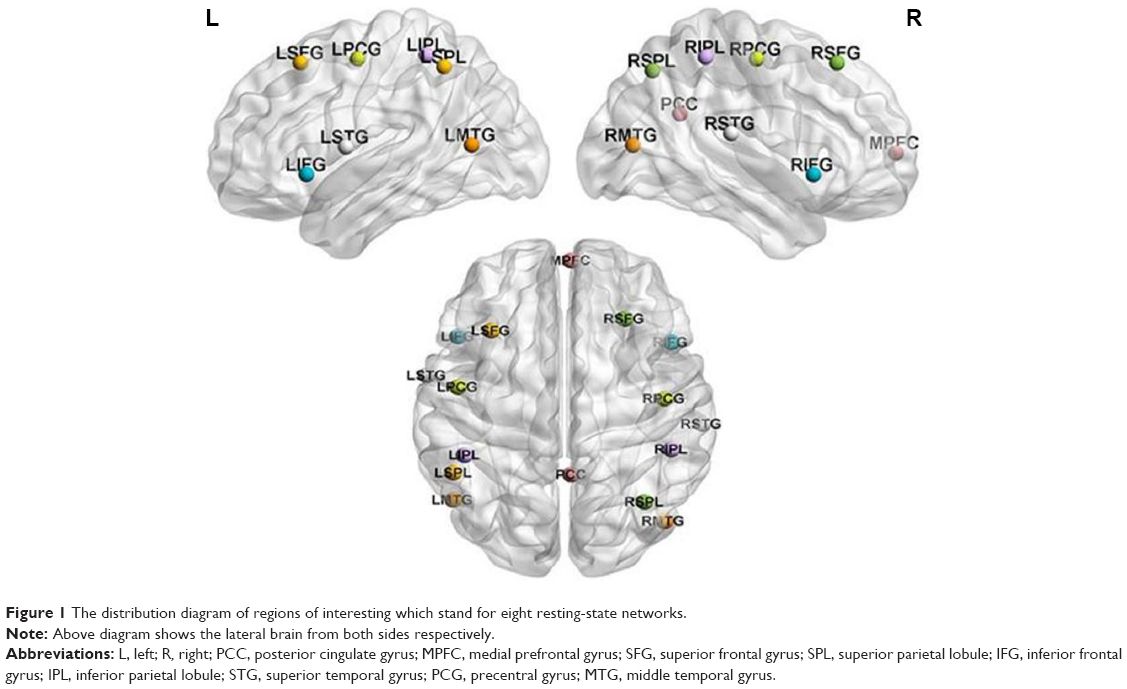 | Figure 1 The distribution diagram of regions of interesting which stand for eight resting-state networks. |
GLM was constructed into each subject to generate ROI time series for PPI analysis. The GLM included one dummy regressor with an onset in the middle of the scan. This dummy regressor was used for the proper conduction of SPM model estimation procedure, without being analyzed further. The model also included an implicit high pass filter of 1/100 Hz and rigid-body head motion parameters as six regressors. The subject-specific white matter (WM) and cerebrospinal fluid (CSF) masks were thresholded at 0.99 to ensure that nearly all gray matter (GM) voxels were excluded from the derived segmentation masks. When defining ROIs, the first eigenvector within, an 8-mm sphere of ROI was extracted after the removal of head motion, masked segmented images, and low frequency effects.
The BOLD signal time series of the two selected ROIs within a network were deconvolved, with canonical hemodynamic response function (HRF) in SPM8 using a simple empirical Bayes procedure. Thus, the final result on time course represented the outcome of neural activity.7 Then the activity of two neural and the final time series were detrended and point multiplied. Consequently, the interaction time series of the neural activities between the two ROIs were generated. Hereafter, the interaction time series was convolved with HRF, and the interaction variable at the original hemodynamic level was derived. The PPI terms for ROI pairs of each internal network were then calculated, and the separate PPI models were constructed for all the patients by using GLM framework. Afterward, the time course was extracted using REST toolbox in MATLAB edited by Yan CG from Beijing Normal University. After completing all the procedures, a critical GLM analysis was performed with SPM. The GLM model contained multiple regressors: two regressors represented the main effects of the two ROI time series, one regressor demonstrated the PPI effect, two regressors stand for indicated the WM and CSF signals, and six regressors represented the head motion effects. Furthermore, an implicit high pass filter of 1/100 Hz was used.
For the PPI analysis of each network, a second-level one sample t-test was conducted to make group-level inference with threshold at P<0.001. Simple t-contrast value of 1 or −1 was defined to reveal the positive or negative PPI effects, respectively. Then, the obtained clusters were corrected with cluster-level false discovery rate (FDR) at P<0.05 according to random field theory.27 Finally, the group level analyses were carried out, and the similarities and differences between MDD patients and previous healthy individuals were examined.
Results
The results of PPI analysis for MDD patients are listed in Table 2. The consequent clusters showing negative PPI effects are highlighted in bold. A large proportion of clusters exhibited negative modulatory interactions with ROI in the default mode network of MDD patients. Clusters that demonstrated negative modulatory interactions of MDD patients were located in the left superior frontal cortex, bilateral middle and post cingulum, left angular gyrus (BA39), and left middle medial frontal gyrus (BA 6). Intriguingly, bilateral insular, bilateral supramarginal gyrus (BA48), a part of support motor area, left rolandic operculum, and left middle cingulum indicated positive modulation.
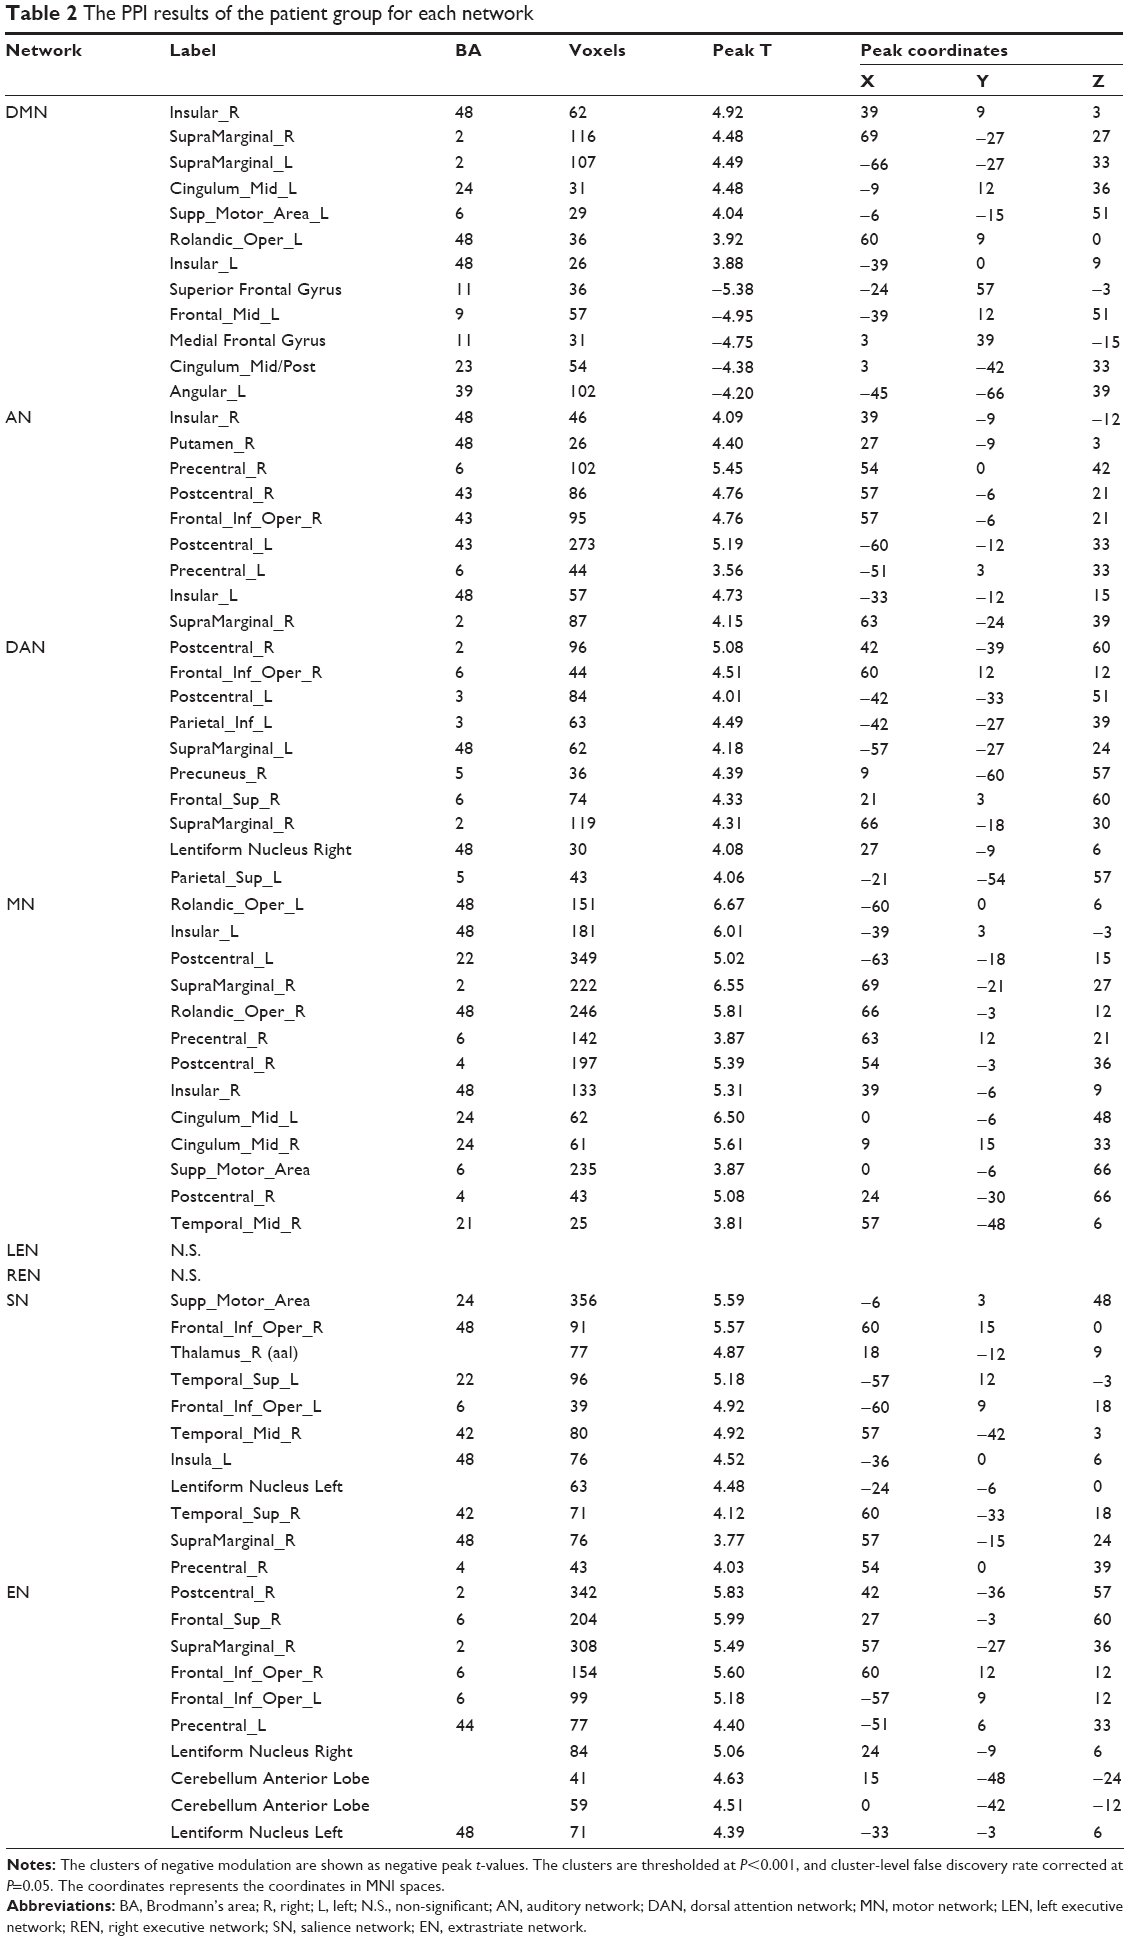 | Table 2 The PPI results of the patient group for each network |
The clusters demonstrated that positive modulatory interactions in the auditory network of left superior temporal gyrus (LSTG) and right superior temporal gyrus (RSTG) regions among MDD patients sample are attributed by bilateral precentral and postcentral gyrus, bilateral insular, right inferior frontal oper gyrus, right supramarginal gyrus.
The clusters that showed modulatory interactions with the regions of left inferior parietal lobule (LIPL) and the right inferior parietal lobule (RIPL) in the dorsal attention network of the patients are illustrated in Figure 2. In these sample, ten clusters passed cluster-FDR correction and revealed positive modulatory effects, which located in the bilateral postcentral gyrus, right inferior frontal gyrus opercular, bilateral supramarginal, right precuneus, left inferior parietal gyrus, right precuneus and right superior gyrus, right lentiform nucleus and left superior parietal.
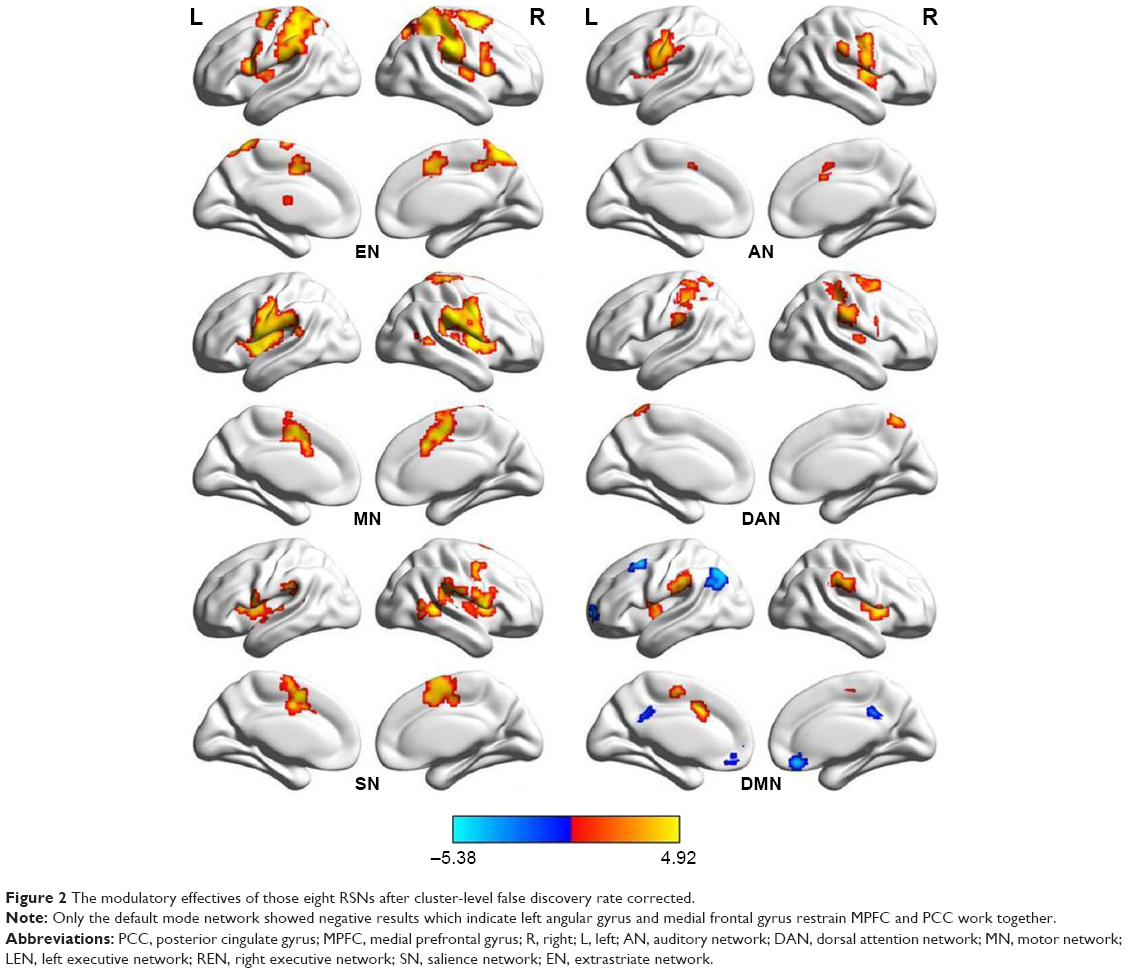 | Figure 2 The modulatory effectives of those eight RSNs after cluster-level false discovery rate corrected. |
However, no clusters demonstrated positive or negative modulatory interactions with the regions of superior frontal gyrus (SFG) and superior parietal lobule (SPL) in both left and right executive networks in MDD patient group.
The modulatory interactions of the internal motor network constructed by left precentral gyrus and right precentral gyrus regions showed positive result in a huge region of the entire brain. The clusters include bilateral rolandic operculum (BA48), right supramarginal, right middle temporal, the bilateral insular (BA48), and a part of middle cingulum (BA6/24), bilateral postcentral gyrus and right precentral, a part of support motor area. In addition, we observed a cluster of negative modulatory interactions in the right medial frontal gyrus, before conducting cluster-level FDR correction at P<0.05, but it did not pass through after correction.
The regions that indicated a positive modulatory in the extrastriate network built is with left middle temporal gyrus and right middle temporal gyrus were localized in the bilateral inferior frontal opercular gyrus, right superior frontal gyrus, right supramarginal gyrus, right postcentral, bilateral lentiform nucleus, left precentral, and a part of anterior cerebellum lobe. Furthermore, we observed an obscure cluster in the middle of orbital frontal gyrus, but those small points disappeared after FDR correction.
As for salience network, there were no survival clusters showing modulatory interactions with the regions of left inferior frontal gyrus and right inferior frontal gyrus in healthy group. However, these observations were inconsistent with the findings of MDD patients. We found that clusters appeared in several brain regions such as bilateral interior frontal operium gyrus, bilateral superior temporal gyrus, right middle temporal gyrus, left lentiform nucleus, left insular, right rolandic operium gyrus, right precentral gyrus, right supramarginal, a part of support motor area. All these clusters demonstrated a positive attribute toward bilateral inferior frontal gyrus. The results for all those modulatory clusters are in Figure 2.
Discussion
The PPI analysis of the whole brain
The purpose of this study was to analyze the resting-state fMRI data by using a model-free, whole-brain voxel PPI approach in unmedicated subjects with MDD. This study demonstrated an abnormal neuronal reaction across the whole brain of MDD patients. This modulatory can be interpreted as the brain region within a global system, by adjusting and controlling the information transmission between two regions. Previous research has reported a reduction of functional connectivity in MDD patients, especially the connections within and between frontal, temporal and other regulator regions.19
The structure of MDD patient’s brain has been proven to shift randomly and its functions have also altered. Thus, we decided to employ PPI method, identify the regions that correlated and modulated with two nodes of a resting state network. By applying PPI analysis to the resting-state fMRI data of MDD patients, the resting-state networks might have a different quality compared to healthy individuals. Seven out of eight MDD-derived networks revealed significant PPI interactions among healthy subjects. Notably, the extrastriate, dorsal attention, auditory, and motor networks showed positive modulatory interactions, whereas the regions in the task-activated relevant networks, such as the default mode network (DMN) and executive networks, expressed negative modulatory interactions. However, in this study, we found contradictory results for MDD patients, particularly the interactions of two nodes with different networks. Moreover, a study has reported that the strong correlation between DMN regions and task relevant network such as dorsolateral prefrontal cortex and parietal cortex from supplementary motor are.28 Furthermore, the advantage of this approach over the conventional fMRI function connectivity techniques is the integration of physiological influences on brain activity. In this way, PPI analyses can allow us to identify the resting-state functional connectivity in discrete brain regions of MDD patients.
The regular regions modulating MDD
By comparing the clusters with positive PPI effects between patient and healthy groups, we unexpectedly found some regions that consistently appeared in the RSN. Such regions include bilateral insular gyrus, right supramarginal gyrus, and right inferior frontal. Notably, these regions not only existed within one network, but also modulated other RSN in MDD patients. In previous MRI functional connectivity analysis, insular gyrus has been associated with depression disorder, as demonstrated by fMRI, voxel based morphology (VBM) and regional homogeneity (ReHo) analysis in resting state.29–31 Insular gyrus believed to be participated in the process of consciousness and exerted a great variety of diverse functions, which linked to the regulation of homeostatic emotions. Such emotions include compassion, empathy, perception, motor control, self-awareness, cognitive functions, and interpersonal experience.32 In addition, our results supported that insular gyrus involved a huge net-scale regulation, by influencing DMN, AN, motor network (MN), and salience network (SN) (Figure 3), as well as connecting with other regions such as somatosensory areas, anterior cingulate cortex, prefrontal cortex, superior temporal gyrus, parietal opercula, and association auditory cortices, visual association cortex, hippocampus, and motor cortex. All the aforementioned regions are part of RSNs. However, the volume of insular gyrus may be reduced in the MDD cohort which is in consistent with other reports.33 Hence, the modulatory effects of bilateral insular gyrus needed further explanation.34,35
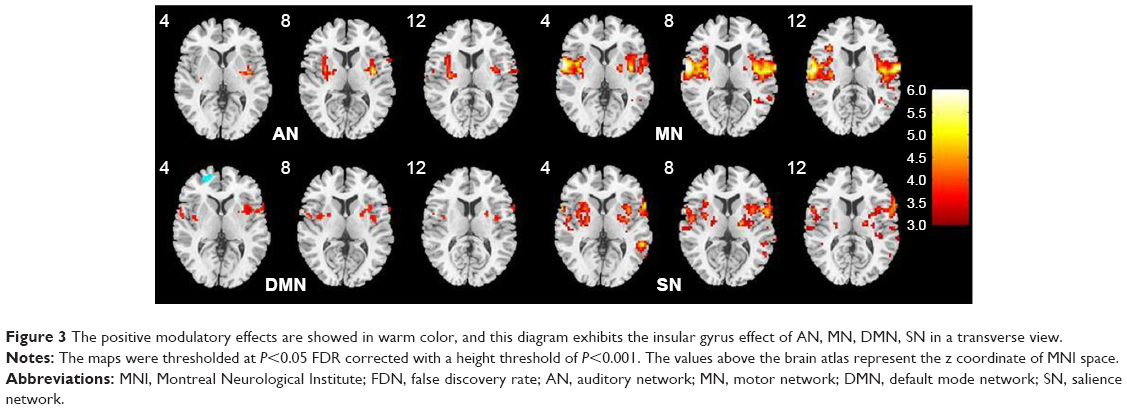 | Figure 3 The positive modulatory effects are showed in warm color, and this diagram exhibits the insular gyrus effect of AN, MN, DMN, SN in a transverse view. |
The supramarginal gyrus, receives somatosensory, visual, and auditory inputs from the brain, notably the right supramarginal can act an acceptor to perceive the emotions from surrounding environment.36 In the present study, support motor gyrus (SMG) participated in modulation of six RSNs, including dorsal attention network (DAN), motor network (MN), executive network (EN), and salience network (SN). The disruption of this region may cause humans to project their emotions onto others and become more egocentric.37 The positive results of this study suggest that MDD patients receive information all by him/herself and responds in a hyperactive situation. For that reason patients with MDD are more sensitive than normal subjects, due to the involvement of the right supramarginal in response to the information received through brain. Additionally, SMG may contribute to the reading without task demands, indicating that SMG can handle information spontaneously.38,39
As for right inferior frontal opercular gyrus, it modulate the two nodes of AN, DAN, EN, and SN. Some data suggest that this region is more involved in speech action, especially the motor aspect of speech. A recent study suggests that the right inferior frontal gyrus (IFG) may play an important role in mediating the understanding of a speaker’s emotional state and intentions.40 Previous neuroimaging studies reported that this region is involved in the selective response suppression in go or no-go task, and thus, opercular is believed to play an important role in the suppression of response tendencies.41 These nodes are modulated by right inferior frontal opercular gyrus (Broca’s area), which take part in language production. It may be suggested that inferior frontal opercular gyrus is another modulating point for MDD patients, but previous research did not focus much on this region. Therefore, we hypothesize that inferior frontal opercular gyrus may act as key factor in modulatory interaction.42
The different modulatory PPI effects on RSN
Besides DMN, all RSNs revealed positive PPI modulatory effects, particularly executive and motor networks. However, we did not find any clusters that are modulated by bilateral superior frontal gyrus and bilateral superior parietal lobule, which represent the bilateral executive network. Furthermore, there are some unusual clusters located in bilateral middle temporal gyrus and bilateral inferior frontal opercular gyrus that were nonexistent in a previous study.21 It is noteworthy to verify the modulation effects on the regions of DMN, since the network is involved in some regions that are “active” during the resting-state. Hence, the regions observed in this study are on the opposite side to task-relative regions, and we did not find any similar cluster in executive network.
The findings of our study are different from previous PPI studies on healthy cohorts, particularly in the DMN, dorsal attention network, executive network and extrastriate network. In fact we found some dissimilar clusters in RSNs compared to a study reported by Di et al. Therefore, we confirmed that the modulatory effects of major MDD resting-state network is distinct from the resting-state network of normal subjects, and these findings can be used for further understanding of the etiology and pathogenesis of MDD.
The negative modulatory effects are demonstrated in the analysis of default mode network. These results are consistent with Di et al.21 The clusters that exhibited negative modulatory effects in the MDD patient group are almost similar to those in the healthy subject group, including left middle frontal gyrus, medial frontal gyrus, superior frontal gyrus, and post cingulate gyrus. In addition to those findings, we found the left angular gyrus instead of inferior parietal lobule. These clusters, especially the middle cingulum left superior frontal gyrus and middle medial frontal gyrus, are responsible for decision making.43 Therefore, the deficiency of left inferior parietal lobule and the appearance of left angular can be explained by the different DMN affective between MDD patients and healthy controls.
The regions that revealed positive modulatory effects with DMN nodes are indicated as posterior cingulate gyrus and medial prefrontal cortex. Notably, only one region was found in the normal group, but multiple regions were positively detected in MDD group, including the bilateral insular, bilateral supramarginal gyrus and anterior cingulum. All these regions are assumed as key factor for the brain network of MDD patient. The abnormal change in these regions is most likely related to cognition.35,38 As for the auditory, salience and extrastriate networks, MDD patient group display more regions than the healthy group, with respect to bilateral superior temporal gyrus, inferior frontal gyrus and middle temporal gyrus. These findings suggest that the aesthesis network of MDD patients is more easily affected than healthy individuals. More importantly, the right putamen is involved in the modulation of the auditory network. The primary function of the putamen is to regulate the movements at different stages and influence various types of learning processes. Besides dopamine receptor gene polymorphisms and reduced levels of dopamine receptor D1 in striatum can implicate the role of dopamine in MDD.44
Finally, we focused on double executive network. By comparing our results with the PPI analysis of healthy subjects, we found that the executive network of MDD patients may not be modulated by any region. This observation indicated that the task-positive network relevant regions are depressed by certain regions, such as bilateral superior frontal gyrus. These regions may also integrate with task-relevant cortex and improve the performance of the executive network. Indeed, these regions are hypometabolized in depression state, and the degree of hypometabolism is significant correlated with severe symptom in Alzheimer’s disease.45
Future direction
The PPI analysis of MDD can enhance our understanding on brain disorders. A traditional PPI method (psychophysiological), is required to be carried out with a task, which is divided into different obstacle levels. However, some tasks are extremely challenging for uncovering the brain functions and patients may refuse to cooperate in completing the whole course. Therefore, we selected an alternative approach (physiophysiological), which can analyze the resting state function magnetic resonance data and identify the significant regions with modulatory effect on the reference ROI.46 In this study, the significant point revealed an important role of nonlinear modulation within the specific networks, (positive means motivate; negative means decay). Moreover, the resting state method is useful to explore the functional form of a patient’s brain and the network-level alterations for psychiatric and neurological diseases. The different modulatory interactions between MDD patients and healthy subjects may explain the depression-related difficulties in terms of emotional cognitive control. In addition, future investigations are warranted with large-scale data analysis from genomics, metabonomics, proteomics and other approaches to pinpoint the pathological changes in MDD patients.
Another interesting finding from our PPI analysis is that most of the brain regions not only appeared in default mode network, but also shown in motor network. Obviously, this observation may indicate the potential functional connectivity in MDD patients, through the combination of default mode and motor networks. All the brain regions with positive modulatory not only existed in a single network but also appeared in multiple RSNs, suggesting a large-scale network modulation in MDD patients.
Study limitation
Nonetheless, there were some unavoidable limitations that were encountered while conducting the research. First, the function of SPM for the extraction of volume of interestin time series was uncontrollable. Therefore, we calculated the course by re-editing and setting the accurate coordinate (Di et al). Additionally, the interactions between regions in a network have been reported,28 but we have yet to verify it. Second, our ICA results were not consistent with the previous study in terms of the eight brain networks in which the peaks were found in certain networks of MDD patients. Third, the atlas that used to locate the final regions of effective modulation was an anatomical automatic labeling template. However, some clusters did not display the exact coordinate. Moreover, the Brodmann area is required for comparison before obtaining the regions. Therefore, this method is exposed to some artificial errors. Alternatively, a different method is needed to deal with those weaknesses.
Conclusion
To the best of our knowledge, this is the first study to investigate the aberrant global voxel-wise PPI analysis of resting-state networks in patients with MDD. The findings suggest that the application of PPI analysis in neuroimaging may deepen our in understanding regarding the involvement of neural disruptions in emotional processing and mental illness.
A significant decreased of functional connectivity in the default mode network, salience network and executive network were observed among MDD patients as compared to healthy controls.2,5,47,48 By using PPI analysis approach, we discovered the connected RSNs for MDD, which provides evidence for extensive differences between MDD patients and healthy individuals. In addition, the positive outcomes of voxel-based PPI analysis may offer promising new targets for the treatment of MDD, including insular and supramarginal gyrus.47,49 Future prospective studies are warranted to elucidate the modulatory effects for relationships between MDD severity and patient’s clinic record, as well as to assess the group-level and individual variability in functional connectivity. More importantly, the role of thought suppression should be investigated in the near future, as it may possess a specific manifestation on brain activity and exert a profound impact on RSNs.
Acknowledgment
This work was supported by the National Key Research and Development Program of China (Grant No 2017YFA0505700), the National Natural Science Foundation of China (NSFC) (Grant No 61702064), and the China Postdoctoral Science Foundation (Grant No 2017M623303XB). Zhe Tu, Yuan Yuan Jia, and Tao Wang share first authorship.
Disclosure
The authors report no conflicts of interest in this work.
References
Belmaker RH, Agam G. Major depressive disorder. N Engl J Med. 2008;358(1):55–68. | ||
Fitzgerald PB, Laird AR, Maller J, Daskalakis ZJ. A meta-analytic study of changes in brain activation in depression. Hum Brain Mapp. 2008;29(6):683–695. | ||
Iwabuchi SJ, Krishnadas R, Li C, Auer DP, Radua J, Palaniyappan L. Localized connectivity in depression: a meta-analysis of resting state functional imaging studies. Neurosci Biobehav Rev. 2015;51:77–86. | ||
Savitz J, Drevets WC. Bipolar and major depressive disorder: neuroimaging the developmental-degenerative divide. Neurosci Biobehav Rev. 2009;33(5):699–771. | ||
Greicius MD, Flores BH, Menon V, et al. Resting-state functional connectivity in major depression: abnormally increased contributions from subgenual cingulate cortex and thalamus. Biol Psychiatry. 2007;62(5):429–437. | ||
Greicius MD, Supekar K, Menon V, Dougherty RF. Resting-state functional connectivity reflects structural connectivity in the default mode network. Cereb Cortex. 2009;19(1):72–78. | ||
Gitelman DR, Penny WD, Ashburner J, Friston KJ. Modeling regional and psychophysiologic interactions in fMRI: the importance of hemodynamic deconvolution. Neuroimage. 2003;19(1):200–207. | ||
Kim J, Horwitz B. Investigating the neural basis for fMRI-based functional connectivity in a blocked design: application to interregional correlations and psycho-physiological interactions. Magn Reson Imaging. 2008;26(5):583–593. | ||
Cisler JM, Bush K, Steele JS. A comparison of statistical methods for detecting context-modulated functional connectivity in fMRI. Neuroimage. 2014;84:1042–1052. | ||
Fox MD, Raichle ME. Spontaneous fluctuations in brain activity observed with functional magnetic resonance imaging. Nat Rev Neurosci. 2007;8(9):700–711. | ||
Lowe MJ, Mock BJ, Sorenson JA. Functional connectivity in single and multislice echoplanar imaging using resting-state fluctuations. Neuroimage. 1998;7(2):119–132. | ||
Cordes D, Haughton VM, Arfanakis K, et al. Mapping functionally related regions of brain with functional connectivity MR imaging. AJNR Am J Neuroradiol. 2000;21(9):1636–1644. | ||
Hampson M, Peterson BS, Skudlarski P, Gatenby JC, Gore JC. Detection of functional connectivity using temporal correlations in MR images. Hum Brain Mapp. 2002;15(4):247–262. | ||
Beckmann CF, Deluca M, Devlin JT, Smith SM. Investigations into resting-state connectivity using independent component analysis. Philos Trans R Soc Lond B Biol Sci. 2005;360(1457):1001–1013. | ||
de Luca M, Beckmann CF, de Stefano N, Matthews PM, Smith SM. fMRI resting state networks define distinct modes of long-distance interactions in the human brain. Neuroimage. 2006;29(4):1359–1367. | ||
Buckner RL, Krienen FM, Yeo BT. Opportunities and limitations of intrinsic functional connectivity MRI. Nat Neurosci. 2013;16(7):832–837. | ||
Exner C, Lange C, Irle E. Impaired implicit learning and reduced pre-supplementary motor cortex size in early-onset major depression with melancholic features. J Affect Disord. 2009;119(1–3):156–162. | ||
Wang Y-L, Yang S-Z, Sun W-L, Shi Y-Z, Duan H-F. Altered functional interaction hub between affective network and cognitive control network in patients with major depressive disorder. Behav Brain Res. 2016;298:301–309. | ||
Wang T, Wang K, Qu H, et al. Disorganized cortical thickness covariance network in major depressive disorder implicated by aberrant hubs in large-scale networks. Sci Rep. 2016;6(1):27964. | ||
Liu Y, Wu X, Zhang J, Guo X, Long Z, Yao L. Altered effective connectivity model in the default mode network between bipolar and unipolar depression based on resting-state fMRI. J Affect Disord. 2015;182:8–17. | ||
Di X, Biswal BB. Modulatory interactions of resting-state brain functional connectivity. PLoS One. 2013;8(8):e71163. | ||
O’Reilly JX, Woolrich MW, Behrens TE, Smith SM, Johansen-Berg H. Tools of the trade: psychophysiological interactions and functional connectivity. Soc Cogn Affect Neurosci. 2012;7(5):604–609. | ||
Cole DM, Smith SM, Beckmann CF. Advances and pitfalls in the analysis and interpretation of resting-state FMRI data. Front Syst Neurosci. 2010;4:8. | ||
Zhang B, Li M, Qin W, et al. Altered functional connectivity density in major depressive disorder at rest. Eur Arch Psychiatry Clin Neurosci. 2016;266(3):239–248. | ||
Calhoun VD, Adali T, Pearlson GD, Pekar JJ. A method for making group inferences from functional MRI data using independent component analysis. Hum Brain Mapp. 2001;14(3):140–151. | ||
Di X, Biswal BB. Modulatory interactions between the default mode network and task positive networks in resting-state. PeerJ. 2014;2:e367. | ||
Chumbley JR, Friston KJ. False discovery rate revisited: FDR and topological inference using Gaussian random fields. Neuroimage. 2009;44(1):62–70. | ||
Chang C, Glover GH. Time-frequency dynamics of resting-state brain connectivity measured with fMRI. Neuroimage. 2010;50(1):81–98. | ||
Lim HK, Jung WS, Aizenstein HJ. Aberrant topographical organization in gray matter structural network in late life depression: a graph theoretical analysis. Int Psychogeriatr. 2013;25(12):1929–1940. | ||
Liu Z, Xu C, Xu Y, et al. Decreased regional homogeneity in insula and cerebellum: a resting-state fMRI study in patients with major depression and subjects at high risk for major depression. Psychiatry Res. 2010;182(3):211–215. | ||
Smith DF. Systematic review of an emerging trend in china: resting-state functional connectivity in major depressive disorder. J Neuropsychiatry Clin Neurosci. 2015;27(2):104–111. | ||
Shen T, Li C, Wang B, et al. Increased cognition connectivity network in major depression disorder: a FMRI study. Psychiatry Investig. 2015;12(2):227–234. | ||
Takahashi T, Yücel M, Lorenzetti V, et al. Volumetric MRI study of the insular cortex in individuals with current and past major depression. J Affect Disord. 2010;121(3):231–238. | ||
Sprengelmeyer R, Steele JD, Mwangi B, et al. The insular cortex and the neuroanatomy of major depression. J Affect Disord. 2011;133(1–2):120–127. | ||
Nagai M, Kishi K, Kato S. Insular cortex and neuropsychiatric disorders: a review of recent literature. Eur Psychiatry. 2007;22(6):387–394. | ||
Silani G, Lamm C, Ruff CC, Singer T. Right supramarginal gyrus is crucial to overcome emotional egocentricity bias in social judgments. J Neurosci. 2013;33(39):15466–15476. | ||
Hartwigsen G, Baumgaertner A, Price CJ, Koehnke M, Ulmer S, Siebner HR. Phonological decisions require both the left and right supramarginal gyri. Proc Natl Acad Sci U S A. 2010;107(38):16494–16499. | ||
Stoeckel C, Gough PM, Watkins KE, Devlin JT. Supramarginal gyrus involvement in visual word recognition. Cortex. 2009;45(9):1091–1096. | ||
Frodl T, Scheuerecker J, Albrecht J, et al. Neuronal correlates of emotional processing in patients with major depression. World J Biol Psychiatry. 2009;10(3):202–208. | ||
Rota G, Sitaram R, Veit R, et al. Self-regulation of regional cortical activity using real-time fMRI: the right inferior frontal gyrus and linguistic processing. Hum Brain Mapp. 2009;30(5):1605–1614. | ||
Forstmann BU, van den Wildenberg WPM, Ridderinkhof KR. Neural mechanisms, temporal dynamics, and individual differences in interference control. J Cogn Neurosci. 2008;20(10):1854–1865. | ||
Tomaiuolo F, MacDonald JD, Caramanos Z, et al. Morphology, morphometry and probability mapping of the pars opercularis of the inferior frontal gyrus: an in vivo MRI analysis. Eur J Neurosci. 1999;11(9):3033–3046. | ||
Elliott R, Dolan R, Frith C. Dissociable Functions in the medial and lateral orbitofrontal cortex: evidence from human neuroimaging studies. Cereb Cortex. 2000;10(3):308–317. | ||
Dunlop BW, Nemeroff CB. The role of dopamine in the pathophysiology of depression. Arch Gen Psychiatry. 2007;64(3):327–337. | ||
Hirono N, Mori E, Ishii K, et al. Frontal lobe hypometabolism and depression in Alzheimer’s disease. Neurology. 1998;50(2):380–383. | ||
Tadic SD, Griffiths D, Schaefer W, Resnick NM. Abnormal connections in the supraspinal bladder control network in women with urge urinary incontinence. Neuroimage. 2008;39(4):1647–1653. | ||
Keedwell PA, Andrew C, Williams SCR, Brammer MJ, Phillips ML. the neural correlates of anhedonia in major depressive disorder. Biol Psychiatry. 2005;58(11):843–853. | ||
Almeida JRC, Mechelli A, Hassel S, Versace A, Kupfer DJ, Phillips ML. Abnormally increased effective connectivity between parahippocampal gyrus and ventromedial prefrontal regions during emotion labeling in bipolar disorder. Psychiatry Res. 2009;174(3):195–201. | ||
Smoski MJ, Felder J, Bizzell J, et al. fMRI of alterations in reward selection, anticipation, and feedback in major depressive disorder. J Affect Disord. 2009;118(1–3):69–78. |
 © 2018 The Author(s). This work is published and licensed by Dove Medical Press Limited. The full terms of this license are available at https://www.dovepress.com/terms.php and incorporate the Creative Commons Attribution - Non Commercial (unported, v3.0) License.
By accessing the work you hereby accept the Terms. Non-commercial uses of the work are permitted without any further permission from Dove Medical Press Limited, provided the work is properly attributed. For permission for commercial use of this work, please see paragraphs 4.2 and 5 of our Terms.
© 2018 The Author(s). This work is published and licensed by Dove Medical Press Limited. The full terms of this license are available at https://www.dovepress.com/terms.php and incorporate the Creative Commons Attribution - Non Commercial (unported, v3.0) License.
By accessing the work you hereby accept the Terms. Non-commercial uses of the work are permitted without any further permission from Dove Medical Press Limited, provided the work is properly attributed. For permission for commercial use of this work, please see paragraphs 4.2 and 5 of our Terms.