")
Back to Journals » Cancer Management and Research » Volume 12
Modulation of Calcium Homeostasis May Be Associated with Susceptibility to Renal Cell Carcinoma in Diabetic Nephropathy Rats
Authors Luo Y, Lu Z, Waaga-Gasser AM, Yang H , Liu J , Wu J, Lu J, Liu X, Zhang L
Received 18 June 2020
Accepted for publication 16 August 2020
Published 7 October 2020 Volume 2020:12 Pages 9679—9689
DOI https://doi.org/10.2147/CMAR.S268402
Checked for plagiarism Yes
Review by Single anonymous peer review
Peer reviewer comments 2
Editor who approved publication: Dr Kenan Onel
Yueming Luo1,2 *,* Zhaoyu Lu1 *,* Ana Maria Waaga-Gasser,3 Haifeng Yang,4 Jialing Liu,1 Juan Wu,5 Jiayan Lu,1 Xusheng Liu,1 Lei Zhang1
1Nephrology Department, State Key Laboratory of Dampness Syndrome of Chinese Medicine, Guangdong Provincial Key Laboratory of Clinical Research on Traditional Chinese Medicine Syndrome, The Second Affiliated Hospital of Guangzhou University of Chinese Medicine, Guangzhou, People’s Republic of China; 2Department of Nephrology, The Fourth Clinical Medical College of Guangzhou University of Chinese Medicine, Shenzhen Traditional Chinese Medicine Hospital, Shenzhen, Guangdong, People’s Republic of China; 3Transplantation Research Center, Brigham and Women’s Hospital, Harvard Medical School, Boston, MA, USA; 4Department of Pathology, The Second Affiliated Hospital of Guangzhou University of Chinese Medicine, Guangzhou, People’s Republic of China; 5Department of Pediatrics, Guangdong Second Hospital of Chinese Medicine, Guangzhou, People’s Republic of China
*These authors contributed equally to this work
Correspondence: Lei Zhang; Xusheng Liu Tel +86-20-81887233-34330
Email [email protected]; [email protected]
Introduction: Clinical studies have indicated a relationship between diabetic nephropathy (DN) and the incidence and prevalence of renal cell carcinoma (RCC). However, the mechanism linking diabetic nephropathy and renal cell carcinoma has not yet to be identified.
Methods: In this study, a total of 42 male Sprague Dawley (SD) rats were randomly assigned to a DN group (n=35) and a control group (n=7). All animals in the DN group were unilaterally nephrectomized and treated with streptozotocin with the development of blood glucose levels > 16.7mmol/L and dominant proteinuria and were compared to controls without such changes. Histopathologic alterations in the kidneys were examined by HE staining and Ki-67 immunohistochemistry. Differentially expressed genes were identified and validated by RNA-seq and PCR.
Results: As the results, except for two rats that failed to develop the DN model and were excluded from the analysis, 33 rats in the DN group with overt signs of DN demonstrated significantly higher food and water intake, urine production, and urine protein and urinary protein/creatinine ratio than controls. Overall, 15.2% (n=5/33) of DN animals developed RCC while none tumors were observed in the control group (n=0/7). RNA-seq analysis in these animals indicated different TRPV5 gene expression and calcium pathway expression in DN animals with developing tumors, when compared with animals with no obvious tumors. In addition, DN animals diagnosed with RCC showed increased expression of GLUT2 and c-met, when compared to controls and DN animals without tumors.
Discussion: In conclusion, the disordered calcium metabolism, especially disturbed TRPV5 mediated Ca2+ signal, may have been related to the development of RCC in DN rats. Further studies related to the detailed mechanism are still needed.
Keywords: diabetic nephropathy, renal cell carcinoma, calcium homeostasis, calcium pathway, RNA-Seq
Introduction
Diabetes mellitus (DM) is one of the most serious public health challenges. In 2017, DM was estimated to be present in 8.8% of the worldwide population, with an expected increase to 9.9% by 2045.1 In general, hyperglycemia may lead to multiple complications including diabetic nephropathy (DN), which is a leading cause of chronic kidney diseases in humans.2 DN increases the incidence and prevalence of end-stage renal disease (ESRD) and is the most common cause of increased morbidity and mortality of patients with diabetes.3,4
Clinical studies have shown a positive correlation between diabetes and several types of cancer, including bladder, breast, colorectal, kidney, endometrial, pancreatic, and hepatocellular carcinomas,5 and an increase in total cancer-related mortality. Several mechanisms caused in the development of renal cell carcinoma (RCC) in diabetes have included increased growth factors and/or their receptors, hyperinsulinemia and glucose availability.6,7 For example, in kidney cancer, the relative risk in diabetes patients is 1.38-fold higher8 and total cancer mortality is 1.21-fold higher9 than in non-diabetic patients. In addition, an association between hyperglycemia and cancer incidence and mortality has been reported, and the incidence increases linearly with increasing glycemia.7,10 Several pathophysiological mechanisms linking diabetes to an increased risk of cancer have been postulated, including insulin resistance and hyperinsulinemia, enhanced inflammatory processes, dysregulated sex hormone production and hyperglycemia. Several common risk factors have also been shown to play a role, especially obesity.6,7
Hyperglycemia is a major contributing factor in the deterioration of kidney function and the development of diabetic nephropathy (DN), the most common cause of the increased morbidity and mortality of patients with diabetes.3 DN patients have significantly higher serum squamous cell carcinoma antigen, cytokeratin 19 fragment and carcinoembryonic antigen levels than both patients with normal albuminuria and healthy controls,11 which may underlie a relationship between DN and the incidence and prevalence of RCC. However, although DN patients are at higher risk of cancer, a mechanism linking diabetic kidney disease and RCC has not yet to be identified.
Here we described that kidneys in a model of streptozotocin-rendered diabetic rats with signs of diabetic nephropathy over the long-term developed RCC. Therefore, persistent hyperglycemia could influence the activation of molecular pathways that need to be further elucidated. Our results indicate upregulated renal GLUT2 expression and deregulated Ca2+ homeostasis to be involved in the tubular cell damage occurring during diabetes and putatively supporting renal cell carcinogenesis.
Materials and Methods
Animals and Reagents
For this study, 42 12-week-old male Sprague-Dawley (SD) rats were purchased from the Animal Center of Southern Medical Hospital (Guangzhou, China). The rats were housed in our animal facility under pathogen-free conditions and fed a standard laboratory diet, with free access to water. This study was approved by the institutional ethics review board of Guangdong Provincial Hospital of Chinese Medicine (NO.2017016). The welfare of the laboratory animals was followed by the guidelines, Laboratory animal-Guideline for ethical review of animal welfare in Guangdong Provincial Hospital of Chinese Medicine.
Streptozotocin (STZ) was purchased from Sigma Aldrich (St. Louis, MO, USA). The blood glucose meter and blood glucose test strip were purchased from Abbott Laboratories (Chicago, IL, USA).
Establishing the Diabetic Nephropathy Rat Model
An accelerated DN model was obtained by subjecting the rats to unilateral nephrectomy and STZ treatment. The 42 SD rats were randomly divided into control (n = 7) and diabetic nephropathy (n = 35) groups. Nephrectomy was performed in rats anesthetized via an intraperitoneal injection of 2.0% pentobarbital sodium (30 mg/kg). The left kidney was removed after ligation of the renal artery, vein and ureter. In control rats, the renal capsule was separated but a nephrectomy was not performed.
One week after unilateral nephrectomy, STZ, dissolved in 0.1 M citrate buffer (pH 4.5), was administered to the rats via intraperitoneal injection at a dose of 65 mg/kg. Control rats were injected with 0.1 M citrate buffer solution.
Blood samples were taken from the tail vein at 72 h after STZ injection to measure blood glucose levels. Only rats with fasting blood glucose levels >16.7 mmol/L and obvious proteinuria were considered diabetic and studied further. Two rats were failed to developed DN model due to they have not sustained high blood glucose levels throughout the experimental period. Hence, the DN group consisted of 33 rats. The rats were monitored for up to 20 weeks post-STZ injection.
Blood Glucose and Urinary Protein Testing
Blood glucose and urinary protein were measured every 4 weeks. Blood glucose levels were determined from extracted tail blood using an Abbott blood glucose meter. Urinary protein was measured in rats kept in individual metabolic cages for 24-h urine collection. The urine was centrifuged at 800 g for 10 min at 4°C. Urinary protein concentrations were measured using a Pierce™ BCA protein assay kit (Thermo Fisher Scientific, Waltham, MA, USA) according to the manufacturer’s instructions.
Hematoxylin and Eosin (HE) Staining
After 20 weeks of long-term hyperglycemia, the rats were euthanized and their kidneys prepared for pathological examination. Fixed kidney tissues were paraffin-embedded and 2.5-µm serial paraffin sections were cut using a microtome. Pathological changes were examined by HE staining. Briefly, the sections were deparaffinized in xylene (25 min) and rehydrated with successive 1-min washes in 100%, 90%, 80%, and 70% ethanol. They were then stained with hematoxylin (2 min), rinsed with distilled water, rinsed with 0.1% hydrochloric acid in 50% ethanol, rinsed with tap water for 15 min, stained with eosin for 1 min, and rinsed again with distilled water. The sections were then successively dehydrated with 95% and 100% ethanol followed by xylene (25 min) and mounted with coverslips.
Immunohistochemical Examination
Indirect immunoperoxidase staining with a HistostainTM-Plus kit was performed to assess the expression of Ki-67. Herein we use Ki-67 because it is regarded as one of the classical markers associated with tumour proliferation on RCC.12 Tissue sections (2.5-μm thick) were mounted on poly-L-lysine-coated slides, deparaffinized with xylene and rehydrated. The sections were microwaved in 10 mmol/L citrate buffer (pH 6.0) at 100°C for 5 min to unmask the antigen. After endogenous peroxidase had been blocked, the sections were incubated with primary antibody (1:50 diluted for Ki-67) at 4°C overnight. The reactions on the sections were detected with peroxidase substrate containing DAB. All sections were counterstained with hematoxylin. The degree of Ki-67 expression was evaluated with image analysis software.
BGISEQ 500 RNA-Sequencing
Renal carcinoma tissue (from DN-carcinoma) and renal tissue (from DN-no carcinoma group) were prepared for RNA-sequencing. Samples were sent to The Beijing Genomics Institute (BGI, Shenzhen, China). The products were purified and then enriched by polymerase chain reaction (PCR) amplification. The PCR yield was quantified using Qubit and the samples pooled to obtain a single-stranded DNA circle (ssDNA circle), the form of the final library. DNA nanoballs (DNBs) were generated using the ssDNA circles by rolling-circle replication to enlarge the fluorescence signals during the sequencing process. The DNBs were loaded into the patterned nanoarrays and single-end reads of 50 bp were generated using the BGISEQ-500 platform for the following data analysis.
The sequencing data were filtered with SOAPnuke (v1.5.2) by (1) Removing reads containing sequencing adapter; (2) Removing reads whose low-quality base ratio (base quality less than or equal to 5) is more than 20%; (3) Removing reads whose unknown base (“N” base) ratio is more than 5%, afterwards clean reads were obtained and stored in FASTQ format. The clean reads were mapped to the reference genome using HISAT2 (v2.0.4). After that, Ericscript (v0.5.5) and rMATS (V3.2.5) were used to fusion genes and differential splicing genes (DSGs), respectively. Bowtie2 (v2.2.5) was applied to align the clean reads to the gene set, a database for this organism built by BGI (Beijing Genomic Institute in ShenZhen), which are known and novel, coding transcripts were included, then expression level of gene was calculated by RSEM (v1.2.12). The heatmap was drawn by pheatmap (v1.0.8) according to the gene expression in different samples. Essentially, differential expression analysis was performed using the DESeq2 (v1.4.5) with Q value ≤ 0.05. To take insight into the change of phenotype, GO (http://www.geneontology.org/) and KEGG (https://www.kegg.jp/) enrichment analysis of annotated different expression gene was performed by Phyper (https://en.wikipedia.org/wiki/Hypergeometric_distribution) based on Hypergeometric test.
Kidney RNA Extraction and Quantitative RT-PCR
Quantitative RT-PCR was used for the validation of DEGs. Kidney RNA was isolated from renal carcinoma tissue (from DN-carcinoma) and renal tissue (from control and DN-no carcinoma group) using TRIZOL reagent. RNA quantity and quality were determined at a wavelength of 260/280 nm. cDNA was generated from 5 µg of total RNA using reverse transcriptase. The 10-µL amplification reaction included TB Green Premix Ex Taq (Takara, Dalian, China). All reactions were performed on a CFX384 Real-time PCR System (ViiA7, USA). The thermal cycling conditions were 30s at 50°C, followed by 40 repeats at 95°C for 5s, 60°C for 34s.To control for variations in the reactions, the amount of target mRNA was normalized to invariable control gene GLUT1, GLUT2, c-met, c-myc, p53, Ras expression. The comparative threshold cycle (Ct) method was used to determine the amount of target gene normalized to tuba4a and relative to a calibrator 2−ΔΔCt. The purity of PCR products was verified by melting curves and gel electrophoresis (Table 1).
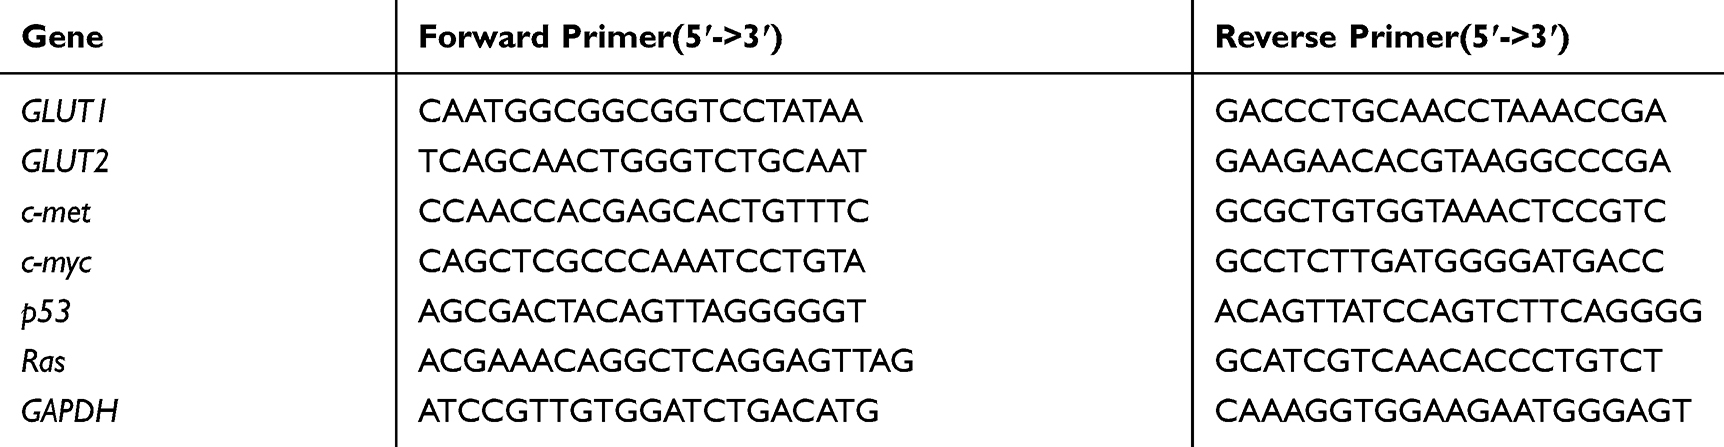 |
Table 1 Primers Used in qPCR |
Statistical Analysis
All data are presented as the mean ±SE with normal distribution. The significance of differences in data between the groups was determined by one-way ANOVA followed by Turkey’s test for equality of variances. All analyses were performed using the Predictive Analytics Software (PASW) Statistics 18.0 software package (SPSS Inc. IBM Corporation, Armonk, New York, USA). Differences were considered statistically significant at p < 0.05.
Results
Functional Characteristics in Animals with Diabetic Nephropathy
Two rats were excluded due to they have not sustained high blood glucose levels (16.7–27.8 mmol/L) throughout the experimental period. In the endpoint, rats in diabetic nephropathy group (n=33) exhibited significant weight loss, higher levels of food and water intake, and a higher volume of urine output, presumably as a result of the catabolic effects of insulin deficiency and severe hyperglycemia as well as the volume depletion associated with osmotic dieresis (Figure S1). In addition, 24-h urine protein levels at 8 weeks post-STZ injection were significantly increased in the DN group (446.08±193.12 mg/day) than in the control group (163.32 ± 19.7 mg/day) and the difference remained significant (P <0.05) during the study (Figure 1).
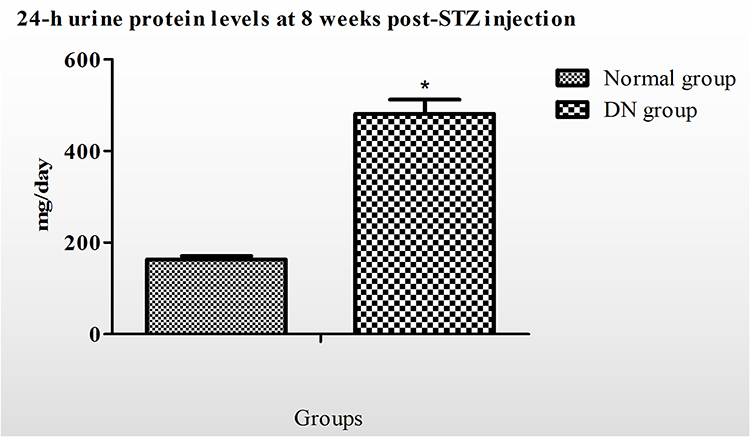 |
Figure 1 Comparison of urinary protein excretion in animals with diabetic nephropathy (DN) and non-diabetic controls (control). Data was calculated as mean± SE in mg/24h. *p < 0.05. |
Development of RCC in Animals with Diabetic Nephropathy
None of the animals with DN showed clear signs of macroscopic RCC development at the end of the observation period of 20 weeks. However, HE staining of five out of a total of 33 DN cases confirmed the infiltration of RCC. Nodular lesions with clear boundaries were seen microscopically, and necrotic manifestations were seen in some lesions. The lesions consisted of hyperplastic epithelial cells with a nest-like distribution and were rich in thin-walled blood sinuses. The nuclei of the tumor cells were significantly larger and hyperchromatic than those of normal renal tubular epithelial cells. Eosinophilic nucleoli and numerous mitoses were also observed in the tumor areas. The cytoplasm of atypic cells in tumor cell nests was abundant and contained eosinophilic granules (Figure 2). The classical markers of tumor proliferation, Ki-67 positivity rate in the tumor tissue were ~18%, indicating that the tumor has a certain proliferation ability (Figure 3).
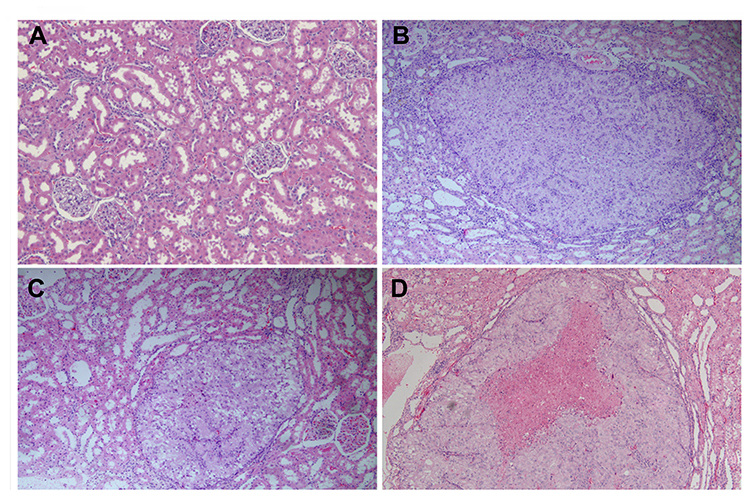 |
Figure 2 Pathological of renal cell carcinoma (HE staining, 100×). HE staining results demonstrate the infiltration of minute renal cell carcinoma. The nodular lesions with clear boundaries were seen, and necrotic manifestations were seen in some lesions. (A) Normal glomerulus and tubulointerstitium. (B–D) Nodular lesions with clear boundaries were seen in B-D. The lesions consisted of hyperplastic epithelial cells with a nest-like distribution and were rich in thin-walled blood sinuses. The nuclei of the tumor cells were significantly larger and hyperchromatic. Eosinophilic nucleoli and numerous mitoses were also observed. The cytoplasm of atypic cells in tumor cell nests was abundant and contained eosinophilic granules. |
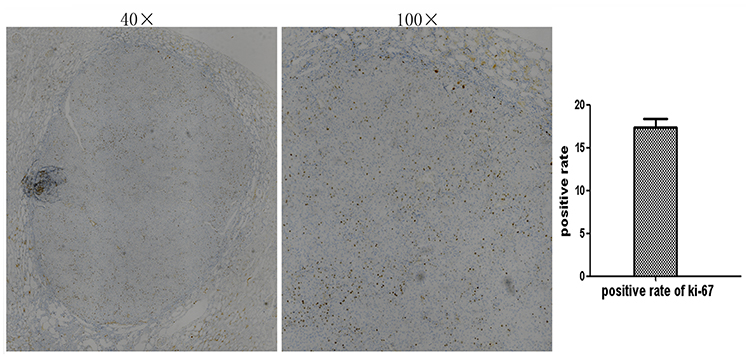 |
Figure 3 Ki-67 immunohistochemical staining (40× and 100×). Localization of Ki-67 in Kidney tissue paraffin section was determined by immunohistochemical staining (IHC). The positive rate of ki-67 in the tumor tissue is about 18%. |
Comparison Between Kidneys with Diabetic Nephropathy from Animals with and without RCC
For further comparison, we investigated the 5 animals with RCC (RCC group) and another subgroup of DN rats without carcinoma development (no-carcinoma group). We found that from the mode of formation, after 8, 12, 16 and 20 weeks of ongoing diabetic nephropathy, there was no statistical difference in 24hrs proteinuria results between the RCC group and the no-carcinoma animals (Figure 4).
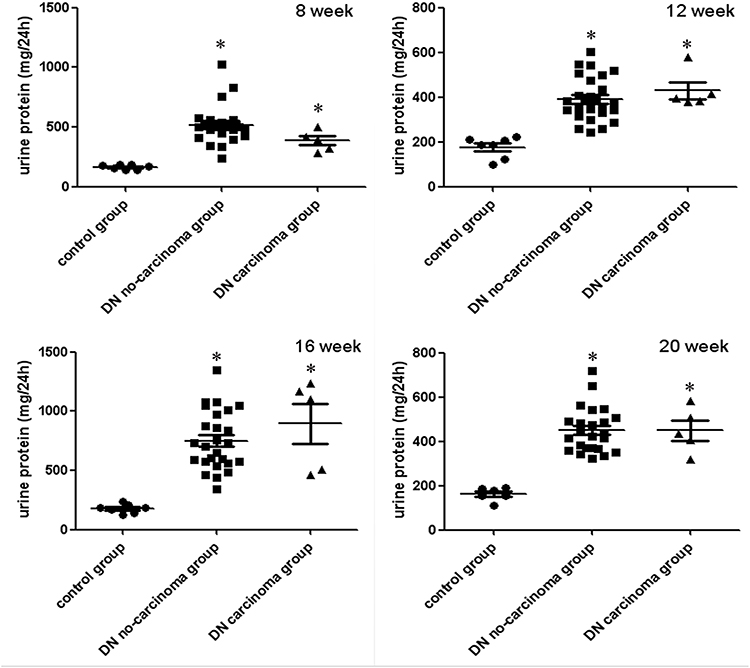 |
Figure 4 Comparison of urinary protein excretion in animals with diabetic nephropathy (DN) and renal cell tumors versus no tumors and non-diabetic controls (control group). Data was calculated as mean± SE in mg/24h. *p < 0.05 VS control group. |
Comparative Transcriptomic Analysis Between Kidneys with RCC and Without Carcinoma
To investigate the genes differentially expressed in RCC tissue, a BGI-SEQ 500 based RNA-sequencing strategy was applied to compare the kidney mRNA expression levels between RCC and no-carcinoma bearing kidneys. A library was constructed from five pooled mRNA samples from each group and then analyzed by RNA-seq (BioProject accession: PRJNA597461). The total clean reads obtained in each sample comprised sequences of ≥ 101 Mb, and > 93% of the clean reads could be aligned against a mouse genome database.
Genes identified in a comparison of the two groups using the DEseq2 tool and with a fold change ≥ ±2.00 and an adjusted P value ≤ 0.05 were identified as DEGs. A total of 524 genes demonstrated a significantly higher expression level, while 523 genes were down-regulated in kidneys with carcinomas compared with no-carcinomas (Figure 5A).
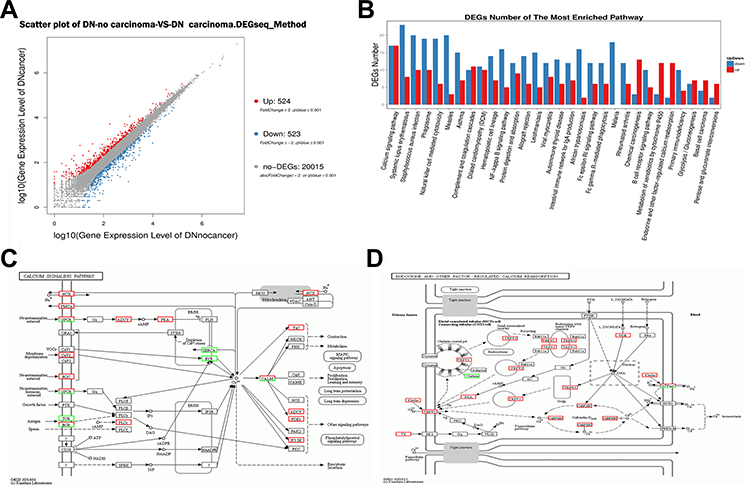 |
Figure 5 Transcriptomic study of renal carcinoma tissue (from DN-carcinoma) and renal tissue (from DN-no carcinoma group). (A) Identification of 524 differentially expressed genes (DEGs) in the kidney with significantly higher expression and 523 DEGs with significantly lower expression in the DN-carcinoma group than in the DN group. (B) A KEGG pathways analysis assigned these DEGs to calcium signaling, endocrine and other factor-regulated calcium reabsorption pathways. (C) Most of the DEGs enriched in the calcium pathway were up-regulated in the DN-carcinoma group vs the DN group, (D) as were most of the DEGs enriched in the endocrine pathway and other factor-regulated calcium reabsorption pathways. |
To identify the biological processes and molecular functions relevant to the DEGs, a GO annotation was applied. In the biological processes category, the results implicated a high glucose level as a transcriptional regulator in the rat diabetic kidney. The DEG-associated pathways were explored using KEGG pathway enrichment, which showed that the DEGs were mainly enriched in signal transduction pathways, including the calcium-signaling pathway and the regulation of calcium reabsorption (Figure 5B–D).
Gene Expression of Cellular Glucose Transporters and Cancer Genes Related to Hyperglycemia
The expression of cellular glucose transporters and cancer genes related to hyperglycemia was elevated, including c-myc, c-met, GLUT1, GLUT2, p53 and RAS (Figure 6). The expression of GLUT2 and c-met expression was significantly increased in tumors of DN animals when compared to controls without DN and those without tumors but with DN (P < 0.05).
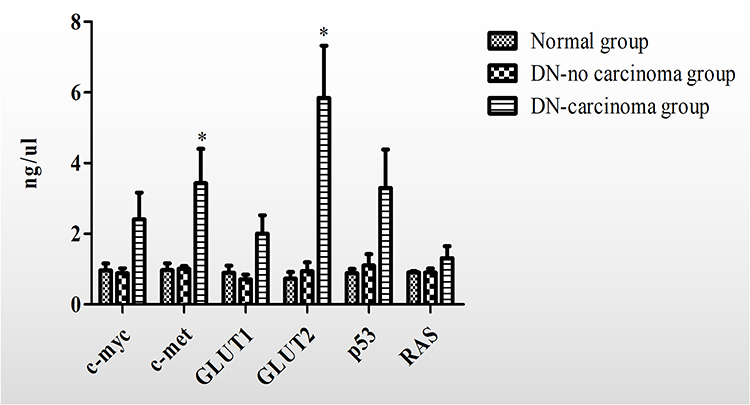 |
Figure 6 qPCR (Glut1, Glut2, p53, Ras, c-met, and c-myc, x-axis: fold changes, kidneys from animals with diabetic nephropathy with renal cell carcinoma (DN carcinoma) or no tumors (DN no carcinoma) versus controls (normal)). Differentially expressed genes for relevant glucose transporters, oncogenes, suppressor genes, and nuclear transcription regulators were observed. Data was calculated as mean± SE. *p < 0.05 VS DN-no carcinoma group. |
Discussion
In our study, RCC could be found in DN rats established by unilateral nephrectomy and streptozotocin (STZ) intraperitoneal injection. HE staining and Ki-67 immunohistochemistry staining revealed typical renal carcinoma pathological changes. And oncogenic c-met expression was linearly increased in kidney tumors of animals with diabetic nephropathy. According to the new finding, we constructed a renal transcriptomic strategy to investigate the susceptibility mechanisms between the DN and RCC. Enriched DEGs between DN-carcinoma group and DN-no carcinoma group revealed the susceptibility mechanism of RCC in DN rats may be due to the calcium pathways disorder.
RCC has an incidence of approximately 65,000 cases annually in the USA, with approximately 15,000 related deaths each year.13 It was found to be more aggressive in patients with diabetes. A meta-analysis of 24 studies found a positive association between diabetes and RCC (relative risk [RR] 1.18; 95% CI 1.04–1.34).8 Another meta-analysis of Asian patients with a mean follow-up of 12.7 years and documenting 37,343 cancer deaths showed that diabetes was associated with an 84% increased risk of death from kidney cancer, implying that diabetes is associated with an increased risk of RCC and a higher related mortality.
There are many pathways which can contribute to the development of RCC in diabetes. The most frequently mentioned carcinogenic factors include hyperglycemia, hyperactivation of the protein kinase B (Akt)/mammalian target of rapamycin (mTOR) pathway,14 and hyperinsulinemia and the insulin‑like growth factor (IGF) family.15,16 Among these factors, hyperinsulinemia and hyperglycemia are considered as independent carcinogenic factors, as they can increase the inflammatory response,17 oxidative stress reaction18 and lipid peroxidation.
However, besides most studies that focused on the carcinogenesis of associated metabolic alterations in diabetes, there is less basic research that investigated the underlying mechanism between diabetic nephropathy and renal cell carcinogenesis.
This study demonstrated for the first time the evidence that RCC development could be found in a rat model of animals suffering from diabetic nephropathy over time.
According to the described new findings in this study, we constructed a renal transcriptomic strategy to investigate the underlying molecular mechanisms of RCC in DN animals. The analysis of enriched differentially expressed genes between animals with diabetic nephropathy and developing tumors or no tumors showed different TRPV5 gene expression and calcium pathway expression in diabetic animals with nephropathy and developing tumors, when compared with animals with diabetic nephropathy but no obvious tumors, indicating higher calcium reabsorption in rats with RCC.
The kidneys regulate calcium homeostasis by filtration and reabsorption, with ~99% of calcium reabsorbed by the kidney tubules, which is the most common origin of RCC. Alteration of Ca2+ signaling has been implicated either directly or indirectly in tumorigenesis and tumor progression,19 including RCC.20 Most recent evidence suggests that high glucose levels could result in a marked rise of [Ca2+] levels due to an increased calcium entry into the cell.3 High glucose levels induce the release of intracellular stores of calcium from the endoplasmic reticulum.3 As the major Ca2+ influx mechanism, transient receptor potential (TRP) channels form a superfamily of non-selective cation channels with varying degrees of Ca2+ permeability that respond to a variety of distinct stimuli, including chemicals, temperature and mechanical stress.21 The de-regulation of TRP channels can stimulate RCC development and progression,22 such as TRPM3,23,24 TRPC625 and TRPC1. Among TRP family channels, TRPV5 is remarkably calcium-selective channels which serve as calcium entry mechanisms in kidney. TRPV5 expression is most prominent in the renal tubules and it is responsible for ~15% of the calcium reabsorbed in the urine to flow along a concentration gradient through the channel pore into the cell.26 TRPV5 is a highly calcium selective ion channel that acts as the rate-limiting step of calcium reabsorption in the kidney. In vivo study, the TRPV5 knockout mice present with severe hyper-calciuria and bone abnormalities. Results of the study by YY Wu et al, which was consistent with our findings, demonstrated that overexpression of vitamin D receptor (VDR) decreased TRPV5 expression, significantly inhibited RCC cells proliferation, migration and invasion in vitro. Increased TRPV5 expression may induce increases in [Ca2+] and mitochondrial [Ca2+], thus activating mitochondrial membrane permeabilization and, potentially, differentiation, apoptosis or necrosis.27,28 And previous clinical research found that calcium levels affect the prognosis of RCC patients and the calcium-sensing genes on the plasma membrane could be used as biomarkers to predict the prognosis of RCC patients.
Besides, this study also found significant increased expression of GLUT2 in tumors of DN animals when compared to controls without DN and those without tumors but with DN. GLUT2 is the major glucose transporter on the proximal tubule basolateral membrane of intestinal and kidney epithelial cells.29 It is responsible for glucose reabsorption from the tubular lumen in the early proximal (S1 and S2 segments) and distal (S3) tubules of the kidney. Recent evidence implies that glucose transport via the facilitative transporter GLUT2 is increased in both humans with diabetes and diabetic animals.3,30,31 The deregulated expression of GLUTs with different hexose affinities may allow tumor cells to optimize their energy supply and thus gain a fundamental advantage for growth,29 as over-expressed GLUTs contribute to an increase in glucose utilization.32 Recent studies pointed to the finding that GLUT2 expression was indeed upregulated in several cancers.33–37 In agreement with previous studies, we found a profoundly increased expression of GLUT2 in animals with diabetic nephropathy and tumors within their damaged kidneys. This suggests that upregulated GLUT2 expression may consequently amplify the tubular cell damage and upon this facilitate tubular carcinogenesis occurring during diabetes.
Moreover, oncogenes, suppressor genes and central growth regulators such as c-met, c-myc, p53 and Ras could be activated directly and indirectly and linked to renal cell carcinogenesis.38,39 Our data showed that c-met have a significant higher expression in RCC.
Increasing evidence shows that oncogenic mutations culminate in the up-regulation of glucose transporters. This facilitates increased glucose consumption by tumor cells, which in turn increases the rate of glucose metabolism necessary for uncontrolled tumor cell reduplication.40 Diabetes may provide in this context a suitable hyperglycemic microenvironment during the initiation and progression of cancer.41 Previous studies have shown that oncogenes and tumor suppressor genes can regulate altered energy metabolism. Our research supported this observation, as c-met expression was demonstrated to be upregulated in tumor-bearing kidneys from animals with diabetic nephropathy.
In conclusion, the disordered calcium metabolism, especially disturbed TRPV5 mediated Ca2+ signal, identified in our study may have been related to the development of RCC in DN rats. However, the detailed mechanism between calcium metabolism and RCC in DN needs to be explored in further studies.
Data Sharing Statement
The RNA-Seq datasets were acquired from BGI company (Shenzhen, China) and have been deposited in NCBI repositories (bioProject SRA:PRJNA597461).
Ethics Statement
This research was approved by the institutional ethics review board of Guangdong Provincial Hospital of Chinese Medicine (NO.2017016).
Author Contributions
All authors agreed to submit to the current journal; gave final approval of the version to be published; and agree to be accountable for all aspects of the work. YML and ZYL undertook primary analysis of data for this manuscript, interpreted results, wrote first draft of the manuscript, read and approved final manuscript. XSL was the principal investigator. He participated in design and co-ordination, and read and approved the final manuscript. LZ conceived the study, participated in design and co-ordination, data analysis and interpretation of results, helped to draft the manuscript, and read and approved the final manuscript. All other authors made substantial contributions to analysis and interpretation of data; took part in revising it critically for important intellectual content.
Funding
This work was supported by grant from the Program of the National Natural Science Foundation of China (Grant No. 81603717 and No. 81873261).
Disclosure
The authors declare that the research was conducted in the absence of any commercial, financial, or other relationships that could be construed as a potential conflict of interest.
References
1. Cho NH, Shaw JE, Karuranga S, et al. IDF diabetes atlas: global estimates of diabetes prevalence for 2017 and projections for 2045. Diabetes Res Clin Pract. 2018;138:271–281. doi:10.1016/j.diabres.2018.02.023
2. Nasri H, Rafieian-Kopaei M. Diabetes mellitus and renal failure: prevention and management. J Res Med Sci. 2015;20(11):1112–1120. doi:10.4103/1735-1995.172845
3. Hinden L, Udi S, Drori A, et al. Modulation of renal GLUT2 by the cannabinoid-1 receptor: implications for the treatment of diabetic nephropathy. J Am Soc Nephrol. 2018;29(2):434–448. doi:10.1681/ASN.2017040371
4. Packham DK, Alves TP, Dwyer JP, et al. Relative Incidence of ESRD versus cardiovascular mortality in proteinuric type 2 diabetes and nephropathy: results from the DIAMETRIC (diabetes mellitus treatment for renal insufficiency consortium) database. Am J Kidney Dis. 2012;59(1):75–83. doi:10.1053/j.ajkd.2011.09.017
5. Tsilidis KK, Kasimis JC, Lopez DS, Ntzani EE, Ioannidis JP. Type 2 diabetes and cancer: umbrella review of meta-analyses of observational studies. BMJ. 2015;350(jan02 1):g7607. doi:10.1136/bmj.g7607
6. Ozbek E, Otunctemur A, Dursun M, et al. Association between the metabolic syndrome and high tumor grade and stage of primary urothelial cell carcinoma of the bladder. Asian Pac J Cancer Prev. 2014;15(3):1447–1451. doi:10.7314/APJCP.2014.15.3.1447
7. Garg SK, Maurer H, Reed K, Selagamsetty R. Diabetes and cancer: two diseases with obesity as a common risk factor. Diabetes Obes Metab. 2014;16(2):97–110. doi:10.1111/dom.12124
8. Bao C, Yang X, Xu W, et al. Diabetes mellitus and incidence and mortality of kidney cancer: a meta-analysis. J Diabetes Complications. 2013;27(4):357–364. doi:10.1016/j.jdiacomp.2013.01.004
9. Noto H, Tsujimoto T, Sasazuki T, Noda M. Significantly increased risk of cancer in patients with diabetes mellitus: a systematic review and meta-analysis. Endocr Pract. 2011;17(4):616–628. doi:10.4158/EP10357.RA
10. Sieri S, Pala V, Brighenti F, et al. High glycemic diet and breast cancer occurrence in the Italian EPIC cohort. Nutr Metab Cardiovasc Dis. 2013;23(7):628–634. doi:10.1016/j.numecd.2012.01.001
11. Chen J, Tao F, Zhang B, et al. Elevated squamous cell carcinoma antigen, cytokeratin 19 fragment, and carcinoembryonic antigen levels in diabetic nephropathy. Int J Endocrinol. 2017;2017:5304391. doi:10.1155/2017/5304391
12. Brookman-May S, Langenhuijsen JF, Volpe A, et al. Management of localized and locally advanced renal tumors. A contemporary review of current treatment options. Minerva Med. 2013;104(3):237–259.
13. Siegel RL, Miller KD, Jemal A. Cancer statistics, 2016. CA Cancer J Clin. 2016;66(1):7–30. doi:10.3322/caac.21332
14. Ribback S, Cigliano A, Kroeger N, et al. PI3K/AKT/mTOR pathway plays a major pathogenetic role in glycogen accumulation and tumor development in renal distal tubules of rats and men. Oncotarget. 2015;6(15):13036–13048. doi:10.18632/oncotarget.3675
15. Taguchi A, Blood DC, Del TG, et al. Blockade of RAGE-amphoterin signalling suppresses tumour growth and metastases. Nature. 2000;405(6784):354–360. doi:10.1038/35012626
16. Labochka D, Moszczuk B, Kukwa W, Szczylik C, Czarnecka AM. Mechanisms through which diabetes mellitus influences renal cell carcinoma development and treatment: a review of the literature. Int J Mol Med. 2016;38(6):1887–1894. doi:10.3892/ijmm.2016.2776
17. Takada M, Hirata K, Ajiki T, Suzuki Y, Kuroda Y. Expression of receptor for advanced glycation end products (RAGE) and MMP-9 in human pancreatic cancer cells. Hepatogastroenterology. 2004;51(58):928–930.
18. Abe R, Yamagishi S. Age-rage system and carcinogenesis. Curr Pharm Des. 2008;14(10):940–945. doi:10.2174/138161208784139765
19. Monteith GR, Prevarskaya N, Roberts-Thomson SJ. The calcium-cancer signalling nexus. Nat Rev Cancer. 2017;17(6):367–380. doi:10.1038/nrc.2017.18
20. Yang H, Li W, Lv Y, et al. Exploring the mechanism of clear cell renal cell carcinoma metastasis and key genes based on multi-tool joint analysis. Gene. 2019;720:144103. doi:10.1016/j.gene.2019.144103
21. Moran MM. TRP channels as potential drug targets. Annu Rev Pharmacol Toxicol. 2018;58(1):309–330. doi:10.1146/annurev-pharmtox-010617-052832
22. Santoni G, Morelli MB, Santoni M, Nabissi M, Marinelli O, Amantini C. Targeting transient receptor potential channels by microRNAs drives tumor development and progression. Adv Exp Med Biol. 2020;1131:605–623.
23. Hall DP, Cost NG, Hegde S, et al. TRPM3 and miR-204 establish a regulatory circuit that controls oncogenic autophagy in clear cell renal cell carcinoma. Cancer Cell. 2014;26(5):738–753. doi:10.1016/j.ccell.2014.09.015
24. Li W, Yang FQ, Sun CM, et al. circPRRC2A promotes angiogenesis and metastasis through epithelial-mesenchymal transition and upregulates TRPM3 in renal cell carcinoma. Theranostics. 2020;10(10):4395–4409. doi:10.7150/thno.43239
25. Kim JH, Hwang KH, Eom M, et al. WNK1 promotes renal tumor progression by activating TRPC6-NFAT pathway. FASEB J. 2019;33(7):8588–8599. doi:10.1096/fj.201802019RR
26. Hughes T, Pumroy RA, Yazici AT, et al. Structural insights on TRPV5 gating by endogenous modulators. Nat Commun. 2018;9(1):4198. doi:10.1038/s41467-018-06753-6
27. Vanoverberghe K, Vanden AF, Mariot P, et al. Ca2+ homeostasis and apoptotic resistance of neuroendocrine-differentiated prostate cancer cells. Cell Death Differ. 2004;11(3):321–330. doi:10.1038/sj.cdd.4401375
28. Pinton P, Rizzuto R. Bcl-2 and Ca2+ homeostasis in the endoplasmic reticulum. Cell Death Differ. 2006;13(8):1409–1418. doi:10.1038/sj.cdd.4401960
29. Barron CC, Bilan PJ, Tsakiridis T, Tsiani E. Facilitative glucose transporters: implications for cancer detection, prognosis and treatment. Metabolism. 2016;65(2):124–139. doi:10.1016/j.metabol.2015.10.007
30. Chichger H, Cleasby ME, Srai SK, Unwin RJ, Debnam ES, Marks J. Experimental type II diabetes and related models of impaired glucose metabolism differentially regulate glucose transporters at the proximal tubule brush border membrane. Exp Physiol. 2016;101(6):731–742. doi:10.1113/EP085670
31. Rahmoune H, Thompson PW, Ward JM, Smith CD, Hong G, Brown J. Glucose transporters in human renal proximal tubular cells isolated from the urine of patients with non-insulin-dependent diabetes. Diabetes. 2005;54(12):3427–3434. doi:10.2337/diabetes.54.12.3427
32. Vander HM, Cantley LC, Thompson CB. Understanding the Warburg effect: the metabolic requirements of cell proliferation. Science. 2009;324(5930):1029–1033. doi:10.1126/science.1160809
33. Hamann I, Krys D, Glubrecht D, et al. Expression and function of hexose transporters GLUT1, GLUT2, and GLUT5 in breast cancer—effects of hypoxia. FASEB J. 2018;32(9):5104–5118. doi:10.1096/fj.201800360R
34. Yamamoto T, Seino Y, Fukumoto H, et al. Over-expression of facilitative glucose transporter genes in human cancer. Biochem Biophys Res Commun. 1990;170(1):223–230. doi:10.1016/0006-291X(90)91263-R
35. Wu CH, Ho YS, Tsai CY, et al. In vitro and in vivo study of phloretin-induced apoptosis in human liver cancer cells involving inhibition of type II glucose transporter. Int J Cancer. 2009;124(9):2210–2219. doi:10.1002/ijc.24189
36. Tomita T. Immunocytochemical localization of glucose transporter-2 (GLUT-2) in pancreatic islets and islet cell tumors. Endocr Pathol. 1999;10(3):213–221. doi:10.1007/BF02738882
37. Noguchi Y, Marat D, Saito A, et al. Expression of facilitative glucose transporters in gastric tumors. Hepatogastroenterology. 1999;46(28):2683–2689.
38. Tang J, Yan T, Bao Y, et al. LncRNA GLCC1 promotes colorectal carcinogenesis and glucose metabolism by stabilizing c-Myc. Nat Commun. 2019;10(1):3499. doi:10.1038/s41467-019-11447-8
39. Safaie QE, Safaei GS, Zarei B, et al. The c-met receptor: implication for targeted therapies in colorectal cancer. Tumour Biol. 2017;39(5):1393390546.
40. Ganapathy-Kanniappan S, Geschwind JF. Tumor glycolysis as a target for cancer therapy: progress and prospects. Mol Cancer. 2013;12:152. doi:10.1186/1476-4598-12-152
41. Li W, Liu H, Qian W, et al. Hyperglycemia aggravates microenvironment hypoxia and promotes the metastatic ability of pancreatic cancer. Comput Struct Biotechnol J. 2018;16:479–487. doi:10.1016/j.csbj.2018.10.006
 © 2020 The Author(s). This work is published and licensed by Dove Medical Press Limited. The full terms of this license are available at https://www.dovepress.com/terms.php and incorporate the Creative Commons Attribution - Non Commercial (unported, v3.0) License.
By accessing the work you hereby accept the Terms. Non-commercial uses of the work are permitted without any further permission from Dove Medical Press Limited, provided the work is properly attributed. For permission for commercial use of this work, please see paragraphs 4.2 and 5 of our Terms.
© 2020 The Author(s). This work is published and licensed by Dove Medical Press Limited. The full terms of this license are available at https://www.dovepress.com/terms.php and incorporate the Creative Commons Attribution - Non Commercial (unported, v3.0) License.
By accessing the work you hereby accept the Terms. Non-commercial uses of the work are permitted without any further permission from Dove Medical Press Limited, provided the work is properly attributed. For permission for commercial use of this work, please see paragraphs 4.2 and 5 of our Terms.