")
Back to Journals » International Journal of Nanomedicine » Volume 16
Modified Lipid Nanocapsules for Targeted Tanshinone IIA Delivery in Liver Fibrosis
Authors Ashour AA, El-Kamel AH , Abdelmonsif DA, Khalifa HM, Ramadan AA
Received 3 August 2021
Accepted for publication 27 October 2021
Published 8 December 2021 Volume 2021:16 Pages 8013—8033
DOI https://doi.org/10.2147/IJN.S331690
Checked for plagiarism Yes
Review by Single anonymous peer review
Peer reviewer comments 3
Editor who approved publication: Dr Farooq A. Shiekh
Asmaa A Ashour,1 Amal H El-Kamel,1 Doaa A Abdelmonsif,2,3 Hoda M Khalifa,4 Alyaa A Ramadan1
1Department of Pharmaceutics, Faculty of Pharmacy, Alexandria University, Alexandria, 21521, Egypt; 2Department of Medical Biochemistry, Faculty of Medicine, Alexandria University, Alexandria, 21131, Egypt; 3Center of Excellence for Research in Regenerative Medicine and Applications (CERRMA), Faculty of Medicine, Alexandria University, Alexandria, 21131, Egypt; 4Department of Histology, Faculty of Medicine, Alexandria University, Alexandria, 21131, Egypt
Correspondence: Amal H El-Kamel
Department of Pharmaceutics, Faculty of Pharmacy, Alexandria University, 1 Khartoum Square, Azarita, Messalla Post Office PO Box 21521, Alexandria, Egypt
Tel +20 10-0508-0510
Fax +20 3 4873273
Email [email protected]
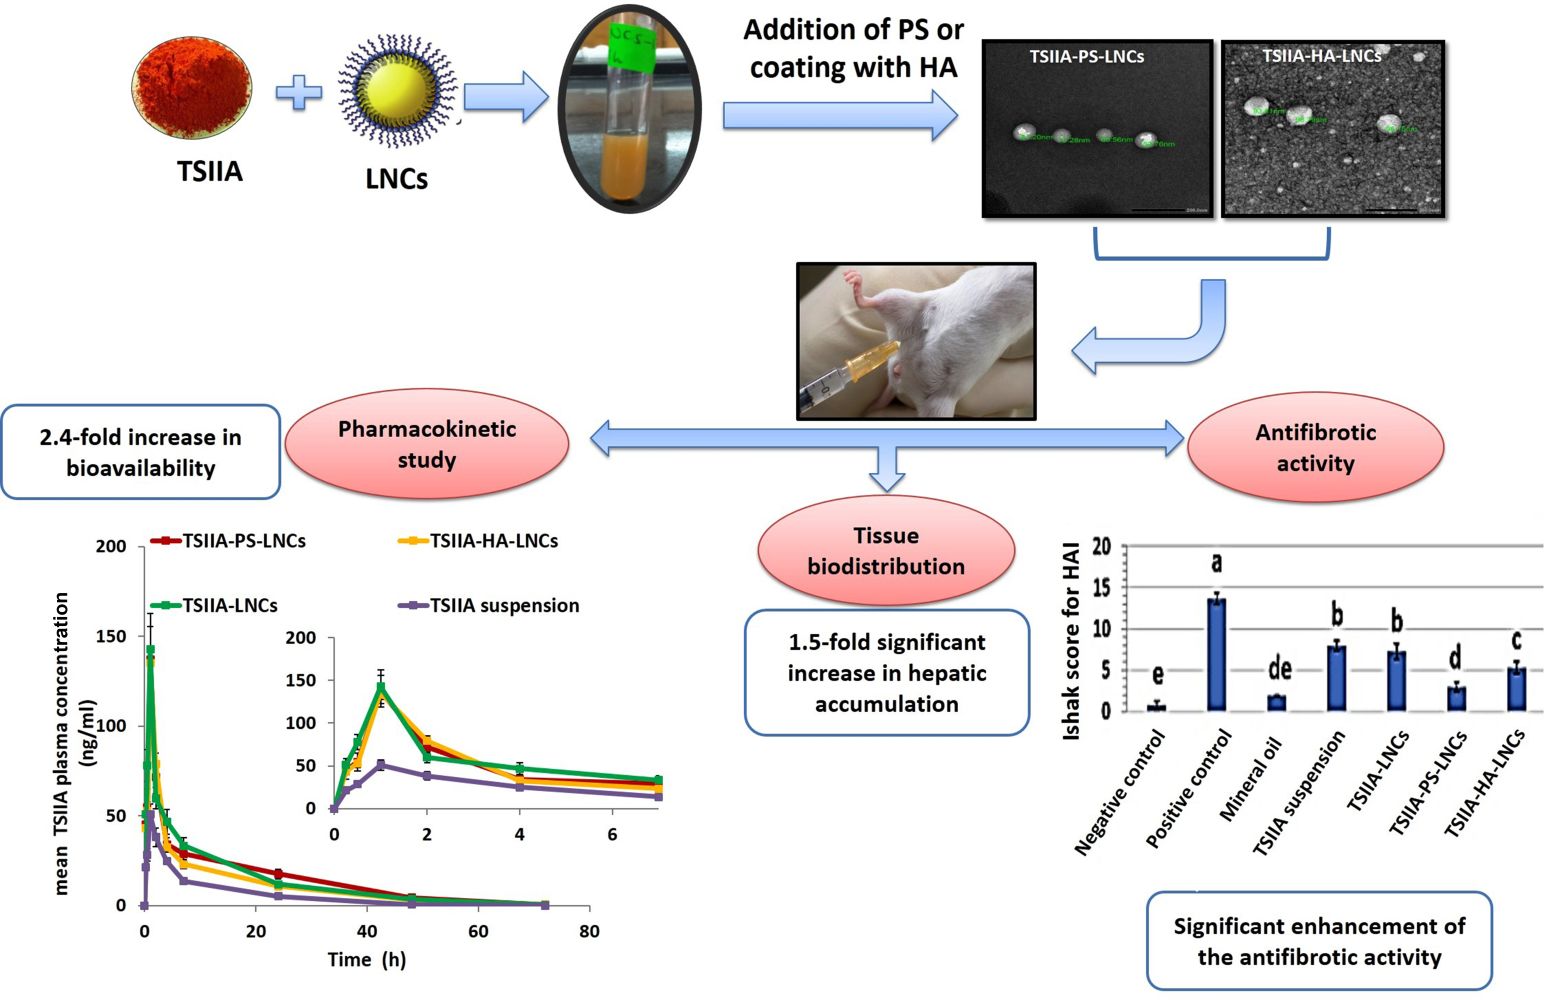
Introduction: Liver fibrosis represents a serious global disease with no approved treatment. Tanshinone IIA (TSIIA) is a phytomedicine with documented activity in treating many hepatic disorders. TSIIA has been reported to have potent anti-inflammatory and antioxidant properties. It can also induce apoptosis for activated hepatic stellate cells, and is thereby considered as a promising herbal remedy for treating fibrotic liver. However, its poor aqueous solubility, short half-life, exposure to the first-pass effect, and low concentration reaching targeted cells constitute the major barriers hindering its effective therapeutic potential. Therefore, this work aimed at enhancing TSIIA systemic bioavailability together with achieving active targeting potential to fibrotic liver via its incorporation into novel modified lipid nanocapsules (LNCs).
Methods: Blank and TSIIA-loaded LNCs modified with either hyaluronate sodium or phosphatidyl serine were successfully prepared, optimized, and characterized both in vitro and in vivo.
Results: The developed LNCs showed good colloidal properties (size ≤ 100 nm and PDI ≤ 0.2), high drug-entrapment efficiency (> 97%) with sustained-release profile for 24 hours, high storage stability up to 6 months, and good in vitro serum stability. After a single intraperitoneal injection, the administered LNCs exhibited a 2.4-fold significant increase in AUC0–∞ compared with the TSIIA suspension (p≤ 0.01). Biodistribution-study results proved the liver-targeting ability of the prepared modified LNCs, with a significant ∼ 1.5-fold increase in hepatic accumulation compared with the unmodified formulation (p≤ 0.05). Moreover, the modified formulations had an improved antifibrotic effect compared with both unmodified LNCs and TSIIA suspension, as evidenced by the results of biochemical and histopathological evaluation.
Conclusion: The modified TSIIA-LNCs could be regarded as promising novel targeted nanomedicines for effective management of liver fibrosis.
Keywords: phytomedicine, hyaluronic acid, phosphatidyl serine, antifibrotic activity
Graphical Abstract:
Introduction
Liver fibrosis represents a serious health problem affecting millions of people worldwide. It is considered an ineffective reversible wound-healing response to variable acute and/or chronic stimuli that might progress to complicated cirrhosis.1 Following chronic liver injury, various immune-system cells, responsible for induction of inflammation, infiltrate hepatocytes. Some injured hepatocytes undergo apoptosis as well. The latter release cytokines and reactive oxygen species, which in turn activate resident macrophages (Kupffer cells [KCs]) to further release many proinflammatory cytokines. These changes result in a dramatic phenotypic transformation to hepatic stellate cells (HSCs), called activation, into myofibroblast-like cells. Activated HSCs undergo transformation into proliferative, fibrogenic, and contractile cells with overproduction of extracellular matrix (ECM) proteins (mainly collagens type I and III). Moreover, the contractile feature of activated HSCs plays a pivotal role in promoting portal hypertension, which facilitates further progression to cirrhosis.2
Currently, no standard treatment exists for liver fibrosis. Elimination of the etiological factor is considered the most effective therapy. No antifibrotic drugs have been approved for clinical use, due to absence of tissue selectivity and low concentrations reaching target cells. It is worth noting that many antifibrotic drugs are currently undergoing clinical trials.3 Numerous herbal medicines have been reported to have great potential in reversal of liver fibrosis, and among them tanshinone IIA (TSIIA) has superior documented efficacy.4–7 TSIIA has many reported mechanisms of action to resolve liver fibrosis, such as being a potent anti-inflammatory agent.7,8 It has been reported to decrease the expression of TGFβ.9 Moreover, it is a strong antioxidant that attenuates hepatic oxidative stress, preventing damage of hepatic cells resulting from lipid peroxidation,7 and has been found to induce apoptosis of activated rat HSCs without damaging normal hepatocytes.10 Despite its huge therapeutic benefits, TSIIA has low systemic bioavailability, due to its poor aqueous solubility, short half-life, and exposure to first-pass metabolism.11 It is highly lipophilic and extremely insoluble in water, with intrinsic aqueous solubility of 2 ng/mL and log P of 5.8.12 Among diverse strategies, nanotechnology presents a tailored design that can face the enormous TSIIA-delivery challenges.
Lipid nanocapsules (LNCs) have been widely addressed as an interesting type of lipid-delivery systems that can efficiently entrap many problematic drugs.13–17 Surface modification of these nanocarriers is feasible, allowing protection, controlled release, longer circulation, and improved targeting. LNCs can be produced using a low-energy, solvent-free method and are of good biocompatibility. They can change both pharmacokinetics and biodistribution of loaded drugs after parenteral administration.18–20 Recently, TSIIA-loaded LNCs were successfully prepared by our research team and reported to greatly enhance its oral bioavailability.21
Targeting various receptors expressed on the surface of activated HSCs and KCs is the mainstay of effective management of liver fibrosis. Accordingly, hyaluronic acid (HA)22,23 and vitamin A24,25 have been exploited to achieve active targeting to HSCs. Phosphatidyl serine (PS) was previously regarded as a targeting ligand to KCs.26,27 HA is a linear polysaccharide abundantly found in animal ECM, connective tissue, and organs. It is a biocompatible, biodegradable, nonimmunogenic, noninflammatory, nontoxic polymer. CD44, a receptor for HA-decorated delivery systems, is overexpressed in hepatic fibrosis. It has an important role in activated HSCs migration during liver injury. Activated HSCs also express elevated levels of CD44.22,23 PS is an anionic phospholipid component of cellular membranes. It is present in the inner phospholipid bilayer of the cell membrane. When cellular apoptosis occurs, PS is transferred to the cell surface, permitting recognition by macrophages through scavenger-receptor pathways and subsequent phagocytosis.27 Accordingly, it is considered a targeting moiety for hepatic macrophages (KCs).
The current study focused on surface modification of TSIIA-LNCs with either HA or PS, hoping to develop an actively targeted nanomedicine for liver-fibrosis therapy and maximize drug efficacy after parenteral administration. Full physicochemical characterization, hemocompatibility, and serum stability studies were performed. In vivo pharmacokinetic behavior of tailored targeted TSIIA-LNCs was studied. Also, their hepatic targeting potential was investigated via biodistribution and antifibrotic activity studies in a rat model with carbon tetrachloride (CCl4)–induced liver fibrosis. As far as we know, this study is the first to implement decoration of LNC surfaces with HA and PS to improve their liver targetability.
Methods
Preparation of LNCs
Blank LNCs were prepared by phase inversion method with temperature cycling process 28 using the same ratios and ingredients reported previously by our research team.21 Briefly, 38% w/w labrafac lipophile, 22.5% w/w Kolliphor HS15, 15% w/w Span 80, 22.5% w/w water, and 2% w/w NaCl were mixed under magnetic stirring (IKA Labortechnik, Germany). The mixture was exposed to three cycles of progressive heating and cooling between 55°C and 30°C at a rate of 4°C/min. An irreversible shock was induced with 2-fold dilution with deionized cold water (0°–2°C) added to the formed O/W emulsion at the phase-inversion temperature. Finally, the LNC dispersion formed was subjected to slow magnetic stirring for 5 minutes, followed by filtration through a 0.45 μm Millipore syringe filter.21
PS-LNCs was prepared by addition of PS (0.25%–0.5% w/v of the final dispersion) to other LNC ingredients at the beginning of the process. The same method of preparation of blank LNCs was adopted, except for raising the temperature in the first cycle to 70°C to ensure complete melting of PS. For preparation of HA-LNCs, a post-insertion technique with some modifications was implemented.29 First, positively charged LNCs were prepared using hexadecyltrimethylammonium bromide (CTAB; 0.1% w/v) as reported previously.15,16 Then, CTAB-LNCs (1:1 diluted with deionized water) were dropped slowly to different volumes of hyaluronate sodium aqueous solution (6 mg/mL, pH 6.5) under vigorous stirring (800 rpm) for 1 hour at 37°C. The final concentrations of HA in the prepared formulations were 0.55, 1, and 1.4 mg/mL. Effective hyaluronate coating was verified by size and ζ-potential measurements.
Drug-loaded formulations were prepared as the blank formulations using TSIIA (1 mg/mL of the final dispersion volume). TSIIA was dissolved in the mixture of oil and surfactants, followed by addition of other LNC ingredients (water and NaCl).21 Finally, all TSIIA-loaded LNC formulations (TSIIA-LNCs, TSIIA-PS-LNCs, and TSIIA-HA-LNCs) were stored away from light at 4°C.
Physicochemical Characterization
The LNCs were subjected to full in vitro characterization of their colloidal properties17,21 (Zetasizer, Malvern Instruments, UK), entrapment efficiency,21 morphological examination using transmission electron microscopy (TEM; JEM-100 CX, Jeol, Japan)16,17 and in vitro drug-release study using the dialysis-bag method.21 These methods are mentioned in detail in the Supplementary Materials.
Hemocompatibility (Hemolysis Test)
The hemocompatibility of blank and TSIIA-loaded LNCs was assessed according to a method described previously with slight modifications.16 In brief, red blood cells (RBCs) were isolated from fresh whole rabbit blood via centrifugation at 2,000 rpm for 15 minutes. The different formulations were incubated with equal volumes of RBC suspension in saline (2% v/v) at 37°C for 1 hour with shaking (200 rpm). Samples were then centrifuged at 3,000 rpm for 5 minutes and hemoglobin content was spectrophotometrically quantified at λmax = 540 nm in the supernatant versus negative control (equal volume of RBCs and saline). Another aliquot of 2 mL RBC suspension was treated with a few drops of 1% w/v Triton X-100 to induce 100% hemolysis and used as positive control. Hemolysis was calculated:
It is worth mentioning that the initial concentrations of both TSIIA and LNCs used in the hemolysis testing were 1 mg/mL and 387.5 mg/mL, respectively.
Serum Stability
To assess the physical stability of LNCs in biologically relevant media, serum stability of different TSIIA-loaded LNC formulations was determined as reported previously with some modifications.30 Briefly, equal volumes of both tested formulations and FBS (10% w/v in saline) were mixed and then incubated at 37°C under continuous stirring (200 rpm). Samples were withdrawn at different time points (0, 1, 2, 4, and 6 hours), diluted with filtered deionized water (1:60 v/v), and assessed for both particle size and PDI.
Storage Stability
Stability of lyophilized TSIIA-LNC formulations (TSIIA-PS-LNCs and TSIIA-HA-LNCs) containing 2% w/v trehalose as a cryoprotectant21 kept at 4°C and protected from light was assessed. Lyophilization was performed using a benchtop lyophilizer (Cryodos-50, Telstar, Spain). Samples were evaluated for particle size, ζ-potential, PDI, and EE of TSIIA for 6 months after being reconstituted with deionized water.
In Vivo Studies
In vivo studies were performed using adult male Wistar rats (180–220 g, 8 weeks old). All in vivo studies were conducted in accordance with the guidelines approved by the Institutional Animal Care and Ethics Committee of the University of Alexandria (approval ALEXU-IACUC-42).
Pharmacokinetics
A total of 28 rats were randomly assigned to four groups (seven rats each). The study groups received a single 5 mg/kg dose of TSIIA as TSIIA suspension (in PEG 400:saline 1:9) or LNC formulations (TSIIA-LNCs, TSIIA-PS-LNCs, and TSIIA-HA-LNCs) via intraperitoneal (IP) injection. Prior to administration, all formulations were subjected to filtration sterilization using 0.22 µm Millipore syringe filters. After IP injection, blood samples (1 mL) were collected via the orbital plexus under ether anesthesia at different time points (0, 0.25, 0.5, 1, 2, 5, 7, 24, 48, and 72 hours) in tubes containing EDTA. Plasma was then obtained and TSIIA quantified in isolated samples using liquid LC-MS/MS as reported previously by our group.21
Plasma concentration–time data were analyzed using a noncompartmental pharmacokinetic model with the help of a Microsoft Excel 2016 pharmacokinetic solver add-in.31 Key pharmacokinetic parameters for all treated groups were determined: peak plasma concentration (Cmax), time to reach Cmax (Tmax), total area under the curve (AUC0–∞; calculated using the linear trapezoidal method), elimination half-life (t½) and mean residence time (MRT).
In Vivo Hepatic Antifibrotic Activity
Liver fibrosis was induced in rats by IP injection of 1 mL/kg CCl4 (1:1 diluted with mineral oil) twice a week for 4 weeks.32 The study groups were negative-control group (healthy rats injected with saline) and mineral oil–treated group receiving mineral oil (0.5 mL/kg) twice weekly for 4 weeks via IP injection to assess its hepatotoxicity. Rats with induced liver fibrosis were randomly divided into the following groups: positive control (untreated), TSIIA-LNCs, TSIIA-PS-LNCs, TSIIA-HA-LNCs, and TSIIA suspension. The last four treated groups received an equivalent TSIIA dose of 2.5 mg/kg via IP injection three times weekly for 3 weeks. It is important to highlight that all formulations were sterilized through filtration using 0.22 µm Millipore syringe filters before administration.
Animals were observed throughout the study period for any clinical signs of toxicity, their weights recorded weekly, and changes in body weight calculated. At the end of the treatment period, rats were anesthetized using diethyl ether and blood samples were collected from the retro-orbital venous plexus. The recovered serum samples were used for determination of the biochemical markers for hepatic function and certain proinflammatory cytokines. Animals were then sacrificed and dissected, then livers were isolated, washed with ice-cold saline, and weighed to calculate liver weight relative to body weight. A small part of each liver was fixed in 10% v/v formalin for histopathological examination and another part was employed for the determination of profibrotic biochemical markers.
Quantitative Assessment of Hepatic Function
Quantitative colorimetric determination of serum ALT, AST, ALP and albumin was done using suitable assay kits following the instructions.33–35
Quantitative Assessment of Hepatic Profibrotic Markers
For evaluation of both MMP2 and TGFβ, small portions of the isolated livers were cut, weighed, and homogenized in ice-cold PBS (pH 7.4) to prepare 10% w/v homogenates. Liver homogenates were then divided into aliquots for determination of MMP2 and TGFβ by rat MMP2 and TGFβ ELISA kits.36,37 For hydroxyproline (HP) assay, equal volumes of tissue homogenate (10% w/v in distilled water) and concentrated HCl (~12 N) were mixed, hydrolyzed at 120°C for 3 hours, and finally filtered. HP content was measured using an assay kit according to the manufacturer's instructions.38
Quantitative Assessment of Proinflammatory Cytokines
Quantification of both TNFα and IL6 levels was performed in serum following the instructions of rat immunoassay kits.39,40
Histopathological Evaluation of Liver Fibrosis
Liver specimens of rats were fixed in 10% v/v formalin solution, dehydrated, and embedded in paraffin wax. Sections of 5 µm thickness were then cut and subjected to both H&E and Masson’s trichrome staining. Each stained section was then examined under a light microscope equipped with a digital camera (Olympus America Inc., USA). The amount of collagen fibers (green stain) in Masson’s trichrome–stained sections was semiquantitatively appraised using ImageJ software (version 1.45s). H&E-stained sections were scored according to Ishak score for the hepatic activity index (HAI) for scoring of necroinflammatory activity in chronic hepatitis.41,42
In Vivo Tissue Biodistribution in Fibrotic Rat Model
In vivo biodistribution and liver-targeting potential of TSIIA-PS-LNCs and TSIIA-HA-LNCs were evaluated by laser-scanning confocal microscopy (Leica TSC SPEII, DMi8 automated, Germany). To allow the in vivo tracing of the prepared LNCs, 1,1-dioctadecyl-3,3,3,3-tetramethylindocarbocyanine perchlorate (DiI; 0.1 mg/mL of the final dispersion volume) was incorporated into the LNC formulations using the method described by Morille et al with slight modifications43 (for more details see Supplementary Materials). The colloidal properties of the fluorescently labeled LNC dispersions were determined.
For biodistribution study, the groups received a single dose equivalent to 1 mg/kg DiI in the form of free DiI solution (in acetone:water: 1:9), DiI-LNCs, DiI-PS-LNCs, and DiI-HA-LNCs via IP injection. Rats were then sacrificed at 1 hour after administration and organs (liver, kidney, and spleen) harvested and fixed in 10% v/v formalin. Specimens of the tested organs were dehydrated and embedded in paraffin wax before being sectioned into 5 µm–thick sections, mounted on a glass slide, and fluorescently observed using confocal microscopy at excitation and emission wavelengths of 545 and 550–600 nm, respectively. Five sections of each organ per animal were examined, and a minimum of three fields were imaged per section. The amount of DiI distributed in each tissue sample was determined based on the fluorescence-intensity measurement.44 In brief, mean corrected total fluorescence was determined by calculating the fluorescence intensity across identical areas of the examined tissue sections and subtracting the background autofluorescence, using ImageJ.44
Statistical Analysis
Experiments were performed in triplicate and data are expressed as means ± SD. Statistical analysis was carried out using one-way ANOVA), followed by either Tukey or Duncan post hoc analysis (SPSS 21) for pairwise comparisons. The level of significance was set at p≤0.05.
Results and Discussion
Preparation of Modified LNCs
In order to increase their therapeutic efficacy in the management of liver fibrosis, surfaces of LNCs were modified by different targeting ligands. This was achieved via inclusion of anionic PS in their shell structure or coating their surface with HA. It is worth mentioning that this work is the first attempt to document modification of LNC surfaces with both PS and HA. Negatively charged PS-LNCs were prepared to allow active targeting to liver macrophages using increasing PS concentrations of 0.25%–0.5% w/v. It was observed that addition of PS did not affect the formation of LNCs or their phase-inversion temperature. Regarding HA-LNCs, CTAB (0.1% w/v of the final dispersion) was used for imparting a positive charge to LNCs, a prerequisite for HA coating.15 This concentration of CTAB was selected based on its reportedly low toxicity and biocompatibility.45 The coating process of LNC surfaces was mainly based on electrostatic interactions between the cationic CTAB-LNCs and the anionic polysaccharide (HA). Similarly, Zheng et al46 utilized CTAB-HA nanostructured lipid carriers containing both doxorubicin and gold nanoparticles for targeting breast cancer.
The preparation of HA-LNCs was achieved by a simple titration procedure to avoid tedious and time-consuming washing steps required for the removal of excess HA.30 Optimization of the added concentration of HA is necessary for uniform coating of LNC surfaces, as excess HA may affect both size and homogeneity of the produced LNCs. Consequently, three concentrations of HA were tried (0.55, 1, and 1.4 mg/mL) to coat diluted CTAB-LNCs (1:1 with water). It was found that both dilution of LNCs and mild heating at 37°C for 1 hour were required for efficient HA coating. Both temperature and LNC concentration were considered important factors governing the post-insertion technique for coating of LNCs, as elevated temperature affects the “brush” conformation of the PEG chains of Kolliphor HS15 present on the surface of LNCs, allowing better penetration of the molecules inserted between the Kolliphor PEG chains.29 Incubation for 1 hour was found to be sufficient for achieving reversal of ζ-potential values for the coated LNCs.29 For TSIIA-LNC formulations, TSIIA concentration of 1 mg/mL from the total dispersion volume was selected based on our previous work.21 This concentration exhibited good stability for the liquid dispersions against drug precipitation during storage at 4°C for 2 weeks.21
Physicochemical Characterization of LNCs
Preliminary Colloidal Properties for Optimization of LNC Formulations Modified with PS and HA
Concerning PS-LNCs, the effect of adding different PS concentrations on particle size, PDI, and ζ-potential of the formed LNCs is shown in Figure 1. Particle size and PDI remained unchanged when the PS concentration increased from 0.25% to 0.4% w/v (Figure 1A), suggesting incorporation of PS in the shell of the LNCs. Similar findings have been reported previously, where increasing PS concentration from 4 to 12 mol% did not cause any significant difference in the size of prepared nanostructured lipid carriers, confirming insertion into the phospholipid monolayer.26 However, upon increasing the PS concentration to 0.5% w/v, particle size and PDI markedly increased from 72.4±4.5 nm and 0.09±0.01 to 86.9±4.9 nm and 0.27±0.03, respectively. This corroborated what has previously been reported, where addition of PS to PVA-coated dextran nanoparticles resulted in significant increases in both size and PDI, suggesting its presence on the surface of nanoparticles as an efficient coat.47
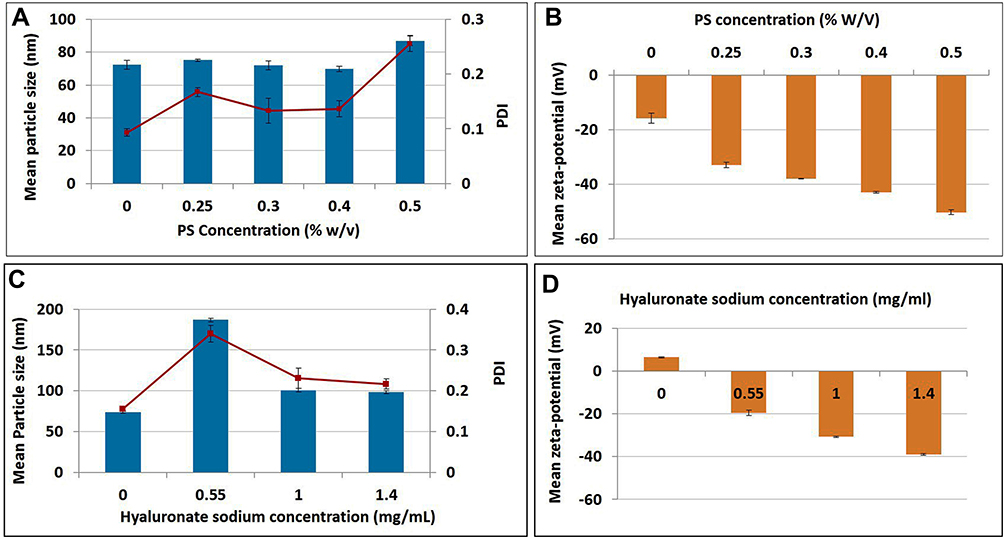 |
Figure 1 Effect of addition of different concentrations of phosphatidyl serine (PS) or hyaluronate sodium solution on LNC colloidal properties. (A and, C) Particle size and polydispersity index (PDI); (B and, D) corresponding ζ-potential values. |
Regarding ζ-potential data, Figure 1B shows that increasing PS concentration from 0 to 0.5% w/v resulted in an increase in corresponding negative ζ-potential from −15.8±3.1 to −50.2±1.6, respectively. This in turn further confirmed the efficient integration of PS into the shell of the LNCs. According to colloidal properties obtained for PS-LNCs, the optimum concentration (0.4% w/v) for PS was chosen as it was the highest concentration achieving a high negative ζ-potential value (−42.8±0.6 mV) without affecting particle size or PDI.
In respect of HA-LNCs, inclusion of CTAB (0.1% w/v) in LNCs had an insignificant effect (p>0.05) on particle size and PDI which changed from 69.35±1.95 nm and 0.098±0.003 for LNCs to 73.5±1.89 nm and 0.11±0.007 for CTAB-LNCs. This was in agreement with what was previously found using agents like CTAB or stearyl amine in the same concentration range to induce a positive charge for LNCs.15 The addition of 0.1% w/v CTAB to the LNC dispersion resulted in acceptable inflection of surface charge from −12.3±0.95 mV to 9.3±0.5 mV, a prerequisite for preparation of HA-LNCs.
Figure 1C and D demonstrates the effect of different concentrations (0–1.4 mg/mL) of aqueous HA solution on particle size, PDI, ζ-potential of HA-LNCs. It was found that addition of 0.55 mg/mL HA solution led to aggregate formation and consequently an increase in both particle size and PDI (Figure 1C). On the other hand, upon addition of both 1 and 1.4 mg/mL HA solution, particle size and PDI started to decrease, probably due to electrostatic interaction with the positively charged surface of the CTAB-LNCs. Similarly, Freag et al30 reported a decrease in particle size of a prepared nanosystem with increased concentration of HA solution. They attributed this finding to strong electrostatic interactions between chitosan-coated liquid crystalline nanoparticles and HA at high concentrations, resulting in stiffer and smaller particles.30 Figure 1D shows that increasing the concentration of HA solution from 0 to 1.4 mg/mL resulted in an increase in negative ζ-potential value from 9.3±0.5 mV to −39±0.7 mV, respectively. This suggests coverage of CTAB-LNC surfaces by increasing amounts of HA. Finally, a concentration of 1 mg/mL HA solution was selected in the current study for coating CTAB-LNCs, since it permitted formulation of HA-LNCs of acceptable colloidal properties. Using lower volumes of HA solution (compared to HA concentration of 1.4 mg/mL) resulted in avoidance of excessive dilution of drug in TSIIA-loaded HA-LNCs.
Colloidal Properties of Optimized LNC Formulations
Table 1 shows a summary of the colloidal properties of the optimized LNC formulations under study. All blank and drug loaded formulations exhibited favorable colloidal properties including being relatively small (69.35–100.8 nm) and having a narrow size distribution (PDI 0.096–0.252) and ζ-potential (−12.35 to −42.83 mV), confirming good colloidal stability. Concerning particle size, inclusion of PS in PS-LNCs caused no statistically significant difference in size compared with LNCs (p>0.05). In contrast, the size of HA-LNCs increased significantly compared with LNCs (p≤0.05). This finding was in accordance with Tran et al48 who attributed the increase in particle size of solid-lipid nanoparticles after hyaluronate addition to the successful coating of the negatively charged high- molecular-weight HA onto the nanoparticle surfaces.
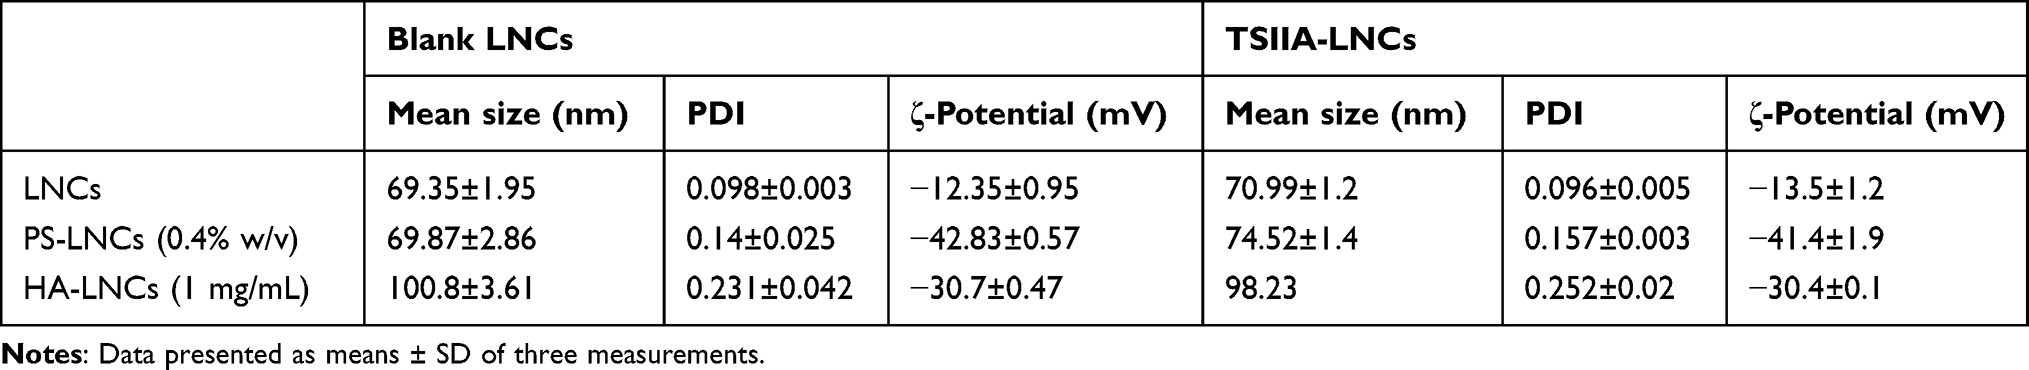 |
Table 1 Summary of colloidal properties of optimized blank and TSIIA-LNC formulations |
Regarding ζ-potential, the slight negative ζ-potential of blank LNCs (−12.3±0.95 mV) could be attributed to the presence of traces of oleic acid in Span 80 together with the formation of intramolecular hydrogen bonding in Kolliphor HS15 creating a negative surface charge.21 Modification of blank LNCs with PS (0.4% w/v) and HA-LNCs (1 mg/mL) resulted in a significant reduction in ζ-potential to −42.83 mV±0.57 and −30.7±0.47 mV, respectively. It is worth mentioning that, TSIIA loading generally had an insignificant (p>0.05) effect on the colloidal properties of the LNC formulations. This was consistent to what had been previously reported in literature for both miltefosine- and praziquantel-loaded LNCs and was attributed to the presence of the drug in the oily core of the LNCs and not just attached to the surface.16,17
TSIIA Entrapment Efficiency
Both modified LNC formulations (TSIIA-PS-LNCs and TSIIA-HA-LNCs) exhibited high TSIIA EE of 98.7%±0.1% and 98.1%±0.6%, respectively. This could be mainly due to TSIIA lipophilicity and its solubility in LNC oily cores.17,49 In other words, modification of LNCs did not significantly (p>0.05) affect TSIIA EE, an observation previously stated for both miltefosine- and praziquantel-loaded LNCs.16,17
Morphological Examination by TEM
TEM was used to visualize the morphology of TSIIA-PS-LNCs and TSIIA-HA-LNCs, as presented in Figure 2A and B. All LNCs were spherical, with size ≤100 nm and narrow size distribution confirming results obtained by the Zetasizer. Their morphological characteristics, particularly in terms of size and shape, were generally similar to those reported in the literature.50,51
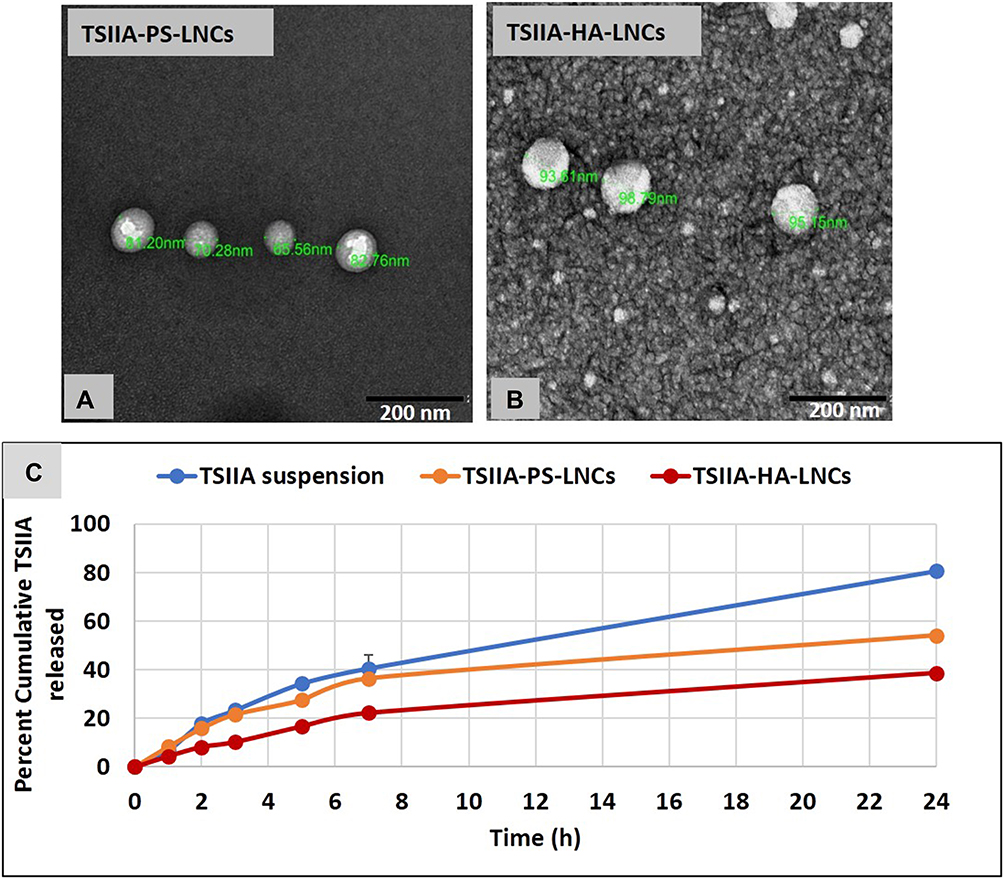 |
Figure 2 (A and, B) TEM of TSIIA-PS-LNCs and TSIIA-HA-LNCs, respectively, at magnification 40,000×. (C) Release profiles of LNC formulations versus TSIIA suspension at 37°C. Data presented as means ± SD (n=3). |
In Vitro Drug Release
Figure 2C shows that complete release of TSIIA (80.57%±0.52%) from its suspension occurred after 8 hours, while, the tested LNC formulations showed sustained-release profiles with significantly less release after 24 hours than the TSIIA suspension (p≤0.05), indicating drug entrapment inside the LNCs. Similar profiles have been reported for the release of diverse drugs, such as praziquantel, itraconazole, and quercetin, from LNCs.17,51,52 The sustained-release profiles of lipophilic drugs from LNCs has been attributed to the barrier function of the surrounding aqueous release medium that impedes drug transport owing to the poor aqueous solubility of the drug.21 Additionally, TSIIA-HA-LNCs showed significant less TSIIA release after 24 hours than TSIIA-PS-LNCs (p≤0.01). This finding was in agreement with that previously mentioned for hyaluronate-coated rapamycin–liquid crystalline nanoparticles.30 The lower drug release could be attributed to the thickness of the adsorbed bulky hyaluronate layer acting as an additional diffusion barrier controlling drug release from the hyaluronate-coated nanocarrier.30
Hemocompatibility (Hemolysis Test)
Hemolysis is an important problem associated with the bioincompatibility of injectable nanosystems.53 Accordingly, the effect of different LNC formulations on the destruction of erythrocytes was analyzed using a previously reported colorimetric assay.16 It was revealed that the tested formulations showed permissible hemolysis of less than the reported maximum limit (<5%)54 compared to the positive control (100%), as depicted in Figure 3A, indicating their hemocompatibility. This may be attributed to the absence of electrostatic interaction between negatively charged tested LNCs, TSIIA-LNCs, TSIIA-PS-LNCs, and TSIIA-HA-LNCs and erythrocytes of similar negative charge.53 It was also noted (Figure 3A) that TSIIA-PS-LNCs showed the least hemolytic activity, with hemolysis of 0.01%±0.002%. This could be attributed to the fact that TSIIA-PS-LNCs had the highest negative ζ-potential (−42.83 mV±0.57), resulting in the lowest interaction with RBCs.
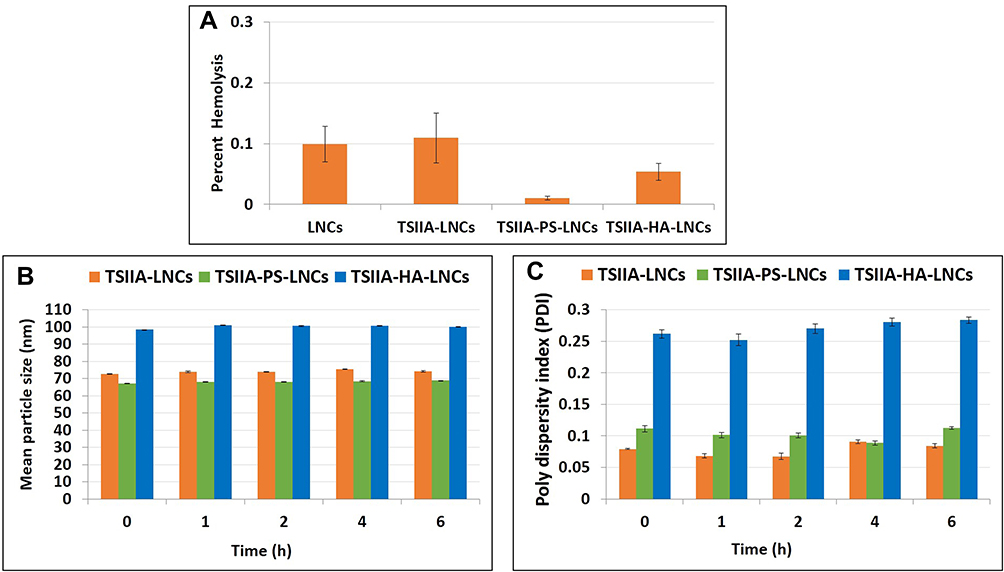 |
Figure 3 (A) Hemolysis of both blank LNCs and TSIIA loaded LNC formulations after 1 hour incubation with RBCs at 37°C. (B and, C) Stability of different prepared TSIIA loaded LNCs in 10% fetal bovine serum solution: (B) size and (C) polydispersity index were measured at different time points. Data represent mean±SD, (n=3). |
Serum Stability
Assessing serum stability is an important requirement for any injectable delivery system. Following mixing with serum, unstable nanoparticles are expected to adsorb many serum proteins on their surfaces, leading to aggregation.55 This can result in large particles and broad size distribution. Changes in both particle size and PDI of TSIIA-loaded LNCs up to 6 hours after incubation with 10% FBS were monitored and are presented in Figure 3B and C. The results demonstrated no significant change (p>0.05) in particle size or PDI of any of the formulations with time, suggesting their stability in serum. This observation confirmed the impact of negatively charged LNCs to induce repulsive forces against anionic serum–protein interactions, as previously reported in literature.56
Storage Stability of TSIIA-Loaded LNC Formulations
The storage-stability results of lyophilized TSIIA-PS-LNCs and TSIIA-HA-LNCs containing 2% w/v trehalose after 6 months at 4°C are presented in Table 2. It was observed that neither colloidal properties nor EE had changed significantly (p>0.05) after 6 months storage in the lyophilized form. This in turn reflected the high storage stability of these formulations, as mentioned previously in literature.16,28
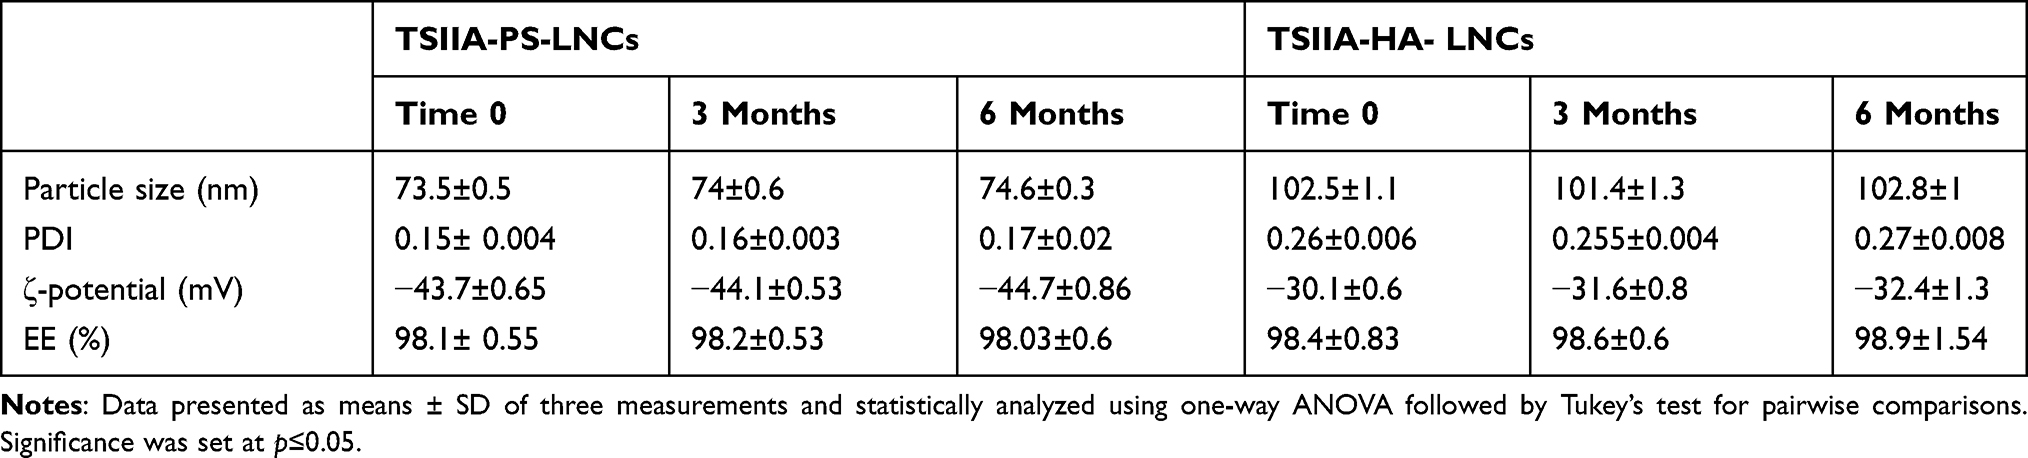 |
Table 2 Storage stability study of lyophilized TSIIA-loaded LNC Formulations at 4°C using trehalose (2% w/v) as a cryoprotectant |
In Vivo Studies
Pharmacokinetics
Figure 4 shows the mean plasma drug concentration–time curve and Table 3 the main calculated pharmacokinetic parameters (t½, Cmax, Tmax, AUC0-t, AUC0–∞, and MRT). After IP administration, there were highly significant increases in both measured Cmax values (about 2.7-fold) and AUC0–∞ (about 2.4-fold) for all tested LNC formulations compared to the TSIIA suspension (p≤0.01), indicating a marked increase in the amount of TSIIA reaching the systemic circulation and enhanced systemic bioavailability. Furthermore, both t½ and MRT were significantly (p≤0.01) prolonged by TSIIA encapsulation in different prepared LNCs, suggesting a long circulation time in vivo, as previously reported in literature.15,17 Statistical analysis of the pharmacokinetic parameters of the three tested TSIIA-loaded LNC formulations (Table 3) indicated that differences among them were not statistically significant (p>0.05). This implied that modification of TSIIA-LNCs with either PS or HA did not significantly increase TSIIA bioavailability (p>0.05). However, these additives were expected to increase the hepatic antifibrotic activity of unmodified TSIIA-LNCs, as is discussed later, via an active targeting mechanism.
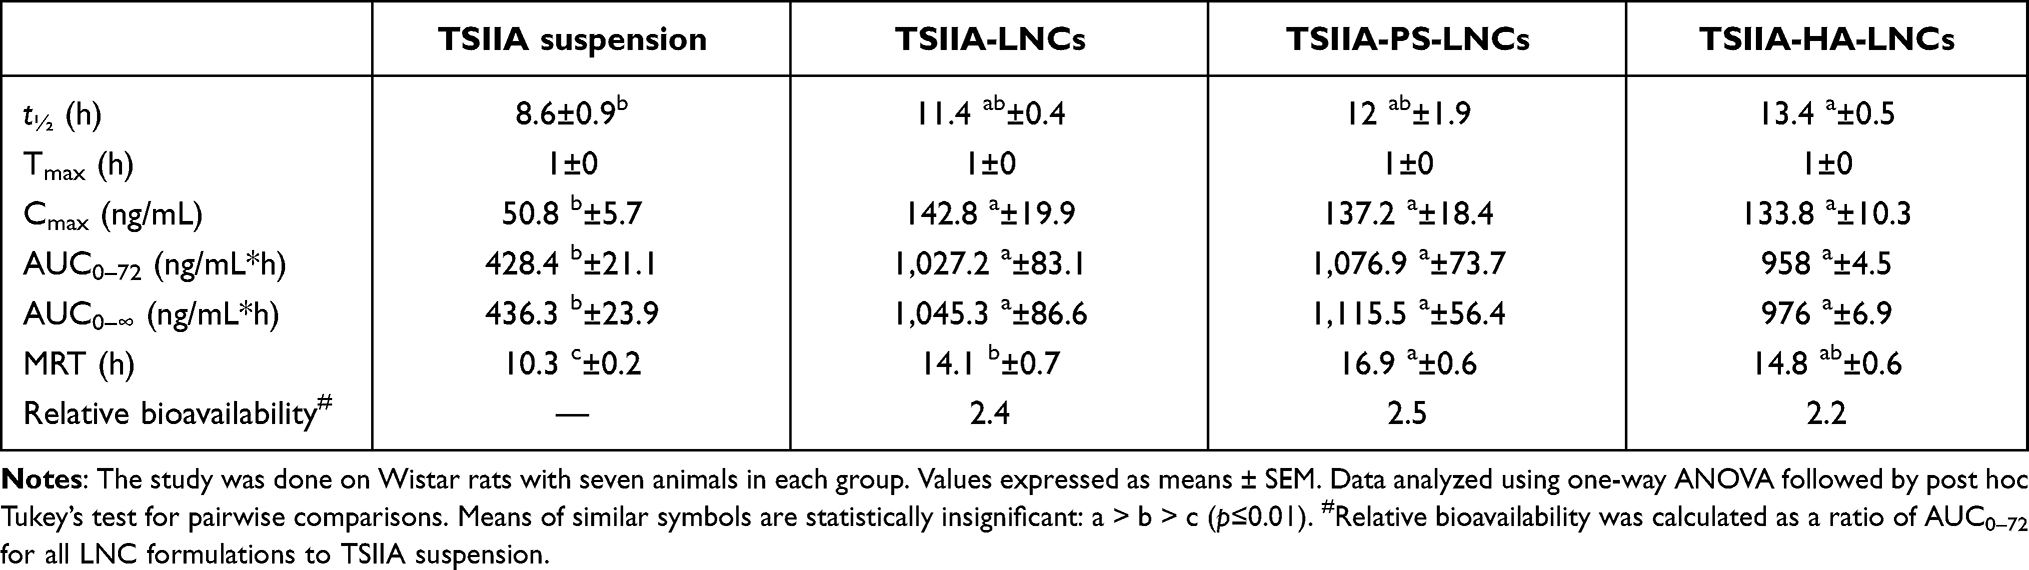 |
Table 3 Calculated pharmacokinetic parameters of TSIIA following IP administration of tested LNC Formulations and TSIIA suspension (5 mg/kg) to healthy rats |
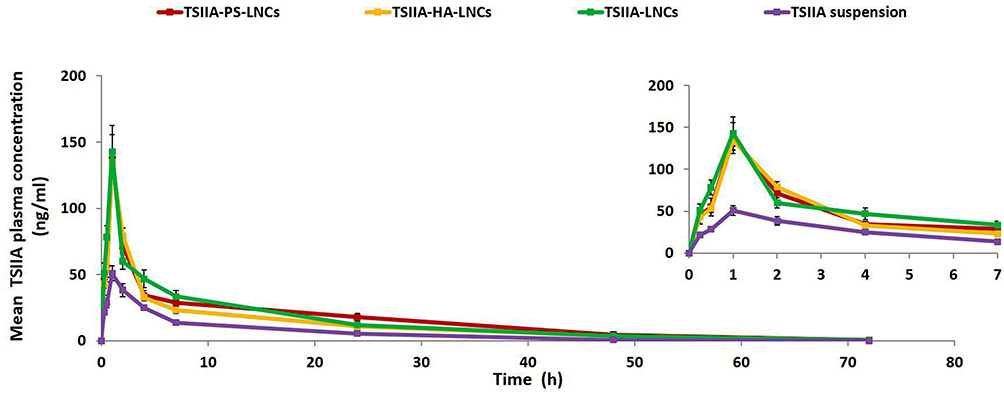 |
Figure 4 Mean plasma concentration (ng/mL) of TSIIA versus time (h), following IP administration of different tested LNC formulations and TSIIA suspension (5 mg/kg) to healthy rats (n=7). Data were expressed as mean±SEM. The inset is an enlargement of the curve for the first 7 hours of the pharmacokinetic study. |
In conclusion, the increased AUC0–∞ of all tested formulations after IP administration compared with TSIIA suspension and hence the improved bioavailability might be attributed to the presence of the drug in a molecular state solubilized in the oily cores of LNCs and avoidance of possible hepatic first-pass metabolism, as after IP administration, the drug drains to the portal vein through the mesenteric vessels, then to the liver before reaching the systemic circulation.57,58 Therefore, LNCs were postulated to protect the incorporated drug from hepatic metabolism, due to: 1) their ability to reach the liver in structurally intact form, as proven previously,16,17 2) their ability to deliver higher drug concentrations to the liver than the TSIIA suspension, and 3) the inhibitory effect of Kolliphor HS 15 on hepatic cytochrome P450 microsomal enzymes.59
Hepatic Antifibrotic Activity
Induction of Liver Fibrosis
The current study was performed using a CCl4-treated liver fibrosis model, which is one of the most frequently utilized toxin-based models for liver fibrosis induction.24 CCl4 is metabolized in hepatocytes to a toxic trichloromethyl radical that mediates many cytotoxic effects via interaction with nucleic acids, proteins, and lipids. Consequently, fatty degeneration and steatosis are observed. In addition, lipid peroxidation is encountered and results finally in generalized hepatic damage characterized by inflammation and fibrosis, which can progress to cirrhosis.32 A preliminary study showed that IP administration of 1 mL/kg CCl4 (1:1 diluted with mineral oil) twice weekly for 4 weeks resulted in significant hepatic impairment based on the Ishak scoring system for determination of HAI.41,42
Upon physical observation, no signs of toxicity were detected throughout the treatment period (3 weeks). Animals’ body weight was recorded weekly during treatment and changes in body weight calculated (Table S1). After sacrificing animals, livers were weighed, and % liver weight relative to body weight was determined (Table S1). It was revealed that the positive-control and TSIIA-suspension groups had significantly less change in body weight than the other groups (p≤0.05). This could be due to marked hepatic damage, which can affect animals’ food intake. On the other hand, rats that received different TSIIA-loaded LNC formulations showed a progressive increase in body weight throughout the treatment period, statistically similar to the negative-control and oil-treated group (p>0.05). This could reflect the improved nutrition of animals upon treatment with these TSIIA nanosystems.
Concerning the measured % liver weight relative to body weight (Table S1), it was found that it significantly increased (p≤0.05) for the positive-control group compared to the healthy negative-control rats due to marked CCl4 toxicity in liver tissue, as previously reported in the literature.60 Similar results were observed for the TSIIA-suspension group, which showed no improvement in hepatic state. For the mineral oil–treated group, no significant difference (p>0.05) was found in % relative liver weight compared to the negative-control rats, indicating the safety of the oily vehicle used for dilution of CCl4. On the other hand, all tested TSIIA-LNC formulations brought about a reduction in % relative liver weight, with the smallest reduction for TSIIA-LNCs, which did not differ significantly when compared to the positive-control and free-TSIIA groups (p>0.05). The actively targeted TSIIA-PS-LNCs and TSIIA-HA-LNCs brought about significantly lower (p≤0.05) % relative liver weight compared to the positive-control and TSIIA-suspension groups, but liver weights did not reach a normal state, as indicated by a significant difference (p≤0.05) from negative-control rats.
In conclusion, TSIIA-LNCs, TSIIA-PS-LNCs, and TSIIA-HA-LNCs brought about an improvement in food consumption, as indicated by statistically significant (p≤0.05) difference in body-weight change when compared to the positive-control and TSIIA-suspension groups. However, concerning % relative liver weight, only the targeted formulations (TSIIA-PS-LNCs and TSIIA-HA-LNCs) brought about a significant (p≤0.05) reduction when compared with the positive-control and TSIIA-suspension groups, reflecting their superiority in treatment, as will be highlighted later.
Quantitative Assessment of Hepatic Function
Serum markers for treated animals were calculated at the end of the study to evaluate hepatic function, and results are shown in Table 4. It has been reported that ALT, AST, and ALP are normally distributed in healthy hepatocytes and that elevated circulating levels of these markers reflect cellular damage and impairment of hepatic function.61 Additionally, albumin levels were measured to assess hepatic biosynthetic function. Positive-control rats showed significant elevation (p≤0.05) in ALT, AST, and ALP as well as hypoalbuminemia when compared with negative-control rats, reflecting considerable hepatocellular damage and impairment in biosynthetic functions of the liver.24 Administration of the free-TSIIA suspension (2.5 mg/kg) resulted in a statistically insignificant (p>0.05) correction in ALT and albumin, while it caused a significant (p≤0.05) reduction in AST and ALP when compared with the positive-control group, reflecting mild improvement in hepatic state. Treatment with TSIIA-LNCs (2.5 mg/kg) resulted in a significant reduction (p≤0.05) in all tested parameters compared to positive control, but the difference was no significant (p≤0.05) when compared to the TSIIA-suspension group, indicating their moderate therapeutic effect. This could be due to the low dose of TSIIA-LNCs administered (2.5 mg/kg) together with low drug amounts reaching specific cells involved in fibrosis progression (HSCs and KCs). Similar findings have been observed previously, where a low dose of IV-administered TSIIA-loaded globin nanoparticles (2 mg/kg) three times weekly for 3 weeks achieved a similar reduction in tested markers for liver function compared to TSIIA solution in a thioacetamide-induced liver-fibrosis mouse model. However, the difference between the two aforementioned groups was significant at a higher dose (5 mg/kg).62
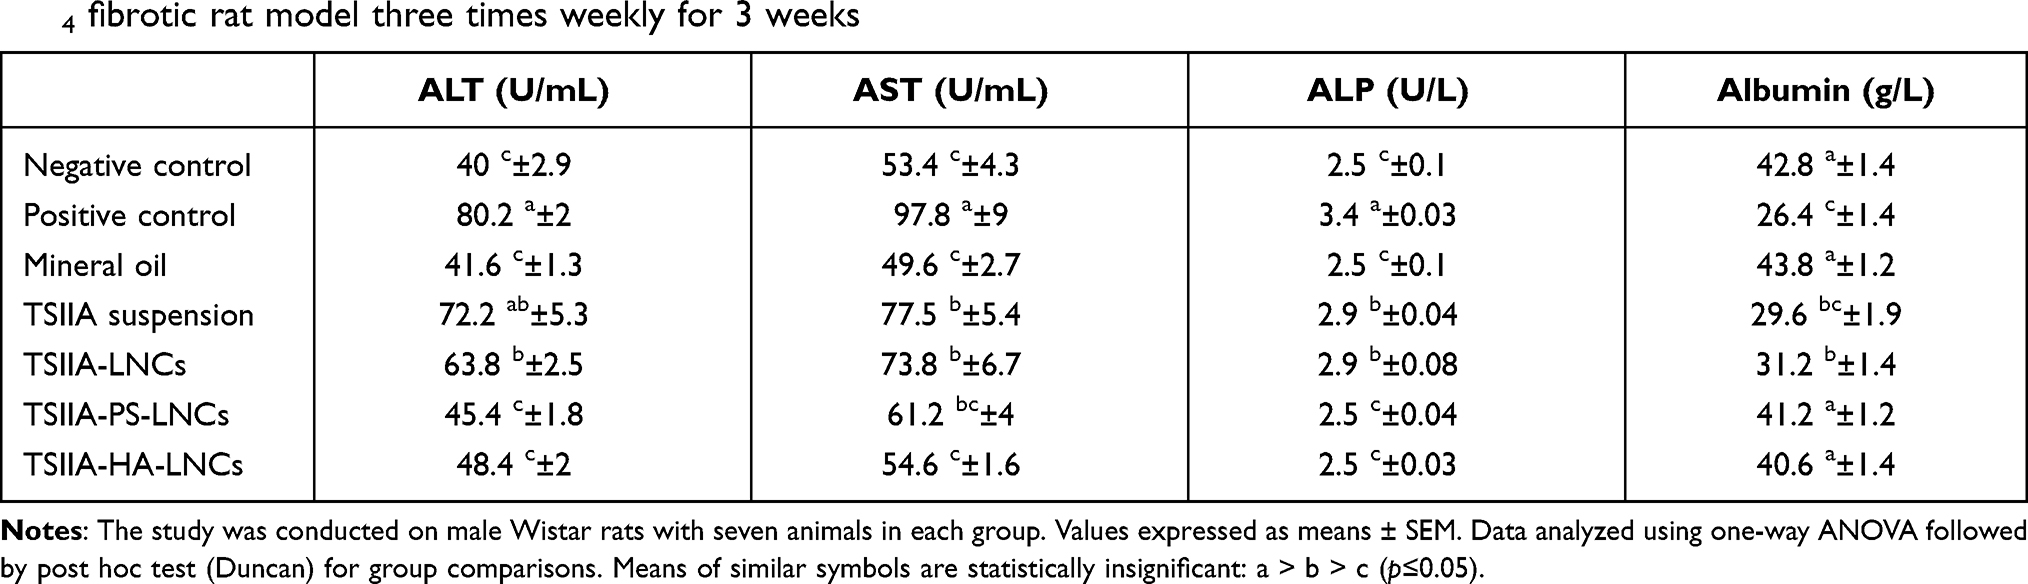 |
Table 4 Effect of tested LNC formulations and TSIIA suspension on markers of liver function after IP administration (2.5 mg/kg) to CCl4 fibrotic rat model three times weekly for 3 weeks |
On the other hand, both targeted TSIIA-PS-LNCs and TSIIA-HA-LNCs (2.5 mg/kg) gave rise to significant (p≤0.05) improvement in all measured values on the liver-function test when compared to positive controls, free TSIIA suspension, and untargeted TSIIA-LNCs. Additionally, values returned to normal, as no significant (p>0.05) difference was found between these groups and negative-control rats. Therefore, targeted TSIIA therapy might be a good choice to improve the antifibrotic therapeutic potential of the drug at the low dose given (2.5 mg/kg).
Quantitative Assessment of Hepatic Profibrotic Markers
Elevated hepatic HP is considered a crucial diagnostic marker for liver fibrosis. It is an amino acid present in the collagen constituent of ECM produced by activated HSCs.63 Additionally, MMP2, a gelatinase enzyme, has been reported to have a dual role in pathogenesis and recovery from liver fibrosis. During liver injury, MMP2 promotes fibrosis by increasing HSCs proliferation.64 During resolution after hepatic injury subsides, particularly in the initial stages of disease, MMP2 promotes HSCs apoptosis and is required for degradation of the accumulated collagen.64 Therefore, elevated MMP2 is encountered in liver fibrosis originating from chronic injuries. Elevated TGFβ is also considered a key mediator in liver fibrosis, allowing ECM production. TGFβ is liberated from hepatocytes after injury. After that, it stimulates HSCs activation and proliferation, which in turn produces more TGFβ. The latter stimulates the expression of many ECM proteins, including collagen, downregulates their degradation, and induces hepatocyte apoptosis.65,66
HP, MMP2, and TGFβ were measured in all tested animals at the end of the study, and results are shown in Table 5. Healthy negative-control rats showed relatively small levels of HP, MMP2, and TGFβ. All these markers are normally present in the liver for maintenance of tissue homeostasis, as they affect many cellular activities, such as proliferation, gene expression, fibrogenesis, and inflammation.67 The mineral oil–treated group showed no significant difference in levels of tested markers compared to negative-control rats (p>0.05), further ensuring the safety of the oily vehicle used for CCl4 dilution. Positive-control rats showed significantly elevated levels of all markers (HP, MMP2, and TGFβ) when compared to negative-control group (p≤0.05). This might indicate abnormal ECM deposition as a result of the imbalance between matrix production and degradation mediated by MMPs.68 Conversely, TSIIA suspension, unmodified TSIIA-LNCs, and modified TSIIA-LNCs significantly decreased HP, MMP2, and TGFβ to variable degrees compared to positive-controlgroup (TSIIA suspension < TSIIA-LNCs < modified TSIIA-LNCs, p≤0.05). The significant reduction in fibrotic markers exhibited by the TSIIA suspension compared with positive-control rats demonstrated the antifibrotic efficacy of the drug, as previously reported.69 Untargeted TSIIA-LNCs exhibited a significant difference in levels of tested markers compared with TSIIA suspension (p≤0.05), except for TGFβ, reflecting the role of LNCs in enhancing the antifibrotic activity of TSIIA. Interestingly, both targeted LNC formulations (TSIIA-PS-LNCs and TSIIA-HA-LNCs) achieved significantly (p≤0.05) higher reductions in the tested markers than the untargeted TSIIA-LNCs. These results further highlighted the importance of the modified LNC formulations in resolution of liver fibrosis via an active targeting mechanism. The current results were in line with El-Mezayen et al,24 where targeted imatinib-loaded liposomes had a higher antifibrotic effect than a free-drug solution or untargeted therapy, as indicated by a significant reduction (p≤0.05) in all fibrosis markers (HP, MMP2, and TGFβ). They attributed their findings to the ability of the targeted therapy to target activated HSCs, which are the main site of synthesis of most fibrogenic mediators.24
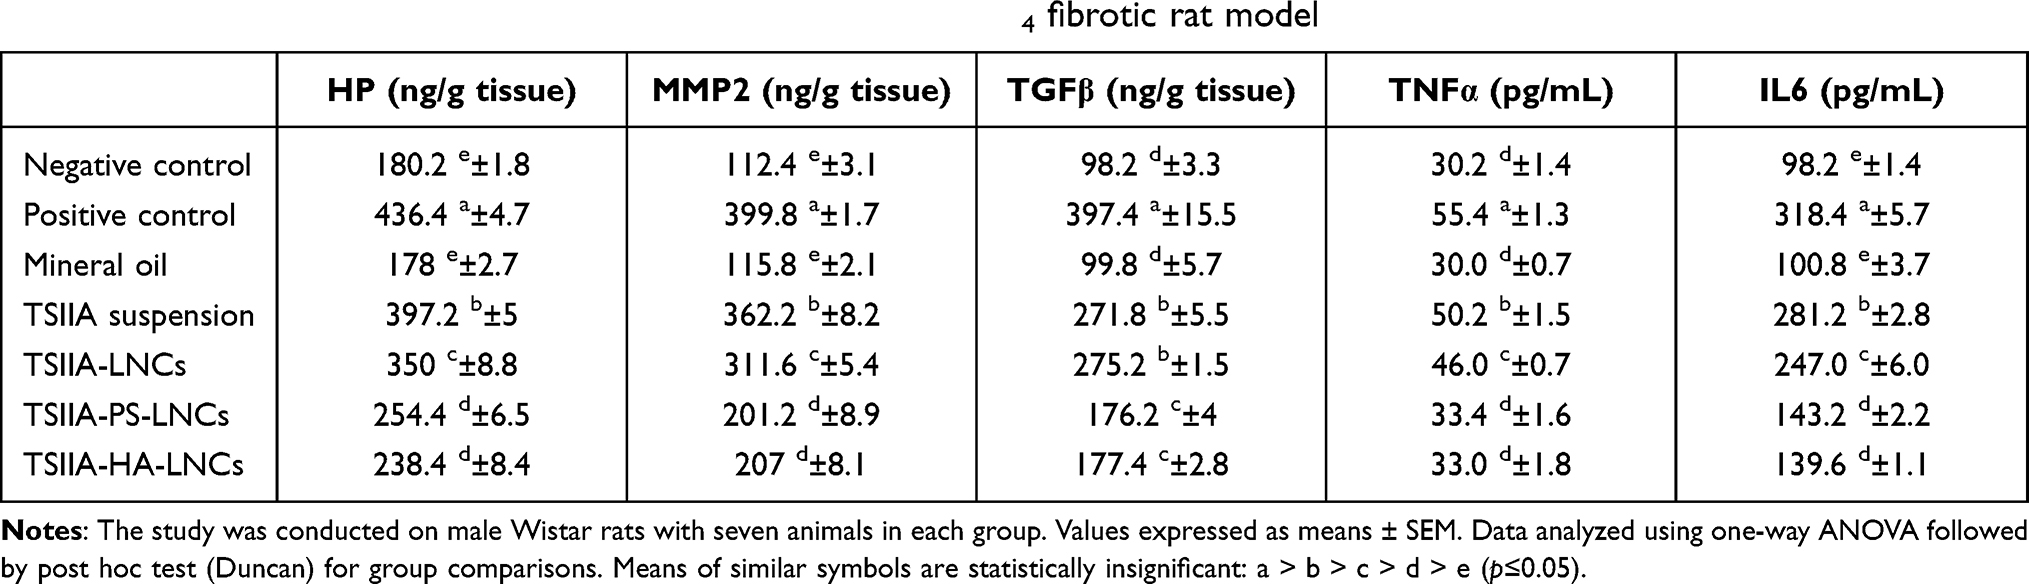 |
Table 5 Effect of tested LNC formulations and TSIIA suspension on liver profibrotic markers and proinflammatory cytokines after IP administration (2.5 mg/kg) three times weekly for 3 weeks to CCl4 fibrotic rat model |
It is important to highlight that neither TSIIA suspension or TSIIA-LNC formulations returned markers to normal, as indicated by significant (p≤0.05) differences from negative-control group (Table 5). Perhaps this might be due the short treatment period (3 weeks only). The latter was selected based on a pilot study that revealed increased mortality, due to the induced progressive liver damage, in positive control group if the study exceeded 3 weeks.
Quantitative Assessment of Proinflammatory Cytokines
Many cytokines have a significant role in inflammatory liver diseases promoting fibrosis, such as IL6 and TNFα.70 TNFα is a proinflammatory cytokine produced by various immune-system cells, such as macrophages. It can trigger numerous signaling pathways associated with inflammation, proliferation, and apoptosis. Additionally, it is implicated in the pathogenesis of chronic liver inflammation resulting in liver fibrosis.71 Similarly, IL6 is a cytokine with various biological activities related to immunoregulation, inflammation, and hematopoiesis. Following chronic inflammation, it promotes the synthesis of many acute-phase proteins by the liver, resulting in induction of fibrosis.72 Therefore, the level of these proinflammatory cytokines in the sera isolated from all animals of the tested groups was determined, and results are shown in Table 5.
Positive-control rats showed significantly (p≤0.05) elevated levels of both tested inflammatory mediators (TNFα and IL6) when compared with negative-control group, consistent with prior research, where CCl4-induced acute hepatic injury activated hepatic nonparenchymal cells and increased the production of both TNFα and IL6.73 Hepatic macrophages (KCs) produce TNFα in rapid response to tissue injury, which then upregulates the expression of IL6. The overexpression of IL6 inhibits hepatocyte growth and causes further liver injury.73 The mineral oil–treated group had similar levels of inflammatory cytokines to the negative-control group (p>0.05), indicating no hepatotoxicity for the oily vehicle used for CCl4 dilution. In contrast, all groups that received TSIIA treatment — either free suspension or encapsulated into LNCs — exhibited a significant decrease in levels of TNFα and IL6 when compared to the positive-control group. This might point to an underlying antifibrotic mechanism of TSIIA, which is mediated via suppression of inflammation. A similar observation was stated previously in the literature, where IV-administered TSIIA solution caused a marked decrease in proinflammatory cytokines in a fibrotic rat model.7
As shown in Table 5, reductions in inflammatory markers for the treated groups were in the order: TSIIA suspension < TSIIA-LNCs < TSIIA-PS-LNCs = TSIIA-HA-LNCs. Additionally, the difference between TSIIA suspension and TSIIA-loaded LNC formulations was statistically significant (p≤0.05), indicating the crucial role of LNCs in enhancing the in vivo performance of the encapsulated drug. The difference between unmodified TSIIA-LNCs and the two targeted LNC formulations was also statistically significant (p≤0.05), confirming again the importance of the active targeting approach in suppression of inflammation induced in liver fibrosis. It is worth mentioning that after 3 weeks’ treatment, the targeted formulations had succeeded in returning TNFα back to normal levels, as indicated by the insignificant difference from the negative-control group (p>0.05).
Histopathological Evaluation of Liver Fibrosis
The findings of the animal-observation study and biochemical tests were additionally verified via histopathological examination of liver tissue. Liver sections taken from animals were stained with H&E for evaluation of any histopathological changes, especially hepatocellular damage (Figure 5A–H). Stained liver sections were scored using Ishak HAI score, and results were presented in (Figure 5I). Regarding H & E stain, the parenchyma of all negative-control livers revealed classical histological structure (Figure 5A). Liver sections of positive-control rats showed loss of classical hepatic architecture with pseudolobulation. Hepatocytes showed variable degenerative changes, including centrizonal confluent necrosis, apoptotic hepatocytes, and mononuclear cell infiltration. Dilated sinusoids with increased KCs and macrovesicular fatty degeneration were also observed (Figure 5B and C). Liver sections of mineral oil–treated rats revealed more or less normal structure in most samples (Figure 5D). Necrotic cells and periportal cellular infiltration were occasionally seen. These findings and the previous results of biochemical tests confirmed the safety of the oily vehicle used for dilution of CCl4. The TSIIA-suspension group (Figure 5E) showed moderate hepatic degenerative changes, indicating the slight amelioration of the diseased hepatic state caused by the drug, being a hepatoprotective agent.74–76 On the other hand, all TSIIA-loaded LNC groups presented improvement in the hepatic diseased state, but to variable degrees. In this respect, TSIIA-LNCs accomplished the lowest efficacy, as indicated by the moderate correction in the impaired hepatic state (Figure 5F). In contrast, the administration of both targeted formulations resulted in preservation of normal hepatic architecture in most samples, with classical hepatocytes containing vesicular nuclei. Different signs of degeneration were rarely encountered (Figure 5G and H). The latter finding ensured the superior effect of the targeted TSIIA therapy in improving the impaired hepatic state compared to both the untargeted one and TSIIA suspension.
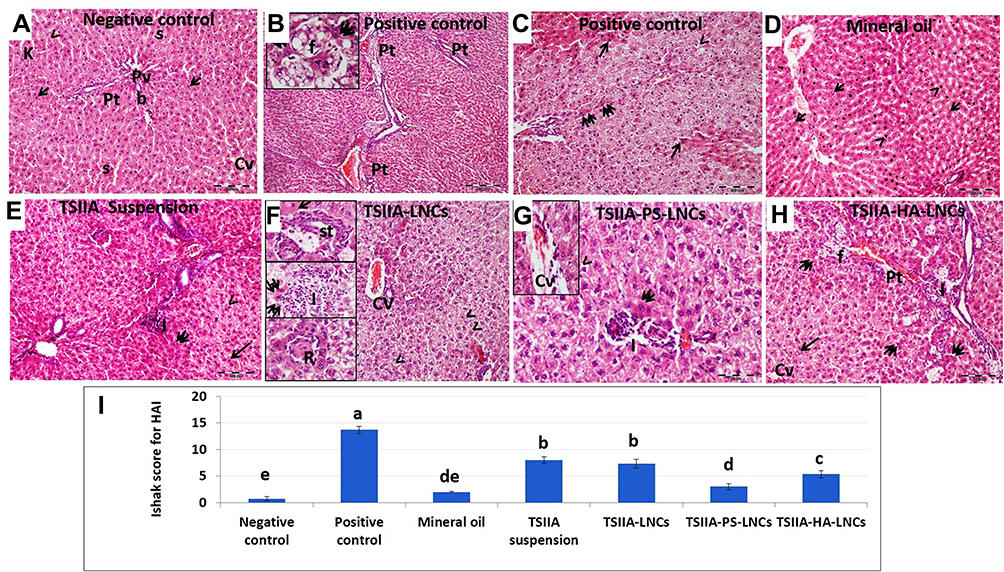 |
Figure 5 Photomicrographs of liver sections and Ishak scores for hepatic activity index of study groups. (A) Negative-controlgroup showed branching and anastomosing cords of hepatocytes radiating from central veins (CVs). The cytoplasm is granular and eosinophilic with vesicular nuclei and prominent nucleoli (arrow). The cords are separated by narrow sinusoids (s) lined by endothelial cells (arrowhead) and Kupffer cells (k). Portal tracts (Pt) containing branches of portal vein (Pv), hepatic artery, and bile duct (b) are presented at the angles of the lobules. (B and, C) Positive-controlgroup demonstrated loss of hepatic architecture with formation of pseudolobulation. (B) Extended connective tissue septa connecting Pt were seen. Inset : Acidophilic bodies (double arrow) from apoptotic stellate (st) cells and macrovesicular fatty cells (f) replacing the necrotic tissue were seen. (C) Extended areas of centrizonal confluent necrosis (arrow) were encountered, alternating with extensively vacuolated cells with pyknotic nuclei (arrowhead) and many acidophilic apoptotic st cells (double arrow). (D) Mineral-oil group showed preserved architecture with classical hepatocytic structure (arrow). Some sporadic cells showing dense small regular hyperchromatic nuclei (arrowhead) were also found. (E) TSIIA-suspension group presented moderate degenerative changes. Normal-looking hepatocytes with vesicular nuclei (arrow) were seen alternating with necrotic areas with vacuolated (arrowhead) or acidophilic cytoplasm (double arrow) with pyknotic nuclei. Localized necrotic areas with intense mononuclear cellular infiltration (I) were also observed. (F) TSIIA-LNC group showed preserved hepatic architecture with radiating hepatocytes from CVs loaded with degenerated cells. Many excessively vacuolated hepatocytes with vesicular nuclei (arrowhead) were seen. Upper inset: areas of centrizonal necrosis (arrow) with st cells were evident. Middle inset: stellate acidophilic bodies and apoptotic cells (double arrows) and mononuclear cellular infiltration (I) were also present. Lower inset: inflammatory rosette formation (R) with inflammatory and binucleated hepatocytes was also found. (G) TSIIA-PS-LNC group showed nearly classical architecture. Few cells depicting vacuolated cytoplasm and pyknotic nuclei (arrowhead) or degenerated with homogenous fused hypereosinophilic cytoplasm (double arrows) were encountered. Periportal mononuclear cellular infiltration (I) was also found. Inset: normal-looking hepatocytes radiating from CVs containing many degenerated cells. (H) TSIIA-HA-LNC group revealed preserved hepatic architecture. Normal-looking hepatocytes (arrow) were seen radiating from CVs. Cords of degenerated hepatocytes (double arrows) and centrizonal necrotic areas infiltrated by macrovesicular fatty cells (f) were observed. Pseudolobulation and thickened connective-tissue septa connecting Pt and periportal I were also found. H&E stain Mic magnification (A, D, E, F, H) 200×, (B) 100×, (B, C, F, Ginsets) 400×. (I) Ishak score for hepatic activity index for scoring of necroinflammatory activity in chronic hepatitis for the study groups. Data expressed as means ± SEM (n=3). Data were analyzed using one-way ANOVA followed by post hoc test (Duncan) for group comparisons. Means of similar symbols were statistically insignificant: a > b > c > d > e (p≤0.05). |
For more illustration, the degree of hepatic impairment was quantified using Ishak HAI score for necroinflammatory activity in chronic hepatitis, and results are recorded in Figure 5I. The negative-control group exhibited the lowest total HAI score (0.75±0.5), which was statistically insignificant (p>0.05) compared to the mineral-oil group (2±0). This again confirmed the safety of the vehicle used for CCl4 dilution. The positive-control group had the highest total HAI score (13.7±0.7), which was statistically significant (p≤0.05) when compared with all other study groups. Both TSIIA suspension and unmodified TSIIA-LNCs were statistically similar (p>0.05) in achieving significant reductions in HAI score compared with positive-control group (p≤0.05). Similarly, El-Mezayen et al24 reported similar antifibrotic efficacy for both untargeted imatinib-loaded liposomes and free-imatinib solution, indicated by the observed deposition of collagen fibers in examined liver sections. This was attributed to the inability of the untargeted therapy to achieve a high drug concentration reaching cellular targets (HSCs).24 Interestingly, both targeted TSIIA-LNCs succeeded in causing a significant decrease in HAI score compared to the untargeted formulation and free-TSIIA suspension (p≤0.05). However, TSIIA-PS-LNCs had the best efficacy, as evidenced by the significantly lower HAI score than TSIIA-HA-LNCs (p≤0.05). This might be attributed to the relatively higher abundance of KCs targeted by PS (~30% of nonparenchymal liver cells) than HSCs targeted by HA (<10% of nonparenchymal liver cells).77 It is worth mentioning that neither targeted LNC formulation returned HAI score to normal state, as indicated by the statistically significant difference (p≤0.05) when compared to negative-control group. This could be due to the short treatment period (3 weeks), as previously mentioned.
To further assess the degree of collagen-fiber deposition, a marker for liver fibrosis, liver sections isolated from all study groups were stained with Masson’s trichrome, coloring the collagen fibers green (Figure 6A–H). The amount of collagen fibers in each stained section were semiquantitatively evaluated using ImageJ to facilitate comparison among study groups, and the results are shown in Figure 6I. The stained liver specimens showed collagen fibers distributed mostly around blood vessels and portal tracts in the negative-control group (Figure 6A). On the other hand, liver sections of the positive-control rats showed massive increases in collagen fibers extending between portal tracts forming pseudolobulation around all necrotic areas and on areas of macrovesicular fatty infiltration (Figure 6B and C). The mineral oil–treated group (Figure 6D) exhibited a slight increase in collagen-fiber deposition when compared with negative-control rats, further assuring the safety of this oily vehicle. Examination of the TSIIA-suspension group (Figure 6E) revealed marked increase in collagen deposition, extending mainly from one portal tract to another, starting pseudolobulation of hepatic tissue. Administration of TSIIA-LNCs (Figure 6F) slightly ameliorated the degenerative changes, with marked collagen deposition in portal tracts. Fortunately, administration of both TSIIA-PS-LNCs and TSIIA-HA-LNCs (Figure 6G and H) caused limited increase in collagen-fiber distribution in both groups, indicating superior antifibrotic efficacy.
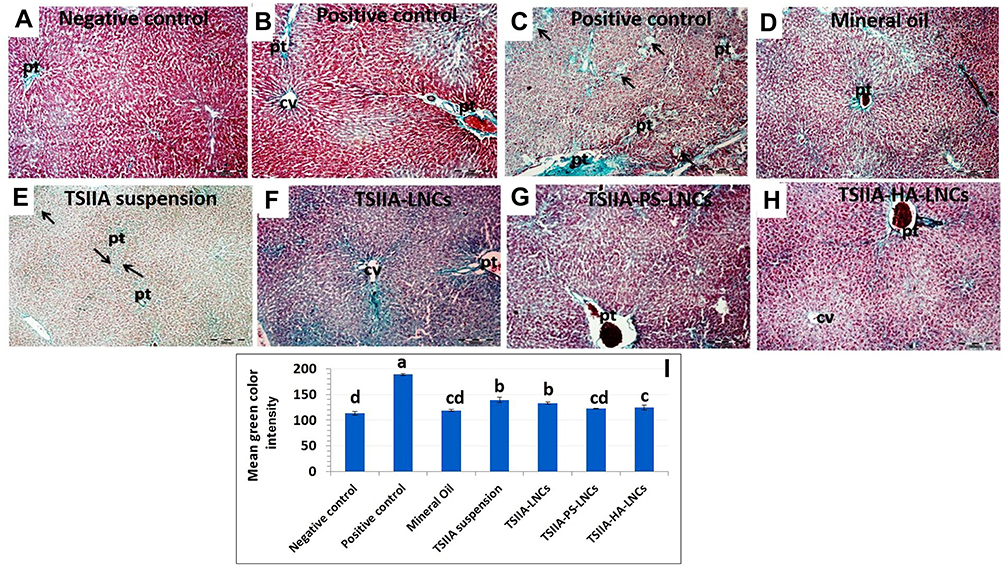 |
Figure 6 (A–H) Photomicrographs of liver sections of groups and (I) semiquantitative analysis of fibrous tissue (green color) using ImageJ software. (A) Negative-controlgroup showed classical distribution of collagen fibers mainly around blood vessels, especially in portal tracts (Pt). (B and, C) Positive-controlgroup demonstrated a massive increase in collagen fibers extending between Pt forming pseudolobulation around all central veins (CVs). Arrows in C point to existing necrotic areas. (D) Mineral-oil group revealed a slight increase in collagen distribution around Pt. (E) TSIIA suspension–treated rats showed a marked increase in collagen deposition extending mainly from one Pt to the other, starting pseudolobulation (arrows). (F) TSIIA-LNC group presented a marked increase in collagen fibers extending around hepatic tissue. (G) TSIIA-PS-LNC group exhibited a mild increase in collagen fibers around Pt. (H) TSIIA-HA-LNC group demonstrated mild increase in collagen fibers around Pt and CVs and extending between the hepatocytes. Masson’s trichrome stain Mic magnification 100×. (I) Semiquantitative analysis of fibrous tissue (green) in study groups using imageJ software. Data expressed as means ± SEM (n=7). Data were analyzed using one-way ANOVA followed by post hoc test (Duncan) for group comparisons. Means of similar symbols were statistically insignificant: a > b > c > d (p≤0.05). |
The semiquantification of collagen fibers in each image (Figure 6I) further confirmed the results obtained from histopathological scoring. In this context, the positive-control group had the highest mean color intensity, which was statistically significant (p≤0.05) compared to other study groups, reflecting the highest deposition of collagen fibers. The TSIIA-suspension group showed a significant reduction (p≤0.05) in the mean color intensity compared with positive-control rats, verifying its effect in decreasing fibrous tissue formation. Although treatment with TSIIA-LNCs achieved lower mean color intensity than the TSIIA suspension, the difference between the two groups was insignificant (p>0.05). This could be attributed to the low dose of TSIIA used, as previously mentioned. On the other hand, both targeted LNC formulations achieved significantly (p≤0.05) less collagen-fibers deposition, as indicated by the lowest mean color intensity, when compared to both the TSIIA suspension and untargeted TSIIA-LNCs. Nevertheless, only TSIIA-PS-LNCs succeeded in returning hepatic tissue to a normal healthy state, as indicated by their statistical similarity (p>0.05) to the negative-control group, most probably due to the higher abundance of KCs, the main target for TSIIA-PS-LNCs.
In conclusion, combined results of biochemical and histopathological assessment illustrated that hepatocellular damage, inflammation, and necrosis were slightly corrected in rats administered TSIIA suspension or untargeted TSIIA-LNCs, and sometimes TSIIA-LNCs had higher efficacy. However, targeted LNC formulations achieved the highest antifibrotic efficacy. The difference in antifibrotic activity between unmodified and modified TSIIA-LNC formulations might be explained by the difference in TSIIA doses delivered to target nonparenchymal hepatic cells involved in fibrosis progression (HSCs and KCs). The higher the drug concentration reaching the target, the higher the efficacy.
In Vivo Tissue Biodistribution in Fibrotic Rat Model
We then explored organ biodistribution following IP administration of fluorescently labeled untargeted blank LNCs (Dil-LNCs) versus targeted blank LNCs (DiI-PS-LNCs and DiI-HA-LNCs), as well as DiI solution as control. As a lipophilic indocarbocyanine dye, DiI was selected for labeling of the prepared LNCs because it exhibited good labeling stability, as previously confirmed.78 It is worth mentioning that addition of DiI to LNCs did not change their colloidal properties, indicating efficient incorporation in the oily core.
Figure 7A presents the photomicrographs of organ sections (liver, kidney, and spleen) at 1 hour following IP injection of the tested fluorescently labeled formulations. Mean fluorescence intensity was analyzed using ImageJ (Figure 7B). Results demonstrated that the free-dye solution exhibited a nonspecific organ distribution to both liver and spleen, as there was no significant difference in measured fluorescence intensity for these organs (p>0.05). Its distribution to the kidney was significantly lower than other organs (p≤0.05) owing to its lipophilicity. For DiI-LNCs, DiI-PS-LNCs, and DiI-HA-LNCs, Figure 7B shows that fluorescence intensity was significantly higher (p≤0.01) for the liver than other organs (spleen and kidney), indicating specific distribution pattern of LNCs. Additionally, free-DiI solution demonstrated the least hepatic accumulation compared to other formulations (p≤0.05). This illustrated the role of prepared LNCs in increasing hepatic deposition of the encapsulated dye. A similar finding was reported by Hirsjarvi et al,20 where LNCs exhibited higher hepatic distribution than other organs 24 hours after IV administration to mice. Moreover, Lacoeuille et al79 found that the organ biodistribution of paclitaxel-loaded LNCs was higher in the liver compared to other organs. Their results indicated that LNC clearance from the blood was mainly due to the liver. This could be due to the action of hepatic macrophages that captured the nanoparticles.79 In addition, the smallness of the prepared LNCs (<100 nm) helped them to diffuse from blood to hepatocytes through fenestration of the hepatic sinusoidal endothelium.79
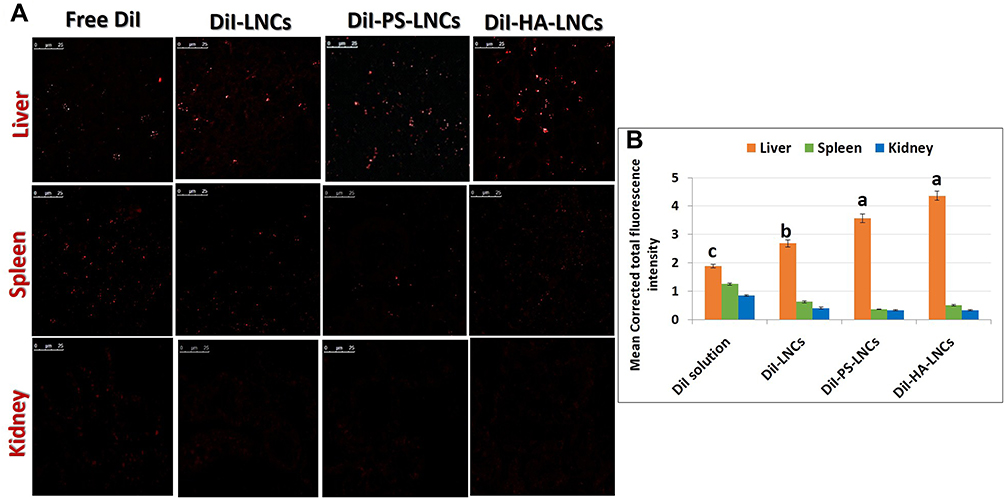 |
Figure 7 In vivo tissue biodistribution in rats with induced liver fibrosis. (A) Confocal laser-scanning microscopy of tissue sections at 1 hour after IP administration of different fluorescently labeled formulations (1 mg/kg) to CCl4 fibrotic rat model at excitation and emission wavelengths of 545 and 550–600 nm, respectively. Magnification 63×. (B) Calculated mean corrected total fluorescence intensity of tested formulations detected in various tissue organs after 1 hour from IP administration (1 mg/kg) to CCl4 fibrotic rat model. Data expressed as mean ± SEM (n=7), analyzed using one-way ANOVA followed by post hoc test (Duncan) for group comparisons. Means of similar symbols were statistically insignificant: a > b > c (p≤0.05). |
Another finding (Figure 7B) was that there were significant 1.4- and 1.6-fold increases (p≤0.05) in hepatic accumulation after IP administration of DiI-PS-LNCs and DiI-HA-LNCs, respectively, compared to untargeted DiI-LNCs. This strongly reflected the role of both PS and HA as suitable ligands for LNCs achieving active targeting to hepatic fibrosis. These results are in agreement with Wang et al,27 where curcumin-loaded PS-modified nanostructured lipid carriers displayed an enhanced liver-targeting ability compared to an unmodified formulation. This could be due to anionic PS actively targeting hepatic macrophages.27 The role of HA in actively targeting overexpressed CD44 receptors in liver fibrosis was demonstrated by Thomas et al.22 They prepared losartan-loaded HA-modified micelles and studied their biodistribution in both a normal and hepatic fibrotic mouse model. They found that accumulation of their prepared system in the liver was significantly higher for fibrotic mice than normal ones, due to the overexpression of CD44 receptors on activated HSCs, which mediated endocytosis of the HA-decorated micelles.22 To sum up, the results of tissue biodistribution study proved the active targeting achieved by both PS and HA-LNCs to fibrotic liver and further confirmed the enhanced antifibrotic effect of these formulations compared to the untargeted one.
Conclusion
No antifibrotic drugs have been approved for clinical use, due to absence of tissue selectivity and low concentrations reaching the target cells. In the current work, two novel modified LNCs (Ps-LNCs and HA-LNCs) were developed for targeted delivery of TSIIA in liver-fibrosis therapy. Modified TSIIA-loaded LNCs were successfully prepared and subjected to full in vitro and in vivo characterization. The prepared nanosystems possessed good in vitro characteristics in terms of their colloidal properties, TSIIA EE, TSIIA release, hemocompatibility, serum stability, and storage stability. In vivo efficacy and biodistribution results obtained implied the liver-targeting potential of the modified TSIIA-loaded LNCs. Consequently, the targeted TSIIA-LNCs look to be a promising nanocarrier that could circumvent the problems encountered with injectable TSIIA delivery and pave the way for their clinical use in liver-fibrosis treatment.
Data Sharing
The authors confirm that the findings obtained in this study are available within the article.
Disclosure
The authors confirm that they have no conflicts of interest associated with this work.
References
1. Kisseleva T, Brenner D. Molecular and cellular mechanisms of liver fibrosis and its regression. Nat Rev Gastroenterol Hepatol. 2020;18:1–16.
2. Parola M, Pinzani M. Liver fibrosis: pathophysiology, pathogenetic targets and clinical issues. Mol Aspects Med. 2019;65:37–55.
3. Guo Y-C, Lu L-G. Antihepatic fibrosis drugs in clinical trials. J Clin Transl Hepatol. 2020;8(3):304–312. doi:10.14218/JCTH.2020.00023
4. Liu Y, Chen H, Jiang Y. Effect of tanshinone IIA on CCl4-induced liver fibrosis in rats. Zhong Yao Cai. 2002;25(1):31–33.
5. Sun RF, Liu LX, Zhang HY. Effect of tanshinone II on hepatic fibrosis in mice. Zhongguo Zhong Xi Yi Jie He Za Zhi. 2009;29(11):1012–1017.
6. Liu YW, Huang YT. Inhibitory effect of tanshinone IIA on rat hepatic stellate cells. PLoS One. 2014;9(7):e103229. doi:10.1371/journal.pone.0103229
7. Shu M, Hu XR, Hung ZA, Huang DD, Zhang S. Effects of tanshinone IIA on fibrosis in a rat model of cirrhosis through heme oxygenase-1, inflammation, oxidative stress and apoptosis. Mol Med Rep. 2016;13(4):3036–3042. doi:10.3892/mmr.2016.4886
8. Fan GW, Gao XM, Wang H, et al. The anti-inflammatory activities of Tanshinone IIA, an active component of TCM, are mediated by estrogen receptor activation and inhibition of iNOS. J Steroid Biochem Mol Biol. 2009;113(3–5):275–280. doi:10.1016/j.jsbmb.2009.01.011
9. Zhan CY, Tang JH, Zhou DX, Li ZH. Effects of tanshinone IIA on the transforming growth factor β1/Smad signaling pathway in rat cardiac fibroblasts. Indian J Pharmacol. 2014;46(6):633–638. doi:10.4103/0253-7613.144933
10. Pan T-L, Wang P-W. Explore the molecular mechanism of apoptosis induced by Tanshinone IIA on activated rat hepatic stellate cells. Evid Based Complement Alternat Med. 2012;2012:734987. doi:10.1155/2012/734987
11. Chen T, Yang J, Chen L, et al. Use of ordered mesoporous silica-loaded phyto-phospholipid complex for BCS IV class plant drug to enhance oral bioavailability: a case report of tanshinone II A. RSC Adv. 2016;6(116):115010–115020. doi:10.1039/C6RA22778C
12. Hao H, Wang G, Cui N, et al. Pharmacokinetics, absorption and tissue distribution of tanshinone IIA solid dispersion. Planta Med. 2006;72(14):1311–1317. doi:10.1055/s-2006-951698
13. Roger E, Lagarce F, Benoit JP. Development and characterization of a novel lipid nanocapsule formulation of Sn38 for oral administration. Eur J Pharm Biopharm. 2011;79(1):181–188. doi:10.1016/j.ejpb.2011.01.021
14. Abozaid D, Ramadan A, Barakat H, Khalafallah N. Acyclovir lipid nanocapsules gel for oromucosal delivery: a preclinical evidence of efficacy in the chicken pouch membrane model. Eur J Pharm Sci. 2018;121:228–235. doi:10.1016/j.ejps.2018.05.016
15. Ramadan A, Lagarce F, Tessier-Marteau A, et al. Oral fondaparinux: use of lipid nanocapsules as nanocarriers and in vivo pharmacokinetic study. Int J Nanomedicine. 2011;6:2941–2951.
16. Eissa MM, El-Moslemany RM, Ramadan AA, et al. Miltefosine lipid nanocapsules for single dose oral treatment of schistosomiasis mansoni: a preclinical study. PLoS One. 2015;10(11):e0141788. doi:10.1371/journal.pone.0141788
17. Amara RO, Ramadan AA, El-Moslemany RM, et al. Praziquantel-lipid nanocapsules: an oral nanotherapeutic with potential Schistosoma mansoni tegumental targeting. Int J Nanomedicine. 2018;13:4493–4505. doi:10.2147/IJN.S167285
18. Groo AC, Bossiere M, Trichard L, et al. In vivo evaluation of paclitaxel-loaded lipid nanocapsules after intravenous and oral administration on resistant tumor. Nanomedicine (Lond). 2015;10(4):589–601. doi:10.2217/nnm.14.124
19. Lollo G, Ullio-Gamboa G, Fuentes E, et al. In vitro anti-cancer activity and pharmacokinetic evaluation of curcumin-loaded lipid nanocapsules. Mater Sci Eng C Mater Biol Appl. 2018;91:859–867. doi:10.1016/j.msec.2018.06.014
20. Hirsjärvi S, Sancey L, Dufort S, et al. Effect of particle size on the biodistribution of lipid nanocapsules: comparison between nuclear and fluorescence imaging and counting. Int J Pharm. 2013;453(2):594–600. doi:10.1016/j.ijpharm.2013.05.057
21. Ashour AA, Ramadan AA, Abdelmonsif DA, El-Kamel AH. Enhanced oral bioavailability of Tanshinone IIA using lipid nanocapsules: formulation, in-vitro appraisal and pharmacokinetics. Int. J. Pharm. 2020;586:119598. doi:10.1016/j.ijpharm.2020.119598
22. Thomas RG, Moon MJ, Kim JH, Lee JH, Jeong YY. Effectiveness of losartan-loaded hyaluronic acid (HA) micelles for the reduction of advanced hepatic fibrosis in C3H/HeN mice model. PLoS One. 2015;10(12):e0145512. doi:10.1371/journal.pone.0145512
23. Chen YN, Hsu SL, Liao MY, et al. Ameliorative effect of curcumin-encapsulated hyaluronic acid-PLA nanoparticles on thioacetamide-induced murine hepatic fibrosis. Int J Environ Res Public Health. 2016;14(1):11–26. doi:10.3390/ijerph14010011
24. El-Mezayen NS, El-Hadidy WF, El-Refaie WM, et al. Hepatic stellate cell-targeted imatinib nanomedicine versus conventional imatinib: a novel strategy with potent efficacy in experimental liver fibrosis. J Control Release. 2017;266:226–237. doi:10.1016/j.jconrel.2017.09.035
25. El-Mezayen NS, El-Hadidy WF, El-Refaie WM, et al. Oral vitamin-A-coupled valsartan nanomedicine: high hepatic stellate cell receptors accessibility and prolonged enterohepatic residence. J Control Release. 2018;283:32–44. doi:10.1016/j.jconrel.2018.05.021
26. Wang J, Kang YX, Pan W, et al. Enhancement of anti-inflammatory activity of curcumin using phosphatidylserine-containing nanoparticles in cultured macrophages. Int J Mol Sci. 2016;17:5.
27. Wang J, Pan W, Wang Y, et al. Enhanced efficacy of curcumin with phosphatidylserine-decorated nanoparticles in the treatment of hepatic fibrosis. Drug Deliv. 2018;25(1):1–11. doi:10.1080/10717544.2017.1399301
28. Heurtault B, Saulnier P, Pech B, Proust J-E, Benoit J-P. A novel phase inversion-based process for the preparation of lipid nanocarriers. Pharm Res. 2002;19(6):875–880. doi:10.1023/A:1016121319668
29. Hirsjärvi S, Qiao Y, Royere A, Bibette J, Benoit JP. Layer-by-layer surface modification of lipid nanocapsules. Eur J Pharm Biopharm. 2010;76(2):200–207. doi:10.1016/j.ejpb.2010.07.010
30. Freag MS, Elnaggar YS, Abdelmonsif DA, Abdallah OY. Layer-by-layer-coated lyotropic liquid crystalline nanoparticles for active tumor targeting of rapamycin. Nanomedicine (Lond). 2016;11(22):2975–2996. doi:10.2217/nnm-2016-0236
31. Zhang Y, Huo M, Zhou J, Xie S. PKSolver: an add-in program for pharmacokinetic and pharmacodynamic data analysis in Microsoft Excel. Comput Methods Programs Biomed. 2010;99(3):306–314. doi:10.1016/j.cmpb.2010.01.007
32. Scholten D, Trebicka J, Liedtke C, Weiskirchen R. The carbon tetrachloride model in mice. Lab Anim. 2015;49(1 Suppl):4–11. doi:10.1177/0023677215571192
33. Reitman S, Frankel S. A colorimetric method for the determination of serum glutamic oxalacetic and glutamic pyruvic transaminases. Am J Clin Pathol. 1957;28(1):56–63. doi:10.1093/ajcp/28.1.56
34. Bessey OA, Lowry OH, Brock MJ. A method for the rapid determination of alkaline phosphates with five cubic millimeters of serum. J Biol Chem. 1946;164:321–329. doi:10.1016/S0021-9258(18)43072-4
35. Doumas BT, Watson WA, Biggs HG. Albumin standards and the measurement of serum albumin with bromcresol green. Clin Chim Acta. 1971;31(1):87–96. doi:10.1016/0009-8981(71)90365-2
36. Fujimoto N, Mouri N, Iwata K, et al. A one-step sandwich enzyme immunoassay for human matrix metalloproteinase 2 (72-kDa gelatinase/type IV collagenase) using monoclonal antibodies. Clin Chim Acta. 1993;221(1):91–103. doi:10.1016/0009-8981(93)90024-X
37. Kropf J, Schurek JO, Wollner A, Gressner AM. Immunological measurement of transforming growth factor-beta 1 (TGF-beta1) in blood; assay development and comparison. Clin Chem. 1997;43(10):1965–1974. doi:10.1093/clinchem/43.10.1965
38. Woessner JF
39. deLuca Summers L, Gommerman JL. Fine-tuning of dendritic cell biology by the TNF superfamily. Nat Rev Immunol. 2012;12(5):339–351. doi:10.1038/nri3193
40. Hirano T. Interleukin-6. In: Thomson A, editor. The Cytokine Handbook.
41. Brunt EM. Grading and staging the histopathological lesions of chronic hepatitis: the Knodell histology activity index and beyond. Hepatology. 2000;31(1):241–246. doi:10.1002/hep.510310136
42. Goodman ZD. Grading and staging systems for inflammation and fibrosis in chronic liver diseases. J Hepatol. 2007;47(4):598–607. doi:10.1016/j.jhep.2007.07.006
43. Morille M, Montier T, Legras P, et al. Long-circulating DNA lipid nanocapsules as new vector for passive tumor targeting. Biomaterials. 2010;31(2):321–329. doi:10.1016/j.biomaterials.2009.09.044
44. Parayath NN, Nehoff H, Müller P, Taurin S, Greish K. Styrene maleic acid micelles as a nanocarrier system for oral anticancer drug delivery - dual uptake through enterocytes and M-cells. Int J Nanomedicine. 2015;10:4653–4667.
45. Fangueiro JF, Andreani T, Egea MA, et al. Design of cationic lipid nanoparticles for ocular delivery: development, characterization and cytotoxicity. Int J Pharm. 2014;461(1–2):64–73. doi:10.1016/j.ijpharm.2013.11.025
46. Zheng S, Nguyen VD, Song SY, Han J, Park JO. Combined photothermal-chemotherapy of breast cancer by near infrared light responsive hyaluronic acid-decorated nanostructured lipid carriers. Nanotechnology. 2017;28(43):435102. doi:10.1088/1361-6528/aa847f
47. Shah NK, Gupta SK, Wang Z, Meenach SA. Enhancement of macrophage uptake via phosphatidylserine-coated acetalated dextran nanoparticles. J Drug Deliv Sci Technol. 2019;50:57–65. doi:10.1016/j.jddst.2019.01.013
48. Tran BN, Nguyen HT, Kim JO, Yong CS, Nguyen CN. Combination of a chemopreventive agent and paclitaxel in CD44-targeted hybrid nanoparticles for breast cancer treatment. Arch Pharm Res. 2017;40(12):1420–1432. doi:10.1007/s12272-017-0968-0
49. Peltier S, Oger JM, Lagarce F, Couet W, Benoît JP. Enhanced oral paclitaxel bioavailability after administration of paclitaxel-loaded lipid nanocapsules. Pharm Res. 2006;23(6):1243–1250. doi:10.1007/s11095-006-0022-2
50. Eldesouky LM, El-Moslemany RM, Ramadan AA, Morsi MH, Khalafallah NM. Cyclosporine lipid nanocapsules as thermoresponsive gel for dry eye management: promising corneal mucoadhesion, biodistribution and preclinical efficacy in rabbits. Pharmaceutics. 2021;13:3. doi:10.3390/pharmaceutics13030360
51. El-Sheridy NA, El-Moslemany RM, Ramadan AA, Helmy MW, El-Khordagui LK. Enhancing the in vitro and in vivo activity of itraconazole against breast cancer using miltefosine-modified lipid nanocapsules. Drug Deliv. 2021;28(1):906–919. doi:10.1080/10717544.2021.1917728
52. Hatahet T, Morille M, Shamseddin A, et al. Dermal quercetin lipid nanocapsules: influence of the formulation on antioxidant activity and cellular protection against hydrogen peroxide. Int J Pharm. 2017;518(1–2):167–176. doi:10.1016/j.ijpharm.2016.12.043
53. de la Harpe KM, Kondiah PPD, Choonara YE, et al. The hemocompatibility of nanoparticles: a review of cell-nanoparticle interactions and hemostasis. Cells. 2019;8(10):1209. doi:10.3390/cells8101209
54. Maitz MF, Sperling C, Wongpinyochit T, et al. Biocompatibility assessment of silk nanoparticles: hemocompatibility and internalization by human blood cells. Nanomedicine. 2017;13(8):2633–2642. doi:10.1016/j.nano.2017.07.012
55. Aguilar-Castillo BA, Santos JL, Luo H, et al. Nanoparticle stability in biologically relevant media: influence of polymer architecture. Soft Matter. 2015;11(37):7296–7307. doi:10.1039/C5SM01455G
56. Nandhakumar S, Dhanaraju MD, Sundar VD, Heera B. Influence of surface charge on the in vitro protein adsorption and cell cytotoxicity of paclitaxel loaded poly(ε-caprolactone) nanoparticles. Bull Fac Pharm Cairo Univ. 2017;55(2):249–258.
57. Bi HC, Zuo Z, Chen X, et al. Preclinical factors affecting the pharmacokinetic behaviour of tanshinone IIA, an investigational new drug isolated from Salvia miltiorrhiza for the treatment of ischaemic heart diseases. Xenobiotica. 2008;38(2):185–222. doi:10.1080/00498250701767675
58. Turner PV, Brabb T, Pekow C, Vasbinder MA. Administration of substances to laboratory animals: routes of administration and factors to consider. J Am Assoc Lab Anim Sci. 2011;50(5):600–613.
59. Bravo González RC, Huwyler J, Boess F, Walter I, Bittner B. In vitro investigation on the impact of the surface-active excipients Cremophor EL, Tween 80 and Solutol HS 15 on the metabolism of midazolam. Biopharm Drug Dispos. 2004;25(1):37–49. doi:10.1002/bdd.383
60. Wang R, Wang J, Song F, Li S, Yuan Y. Tanshinol ameliorates CCl(4)-induced liver fibrosis in rats through the regulation of Nrf2/HO-1 and NF-κB/IκBα signaling pathway. Drug Des Devel Ther. 2018;12:1281–1292. doi:10.2147/DDDT.S159546
61. Contreras-Zentella ML, Hernández-Muñoz R. Is liver enzyme release really associated with cell necrosis induced by oxidant stress? Oxid Med Cell Longev. 2016;2016:3529149. doi:10.1155/2016/3529149
62. Meng Z, Meng L, Wang K, et al. Enhanced hepatic targeting, biodistribution and antifibrotic efficacy of tanshinone IIA loaded globin nanoparticles. Eur J Pharm Sci. 2015;73:35–43. doi:10.1016/j.ejps.2015.03.002
63. Toyoki Y, Sasaki M, Narumi S, et al. Semiquantitative evaluation of hepatic fibrosis by measuring tissue hydroxyproline. Hepatogastroenterology. 1998;45(24):2261–2264.
64. Duarte S, Baber J, Fujii T, Coito AJ. Matrix metalloproteinases in liver injury, repair and fibrosis. Matrix Biol. 2015;44–46:147–156. doi:10.1016/j.matbio.2015.01.004
65. Gressner AM, Weiskirchen R, Breitkopf K, Dooley S. Roles of TGF-beta in hepatic fibrosis. Front Biosci. 2002;7:d793–807. doi:10.2741/gressner
66. Dooley S, Ten Dijke P. TGF-β in progression of liver disease. Cell Tissue Res. 2012;347(1):245–256. doi:10.1007/s00441-011-1246-y
67. Gressner OA, Weiskirchen R, Gressner AM. Evolving concepts of liver fibrogenesis provide new diagnostic and therapeutic options. Comp Hepatol. 2007;6:7–19. doi:10.1186/1476-5926-6-7
68. Schon HT, Bartneck M, Borkham-Kamphorst E, et al. Pharmacological intervention in hepatic stellate cell activation and hepatic fibrosis. Front Pharmacol. 2016;7:33–54. doi:10.3389/fphar.2016.00033
69. Che XH, Park EJ, Zhao YZ, Kim WH, Sohn DH. Tanshinone II A induces apoptosis and S phase cell cycle arrest in activated rat hepatic stellate cells. Basic Clin Pharmacol Toxicol. 2010;106(1):30–37.
70. Prystupa A, Kiciński P, Sak J, et al. Proinflammatory cytokines (IL-1α, IL-6) and hepatocyte growth factor in patients with alcoholic liver cirrhosis. Gastroenterol Res Pract. 2015;2015:532615–532621. doi:10.1155/2015/532615
71. Yang YM, Seki E. TNFα in liver fibrosis. Curr Pathobiol Rep. 2015;3(4):253–261. doi:10.1007/s40139-015-0093-z
72. Schmidt-Arras D, Rose-John S. IL-6 pathway in the liver: from physiopathology to therapy. J Hepatol. 2016;64(6):1403–1415. doi:10.1016/j.jhep.2016.02.004
73. Huang HL, Wang YJ, Zhang QY, et al. Hepatoprotective effects of baicalein against CCl4-induced acute liver injury in mice. World J Gastroenterol. 2012;18(45):6605–6613. doi:10.3748/wjg.v18.i45.6605
74. Zhu B, Zhai Q, Yu B. Tanshinone IIA protects rat primary hepatocytes against carbon tetrachloride toxicity via inhibiting mitochondria permeability transition. Pharm Biol. 2010;48(5):484–487. doi:10.3109/13880200903179699
75. Guan CW, Jin J, Li J, Zhao ZX, Huang ZY. Tanshinone IIA protects against triptolide-induced liver injury via Nrf2/ARE activation. Yao Xue Xue Bao. 2013;48(9):1397–1402.
76. Wang W, Guan C, Sun X, et al. Tanshinone IIA protects against Acetaminophen-induced hepatotoxicity via activating the Nrf2 pathway. Phytomedicine. 2016;23(6):589–596. doi:10.1016/j.phymed.2016.02.022
77. Erion MD. Prodrugs for liver-targeted drug delivery. In: Stella VJ, Borchardt RT, Hageman MJ, Oliyai R, Maag H, Tilley JW, editors. Prodrugs: Challenges and Rewards Part 1. New York: Springer; 2007:541–572.
78. Bastiat G, Pritz CO, Roider C, et al. A new tool to ensure the fluorescent dye labeling stability of nanocarriers: a real challenge for fluorescence imaging. J Control Release. 2013;170(3):334–342. doi:10.1016/j.jconrel.2013.06.014
79. Lacoeuille F, Hindre F, Moal F, et al. In vivo evaluation of lipid nanocapsules as a promising colloidal carrier for paclitaxel. Int J Pharm. 2007;344(1–2):143–149. doi:10.1016/j.ijpharm.2007.06.014
 © 2021 The Author(s). This work is published and licensed by Dove Medical Press Limited. The full terms of this license are available at https://www.dovepress.com/terms.php and incorporate the Creative Commons Attribution - Non Commercial (unported, v3.0) License.
By accessing the work you hereby accept the Terms. Non-commercial uses of the work are permitted without any further permission from Dove Medical Press Limited, provided the work is properly attributed. For permission for commercial use of this work, please see paragraphs 4.2 and 5 of our Terms.
© 2021 The Author(s). This work is published and licensed by Dove Medical Press Limited. The full terms of this license are available at https://www.dovepress.com/terms.php and incorporate the Creative Commons Attribution - Non Commercial (unported, v3.0) License.
By accessing the work you hereby accept the Terms. Non-commercial uses of the work are permitted without any further permission from Dove Medical Press Limited, provided the work is properly attributed. For permission for commercial use of this work, please see paragraphs 4.2 and 5 of our Terms.