")
Back to Archived Journals » Energy and Emission Control Technologies » Volume 4
Modeling of particle size distribution of limestone in sulfur capture in air and oxy-fuel circulating fluidized bed combustion
Authors Saastamoinen J, Tourunen A, Leino T, Pikkarainen T
Received 22 December 2015
Accepted for publication 2 March 2016
Published 10 August 2016 Volume 2016:4 Pages 41—52
DOI https://doi.org/10.2147/EECT.S102960
Checked for plagiarism Yes
Review by Single anonymous peer review
Peer reviewer comments 2
Editor who approved publication: Dr Adolfo Perujo
Jaakko Saastamoinen,1 Antti Tourunen,2 Timo Leino,1 Toni Pikkarainen,1
1VTT Technical Research Centre of Finland Ltd, Jyväskylä, 2Reteres Oy, Äijälä, Finland
Abstract: Measurements for partition of Ca-containing compounds in particles in air and oxy-fuel combustion are presented. A model for steady and unsteady state particle size distribution (PSD) of limestone including the effects of PSD of the feed, attrition, fly ash, and bottom ash removal is presented. By incorporating models for sulfation, a new model for distribution of Ca-containing compounds CaCO3, CaO, and CaSO4 in different particle sizes during sulfation is found. The model can be applied to study the effects of different factors on the PSD of limestone in the bed, to optimize the PSD in the bed, and to study reasons for the measured PSDs and distributions of Ca-containing compounds in different size fractions in the bed in sulfur capture in circulating fluidized bed combustion in air and oxy-fuel conditions.
Keywords: limestone, sulfur capture, circulating fluidized bed, population balance modeling, oxy-fuel
Introduction
The particle size distribution (PSD) is an important factor affecting the fluidization, heat transfer, combustion, and sulfur capture in fluidized bed combustion (FBC) and circulating fluidized bed combustion (CFBC). The solid material mainly consists of bed material, ash, limestone, and char. The particle size is reduced by attrition for ash and limestone and by reaction for char. PSD in the bed depends on the PSDs of the feed material and of the material outgoing as fly ash and bottom ash removal in addition to attrition and reaction.
Population balance models are widely applied in different fields of engineering sciences and biology. Kunii and Levenspiel1 presented the general differential equation for the PSD in the bed without breakage. After this pioneering work, discretized equations have been applied to study PSD in fluidized and circulating fluidized beds, where PSD is changing due to surface reaction, attrition, or fragmentation. Population balance modeling has been applied in simulating PSD of char,2–16 limestone,17–25 ash in different solids or ash26–37 in FBC and CFBC and in other fluidized bed processes38,39 and gasification.40–42 The burn-off instead of particle size as the distributed variable has been used.43 Most of the models are steady state, but dynamic evolution of the PSD has also been modeled.14,23,34,44,45 Coupling of PSDs and reactions described by shrinking core model have been discussed.46,47 The cyclone characteristics affect the PSD of the elutriated particles, which are returned to the reactor. The cyclone affects the demand of limestone.48 The solid is divided into different materials such as char, ash, CaO, CaCO3, CaSO4 and make up sand and each of them is divided into different size fractions in a three-dimensional model for CFB.49,50 A balance is written for all of these size fractions. The partitioning of calcium and sulfur between bottom ash and fly ash in a CFB boiler has been studied.51
Oxy-firing is a promising technology leading to high concentration of CO2 in flue gases allowing its effective separation for sequestration.52–59 There are some differences in sulfur capture in air-firing and oxy-firing as the gas atmosphere and temperature defines the sulfur capture mechanism. In air-firing and high temperature oxy-fuel conditions CaCO3 is first calcined to CaO and then CaO reacts with SO2 (and O2) forming CaSO4. This reaction path is called indirect sulfation. At a lower temperature (and high CO2) conditions, CaCO3 is not calcined due to high CO2 partial pressure and CaCO3 directly reacts with SO2 (and O2) forming CaSO4. That reaction path is called direct sulfation. The sulfur capture is worse in direct sulfation region, but capture is enhanced by higher CO2 partial pressure in direct sulfation region.60,61 The higher CO2 content slows down the calcination reaction and improves the sulfur capture because the formation of dense CaSO4 layer is prevented due to flow of CO2 from calcination through the sulfation product layer.62,63 Scanning electron microscopy-energy dispersive X-ray spectroscopy micrographs of the particles reacted under indirect and direct sulfation conditions show differences in the sulfur distribution.60
The dense CaSO4 is the main reason for relatively low calcium utilization for sulfur capture in fluidized bed combustion applications. Normally, calcium conversion to CaSO4 seldom exceeds 30%–40%. Sulfur capture by limestone particles in air-firing and oxy-firing conditions in fluidized beds has been studied.59,60 In addition there are some differences in the comminution behavior in air-firing and oxy-firing.23,64–67 In air-firing, the particles may undergo extensive primary fragmentation during calcination but in oxy-firing much less fragmentation takes place.23,67 During sulfation a product layer consisting of CaSO4 is formed. The direct sulfation conditions in oxy-firing seem to enhance attrition. Attrition could effectively enhance particle sulfation under oxy-firing conditions by continuously disclosing unconverted calcium to the sulfur-bearing atmosphere.22,64,65
This paper presents a new model for the calculation of the steady and unsteady state PSDs of limestone and distribution of different Ca-containing compounds in the PSD. Instead of a customary population balance model, the derivation of the model equations is based on Dirac’s delta function and its properties. This gives a new two-dimensional approach, in which the particle mass as function of size and compounds can be calculated.
Experimental
Steady state measurements
Experimental methods have been discussed earlier.68 The continuously operated, traditional online analyzers of gaseous emissions include O2, CO2, CO, NOx, and SO2. In addition to the traditional online analyzers, emission measurements are usually complemented with the Fourier transform infrared spectroscopy gas analyzer (H2O, CO2, CO, NO, NO2, N2O, SO2, SO3, HCl, NH3, HCN, CH4, C2H2, C2H4, C2H6). The typical location of the Fourier transform infrared spectroscopy measurement point is at the flue gas line between the primary and secondary cyclone.
In addition to flue gas measurements, gas and solid material samples are taken from different levels of the riser during the steady state operation. These samples combined with pressure and temperature measurements describe the combustion profile in detail.
During the test campaign, many measurements are carried out and numerous material samples are collected for further analysis. A typical sampling and analysis procedure for fuel and ash samples is described in the following.
A comprehensive analysis of the prepared fuel is performed on one representative sample of each fuel, including proximate and ultimate analyses. For each test run, the fuel samples are combined to produce one representative fuel sample per test. A minimum of the following components are analyzed from the fuel samples of each test: moisture, ash content (815°C), and sulfur. A comprehensive analysis is performed from the prepared limestone sample, including at least the Ca, Mg, S, and C contents and moisture.
The ashes are sampled at regular intervals during each pilot test run. The ash samples include:
- Bottom ash
- Circulation material from the downcomer of the primary cyclone
- Ash from the downcomer of the secondary cyclone
- Ash from the gas cooler before the filter
- Ash from the bag house (if the bag house is used).
All the ashes sampled and discharged during each test run are collected and weighed to define the ash balance and split. The circulation flow rate through the primary cyclone is also measured.
Three separate fly ash samples (3–5) can be analyzed as they are, or they can be mixed in the ratio of mass extracted from the reactor at different sampling points to produce one fly ash sample per test. From the bottom ash, circulation material and fly ash sample(s) of each test at least components presented in Table 1 are analyzed.
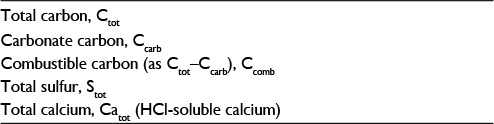 | Table 1 Typical (minimum) list of chemical analyses for the solid material samples taken from the CFB pilot reactor Abbreviation: CFB, circulating fluidized bed. |
Gas and solid material profiles along the furnace height can be measured with a gas–solid sampling probe (at least four points, Fourier transform infrared spectroscopy and O2 analyzers) during the specified test runs. In addition to the fact that gas samples can be taken from different locations in the furnace, the temperature and pressure profiles along the riser are measured continuously during all the tests. As well as the analyses shown in Table 1, sieving can be applied to solid material samples to determine PSDs and produce fractional samples for the chemical analysis. Based on the chemical analysis shown in Table 1, concentrations of CaO, CaCO3, CaSO4, and combustible char can be produced with the following assumptions:
- All carbonate carbon originates from CaCO3;
- All sulfur originates from CaSO4;
- The rest of the total calcium, which is not included (CaCO3 and CaSO4), originates from CaO;
- Combustible char is determined as a difference between total carbon and carbonate carbon.
It is obvious that the assumptions shown above cause inaccuracy in the results, but the main elements can be analyzed with appropriate accuracy and efforts with this approach. The same chemical analyses as shown in Table 1 can also be applied to solid material samples taken during the profile measurements. If sieving is also applied, the fractional profiles for the main chemical components can be produced as a function of furnace height.
Results
The measured PSD of limestone feed and the particle size for the components CaO, CaCO3, and CaSO4 in air-firing and oxy-firing conditions are shown in Figures 1 and 2. The pilot scale CFBC has been described elsewhere.55 The masses of different Ca-containing components are shown in Table 2 and other conditions in Table 3. The mass of CaCO3 was much higher in oxy-firing and CaO much smaller as expected, since negligible calcination takes place in these conditions. Some differences are seen in the partitioning of the different compounds in different sizes in air and oxy-fuel combustion.
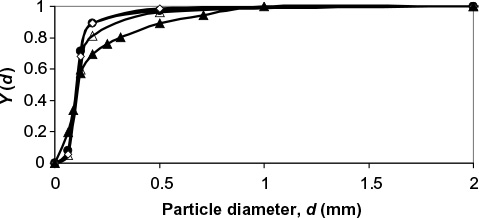 | Figure 1 Cumulative PSDs for limestone feed (▴) and measured components CaO (◊), CaCO3 (▵), and CaSO4 (•) in the bed in air-firing conditions. Abbreviation: PSDs, particle size distributions. |
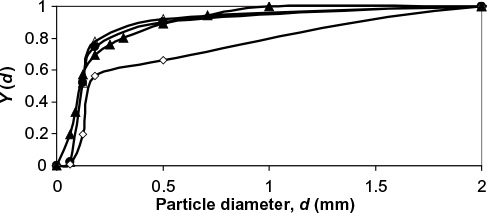 | Figure 2 Cumulative PSDs for limestone feed (▴) and measured components CaO (◊), CaCO3 (▵), and CaSO4 (•) in the bed in oxy-firing conditions. Abbreviation: PSDs, particle size distributions. |
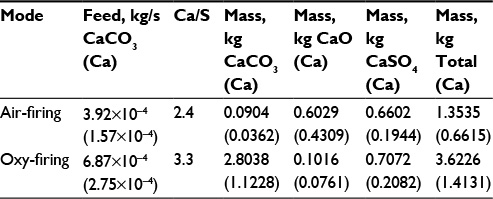 | Table 2 Mass (kg) of different components and Ca in the bed and feed mass flow rate of limestone (kg/s) |
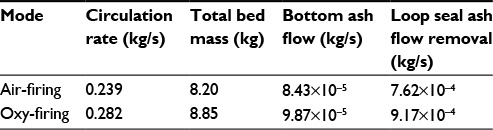 | Table 3 Circulation rate, total bed mass, and ash removal rates by bottom ash and loop seal |
It is also possible to calculate the PSD of Ca by summing its contents in different mass fractions by  where m is mass and M is molar weight. For feed this is equal to the PSD of the limestone, since Ca is practically only the compound CaCO3. The cumulative PSD is shown in Figure 3. In air combustion, the bed material containing Ca is smaller than in the feed or in oxy-fuel combustion, which is probably due to primary fragmentation in the calcination stage.
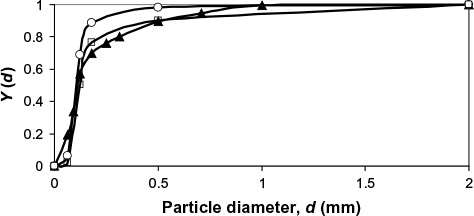 | Figure 3 Cumulative PSD for Ca in limestone feed (▴), Ca in air combustion (O), and Ca in oxy-fuel combustion (★). Abbreviation: PSD, particle size distribution. |
The conversion of particles in different size classes presented in Figure 4 is found as the ratio of mass of Ca in compound CaSO4 to total mass of Ca in all compounds. It is seen that the conversion in air-firing is higher than in oxy-firing, which is partly due to lower Ca/S ratio in the feed. The shapes of the curves also differ. In air-firing, a minimum conversion is obtained at the diameter ∼0.25 mm, whereas in oxy-firing the curve is rather flat or there is a slight minimum at size 0.15 mm.
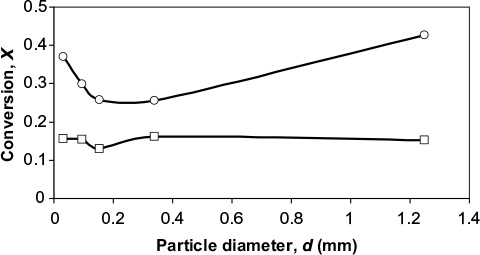 | Figure 4 Measured conversion of particles in the bed in air-firing (O) and in oxy-firing (★). |
The reason for the minimum observed in air-firing may be due to the method of ash removal. The rate of bottom ash removal is low and most of the material is removed after the cyclone, where there are fewer large particles. The larger particles have a longer time to be sulfated in the bottom area of the bed before entrainment; the smallest size are more rapidly reacted with higher final degree of conversion Xmax especially in air combustion before pore plugging. Then the minimum is probably due to loop seal ash removal, where part of particles large enough to be entrained is removed and their average residence time in the reactor becomes shorter.
Model
PSDs of different material in CFBC can be simulated by using population balance modeling. In the present paper another approach is taken, which gives the possibility to describe the partitioning of different compounds in different size fractions. The model is based on the application of Dirac’s delta function and its properties. First, an analytical solution for the PSD in the bed as function of time with mono-sized feed is derived. Then, the PSD for a general PSD can be found by summing different mono-sized fractions. This treatment also makes it possible to include sulfation in the model, which would otherwise require a complicated two-dimensional population model (particle size and degree of conversion).
In oxy-firing conditions the calcination step does not take place leading to low primary fragmentation, whereas in air-firing conditions particles may undergo extensive primary fragmentation during calcination.23,64–67 In the model, the subsequent PSD after primary fragmentation is used as the effective PSD of the feed and attrition is the only comminution mechanism affecting the subsequent PSD. It is also assumed that the attrition products are so small that they are rapidly escaping from the reactor.
Time constant for bed material removal
There are several correlations of the type dm/dt=–Km (m is mass, t is time and K is a coefficient) to estimate the rate of entrainment or elutriation of particles of a size class from the bed.1 The propensity for entrainment of a particle from the bed increases with increasing difference between the gas velocity and the free settling velocity of the particle as shown by equations presented in the literature.69,70
Later, more sophisticated models for the hydrodynamics of CFBC have been presented. The residence time of particles in the riser has been discussed.71 In the present paper, the circulation time tp is based on measurements, but literature correlations of computational fluid dynamics calculation for estimating the average residence time of a particle size class in the bed (=1/K) could also be applied. The time constant for circulation of a particle size was estimated by the relation 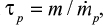 , where m is the mass of that size fraction in the bed and
  is the measured circulation mass flow rate of the size. Average value (based on total mass and mass flow rate) calculated with measured values presented in Table 2 is shown in Table 4. Figure 5 shows that the time constant increases with increasing particle size, since it takes a longer time for large particles to escape the bed and rise up. This figure only applies for this reactor in these conditions. The measured circulation time is applied to avoid the error caused from literature correlations in this illustration, since the emphasis in this paper is in the understanding of the formation of PSD and not in hydrodynamics. However, the method is also applicable to other reactors or operational conditions by applying theoretically or experimentally found correlations for circulation time or mass flow through cyclone34 using methods presented in the literature for hydrodynamics and particle flow. The average time constant for bottom ash removal,
  , is shown in Table 4. Depending on the removal location tb can be dependent on the particle diameter as tp or it may be constant if average bed material is removed. If bed material is removed at the bottom, coarse particles are more frequent due to segregation. The dependence of tb on particle diameter can be found by experiments (see Figure 6).
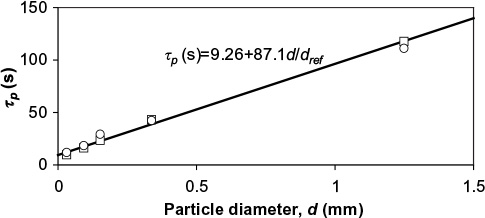 | Figure 5 Dependence of circulation time constant on particle size in air-firing (O) and oxy-firing (★) experiments. Reference diameter (dref) =1 mm. |
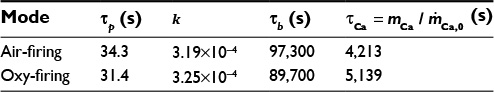 | Table 4 Average time constant for circulation tp, ratio of material removal rate from loop seal to circulation rate k, average time constant for bottom ash removal tb and average residence time for Ca in the bed tCa (mass of Ca in the bed divided by mass flow rate of Ca into the bed) |
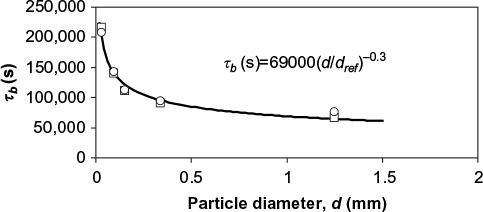 | Figure 6 Dependence time constant of bottom ash removal on particle size in air-firing (O) and oxy-firing (★) experiments. Reference diameter (dref) =1 mm. |
Evolution of mass after feeding a mono-sized batch of particles
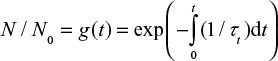
A batch of material (bed material, ash from coal, Ca) with particle size d0 is fed into the reactor. The subsequent mass of the batch will decrease due to reduction of particle diameter by attrition and due to loss of particles in fly ash and bottom ash,72
|
|
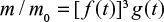
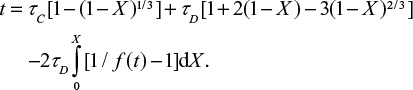
m0 is mass of Ca, ash or char introduced to the reactor. Functions f(t)=d/d0 and g(t)=n/n0 describe the change of particle diameter and number of particles in the fluidized bed as function of time.
The particle size reduces due to attrition described by dd/dt=–Kdn where d is particle diameter, t is time, n is constant and K is a coefficient. There seems to be no systematic study on the effect of particle size on the rate of attrition. Attrition depends on the reactor type and the other bed material. The conditions of the experimental reactors may be different from that of full-scale boilers, where the particles can be moving between fuel-rich and fuel-lean zones. This affects the attrition rate due to different chemical reactions at the surface of particles. If the mass loss by attrition from a particle is assumed to be proportional to the surface area, the value of the exponent is n=0. Small particles follow the gas flow better than large ones. Then, large heavier particles may more frequently and with higher impact collide with reactor surfaces and other particles resulting in experimental exponent n > 0. The effect of particle size on attrition of limestone has been discussed.73 In a bed of 100% limestone particles, the total attrition rate was independent of particle size, when excess gas velocity exceeding minimum fluidization velocity was constant.73 This indicates value n=1. However, the minimum velocity depends also on n. The surface attrition rate of limestone proportional to the particle size (n=1) has been used in the modeling.18 Different values presented in the literature have been discussed.20,21 The calculated steady state PSD agreed with the measured one in a pressurized fluidized bed reactor with exponent n=2.21,24 It is possible to determine the attrition rate with no hypothesis about the functional form for the dependence on the particle size (such as ∼dn) assuming no primary fragmentation, if the steady state PSD in the bed, PSD of the feed, the mass of the bed and the inlet mass flow rate of the material are measured.14,24
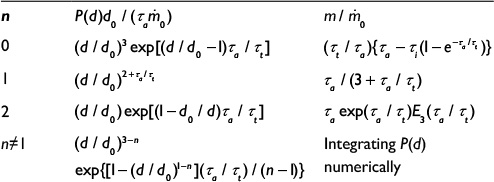
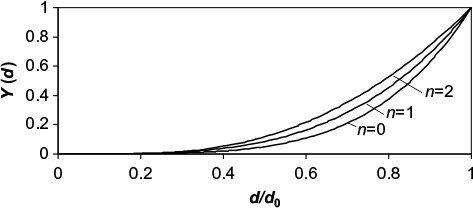
In the case of char combustion, the form for particle size reduction is different.14,34 This gives the functions f(t) for different n presented in Table 5. The attrition time constant is 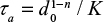 . The efficiency of the cyclone is
 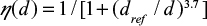 , where dref =0.0078 mm.
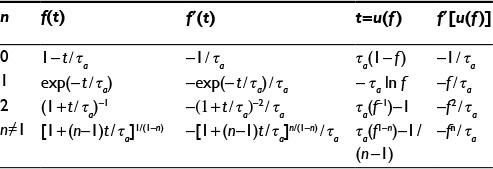 | Table 5 Function f(t), its derivative f´(t), and inverse function t=u(f) |
Part of the bed material can be taken away from the loop seal. The decay function g(t) for number of particles in this case is derived for a batch of particles fed into the reactor. The number flow of particles (N) in a CFBC is shown in Figure 7. The balance for the number (N) of particles in the bed is,
|
|
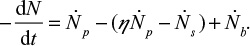
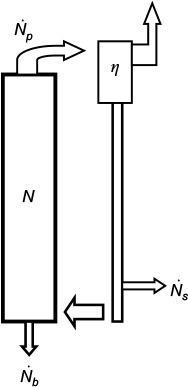 | Figure 7 Particle circulation and removal in a CFBC. Abbreviations: CFBC, circulating fluidized bed combustion; N, number of particles; N, flow rate of particles; b, bottom ash or bed; p, particle circulation; s, removal after cyclone. |
The term on the left-hand side describes the reduction of the number of particles in the bed, the first term on the right-hand side is due to particles flowing to the cyclone, the second term is the particle flow back to the bed from the loop and the last is due to bottom ash removal. We use the time constants  and cyclone time constant tc=tp/(1–h+k), where a parameter k has been added to the previous expression33,71 to include the possible removal of material directly after the cyclone. Then the total time constant for material removal is
  , where the ratio
  . We get,
|
|
The particle size d of the initial particles may change with time due to attrition and tt then becomes a function of time, since it depends on particle size d. Then the solution of Equation 3 gives for the particle number decay function,
|
|
where tt is the combined time constant for total material removal, 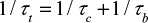 . Function g(t) can readily be calculated, when the change of particle size with time d/d0=f(t) and the dependence of the total time constant tt on particle diameter are known.
The different time constants are presented in Figure 8A. If no material is removed in the loop seal after cyclone, the cyclone time constant would be much higher as shown in Figure 8B. Then, in practice the removal of bottom ash should be higher (time constant tb lower) in order to maintain the same level of bed mass.
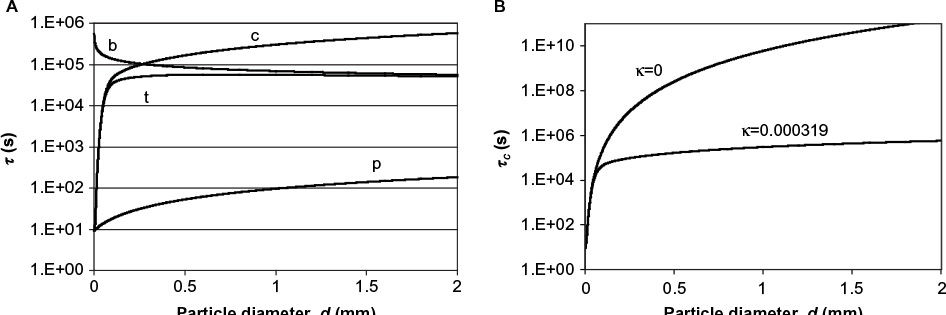 | Figure 8 Time constants in CFBC. Notes: (A) Dependence of circulation (p), bottom ash (b), cyclone (c), and total (t) time constants on particle size with loop seal ash removal. (B) Comparison of cyclone time constants with and without loop seal ash removal. Abbreviation: CFBC, circulating fluidized bed combustion. |
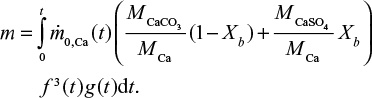
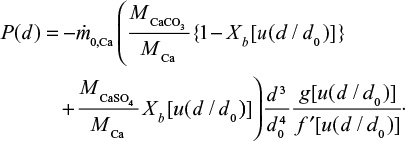
In the conditions of direct sulfation, we can also consider the different components in CaCO3 and CaSO4 in the limestone (or CaO in air-firing conditions). Then the total mass of the limestone depends on its degree of conversion in the bed Xb,
|
|
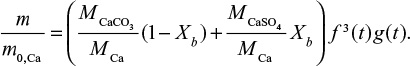
Note the misprint (missing Xb) in a previous publication.72 The first term in the brackets is due to CaCO3 and the second one is due to CaSO4. In air-firing conditions the MCaCO3 is replaced by MCaO.
Evolution of mass with continuous feeding of mono-sized particles
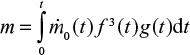
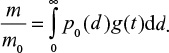
We consider a continuous feed of material (ash, char, or Ca) into the fluidized bed. The feed rate  may depend on time. The mass of this material in the bed at present time can be found by summing up differential batches fed, Equation 1, in the reactor in the past,
|
|
where t is time from the present (t=0) to the past. For limestone in direct sulfation in oxy-firing conditions,
|
|
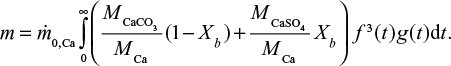
On one hand, the mass of the batch is reduced due to attrition and loss of material in fly and bottom ash flows and on the other hand, it is increased due to sulfation. In steady state (t=∞) and constant inlet mass flow rate, the mass of inert material and limestone in the bed become
|
|
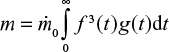
where t is time from present to the past. For limestone,
|
|
Evolution of PSD and partitioning of compounds in the PSD
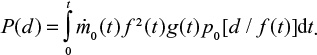
At first we consider feed material with single particle size d0 and later extend the results to a general PSD. The PSD of a single size can be described by the Dirac delta function 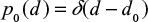 . The decreasing particle size in the reactor remains mono-sized, when the material is assumed to be homogeneous with no particle-to-particle differences in reaction or attrition rate. In reality, attrition is a stochastic process and using some distribution for attrition rate would be more accurate. The PSD as function of time is then
 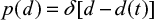 . The PSD, P(d), after a batch is fed can be expressed as,
|
|

PSDs of different components of Ca in the bed,
|
|
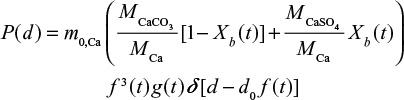
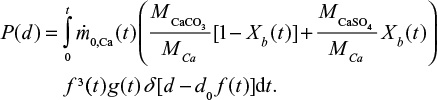
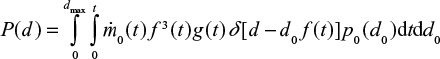
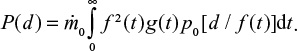
where the first term in the brackets is due to CaCO3 (or CaO) and the second due to CaSO4. The PSD due to continuous time dependent feed can be found by summing up (integrating) responses to differential batch feeds,
|
|
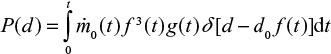
and for different components of Ca,
|
|
In steady state the inlet mass flow rates are constant, 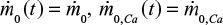 and the upper integration limit t=∞.
In order to evaluate the integrals, we recall the properties of the Dirac delta function,
|
|
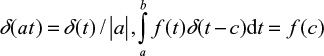
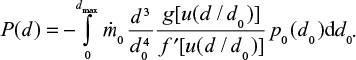
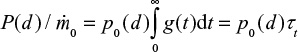
when a≤c≤b. Function d/d0=f(t) is continuous and monotonously decreasing. The relation between time and particle size is t=f–1(d/d0) =h(d/d0), where h is the inverse function of f. This gives the result for mono-sized feed,
|
|
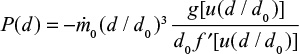
where 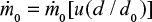 is constant in steady state.
For limestone we have two components,
|
|
For a general inlet PSD p0(d0),
|
|
An expression for the PSD for the components of limestone is found in a similar way from Equation 16.
It should be noted that this analysis requires attrition to take place, since the integration of Equations 12 and 13 involving the Dirac delta function, requires the relation between time and particle size d/d0=f(t). If no attrition takes place, f(t)=1, that is, the mono-sized feed with size d0 remain in this size. For this case, an alternative form for the PSD with a general inlet PSD can be found by applying Equation 12,
|
|
which can be integrated,
|
|
In steady state, when the mass flow rate is constant,
|
|
For the case with no attrition f(t)=1 and we get,
|
|
where tt is also function of diameter d. The bed mass in this case becomes,
|
|
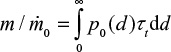
which could also be found directly by integrating from a response to a batch feed,
|
|
The PSD of the limestone is presented in fractional form. It is assumed that the cumulative PSD is linear in the range between sieve sizes (points in Figures 1 and 2). Then the PSD p0(d)=pi inside a fraction i between sizes di,min…di,max is approximated as constant,  . Equation 17 gives the approximate result for a size fraction
|
|
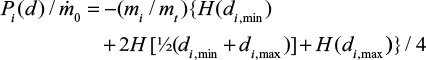
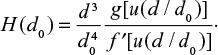
where
|
|
A more accurate result is obtained by dividing the fraction into several subfractions. The total response of the PSD in the bed is obtained by summing up the contribution of all size fractions.
Model for sulfation
In air-firing condition, the sulfation is described by the simple model,72
|
|
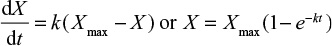
where t is time, k is reaction rate constant and Xmax is final degree of conversion. The direct sulfation taking place in oxy-firing is assumed to take place according to the shrinking core model,24
|
|
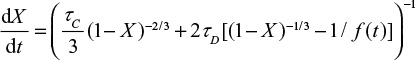
where the first term in the brackets is due to chemical kinetics and the second is due to diffusion of SO2 through the product layer. tD and tC are complete conversion times under control of diffusion and chemical kinetics, respectively. Attrition reduces the thickness of the product layer. The conversion is related to the location of the reaction front 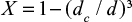 . This equation gives,
|
|
Discussion
Simple analytical solutions
It is possible to derive simple analytical solutions for simplified problems starting from the population balance modeling20 or by the present approach. For example for mono-sized particle feed, when 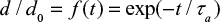 , we get from Equation 18,
|
|

If  is constant and we approximate tt as constant, g(t) = exp(-t/Tt). This is exactly valid, if no attrition takes place, and we get the results presented in Table 6.
 | Table 6 Particle size distribution and mass of bed when tt is constant (ie, does not depend on d) Notes: |
 .
.Calculations for mono-sized feed
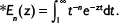
The total time constant used in the calculations that includes the effect of cyclone, circulation time, and ash-removal is shown in Figure 8A. The effect of n on the shape of the steady state PSD calculated with Equation 17 is shown in Figure 9.
 | Figure 9 Effect of attrition exponent n on the shape of the steady state cumulative PSD. Abbreviation: PSD, particle size distribution. |
It is possible to find the exponent n, for example, by comparing measured steady state PSD Equation 17 with the calculated one. If particles are not removed from the reactor g(t)=1, then the measured P(d) in steady state directly gives the function  and information of the attrition type. Function f can be found more directly by applying Equation 1 for the mass of a batch or Equation 4 for the development of the mass with a continuing feed.
An example of the calculated distribution of Ca-containing compounds in air-firing is presented in Figure 10. The conversion of those particles originated from the 1 mm particles reaches a high degree as their size is reduced. However, their mass in the bed decreases due to smaller size and number. Thus, the mass of the particles with high CaCO4 content has a maximum at a certain size. The mass average conversion (mass of Ca in CaSO4/total mass of Ca) is 0.351 in this case.
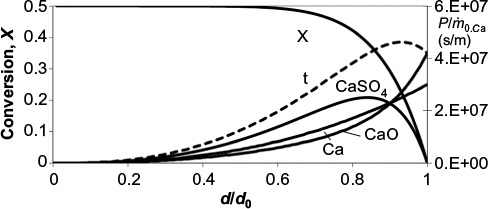 | Figure 10 Calculated conversion X and mass PSD of Ca divided by mass flow rate of Ca into the reactor Abbreviation: PSD, particle size distribution. |
 (in compounds, right hand side axis), CaO, CaSO4 and total (CaO, CaSO4, t) in the bed resulting from mono-sized limestone feed (d0=1 mm), when attrition time constant τa=30000 s and reaction time constant τr=1/k=3600 s (Xmax=0.5).
Calculations for feed with a PSD
The PSDs and the location of different Ca-containing compounds (CaO, CaCO3, CaSO4) in different size fractions was measured as shown in Figures 1–3. Simulating the results by the model requires the knowledge of primary fragmentation, attrition, and reaction rate behavior and their model parameters. It was not in the scope to measure these parameters for the limestone used. The following calculation is so far presented as an illustration. The PSD (of Ca) is calculated with Equation 27. We do not have the information about the primary fragmentation, so the feed PSD is assumed to be that of the original limestone (see Figures 1–3). Since all other time constants are known except the attrition time constant, it was varied to reach the measured mass of Ca in the bed. The calculated mass of Ca in air-firing (Table 2, 0.66 kg) is obtained, if attrition time constant ta=17,600 seconds (n=1) is chosen. The calculated mass of Ca in oxy-firing becomes the measured one (1.41 kg) with the choice of attrition time constant ta=22,400 seconds. The resulting calculated PSD in the bed is shown in Figure 11. It is seen that it is rather close to the measured one in oxy-firing conditions in Figure 3. The measured and calculated (in the brackets) cumulative mass fractions were 0.24 (0.15), 0.50 (0.55), 0.76 (0.67), 0.90 (0.90), and 1.00 (1.00) for sieve sizes 0.063, 0.125, 0.18, 0.5, and 2 mm, respectively. The differences can be due to some inaccuracies in the model parameters (time constants), due to some mild primary fragmentation or by the sampling method of material from the bed, material wearing in the subsequent sieving, and the basic PSD measurement method. The calculation of PSD of compounds containing Ca was earlier illustrated for mono-sized feed (Figure 10). In a similar way, it is possible to use the method for arbitrary feed PSD.
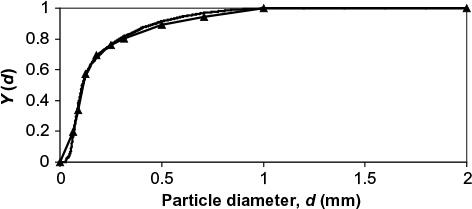 | Figure 11 Calculated normalized cumulative PSD of Ca in the bed (no symbols) and PSD of limestone feed (▴). Abbreviation: PSD, particle size distribution. |
Conclusion
Experiments in air-firing and oxy-firing conditions in a pilot scale CFBC were carried out. The PSDs of the limestone and different calcium containing compounds were determined by sampling the bed material and analyzing. Major compounds in air-firing were CaO and CaSO4 and in oxy-firing CaCO3 and CaSO4 as expected. The degree of conversion in air-firing in the bed limestone exhibited a minimum at a certain particle size, while the degree of conversion in oxy-firing was rather even regardless of the particle size.
Methods to calculate the PSD and mass of inert material and limestone in CFBC and FBC are presented. A new model for predicting PSDs for different Ca-containing compounds in different particle sizes was developed for steady and unsteady state. The model can be applied to study the effects of PSD of limestone feed, attrition, cyclone efficiency, circulation rate, bottom ash and other material removal (removal from loop seal), and reactivity of limestone. The model can also be used in optimizing the PSD in the bed by choosing proper cyclone and bottom ash or other ash removal method. This new model, that is, Equation 18 was validated by comparing the curve (n=1) in Figure 11 with results obtained by solving numerically the population balance model.24 All the time constants have clear physical meaning. Attrition time constant describes the characteristic time for particle size reduction. Cyclone time constant describes the characteristic time for a particle to escape as fly ash trough the cyclone. This depends on the combination of cyclone efficiency and the average circulation time interval for a particle to enter the cyclone. Bottom ash time constant describes the rate of particle removal by the operator from the dense bed. The reaction time constant describes reactivity of the limestone used. The total behavior of the system is determined by the combination of these time constants.
However, the application of the model to simulate the observations in the CFBC requires that information about the primary fragmentation behavior of the limestone used is known to estimate the effective PSD of the feed. Furthermore, the experimental bench scale information about the attrition and reactivity behavior of the limestone is required to simulate processes in the CFBC.
Acknowledgments
The research leading to these results has received funding from the European Union Seventh Framework Programme FP7/2012 under grant agreement no 295533 (O2GEN, “Optimization of Oxygen-based CFBC Technology with CO2 capture”) and grant agreement no 239188 (FLEXI BURN CFB, “Development of High Efficiency CFB Technology to Provide Flexible Air/Oxy Operation for Power Plant with CCS”).
Disclosure
The authors report no conflicts of interest in this work.
References
Kunii D, Levenspiel O. Fluidization Engineering. New York: John Wiley & Sons; 1968. | ||
Miccio M, Salatino P. Computations of the performance of fluidized coal combustors. Powder Technol. 1985;43:163–167. | ||
Donsi G, El-Sawi M, Formisani B, Osseo LS. On the simulation of fluidized bed coal combustors. Combust Flame. 1986;64:33–41. | ||
Chirone R, Salatino P, Massimilla L. Secondary fragmentation of char particles during combustion in a fluidized bed. Combust Flame. 1989;77;79–90. | ||
Chirone R, Massimilla L, Salatino P. Comminution of carbon in fluidized bed combustion. Prog Energy Combust Sci. 1991;17:297–326. | ||
Essenhigh RH, Basak AK, Shaw DW, Gangaram G. Evaluation of reactivity functions for coal combustion from particle size analysis in backmix reactors. Combust Flame. 1990;79:307–318. | ||
Rong D, Jin B, Zhang M. A coal combustion model in pressurized fluidized beds. Fluidized Bed Combustion ASME. 1991;3:1177–1181. | ||
Adánez J, de Diego LF, Gayán P, Armesto L, Cabanillas A. A model for prediction of carbon combustion efficiency in circulating fluidized bed combustors. Fuel. 1995;74:1049–1056. | ||
Jensen A, Johnsson JE, Andries J, et al. Formation and reduction of NOx on pressurized fluidized bed combustion of coal. Fuel. 1995;74:1555–1569. | ||
Marban G, Pis JJ, Fuertes AB. Simulation of secondary fragmentation during fluidized bed combustion of char particles. Powder Technol. 1996;89:71–78. | ||
Selçuk N, Değirmenci E, Oymak O. Evaluation of an improved code for the performance of AFBCs. J Inst Energy. 1997;70:31–50. | ||
Chirone R, Marzocchella A, Salatino P, Scala F. Fluidized bed combustion of high-volatile solid fuels: and assessment of char attrition and volatile segregation. Fluidized Bed Combust ASME. 1999;1:185–201. | ||
Adanez J, Gayán P, Grasa G, de Diego LF, Armesto L, Cabanillas A. Circulating fluidized bed combustion in the turbulent regime: modelling of carbon combustion efficiency and sulphur retention. Fuel. 2001;80:1405–1414. | ||
Saastamoinen JJ, Tourunen A, Hämäläinen J, Hyppänen T, Loschkin M, Kettunen A. Analytical solutions for steady and unsteady state particle size distributions in FBC and CFBC boilers for non-breaking char particles. Combust Flame. 2003;132:395–405. | ||
Altindag H, Gogebakan Y, Selçuk N. Sulfur capture for fluidized-bed combustion of high-sulfur content lignites. Appl Energy. 2004;79:403–424. | ||
Blaszczuk A, Leszczynski J, Nowak W. Simulation model of the mass balance in a supercritical circulating fluidized bed combustor. Powder Technol. 2013;246:317–326. | ||
Ray YC, Jiang TS, Jiang TJ. Particle population model for a fluidized bed with attrition. Powder Technol. 1987;52:35–48. | ||
Milioli FE, Foster PJ. A model for particle size distribution and elutriation in fluidized bed. Powder Technol. 1995;83:265–280. | ||
Adánez J, de Diego LF, Gayán P, Armesto L, Cabanillas A. Modelling of sulfur retention in circulating fluidized bed combustors. Fuel. 1996;75:262–270. | ||
Saastamoinen JJ, Shimizu T. Study of attrition of limestone in a fluidized bed by population balance modelling. In: Proceedings of the 10th SCEJ Symposium on Fluidization; Tokyo; 2004:317–324. | ||
Saastamoinen J, Shimizu T. A model of limestone attrition and SO2 capture in a large-scale pressurised fluidized bed combustor. Chem Eng Sci. 2007;62:574–583. | ||
Saastamoinen JJ, Shimizu T. Attrition-enhanced sulfur capture by limestone particles in fluidized beds. Ind Eng Chem Res. 2007;46:1079–1090. | ||
Saastamoinen J, Pikkarainen T, Tourunen A, Räsänen M, Jäntti T. Model of fragmentation of limestone particles during thermal shock and calcination in fluidised beds. Powder Technol. 2008;187:244–251. | ||
Saastamoinen JJ, Shimizu T, Tourunen A. Effect of attrition on particle size distribution and SO2 capture in fluidized bed combustion under high CO2 partial pressure conditions. Chem Eng Sci. 2010;65:550–555. | ||
Montagnaro F, Salatino P, Scala F, Urciuolo M. A population balance model on sorbent in CFB combustors: the influence of particle attrition. Ind Eng Chem Res. 2011;50:9704–9710. | ||
Overturf BW, Kayihan F. Computations for discrete cut particle size distributions in a fluidized bed reactor. Powder Technol. 1979;23:143–147. | ||
Chandran RR, Sutherland DD. Performance simulation of fluidized-bed coal combustors. ACS. 1988;33(2):145–156. | ||
de Souza-Santos ML. Comprehensive modelling and simulation of fluidized bed boilers and gasifiers. Fuel. 1989;68:1507–1521. | ||
Gierse M. Kornhaushalt in zirkulierenden Wirbelschicheten. BWK. 1991;43(10):459–462. | ||
Selçuk N, Oymak O, Değirmenci E. Basic requirement for modelling fluidized beds: fast computation of particle size distributions (PSDs). Powder Technol. 1996;87:269–271. | ||
Wang Q, Luo Z, Li X, Fang M, Ni M, Cen K. A mathematical model for a circulating fluidized bed (CFB) boiler. Energy. 1999;24:633–653. | ||
Wang Q, Luo Z, Ni M, Cen K. Particle population balance model for a circulating fluidized bed boiler. Chem Eng J. 2003;93:121–133. | ||
Hairui Y, Wirsum M, Junfu L, Xianbin X, Guangxi Y. Semi-empirical technique for predicting ash size distribution in CFB boilers. Fuel Process Technol. 2004;85:1403–1414. | ||
Saastamoinen J, Tourunen A, Häsä H, et al. Dynamic reactivity and comminution behaviour of particles in CFBC. Far East J Appl Math. 2006;23:41–71. | ||
Klett C, Hartge EU, Werther J. Time-dependent behaviour of the ash particle size distribution in a circulating fluidized bed system. Proc Combust Inst. 2005;30:2947–2954. | ||
Hartge EU, Klett C, Werther J. Dynamic simulation of the particle size distribution in a circulating fluidized bed combustor. Chem Eng Sci. 2007;62:281–293. | ||
Wu Y, Wang C, Tan Y, Jia L, Anthony EJ. Characterization of ashes from a 100 kWth pilot-scale circulating fluidized bed with oxy-fuel combustion. Appl Energy. 2011;88:2940–2948. | ||
Bade S, Hoffman U. Modelling the simultaneous comminution and chemical reaction in a non-catalytic gas-solid batch reactor. Chem Eng Sci. 1997;52:2715–2728. | ||
Hatzantonis H, Goulas A, Kiparissides C. A comprehensive model for the prediction of particle-size distribution in catalysed olefin polymerization fluidized-bed reactors. Chem Eng Sci. 1998;53:3251–3267. | ||
Chejne F, Hernandez JP. Modelling and simulation of coal gasification process in fluidized bed. Fuel. 2002;81:1687–1702. | ||
Chejne F, Lopera E, Londoño CA. Modelling and simulation of a coal gasification process in pressurized fluidized bed. Fuel. 2011;90:399–411. | ||
Natale G, Galgano A, Di Blasi C. Modeling particle population balances in fluidized-bed wood gasifiers. Biomass Bioenergy. 2014;62: | ||
Marbán G, Fuertes AB, Pis JJ. Calculation of burnoff distributions of char particles in a bubbling fluidized bed reactor by means of batch combustion experiments. Trans IChemE. 1998;76:864–872. | ||
van der Post AJ, Bosgra OH, Boelens G. Modelling the dynamics of fluidization and combustion in a coal-fired FBC. J Powder Bulk Solids Technol. 1981;5:32–37. | ||
Junk KW, Brown RC. A model of coal combustion dynamics in a fluidized bed combustor. Combust Flame. 1993;95:219–228. | ||
Gbor, PK, Jia CQ. Critical evaluation of coupling particle size distribution with the shrinking core model. Chem Eng Sci. 2004;59:1979–1987. | ||
Stecconi P. Solid particles distribution in a fluidized bed with unreacted core reaction and superficial abrasion. Powder Technol. 1982;32:35–43. | ||
Lalak I, Seeber J, Kluger F, Krupka S. Operational experience with high efficiency cyclones: comparison between boiler A and B in the Zeran power plant, Warsaw/Poland. VGB PowerTech. 2003;9:90–94. | ||
Lee YY, Hyppänen T. A coal combustion model for circulating fluidized bed boilers. Fluidized Bed Combustion ASME. 1989;2:753–764. | ||
Hyppänen T, Lee YY, Rainio A. A three-dimensional model for circulating fluidized bed boilers. Fluidized Bed Combustion. ASME. 1991;1:439–448. | ||
Rozelle PL, Pisupati SV, Scaroni AW. Measurement of flyash and bottom ash flow rates from a circulating fluidized bed boiler. Environ Prog. 2004;19:175–182. | ||
Toftegaard MB, Brix J, Jensen PA, Glarborg P, Jensen AD. Oxy-fuel combustion of solid fuels. Prog Energy Combust Sci. 2010;36:581–625. | ||
Buhre BJP, Elliott LK, Sheng CD, Gupta RP, Wall TF. Oxy-fuel combustion technology for coal-fired power technology. Prog Energy Combust Sci. 2005;31:283–307. | ||
Myöhänen K, Hyppänen T, Pikkarainen T, Eriksson T, Hotta A. Near zero CO2 emissions in coal firing with oxy-fuel circulating fluidized bed boiler. Chem Eng Tech. 2009;32:355–363. | ||
Saastamoinen J, Tourunen A, Pikkarainen T, et al. Fluidized bed combustion in high concentrations of O2 and CO2. In: Proceedings of the 19th International Conference on Fluid Bed Combust; Vienna; 2006. Paper No. 49. | ||
Scala F, Chirone R. Combustion of single coal char particle under fluidized bed oxyfiring conditions. Ind Eng Chem Res. 2010;49:11029–11036. | ||
Krzywański J, Czakiert T, Muskała W, Nowak W. Modelling of CO2, CO, SO2, O2 and NOx emissions from the oxy-fuel combustion in a circulating fluidized bed. Fuel Process Technol. 2011;92:590–596. | ||
Jia L, Tan Y, Anthony EJ. Emissions of SO2 and NOx during oxy-fuel CFB combustion tests in a mini-circulating fluidized bed combustion reactor. Energ Fuel. 2010;24:910–915. | ||
Giarcía-Labiano F, Rufas A, de Diego LF, et al. Calcium-based sorbents behaviour during sulphation at oxy-fuel fluidised bed combustion conditions. Fuel. 2011;90:3100–3108. | ||
Takkinen S, Hyppänen T, Saastamoinen J, Pikkarainen T. Experimental and modeling study of sulfur capture by limestone in selected conditions of air-fired and oxy-fuel CFB boilers. Energ Fuel. 2011;25:2968–2979. | ||
Rahiala S, Hyppänen T, Pikkarainen T. Bench-scale and modeling study of sulfur capture by limestone in typical CO2 concentrations and temperatures of fluidized-bed air and oxy-fuel combustion. Energ Fuel. 2013;27:7664–7672. | ||
Snow MJH, Lonwell JP, Sarofim AF. Direct sulfation of calcium carbonate. Ind Eng Chem Res. 1988;27:268–273. | ||
Hajaligol MR, Longwell JP, Sarofim AF. Analysis and modelling of the direct sulfation of calcium carbonate. Ind Eng Chem Res. 1988;27:2203–2210. | ||
Scala F, Salatino P. Flue gas desulfurization under simulated oxyfiring fluidized bed combustion conditions: the influence of limestone attrition and fragmentation. Chem Eng Sci. 2010;65:556–561. | ||
Scala F, Salatino P. Limestone fragmentation and attrition during fluidized bed oxyfiring. Fuel. 2010;89:827–832. | ||
Yao X, Zhang H, Yang H, Liu Q, Wang J, Yue G. An experimental study on the primary fragmentation and attrition of limestones in a fluidized bed. Fuel Process Technol. 2010;91:1119–1124. | ||
Lupiáñez C, Scala F, Salatino P, Romeo LM, Díez LI. Primary fragmentation of limestone under oxy-firing conditions in a bubbling fluidized bed. Fuel Process Technol. 2011;92:1449–1456. | ||
Tourunen A. A Study of Combustion Phenomena in Circulating Fluidized Beds by Developing and Applying Experimental and Modelling Methods for Laboratory-Scale Reactors. PhD Thesis. Lappeenranta: Acta Universitatis Lappeenrantaensis. 2010;419;1–81. | ||
Kato K, Kanbara S, Tajima T, Shibasaki H, Ozawa K, Takarada T. Effect of particle size on elutriation rate constant for a fluidized bed. J Chem Eng Japan. 1987;20:498–504. | ||
Wen CY, Hashinger RF. Elutriation of solid particles from a dense fluidized bed. AIChE J. 1960;6:220–226. | ||
Harris AT, Davidson JF, Thorpe RB. Particle residence time distributions in circulating fluidised beds. Chem Eng Sci. 2003;58:2181–2202. | ||
Saastamoinen JJ. Particle size optimization for SO2 capture by limestone in a circulating fluidized bed. Ind Eng Chem Res. 2007;46:7308–7316. | ||
Ray YC, Jiang TS, Wen CY. Particle attrition phenomena in a fluidized bed. Powder Technol. 1987;49:193–206. |
 © 2016 The Author(s). This work is published by Dove Medical Press Limited, and licensed under a Creative Commons Attribution License.
The full terms of the License are available at http://creativecommons.org/licenses/by/4.0/.
The license permits unrestricted use, distribution, and reproduction in any medium, provided the original author and source are credited.
© 2016 The Author(s). This work is published by Dove Medical Press Limited, and licensed under a Creative Commons Attribution License.
The full terms of the License are available at http://creativecommons.org/licenses/by/4.0/.
The license permits unrestricted use, distribution, and reproduction in any medium, provided the original author and source are credited.