")
Back to Journals » Clinical Epidemiology » Volume 10
Modeling determinants of satisfaction with health care in youth with inflammatory bowel disease: a cross-sectional survey
Authors Timmer A , de Sordi D , Menke E, Peplies J, Claßen M, Koletzko S , Otto-Sobotka F
Received 14 February 2018
Accepted for publication 29 April 2018
Published 25 September 2018 Volume 2018:10 Pages 1289—1305
DOI https://doi.org/10.2147/CLEP.S165554
Checked for plagiarism Yes
Review by Single anonymous peer review
Peer reviewer comments 3
Editor who approved publication: Professor Vera Ehrenstein
Antje Timmer,1,2 Dominik de Sordi,1 Elise Menke,1 Jenny Peplies,2 Martin Claßen,3 Sibylle Koletzko,4 Fabian Otto-Sobotka1
1Division of Epidemiology and Biometry, Medical Faculty, Carl von Ossietzky University, Oldenburg, Germany; 2Epidemiological Methods and Etiology, Leibniz Institute for Prevention Research and Epidemiology – BIPS GmbH, Bremen, Germany; 3Childrens Hospital, Klinikum “Links der Weser“, Bremen, Germany; 4Division of Pediatric Gastroenterology and Hepatology, Dr. von Hauner Children’s Hospital, Ludwig Maximilian University, Munich, Germany
Purpose: Patient satisfaction is frequently used as a health care quality measure despite methodological challenges. By the example of pediatric inflammatory bowel disease (IBD), we assessed factors associated with low satisfaction and examined differences by type of provider.
Patients and methods: In a cross-sectional design, a 32-item questionnaire and global questioning were used to assess satisfaction in patients aged 15–25 years. Determinants of low satisfaction were identified by logistic regression (OR with 95% CI). Separate models were calculated for patient-related variables such as age, socioeconomic status (SES), health status (emotional, somatic, quality of life) or region of residence (step 1), and impact of provider (pediatric specialist, adult specialist, no specialist) (step 2). As secondary analysis, we studied the effect of additional indicators such as waiting time, consultation time, and an IBD Management Quality Index (IMQI) on effect estimates (step 3).
Results: A total of 567 cases were available for analysis (response 48.2%). The strongest predictors of low satisfaction were anxiety symptoms (OR 2.49, CI 1.14 to 5.45). In step 2, not being seen by a specialist (1.89, 1.16 to 3.10) and having been with the new provider for less than 12 months (1.71, 1.03 to 2.83) were associated with low satisfaction. Satisfaction with adult care provider was similar to pediatric care if adjusted for anxiety, health status, and time with provider (0.95, 0.59 to 1.51). Presence of other quality indicators (step 3), waiting time >30 minutes, consultation time <15 minutes, and low IMQI were all associated with low satisfaction. Age, SES, and region of residence were not found to affect satisfaction in any of the models.
Conclusion: Anxiety symptoms were most strongly associated with low patient satisfaction. The relevance of recent provider change and not being seen by a specialist underlines the importance of well-planned transition in this age group.
Keywords: inflammatory bowel disease, patient-reported outcomes, outcomes research, regression analysis, patient satisfaction, health services research
Introduction
Patient satisfaction assessment has been serving a number of purposes in health care policy, quality management, and research for many years.1–6 Motivations to use this measure vary from including patient views in health care decisions, over the more explicit perception of patient satisfaction as a relevant indicator of process quality or an assumed relevance as a mediator of good health outcomes via improved treatment adherence, up to the use of satisfaction as a health outcome in its own right.7–10 In some health systems, patient satisfaction is even used as a main measure for budgeting decisions.11,12 This widespread and varied use is remarkable, as substantial controversy regarding the usefulness and validity of satisfaction assessment remains.7–9,11,13
Issues raised relate not only to the underlying theory, the interdependency of factors contributing to – possibly – causal pathways, but also to the agenda and implications of enquiring about patient satisfaction. All of these will determine how satisfaction is defined and assessed, and whether and how adjustment for various potentially influential factors should be performed. Modeling determinants of satisfaction is reliably unsatisfactory. Satisfaction measures are notoriously skewed toward high values, and factors affecting satisfaction may vary depending on whether high or low satisfaction is of particular interest.14–17 Both phenomena render mean values of satisfaction scores insufficiently informative. Also, only small proportions of variability are usually explained.18–20
The definition of “patient satisfaction with care” is commonly tailored to the specific purpose at hand. Example definitions comprise the concurrence of patient expectations and experience of medical care, or the patient’s perception and reaction to the quality of care received, possibly depending on the respective expectation.1,3,21,22 Typically, patient factors as well as provider and care-related characteristics determine levels of satisfaction, as does their interplay, further complicated by an effect of the methods chosen to assess satisfaction. 9,14,23,24 In consequence, an explicit framework needs to be defined before it is decided which variables are to be included to explain (or adjust for) variability.25 A large number of different potentially relevant determining factors have been examined or discussed in the literature1,18,25–27 (Figure 1). Of these, correlations of age and health status with satisfaction have been shown to be the most consistent.1,4,26,28,29
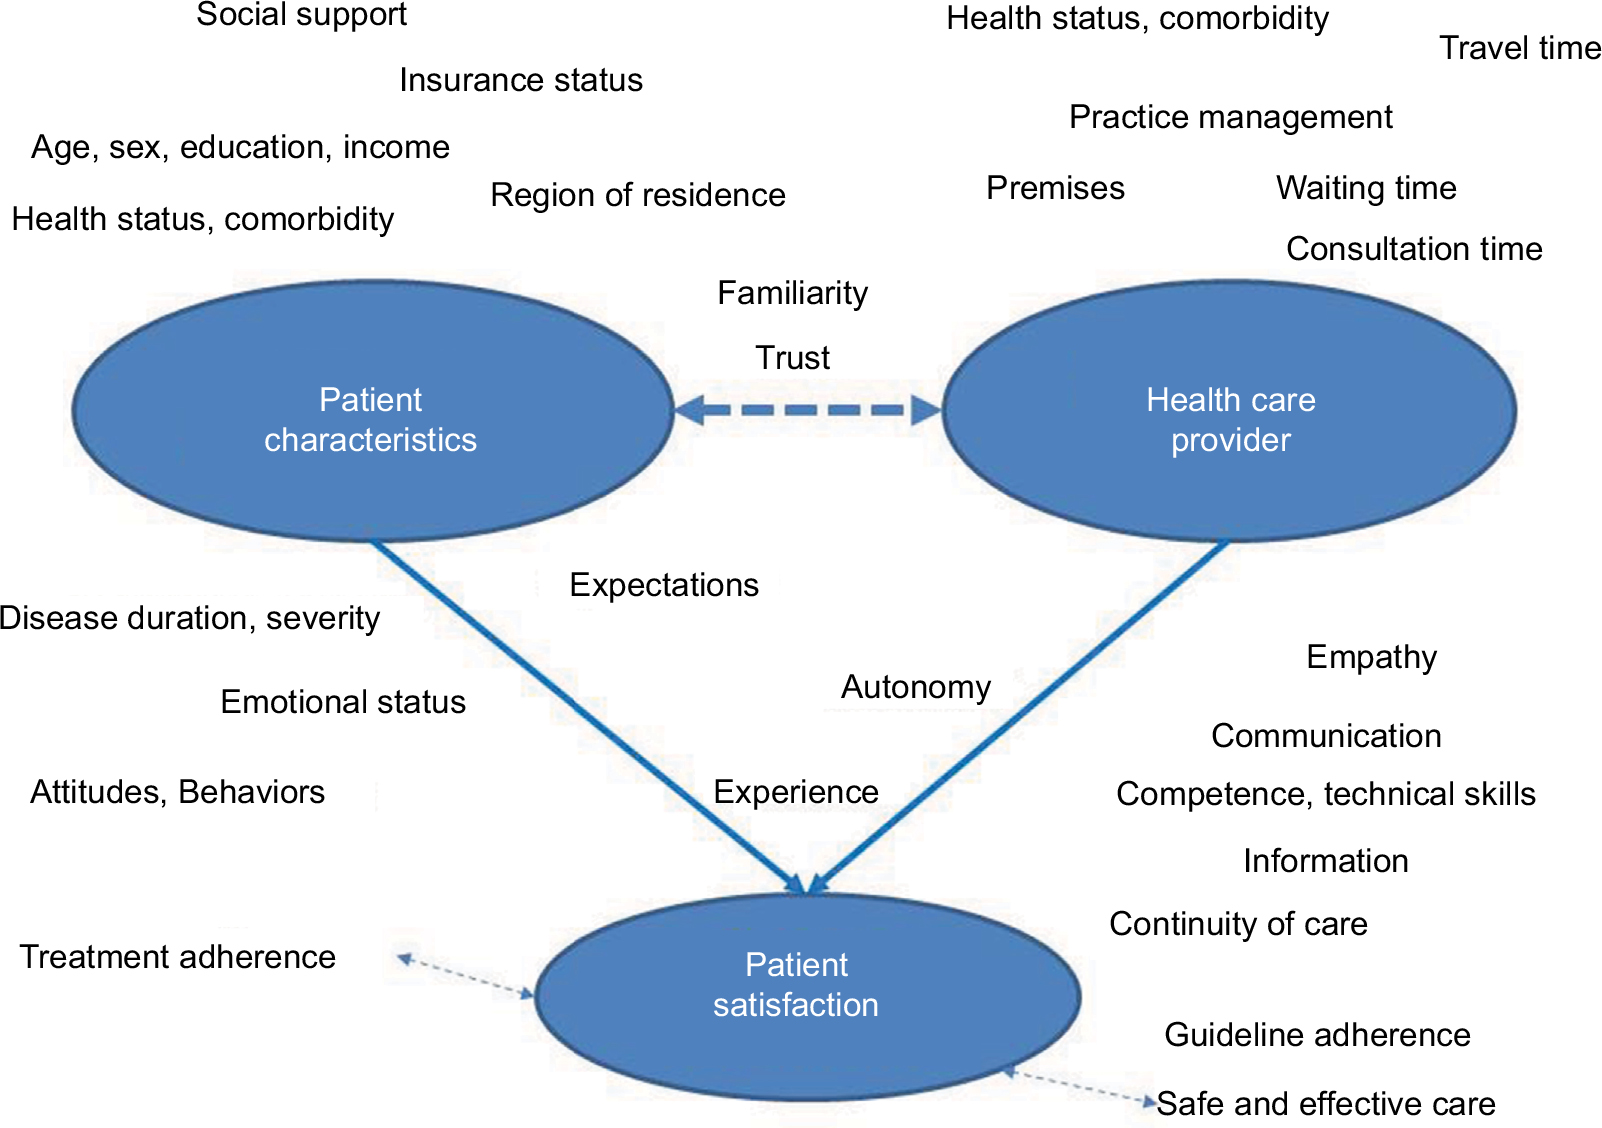 | Figure 1 Potential determinants of satisfaction. |
We have recently performed a survey in young persons with inflammatory bowel disease (IBD) focusing on the quality of care in the transitional age, as perceived by patients.30 The IBDs, such as Crohn’s disease (CD), ulcerative colitis (UC), and colitis unclassified or indeterminate colitis, are chronically relapsing diseases which typically manifest in late adolescence and adulthood, but may occur at any age.31–33 As with other chronic diseases with severe impact on various aspects of life, transition from pediatric to adult care poses specific challenges to patients, parents, and caregivers.34 The main aim of our survey had been descriptive, exploring individual aspects of care which may need improvement in this age group; item-based results have been published. Analysis of levels of our summary satisfaction score was planned to help identify patient groups which are, or feel, disadvantaged. As different health care provider groups are involved and time and mode of transition remain open policy questions, an additional research question imposed itself as to whether there are systematic differences by type of provider (in particular, adult vs pediatric). This question is methodologically challenging, as type of provider is, in this context, directly tied to age. Other factors such as health status or socioeconomic status, known to impact on how patients report satisfaction, have also been shown to have an effect on the timing of transition to adult care.
By our analyses, we wish to increase the awareness of the methodological challenges when dealing with patient satisfaction as a health outcome and help interpretation. Before expanding on issues of regression modeling of satisfaction in a subsequent paper (manuscript in preparation), we present, in this paper, how the selection of covariates varies in relation to the respective framework and research question. Determinants of patient satisfaction have so far not been studied in this patient group, and results will also help to further increase quality of care. The primary question relates to the identification of patient groups who are at increased risk of low satisfaction with care. As a secondary question, we examined the role of the type of provider, in particular comparing pediatric gastroenterologists, adult services gastroenterologists, and no specialists. Special attention was paid to different ways to avoid multicollinearity from age when selecting covariates for modeling satisfaction. Lastly, in an exploratory approach, we examined how additional selected care-related quality indicators change effect estimates.
Patients and methods
Design and setting
Data were derived from a cross-sectional postal survey in patients aged 15–25 years from Germany and Austria, contacted via the trust center of a pediatric clinical IBD registry.35 In this registry, patients with a diagnosis of CD, UC, or colitis unclassified who had received the diagnosis before the age of 18 years and were seen by any of the participating physicians at least once are documented. The registry is organized by pediatric gastroenterologists and depends on voluntary recruitment. It is estimated that around 30% of pediatric IBD patients were covered at the time the survey was started (2011).36 Ascertainment is less for patients with a new diagnosis after the age of 15 years, as those may go straight to adult care and would only be covered if also seen by pediatricians. As the registry was moved to another center and paused recruitment shortly before the survey was started, patients with short duration of disease were underrepresented. Response rate was 48.2% (619 of 1387 questionnaires received). Detailed single-item descriptive results on quality of transitional care, as well as baseline clinical information of patients in this survey have been published.30,37
Outcome parameter: patient satisfaction with care
Patient satisfaction with IBD-related health care was defined as the degree to which aspects of care considered important by the respective patient are met by experience. It was measured by a 2 ×32 item questionnaire previously developed and validated for this purpose.38 In this instrument, respondents rate each of 32 items on a 1–4 scale first for importance, and then for the degree they perceive the respective item as fulfilled. The instrument allows for detailed descriptive analysis per item, using a correlation grid relating importance to experience.30 In addition, a weighted summary score can be calculated, using perceived importance to weigh experience, and resulting in values between 0 (none experienced as fulfilled) and 1 (all excellent). The individual items had been derived from a qualitative patient survey. Relevant domains include provider–patient communication (courtesy, information, patient autonomy), accessibility, organization, premises, competence, and continuity of care. An ad hoc English translation and directions for calculation are available as a free-access online supplement.38
Satisfaction with the care provider was also assessed using a direct global question with a 4-point answer scale (“How satisfied have you been, overall, with the care by the physician mainly in charge of your IBD during the last year?” with answer categories very satisfied, satisfied, not satisfied, and very unsatisfied). For further analyses, the lowest categories (not, not at all) were collapsed to “not or not at all satisfied” (low satisfaction).
Determinants of satisfaction
General framework
The stepped up assessment of potential determinants of satisfaction is illustrated in Figure 2. In our approach, various factors relating to patient experience are conceptualized as innate aspects of patient satisfaction with care, such as the experience of empathy and respect of patient autonomy (bright blue-shaded ellipsoid). Separate models were restricted to patient-related factors in order to identify groups at higher risk of low satisfaction (step 1), used patient-related factors for case mix adjustment as well as non-modifiable provider-related factors when examining differences by provider (step 2), and explored the additional effect of quality indicators not incorporated in the satisfaction score in secondary analysis (step 3). Age and collinearity were of particular concern in step 2 due to the close relationship to the type of provider (pediatric vs adult).
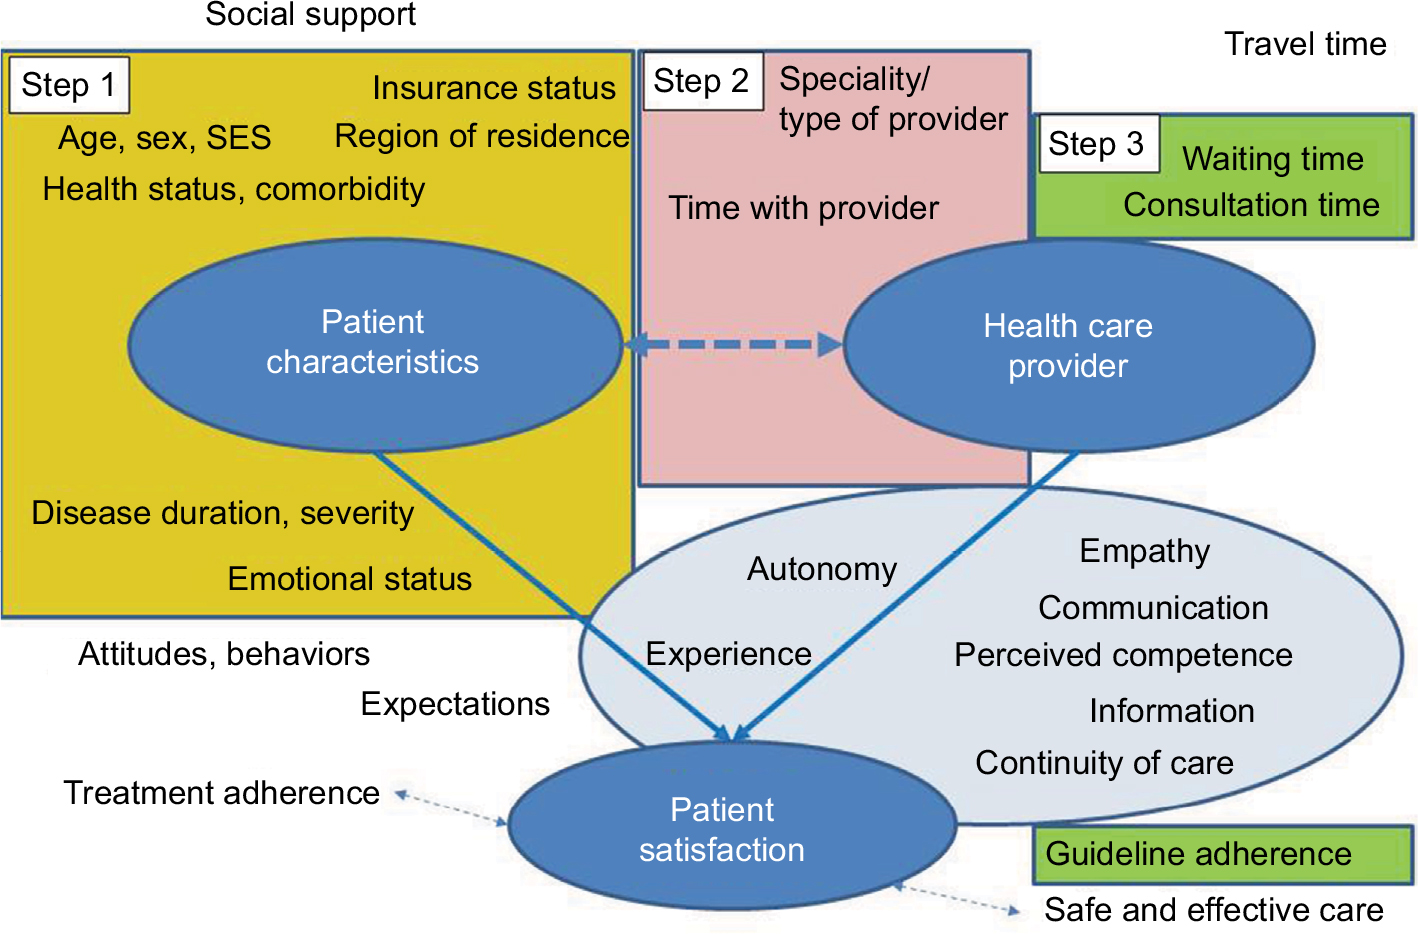 | Figure 2 Stepped up approach to examined determinants of satisfaction. Notes: Multivariate modeling/covariate selection: Step 1 (yellow): patient characteristics. Step 2 (pink) role of provider. Step 3 (green): additional quality indicators. Light blue: innate aspects of satisfaction (measured by satisfaction score). Abbreviation: SES, socioeconomic status. |
Patient-related characteristics
Sociodemographic variables included sex, current age (years), socioeconomic status (SES) of parents (lowest quintile, middle quintiles, highest quintile), region of residence within Germany (7 categories) and Austria, smoking status (current, former, none), occupational status, type of school attended, and health insurance (statutory only, mixed/supplementary, private insurance). Parental SES was calculated using the Winkler index which is based on level of education, current occupation, and household income of the parents.39,40 Regions of residence were categorized in analogy to Nielsen marketing areas based on states or groups of neighboring states. For type of school, we combined the information on current type of school for those still at school with type of school graduated for those who left. Disease-related variables included type of disease (CD, UC, unclear IBD), age of onset (years), disease duration (years), course during last year (no relapse, 1 relapse, >1 relapse/chronic activity), current disease activity (remission, mild activity, moderate to high activity), depressive symptoms and anxiety symptoms. Of note, unclear IBD may include colitis unclassified, indeterminate colitis, or any IBD where survey information was not consistent, or where patients were not sure.
Age of onset and disease duration were used as categories (age of onset: 0–5, 6–9, 10–11, 12–13, 14+ years; disease duration: up to 2 years [=incident], 2–5 years, and longer).
Current disease activity was assessed using the survey-based Crohn’s Disease Activity Index (S-CDAI) and Colitis Activity Index (S-CAI), which allow for categorization into remission (S-CDAI <150, S-CAI <4), mild (S-CDAI =150–220; S-CAI 4–6), moderate, and severe activity.41 As severe activity is very rare in ambulatory patients, this category was collapsed with moderate activity (S-CDAI >220, S-CAI >6). General health status was assessed as disease-specific quality of life, using the Short Inflammatory Bowel Disease Questionnaire (SIBDQ).42 Lastly, the Hospital Anxiety and Depression Scale served to evaluate evidence of depression or anxiety, with scores >11 indicating symptoms of anxiety or depression, respectively.43,44 All disease-related instruments are validated for use in German patients with chronic disease, and all have previously been used in patients with IBD, although mostly restricted to adult patients (18+ years).
Provider characteristics
The IBD provider was defined as the physician currently in charge of IBD-related medical decisions, and was categorized as pediatric gastroenterologist (PGE), adult care gastroenterologist (GE), and other (non-specialist or other specialty). Time with provider was collected by asking patients how long they had been under care with the current IBD provider (less than 1 month, 1 to <3 months, 3–12 months, >12 months). It was dichotomized for analysis following explorative analysis to up to 12 months vs >12 months, as patients in stable remission may have long visit intervals of 6–12 months.
Indicators of quality of care
Several patient-derived items indicating quality of care had been included in the patient questionnaire based on guidelines published in the literature (eg, Leung et al and Sandhu et al45,46), complemented by advice from clinical and patient experts, but restricted to information deemed to be available to patients. As proxies for quality of care not yet included as items in the satisfaction score, the following indicators were available:
A:Timing/logistics
- Usual time in waiting room (none, <15, <30, <60, 60+ minutes; collapsed to ±30 minutes)
- Usual time with IBD doctor/in consultation room (<10, <15, <20, <30, 30+ minutes; collapsed to ±15 minutes)
Waiting and consultation times were also available on a continuous scale for the most recent visit.
B:Diagnosis and treatment
- Having seen a doctor at least once during preceding 12 months (yes, no)
- Seeing the IBD doctor on a regular basis even if well (at least every 6 months) (yes, no)
- Having had full diagnostic workup (upper and lower endoscopy, ever) if CD or unclear IBD (yes, no)
- Having had colonoscopy if UC (ever, never)
- Having seen an ophthalmologist during preceding 12 months if currently on corticosteroids (yes, no)
- Using maintenance therapy (aminosalicylates, sulfasalazine, immunosuppression, biologicals, or rectal) if UC in remission (yes, no)
- Having seen a psychologist during preceding 12 months if HADS >11 for depression or HADS >11 for anxiety (yes, no)
- Having seen a nutritionist if BMI <18 kg/m2 or BMI >25 kg/m2 (yes, no)
As most of these items apply to various subgroups of patients only, an ad hoc IBD Management Quality Index (IMQI) was generated by dividing the number of fulfilled items by the number of applicable items per patient. This resulted in a score spanning from 0 (no item fulfilled) to 1 (all applicable items fulfilled). Good quality was arbitrarily assumed for a score >0.9 and low quality for <0.70.
Statistical analysis
Descriptive analyses
Baseline characteristics of participants are described by age group, using proportions for categorical variables, and median and interquartile range for continuous variables. The satisfaction summary score was calculated for patients who completed at least 75% of the items. To explore the distribution of the score and determine relevant thresholds, scores were graphically displayed by global question categories (very satisfied, satisfied, [very] unsatisfied with IBD provider). We also show the distribution of the score by age groups and disease activity categories. For all potential influential factors, the distribution by tertiles of satisfaction is shown in a descriptive table Table S1).
Modeling determinants of satisfaction
In all models, the dichotomized summary satisfaction score was used as the dependent variable, with low satisfaction representing the relevant outcome.
Step 1: Patient-related factors
Following exploration of all potentially relevant factors in simple logistic regression, we calculated a full model based on pre-defined relevant patient-related factors as shown in Figure 1. We did not use rare characteristics (prevalence < 5%) in order to cut down on non-conclusive estimates. In addition, to avoid problems from multicollinearity, from groups of variables known to be closely correlated, we selected those variables considered to give the most comprehensive information. Specifically, we did not include course of disease and disease activity but used only quality of life as a measure of health status. This was based on the observation that disease activity only impacted on satisfaction if severely compromised thus was considered less sensitive and informative in an ambulatory, that is, reasonably well, sample. We also discarded type of school attended as a measure of SES, while keeping parental SES and current occupational status of youth. Lastly, to untie the close relationship between age of onset of disease and disease duration, we combined these two variables by separating the category “onset of disease at age 14 years and older” into prevalent and incident cases (ie, cases with disease duration <2 years). (Owing to the study inclusion criteria, there were no incident cases for onset before age 14 years.) Age (in years) was included as a continuous variable. For a parsimonious model, only those variables which contributed significantly (ie, p<0.05) to the model were kept. Model built was manually stepwise back and forth, based on strength of association and precision of estimates.
Step 2: Role of provider
We explored different approaches to examine effects by provider while adjusting for age:
- Specialist vs non-specialist approach: Using the full sample, pediatric and adult services gastroenterologist were combined to a “specialist” category, and served as a reference for the effect of not being under specialist care (“other”). Age was included as a continuous variable. This approach is simplistic in that differences between adult and pediatric care specialists will not be assessed.
- Combination variable approach: Instead of including age and provider as separate variables, a combination variable “age appropriate provider” was constructed for age (<16, 16 to <18, 18 to < 21, 21+ years) and type of provider. Categories with <50 cases were combined with the neighboring classes. This resulted in the following six categories: age <16 years, pediatric gastroenterologist (PGE); age 16–17 years, PGE; age 18+ years, PGE; age 16–20 years, GE; age 21+ years, GE; any age, no specialist.
- Subgroup approach: Type of provider (3 categories, with PGE as reference) and age (as a continuous variable) were used in the subgroup of 16–20-year olds.
- Post hoc solution: As age was not shown to be a relevant confounder of satisfaction with provider.
All models examining differences by type of provider were first adjusted for only those patient-related factors identified to be associated with patient satisfaction in step I (Model 1). Time with provider was then included as a potential provider-related confounder, as were selected additional patient-related factors (ie, age, health status, SES), but were dropped if not contributing significantly (Model 2).
Step 3: Quality indicators explaining differences in satisfaction with provider
As a secondary analysis, quality indicators were introduced into the model derived in step 2. Variables related to practice management were examined for interaction (time in waiting room by time with physician) by including an interaction term into an exploratory model. IBD treatment-related indicators were included as a summary score (IMQI, as defined earlier). To examine the threshold of quality impairment impacting on patient satisfaction, several approaches were tried, ie, using IMQI as a continuous measure, or three categories as defined earlier. The resulting model was adjusted for relevant patient-related factors and non-modifiable provider characteristics, as identified in steps 1 and 2.
We considered OR <0.5 and OR >2 to indicate strong associations. Statistical significance was assumed for p<0.05, or 95% CI excluding 1. All analyses were performed using SAS 9.4 or SPSS v 24.
Data security, ethical considerations
Pseudonymized data were used for data analysis. All personal data remained with the registry trust center, with no access for study personnel. The project was submitted to the ethics committee of the University of Bremen prior to the postal survey (date of approval June 1, 2011). Written informed consent was secured after detailed written information by all participants and their guardians if aged below 18 years.
Results
Of 619 questionnaires received, 14 were excluded due to incomplete information on age, sex, and/or IBD, leaving a sample of 605 for analysis. Baseline characteristics and current disease stage by current age group are shown in Table 1. The disease was currently in remission in 74.2% (406 cases), and mildly active in another 9.9% (54 cases). Three hundred and six (54.1%) had been in remission over the preceding 12 months, and 128 (22.6%) had recent chronically active disease. Other notable findings included a relatively low prevalence of comorbid affective disease – overall 15 persons (2.7%) with depressive symptoms and 36 with anxiety symptoms (6.5%) (8 had both).
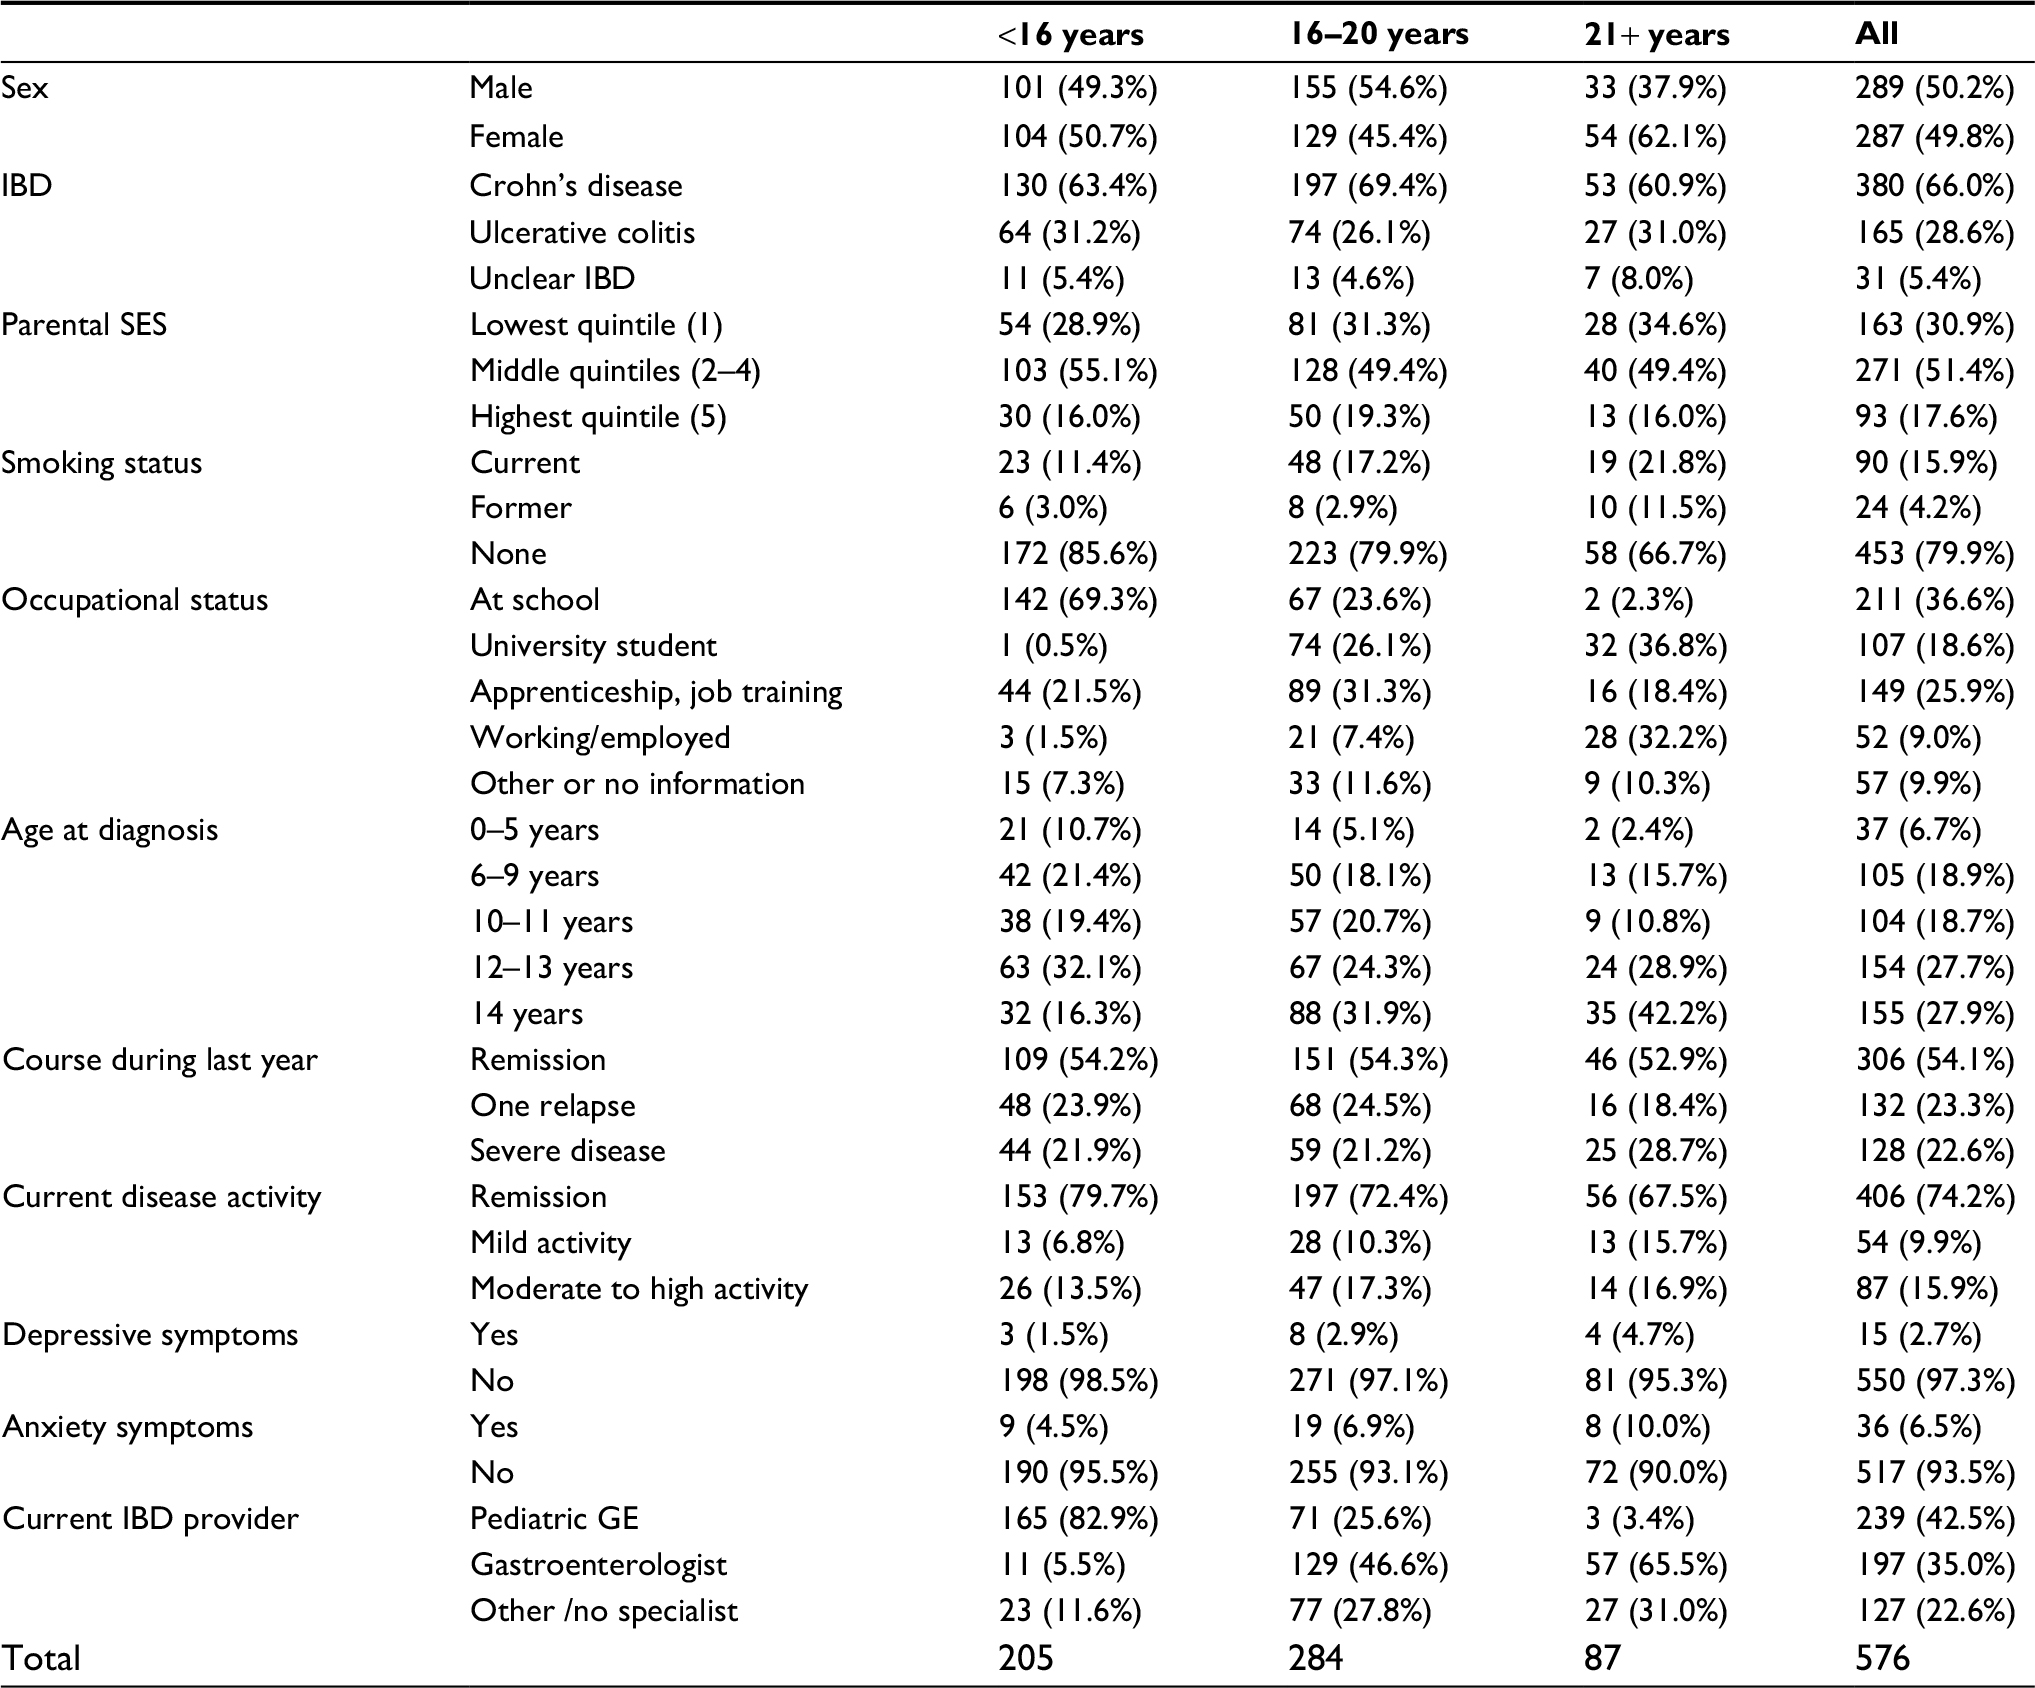 | Table 1 Patient characteristics by age group (age at survey) Abbreviations: SES, socioeconomic status; GE, gastroenterologist; IBD, inflammatory bowel disease. |
Overall satisfaction with IBD care
On global questioning, there were 313 (56.9%) persons very satisfied with their IBD care provider, 281 (39.0%) satisfied, 17 (2.9%) not satisfied, and 11 (1.9%) not at all satisfied. The satisfaction summary score could be calculated for 576 persons (95.2% of respondents). Scores ranged from 0.28 to 0.99, with a mean of 0.78 (95% CI 0.77 to 0.79) and median of 0.80 (Interquartile range [IQR] 0.71 to 0.88). Thresholds for tertiles were calculated as 0.75 (lower) and 0.85 (upper).
The distribution of the summary score by global satisfaction categories (single-question enquiry) is shown in Figure 3. Median values were 0.85 (IQR 0.77 to 0.91) in highly satisfied persons, 0.75 (IQR 0.67 to 0.82) in those reporting being satisfied, and 0.61 (0.52 to 0.75) for those not (or not at all) satisfied. Corresponding mean values with 95% CI were 0.83 (0.82 to 0.84), 0.73 (0.72 to 0.75), and 0.63 (0.58 to 0.68). Based on these results, we assume a difference of 0.10 to be perceived as relevant, a score <0.75 to indicate low, and a score >0.85 to indicate very high satisfaction.
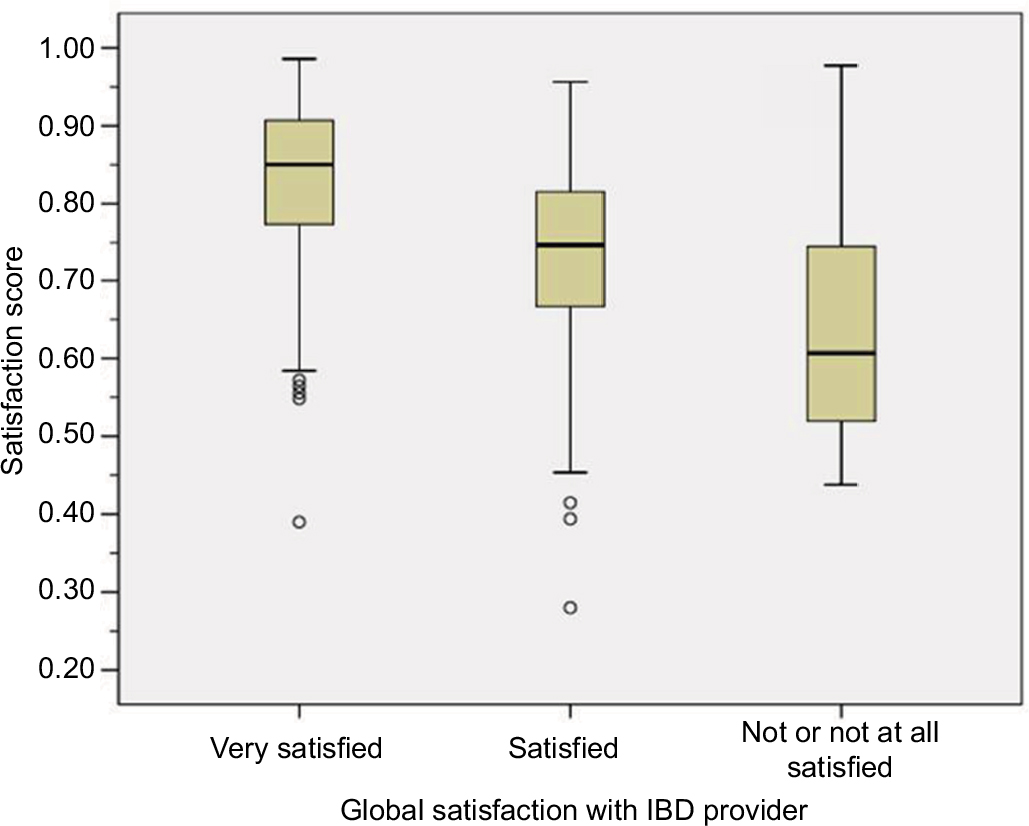 | Figure 3 Satisfaction score by global satisfaction question categories. Abbreviation: IBD, inflammatory bowel disease. |
Factors associated with low satisfaction
The distribution of potential covariates by degree of satisfaction is illustrated in Table S1. Satisfaction scores graphed by age groups and disease activity showed slightly decreased median scores for age groups >18 years and moderate to high disease activity (Figure 4).
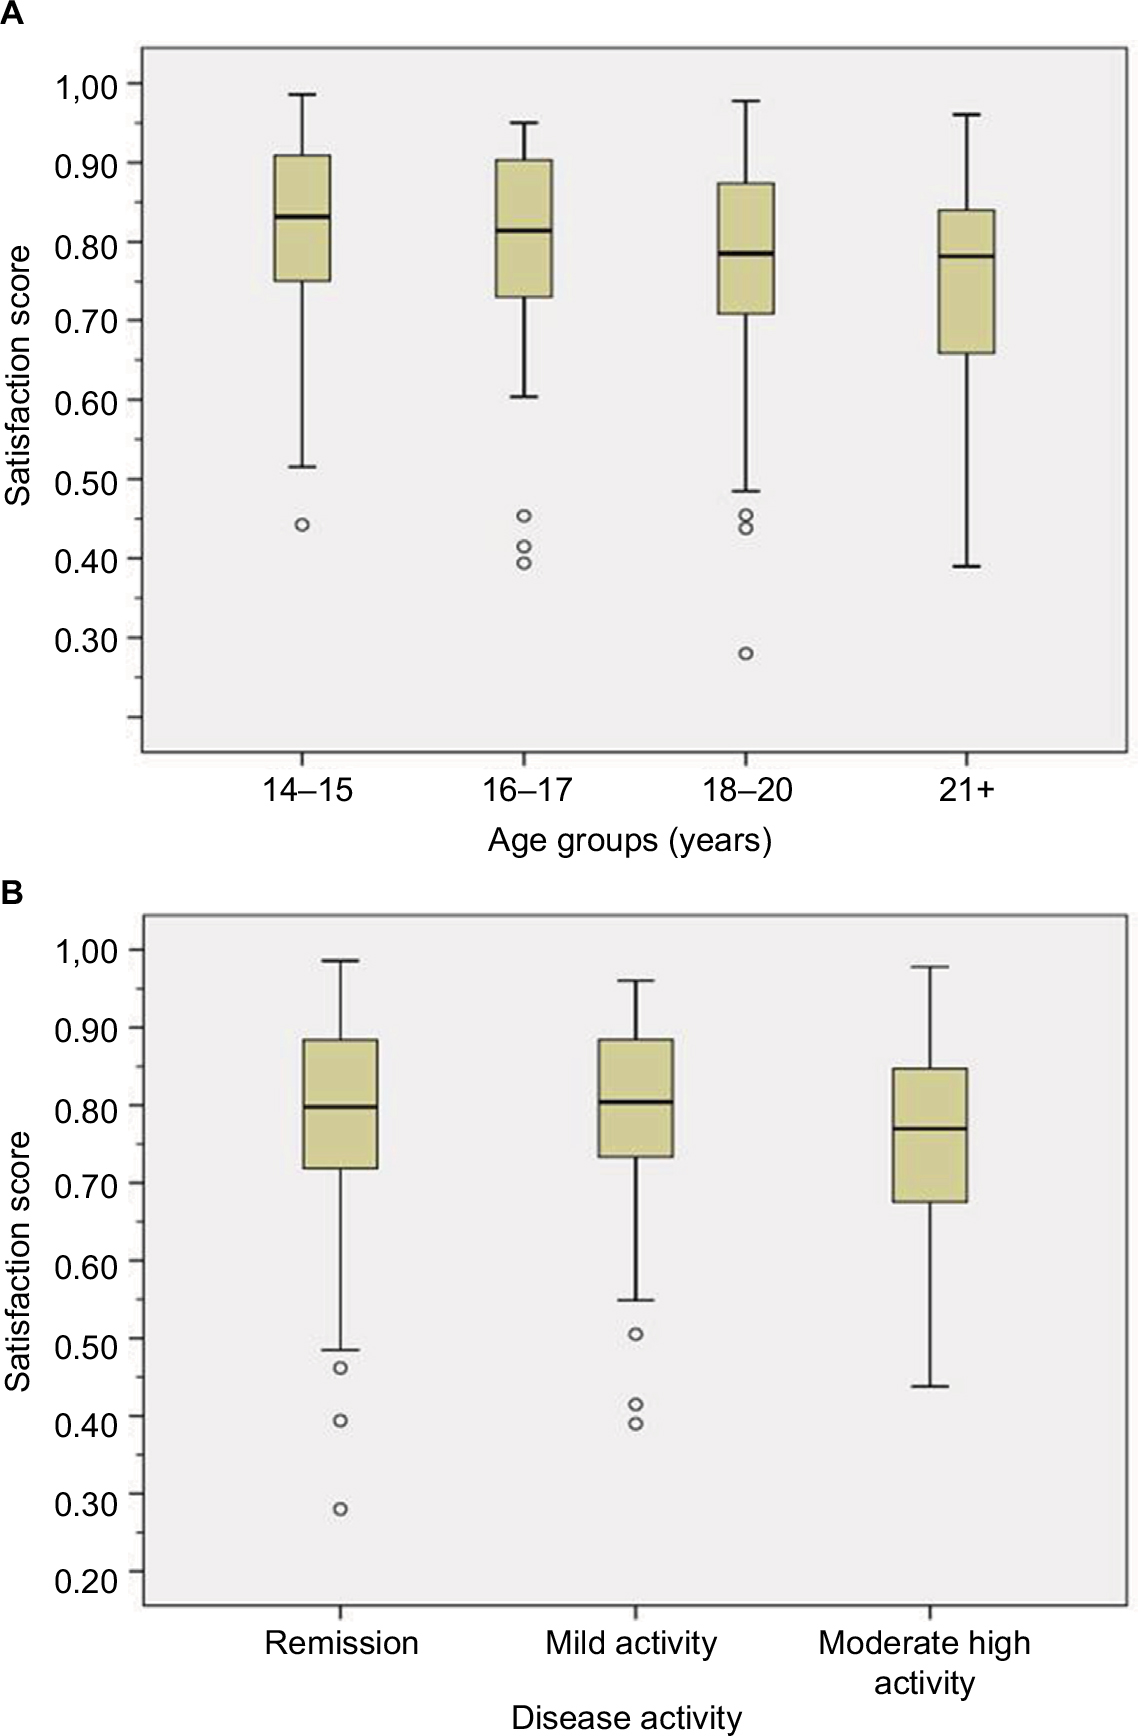 | Figure 4 Satisfaction scores by selected subgroups: (A) age group and (B) disease activity. |
Step 1: Patient-related factors
Bivariate analysis
Symptoms of depression and anxiety as identified by HADS both showed strong positive ORs for low satisfaction, but CIs were wide for depressive symptoms (Table 2). In contrast, patients with shorter disease duration were less likely to be not satisfied. Of the variables describing health status, there were mostly positive associations for the lowest categories only. For example, chronic active disease during the preceding year had an OR of 1.9 (CI 1.25 to 2.90) as compared to stable remission. In contrast, one relapse during preceding year as compared to no relapse was not shown to impact relevantly on patient satisfaction, nor was mild current activity vs remission.
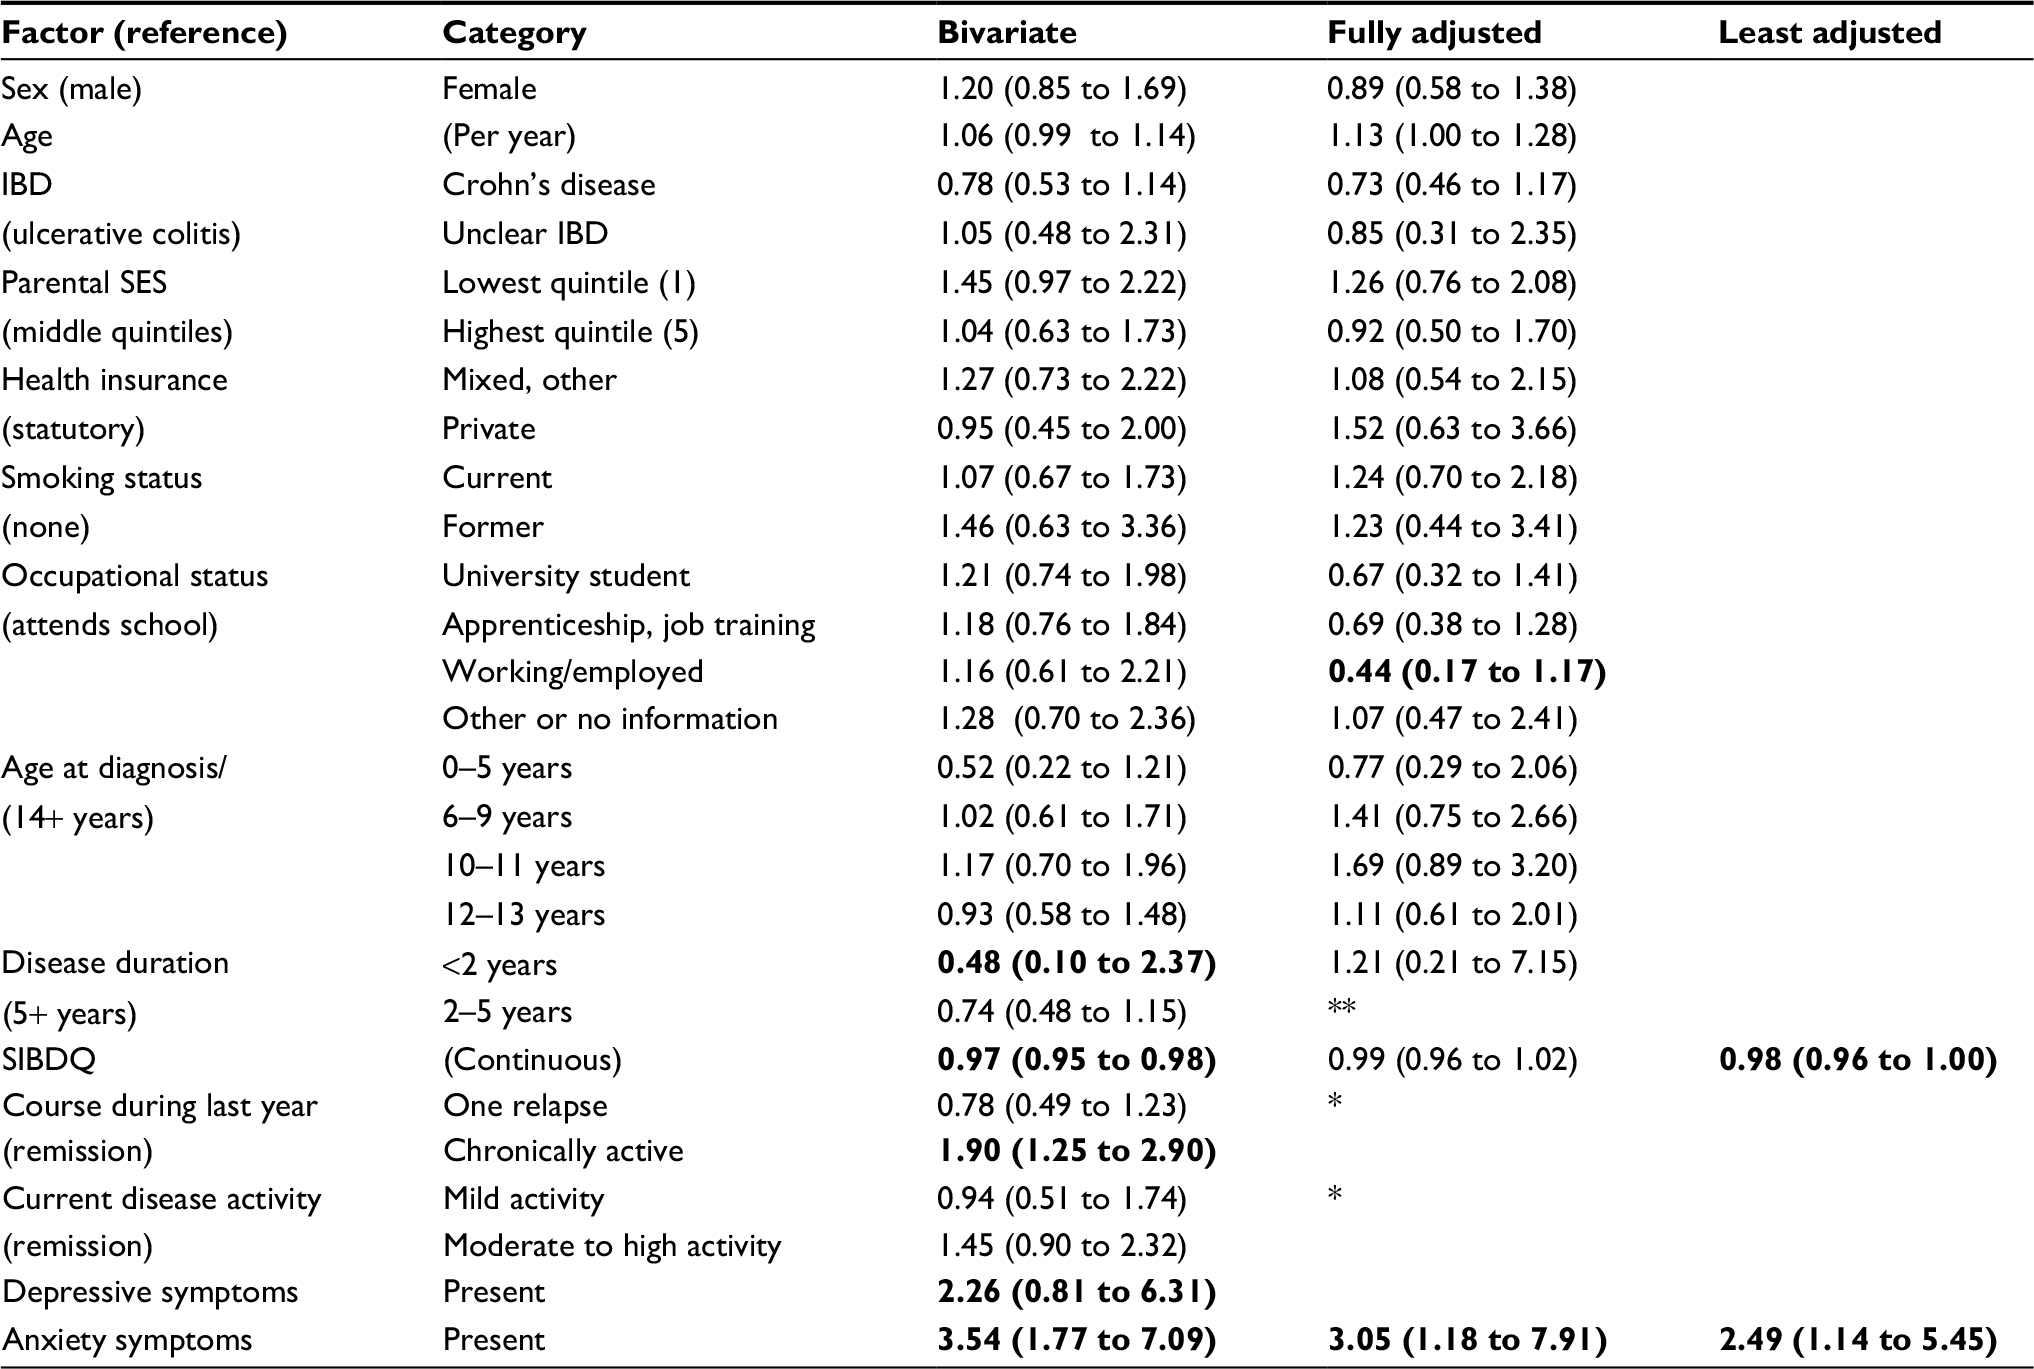 | Table 2 Factors associated with low satisfaction (step 1: patient-related potential determinants) Note: Results from logistic regression, OR (95% CI). *not included in multivariate analysis due to close correlation with health status; **category collapsed with neighboring category for multivariate analysis due to small numbers. Bold values indicate strong associations (OR <0.5 or >2.0) or significant contribution. Abbreviations: IBD, inflammatory bowel disease; SES, socioeconomic status; SIBDQ, Short Inflammatory Bowel Disease Questionnaire. |
On a continuous scale, higher SIBDQ was significantly associated with higher satisfaction. No other covariates were strongly or significantly associated with low satisfaction.
Multivariate analysis
Following adjustment in multivariate analysis, the OR for anxiety symptoms slightly decreased but this association remained strong and significant (OR 2.49 [1.14 to 5.45] [Table 2]). Health status as measured by SIBDQ was also relevant. None of the other characteristics were conclusively shown to be associated with low satisfaction in this model.
Step 2: Relevance of the provider
Bivariate analyses
Not seeing a specialist as compared to either a pediatric or adult care gastroenterologist was a strong determinant of low satisfaction (Table 3, step 2a). Another strong predictor of low satisfaction was short time with the respective physician. Compared to being with the physician for more than 12 months, OR was 2.33 (1.51 to 3.61) if there had been a provider change within the preceding 12 years.
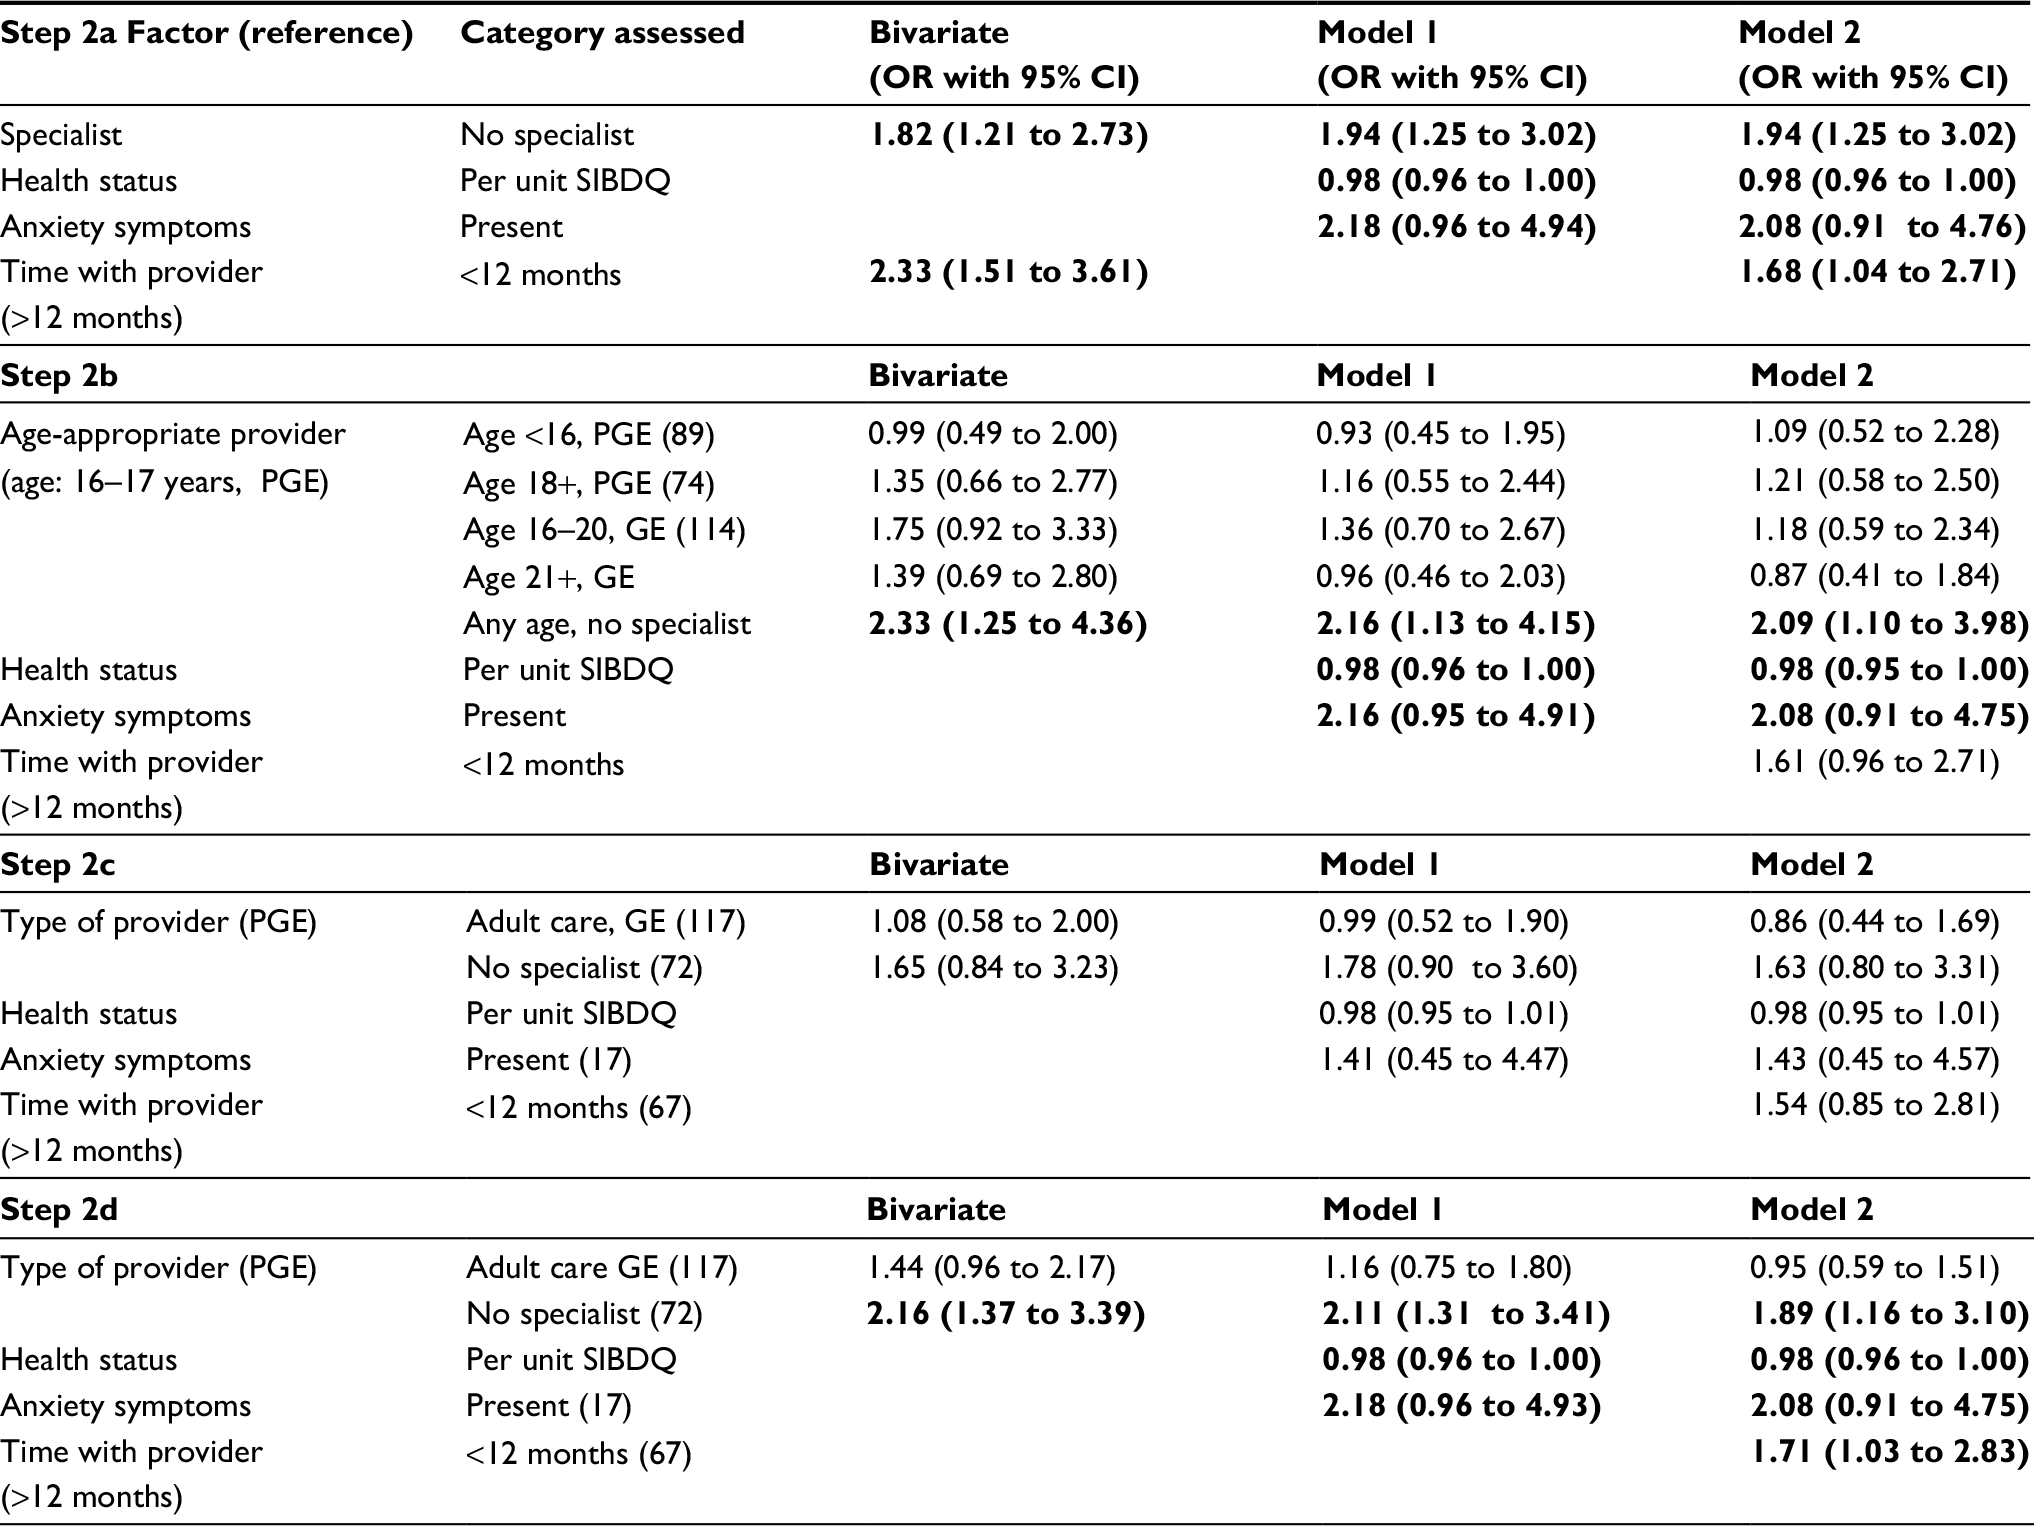 | Table 3 Factors associated with low satisfaction (step 2: role of provider) Notes: Step 2a: full sample; not relevant: parental SES, age. Step 2b: full sample; not relevant: SES, age not included. Step 2c: subgroup age 16–20 years; not relevant: parental SES, age. Step 2d: as 2c, but using full sample. Model 1: controlled for SIBDQ and anxiety. Model 2: additional covariates (only if statistically significant). Bold values indicate strong associations (OR <0.5 or >2.0) or significant contributors. Abbreviations: PGE, pediatric gastroenterologist; GE, gastroenterologist; SES, socioeconomic status; SIBDQ, Short Inflammatory Bowel Disease Questionnaire. |
In the more detailed categorization as age-appropriate care, using PGE caring for 16–17-year olds as a reference, the strong association with a non-specialist was confirmed (step 2b). Within those attending specialists, small effects of being treated by GE or being in the oldest PGE treated group possibly resulted in slightly lower satisfaction. Also, subgroup analysis restricted to the 16–20-year-old group did not render conclusive results due to wide confidence intervals (step 2c).
Multivariate analyses
Adjustment for quality of life and anxiety symptoms did not substantially change point estimates for the association of non-specialist care with low satisfaction in any of the three approaches. Estimates for GE treated age groups and the oldest PGE age group decreased in the more adjusted models (Table 3).
We did not find convincing evidence for an effect of age across the various approaches which would have necessitated simplification of provider categories as in step 2a or use overly differentiating categories as in step 2b. Therefore, the subgroup approach (step 2c) was replicated on the full sample (all age groups) to render the most meaningful model. Here, being treated by an adult GE had no effect on low satisfaction, while associations of poorer health status, being treated by a non-specialist, and short time with provider were significant. Anxiety symptoms showed a strong association in this model (OR 2.08), but the CI included 1.0.
Step 3: Secondary exploratory analysis: effect of additional quality indicators
Usual waiting time was less than 15 minutes in 202 (34.8%) patients. No waiting time (5.1%) and occasional waiting times exceeding 60 minutes (8.8%) were less common. Consultation times were rarely less than 10 minutes (6.6%); in 21.3%, consultations exceeded 30 minutes. For the most recent visit, the median was 15 minutes for both waiting time (IQR 10 to 30 minutes) and time with physician (IQR 15 to 25 minutes).
For the quality score, IMQI, a median of 3 of 8 items were applicable (range 3 to 6, IQR 3 to 4). Resulting scores ranged from 0 to 1, with a median of 0.75 and an IQR of 0.6 to 1.0. Two hundred thirty-two (38.3%) scores showed complete fulfilment (1.0).
Bivariate analysis
Crude estimates for the various quality indicators are presented in Table 4. Time in waiting room of more than 30 minutes was strongly predictive of low satisfaction, while any consultation time longer than 15 minutes was strongly protective, including a dose trend from 15 to 30 minutes to more than 30 minutes. Also, a low IMQI score showed a strong association with low satisfaction.
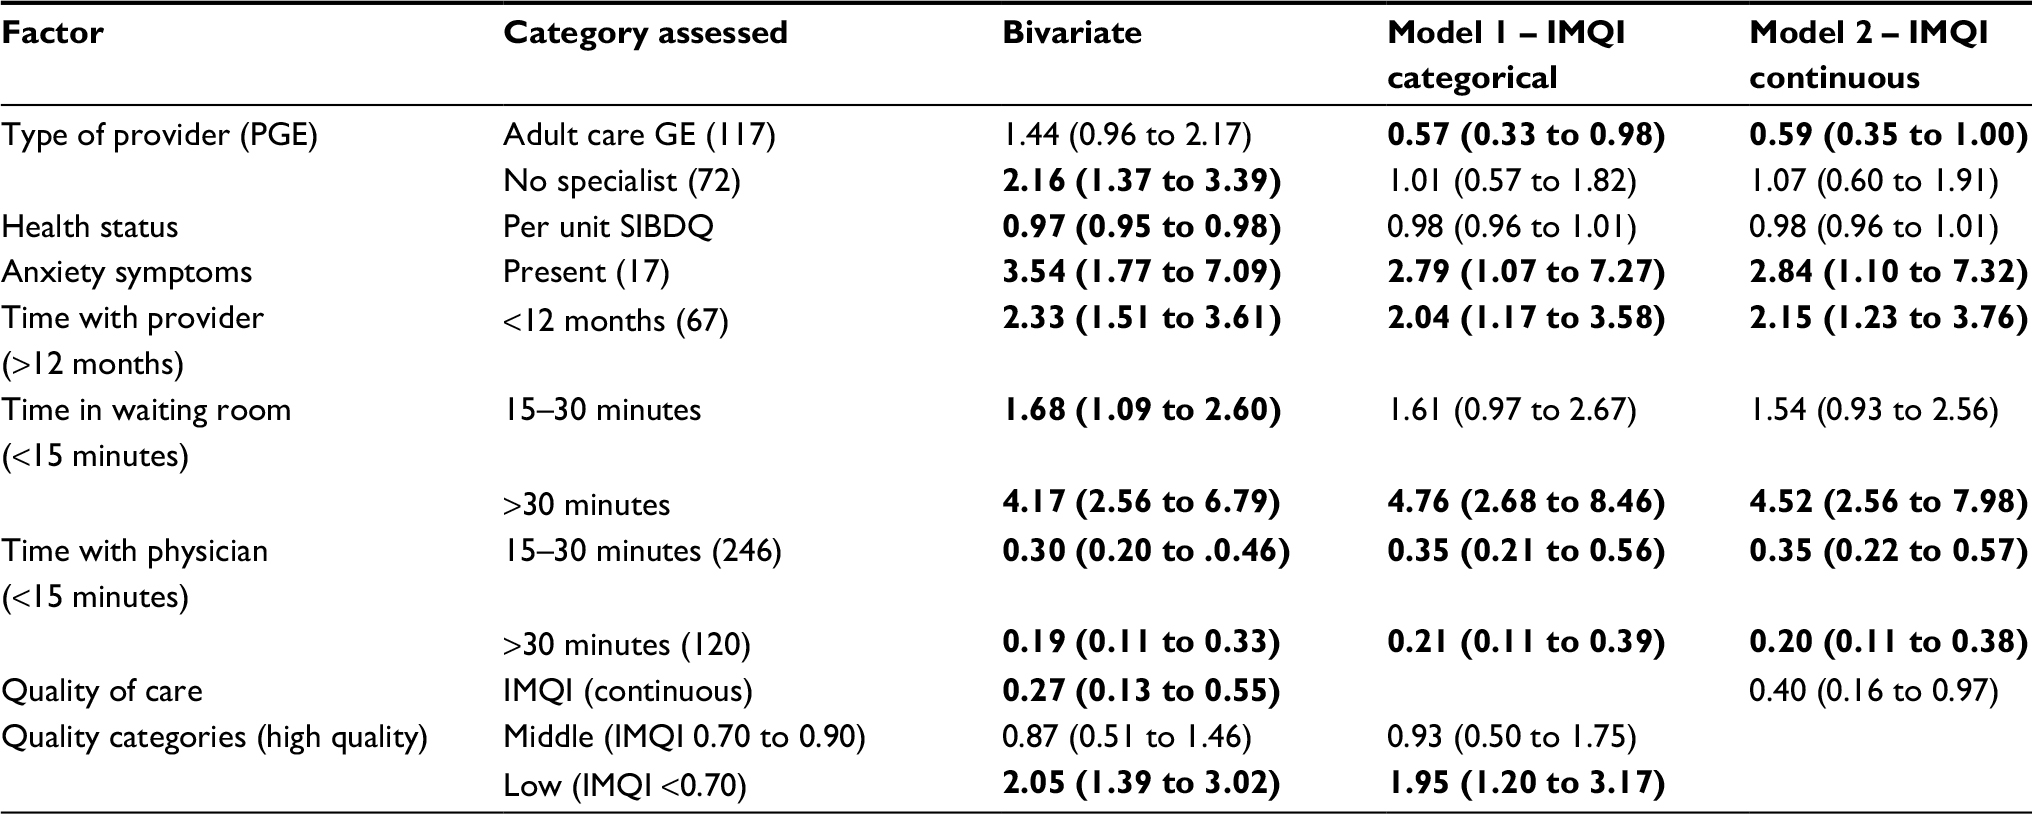 | Table 4 Factors associated with low satisfaction (step 3: effect of quality indicators on provider estimates) Note: Bold values indicate strong associations (OR <0.5 or OR >2.0) or significant contributors. Abbreviations: PGE, pediatric gastroenterologist; GE, gastroenterologist; IBD, inflammatory bowel disease; SIBDQ, Short Inflammatory Bowel Disease Questionnaire; IMQI, IBD Management Quality Index. |
Multivariate analysis
In the multivariate model, the strong associations of waiting times of more than 30 minutes and consultation times of less than 15 minutes with low satisfaction were confirmed. There was no indication for interaction between these two variables (not shown). Less than perfect IMQI of more than 0.70 was well tolerated without impact on patient satisfaction, but low IMQI (<0.70) predicted low satisfaction.
The introduction of these quality indicators did not impact on estimates for patient-related factors (quality of life and anxiety symptoms) or non-modifiable provider characteristics (time with provider) (Table 4). In contrast, effects of type of provider were strongly affected by confounder adjustment: The strong positive association of being cared for by a non-specialist disappeared, while the null effect (or weak positive association) of being with an adult care gastroenterologist changed to a negative association with low satisfaction, ie, became a protective factor.
Discussion
Our results confirm the limited usefulness of direct single-question global enquiry into patient satisfaction with health care, in particular with the health care provider: Only 5% were not satisfied with their current IBD provider, according to this simple question. In contrast, a more-dimensional indirect instrument which addresses specific aspects of patient experience and applies weights based on individual patient preferences showed a substantially wider variability, resulting in a more differentiated picture. The mean value of 0.80 is comparable to those reported from large studies or studies on satisfaction in IBD using other satisfaction assessment instruments.23,24,47 As a side note, we were now able to determine relevant thresholds discriminating low and high satisfaction, which we had failed to do in our previous validation study due to insufficient sample size.38
The 15–25-year age group we examined presents a group well-known for low satisfaction relative to both younger and older age groups.26,27,48 This is reflected in the, albeit small, down-step in patient satisfaction as shown in Figure 4. We had taken particular diligence in examining various ways of dealing with this variable, including sub-group analysis and application of combination terms. The minor role of age as a confounder in any of the analyses was not expected. A possible explanation is the narrow age range. Also, age distribution was skewed and may not have been captured well in the models applied.
“Gender” effects were not observed. This is in accordance with other studies. We also did not identify a convincing effect of “socioeconomic status”, applying different proxies. Several studies have found education and income to impact on how patients experience and value quality of care. As with age, a possible explanation for the lack of effect shown in our analysis is an overly homogenous patient group. The postal survey was based on a clinical specialist registry, with a response rate of just below 50%. Non-responder analysis was not possible due to logistic reasons, but based on data from the literature, patients with lower SES and those who have not been under regular pediatric specialist care are expected to be underrepresented.1,49,50
Reassuringly, there is, as yet, no indication of major differences in specialist care quality between different regions in our data (Table S1). We had previously shown substantial regional differences in the quality of primary care in IBD (diagnostic delay), with markedly lower performance in the North East.36 Using Nielsen areas is a very crude measure, and only very marked differences would have been discovered. We have since performed a study in a younger age group incorporating exact residence data which will enable us to discover small area variation.51
Of the health-related factors, “anxiety symptoms” were the strongest determinant of satisfaction in all approaches and models applied. This underlines the subjective nature of satisfaction as a patient-reported outcome. Self-reported “health status” was also relevant. This factor has seen some controversy in the literature.29 Most studies have shown a positive association between satisfaction and health status, in particular if a self-reported measure such as quality of life was used, and there seems to be convincing evidence that it is good health which leads to higher satisfaction, rather than the other way round. 1,12 However, it has also been suggested that this association may be the result of general tendency of some patients to report particularly positive (or negative) statements.25 We have examined several different proxies for health care. Current disease activity is known to be closely correlated with quality of life (eg, as reported by Chouliaras et al52) but seemed to be less sensitive in mild disease in our data: It appeared that for course of the disease (number of relapses during preceding year), or a survey-based modification of clinical activity indices, only the more severe categories were associated with low satisfaction. This may support the interpretation that subjective, more-dimensional health status measures more comprehensively capture impaired health as relevant for judging satisfaction. Thus, when we compared satisfaction scores by “provider”, we used quality of life and anxiety symptoms as mandatory covariates. They were not found to confound a strong negative association between not being seen by specialist and low satisfaction. More interestingly, there was a strong effect of “being new with the provider”. There was no difference between pediatric and adult providers when time with provider was controlled for.
The importance of being familiar with the provider is well known from studies which have examined visit satisfaction – most commonly performed in the fields of family or emergency medicine where first visits were strongly associated with low satisfaction as compared to follow-up visits.53,54 It is not clear to what extent this effect reflects quality of care. Naturally, patients would tend to change a provider if not satisfied, so that having stayed long with the current provider precludes low satisfaction with this provider. Also, successful patient–physician communication, which is the most important domain in patient satisfaction, relies on familiarity and trust and may need more than a year to develop. In any way, the finding underlines the importance of preparing youth for change in the transitional age and thoughtful selection of the new doctor. We also suggest that provider change, due to short time and unfamiliarity with the current provider, is most common in young adulthood and as such a likely candidate to explain the purported age-related differences in satisfaction.
We ask for caution when interpreting the effects of additional quality measures in our study, since all indicators were collected via patients, assessing, for example, perceived waiting times rather than measured times. Thus, any associations with low satisfaction may be overestimated as dissatisfied persons would likely judge these issues more critically. Over-adjustment has also been debated, depending on the question at hand: when examining quality differences by provider, adjustment for quality differences is not helpful. Still, a few observations were worth noticing:
Interestingly, “waiting times and time with the physician” had not been named and selected as relevant items into the satisfaction instrument by the patients involved in item generation. Rather, of the practice management items, same day emergency appointments or subjective assessments, such as “taking time”, had been considered more relevant. Given this information from the instrument development phase, the strong impact of waiting times in the current analysis was remarkable. It is, however, in accordance with other studies on this issue, in particular those relating to marketing (“willingness to return”) aspects of satisfaction.54,55 Comparability with these studies is compromised as the medical system, type of patients, and setting were different. In our sample, both times with physician (longer) and times in waiting room (shorter) markedly deviate from usual times quoted in the USA (and emergency room or general practice) dominated literature on waiting times and satisfaction. As a side note, in our sample, waiting times of up to 30 minutes were tolerated without effect on satisfaction, and any time with physician exceeding 15 minutes was rewarded with clearly higher patient satisfaction.
Lastly, of course, the management quality indicator, “IMQI”, is an extremely rough measure of technical physician quality, and has not been validated. As we did not have any information on the identity of the current provider, we were not able to pool information on specific physicians to use as clusters, nor to include external information. Few technical quality indicators had been assessed in the survey, as many of these are not easily available from patients. Thus, while it appeared that only rather strong deviations from good standard therapy impacted on patient quality, we consider these results very preliminary and explorative.
Strengths and limitations
This study is strong on the diligent exploration of relevant covariates, a good sample size, use of validated measures for relevant information, and good item response. There are also a number of limitations. Compromised representativeness due to a focused recruitment strategy and moderate response rate has already been named. Overall, the response rate is within a normal range of what is reported by others.1,56 There is no clear evidence from the literature on how response affects satisfaction estimates. Since approach was via the pediatric registry, it is likely we have oversampled patients particularly satisfied with the pediatric provider. Also, the group examined is usually underrepresented in both pediatric and adult instrument validation studies. We have mostly used adult instruments, for which no specific validation information on an adolescent population is available.
Some potential determinants could not be examined due to low numbers (type 2 errors). This concerned, for example, the effects of depressive symptoms, short duration of disease, living in Austria, and having private insurance. In addition, several covariates bear potential for misclassification, as we had to rely on subjective information only. Examples include current disease activity and type of disease. For type of schooling and region of residence simplistic approaches had to be used, which may have resulted in failure to detect more complex associations. It would have been helpful to be able to include physician-level information.
And lastly, we did not assess patient attitudes, behaviors, and expectations, which may all impact on how medical care is experienced and reported.4,25,57,58 In consequence, any of the associations described in our results will have to be interpreted with caution, as for any patient-reported outcome and exposures, effects of a tendency to report positive opinion may lead to an overestimation of effects.22,59 This is also an alternative explanation for the good performance of self-reported quality of life as a predictor of self-reported patient satisfaction. We are not aware of any means to avoid this problem which underlines the intricate nature of interpreting results on patient satisfaction.
A note on the statistical modeling
We have used a simplified statistical model by focusing on determinants of low satisfaction only, based on an informed but to some extent still arbitrary threshold. The resulting effect estimates are easy to interpret, which was the reason we chose this approach as a starting point. Also, it avoids some of the problems of skewed scores. However, relevant information provided through the sensitive, individually weighing scoring instrument may have been lost. While described on a continuous scale, satisfaction and dissatisfaction may in fact be considered different concepts.58,60,61 It is likely that different covariates act at different levels of satisfaction, with some factors causing low satisfaction, while others may be more relevant for further improving satisfaction which is already quite high.
Also, we have neglected issues of model fit, a complex issue in the evaluation of patient satisfaction. In the literature on determinants of satisfaction, the explained variability is often low, complete explanation is not always desirable, and good fit is potentially suspicious of over-adjustment. Therefore, further analyses will focus on advanced regression models to examine differential effects beyond mean satisfaction with models fitted to the variance parameter and to different levels of satisfaction in order to improve our toolbox for explaining differences in patient satisfaction (manuscript in preparation).
Conclusion
In this paper on determinants of health care satisfaction, we have highlighted the importance of restricting covariates selected for inclusion based on the specific research question at hand. When adjusting for patient characteristics to compare different providers, clinical measures of disease activity may not be sufficient, as emotional status, in particular anxiety symptoms, were found to be more relevant and may explain the stronger association with quality of life reported elsewhere. It is unclear whether the association reflects differences in perceiving and reporting of quality of care on the patient side or failure of providers to deal appropriately with the emotional problems which may accompany chronic disease.
The importance of having established a lasting provider–patient relationship and the low satisfaction when treated by non-specialists underline the relevance of well-planned transition. We conclude that the time it takes to find and adjust to an appropriate health care provider explains some of the consistent finding of relatively low satisfaction in this age group in the literature.
We do not recommend adjusting for other quality indicators when comparing patient satisfaction by provider. It may, however, be useful to explore sources of variability in satisfaction. In this case, the additional indicators should be derived from an independent source, and be introduced on a group level as well as individually to maximize independence. Even so, we suggest from our preliminary findings that providers are likely to further improve patient satisfaction if they avoid waiting times exceeding 30 minutes and consultation times of less than 15 minutes.
Thus, future perspectives based on these results relate to more considerate use and interpretation of covariates when modeling patient satisfaction and improved transitional care with particular reference to selecting appropriate adult care specialists.
Acknowledgments
We thank all pediatricians who have contributed patients to the survey, and the teams at Helmholtz Center Munich and Bremen Institute for Prevention Research and Social Medicine (BIPS) Bremen for survey and coordination support. The survey was funded by a grant from the German Crohn and Colitis Association (DCCV e.V.).
Disclosure
The authors report no conflicts of interest in this work.
References
Crow R, Gage H, Hampson S, et al. The measurement of satisfaction with healthcare: implications for practice from a systematic review of the literature. Health Technol Assess. 2002;6(32):1–244. | ||
Ware JE, Jr, Davies-Avery A, Stewart AL. The measurement and meaning of patient satisfaction. Health Med Care Serv Rev. 1978;1(1):1, 3–15. | ||
Pascoe GC. Patient satisfaction in primary health care: a literature review and analysis. Eval Program Plann. 1983;6(3–4):185–210. | ||
Sitzia J, Wood N. Patient satisfaction: a review of issues and concepts. Soc Sci Med. 1997;45(12):1829–1843. | ||
Batbaatar E, Dorjdagva J, Luvsannyam A, Amenta P. Conceptualisation of patient satisfaction: a systematic narrative literature review. Perspect Public Health. 2015;135(5):243–250. | ||
Batchelor C, Owens DJ, Read M, Bloor M. Patient satisfaction studies: methodology, management and consumer evaluation. Int J Health Care Qual Assur. 1994;7(7):22–30. | ||
Doyle C, Lennox L, Bell D. A systematic review of evidence on the links between patient experience and clinical safety and effectiveness. BMJ Open. 2013;3:e001570. | ||
Manary MP, Boulding W, Staelin R, Glickman SW. The patient experience and health outcomes. N Engl J Med. 2013;368(3):201–203. | ||
Cleary PD. The increasing importance of patient surveys. Now that sound methods exist, patient surveys can facilitate improvement. BMJ. 1999;319(7212):720–721. | ||
Jerant A, Fenton JJ, Bertakis KD, Franks P. Satisfaction with health care providers and preventive care adherence: a national study. Med Care. 2014;52(1):78–85. | ||
Cohen JB, Myckatyn TM, Brandt K. The importance of patient satisfaction: a blessing, a curse, or simply irrelevant? Plast Reconstr Surg. 2017;139(1):257–261. | ||
Fenton JJ, Jerant AF, Bertakis KD, Franks P. The cost of satisfaction: a national study of patient satisfaction, health care utilization, expenditures, and mortality. Arch Intern Med. 2012;172(5):405–411. | ||
Avis M, Bond M, Arthur A. Satisfying solutions? A review of some unresolved issues in the measurement of patient satisfaction. J Adv Nurs. 1995;22(2):316–322. | ||
Ross CK, Steward CA, Sinacore JM. A comparative study of seven measures of patient satisfaction. Med Care. 1995;33(4):392–406. | ||
Hall JA, Dornan MC. Meta-analysis of satisfaction with medical care: description of research domain and analysis of overall satisfaction levels. Soc Sci Med. 1988;27(6):637–644. | ||
Carr-Hill RA. The measurement of patient satisfaction. J Public Health Med. 1992;14(3):236–249. | ||
Collins K, O’Cathain A. The continuum of patient satisfaction – from satisfied to very satisfied. Soc Sci Med. 2003;57(12):2465–2470. | ||
Batbaatar E, Dorjdagva J, Luvsannyam A, Savino MM, Amenta P. Determinants of patient satisfaction: a systematic review. Perspect Public Health. 2017;137(2):89–101. | ||
Linder-Pelz SU. Toward a theory of patient satisfaction. Soc Sci Med. 1982;16(5):577–582. | ||
Linder-Pelz S. Social psychological determinants of patient satisfaction: a test of five hypothesis. Soc Sci Med. 1982;16(5):583–589. | ||
Donald C, Ware J. The Measurement of Social Support, in Research in Community and Mental Health. Greenwich: JAI Press; 1984: 325–370. | ||
Shirley ED, Sanders JO. Patient satisfaction: implications and predictors of success. J Bone Joint Surg Am. 2013;95(10):e69. | ||
Perneger TV, Kossovsky MP, Cathieni F, di Florio V, Burnand B. A randomized trial of four patient satisfaction questionnaires. Med Care. 2003;41(12):1343–1352. | ||
Voutilainen A, Pitkäaho T, Vehviläinen-Julkunen K, Sherwood PR. Meta-analysis: methodological confounders in measuring patient satisfaction. J Res Nurs. 2015;20(8):698–714. | ||
Perneger TV. Adjustment for patient characteristics in satisfaction surveys. Int J Qual Health Care. 2004;16(6):433–435. | ||
Hall JA, Dornan MC. Patient sociodemographic characteristics as predictors of satisfaction with medical care: a meta-analysis. Soc Sci Med. 1990;30(7):811–818. | ||
Rahmqvist M. Patient satisfaction in relation to age, health status and other background factors: a model for comparisons of care units. Int J Qual Health Care. 2001;13(5):385–390. | ||
Moret L, Nguyen JM, Volteau C, Falissard B, Lombrail P, Gasquet I. Evidence of a non-linear influence of patient age on satisfaction with hospital care. Int J Qual Health Care. 2007;19(6):382–389. | ||
Hall JA, Milburn MA, Epstein AM. A causal model of health status and satisfaction with medical care. Med Care. 1993;31(1):84–94. | ||
Timmer A, Peplies J, Westphal M, et al. Transition from pediatric to adult medical care – a survey in young persons with inflammatory bowel disease. PLoS One. 2017;12(5):e0177757. | ||
Benchimol EI, Fortinsky KJ, Gozdyra P, Van den Heuvel M, Van Limbergen J, Griffiths AM. Epidemiology of pediatric inflammatory bowel disease: a systematic review of international trends. Inflamm Bowel Dis. 2011;17(1):423–439. | ||
Baumgart DC, Sandborn WJ. Crohn’s disease. Lancet. 2012;380(9853):1590–1605. | ||
Ordas I, Eckmann L, Talamini M, Baumgart DC, Sandborn WJ. Ulcerative colitis. Lancet. 2012;380(9853):1606–1619. | ||
Campbell F, Biggs K, Aldiss SK, et al. Transition of care for adolescents from paediatric services to adult health services. Cochrane Database Syst Rev. 2016;4:Cd009794. | ||
Buderus S, Scholz D, Behrens R, et al. Chronisch-entzündliche Darmerkrankungen bei pädiatrischen Patienten [Inflammatory bowel disease in pediatric patients – characteristics of newly diagnosed patients from the CEDATA-GPGE registry]. Deutsches Ärzteblatt International. 2015;112(8):121–127. German. | ||
Timmer A, Behrens R, Buderus S, et al. Childhood onset inflammatory bowel disease: predictors of delayed diagnosis from the CEDATA German-language pediatric inflammatory bowel disease registry. J Pediatr. 2011;158(3):467–473. | ||
Timmer A, Stark R, Peplies J, Classen M, Laass MW, Koletzko S. Current health status and medical therapy of patients with pediatric-onset inflammatory bowel disease: a survey-based analysis on 1280 patients aged 10-25 years focusing on differences by age of onset. Eur J Gastroenterol Hepatol. 2017;29(11):1276–1283. | ||
Sadlo A, Altevers J, Peplies J, et al. Measuring satisfaction with health care in young persons with inflammatory bowel disease – an instrument development and validation study. BMC Health Serv Res. 2014;14:97. | ||
Jöckel KH, Babitsch B, Bellach BM, et al. [Measurement and quantification of sociodemographic characteristics in epidemiological studies.]. German Working Group on Epidemiological Methods of the GMDS and DGSMP; 1997. | ||
Winkler J, Stolzenberg H. Der Sozialschichtindex im Bundes-Gesundheitssurvey [Social class index in the Federal Health Survey]. Gesundheitswesen 999;61(2):S178–S83. | ||
Timmer A, Kemptner D, Takses A, Klebl F, Jockel KH. A survey-based index was validated for measuring disease activity in inflammatory bowel disease. An evaluation study. J Clin Epidemiol. 2009;62(7):771–778. | ||
Rose M, Fliege H, Hildebrandt M, et al. Validierung der deutschsprachigen Version des „Short Inflammatory Bowel Disease Questionnaire” (SIBDQ) [Validation of the new German translation version of the “Short Inflammatory Bowel Disease Questionnaire” (SIBDQ)]. Z Gastroenterol. 2000;38(4):277–286. German. | ||
Herrmann-Lingen C, Buss U, Snaith R. [HADS-D: Hospital Anxiety and Depression Scale German Version.]. Bern: Hans Huber; 2011. | ||
Snaith RP. The Hospital Anxiety And Depression Scale. Health Qual Life Outcomes. 2003;1:29. | ||
Leung Y, Heyman MB, Mahadevan U. Transitioning the adolescent inflammatory bowel disease patient: guidelines for the adult and pediatric gastroenterologist. Inflamm Bowel Dis. 2011;17(10):2169–2173. | ||
Sandhu BK, Fell JM, Beattie RM, Mitton SG, Wilson DC, Jenkins H. Guidelines for the management of inflammatory bowel disease in children in the United Kingdom. J Pediatr Gastroenterol Nutr. 2010;50(Suppl 1):S1–13. | ||
Guarini A, Biagini S, Capaldi A, et al. Satisfaction and expectations of patients with inflammatory bowel disease on biologic therapy: a multicenter study. Ann Gastroenterol. 2017;30(1):96–100. | ||
Ygge BM, Arnetz JE. Quality of paediatric care: application and validation of an instrument for measuring parent satisfaction with hospital care. Int J Qual Health Care. 2001;13(1):33–43. | ||
Cheung KL, Ten Klooster PM, Smit C, de Vries H, Pieterse ME. The impact of non-response bias due to sampling in public health studies: a comparison of voluntary versus mandatory recruitment in a Dutch national survey on adolescent health. BMC Public Health. 2017;17(1):276. | ||
Bjertness E, Sagatun Å, Green K, Lien L, Søgaard AJ, Selmer R. Response rates and selection problems, with emphasis on mental health variables and DNA sampling, in large population-based, cross-sectional and longitudinal studies of adolescents in Norway. BMC Public Health. 2010;10(1):602. | ||
Timmer A, Peplies J, Albers M. Regionale Ungleichheit in der Versorgung von Kindern mit CED. Bauchredner, DCCV-Journal. 2012;111(4/2012):81–82. | ||
Chouliaras G, Margoni D, Dimakou K, Fessatou S, Panayiotou I, Roma-Giannikou E. Disease impact on the quality of life of children with inflammatory bowel disease. World J Gastroenterol. 2017;23(6):1067–1075. | ||
Anderson RT, Camacho FT, Balkrishnan R. Willing to wait?: the influence of patient wait time on satisfaction with primary care. BMC Health Serv Res. 2007;7:31. | ||
Camacho F, Anderson R, Safrit A, Jones AS, Hoffmann P. The relationship between patient’s perceived waiting time and office-based practice satisfaction. NC Med J. 2006;67(6):409–413. | ||
Bleustein C, Rothschild DB, Valen A, Valatis E, Schweitzer L, Jones R. Wait times, patient satisfaction scores, and the perception of care. Am J Managed Care. 2014;20(5):393–400. | ||
Gasquet I, Falissard B, Ravaud P. Impact of reminders and method of questionnaire distribution on patient response to mail-back satisfaction survey. J Clin Epidemiol. 2001;54(11):1174–1180. | ||
Zandbelt LC, Smets EM, Oort FJ, Godfried MH, de Haes HC. Satisfaction with the outpatient encounter: a comparison of patients’ and physicians’ views. J Gen Intern Med. 2004;19(11):1088–1095. | ||
Williams B, Coyle J, Healy D. The meaning of patient satisfaction: an explanation of high reported levels. SocSciMed. 1998;47(9):1351–1359. | ||
Friedberg MW, Safran DG, Schneider EC. Satisfied to death: a spurious result? Arch Intern Med. 2012;172(14):1110–1114. | ||
Eriksen LR. Patient satisfaction with nursing care: concept clarification. J Nurs Meas. 1995;3(1):59–76. | ||
Mulcahy L, Tritter JQ. Pathways, pyramids and icebergs? Mapping the links between dissatisfaction and complaints. Sociol Health Illn. 1998;20(6):825–847. |
Supplementary material
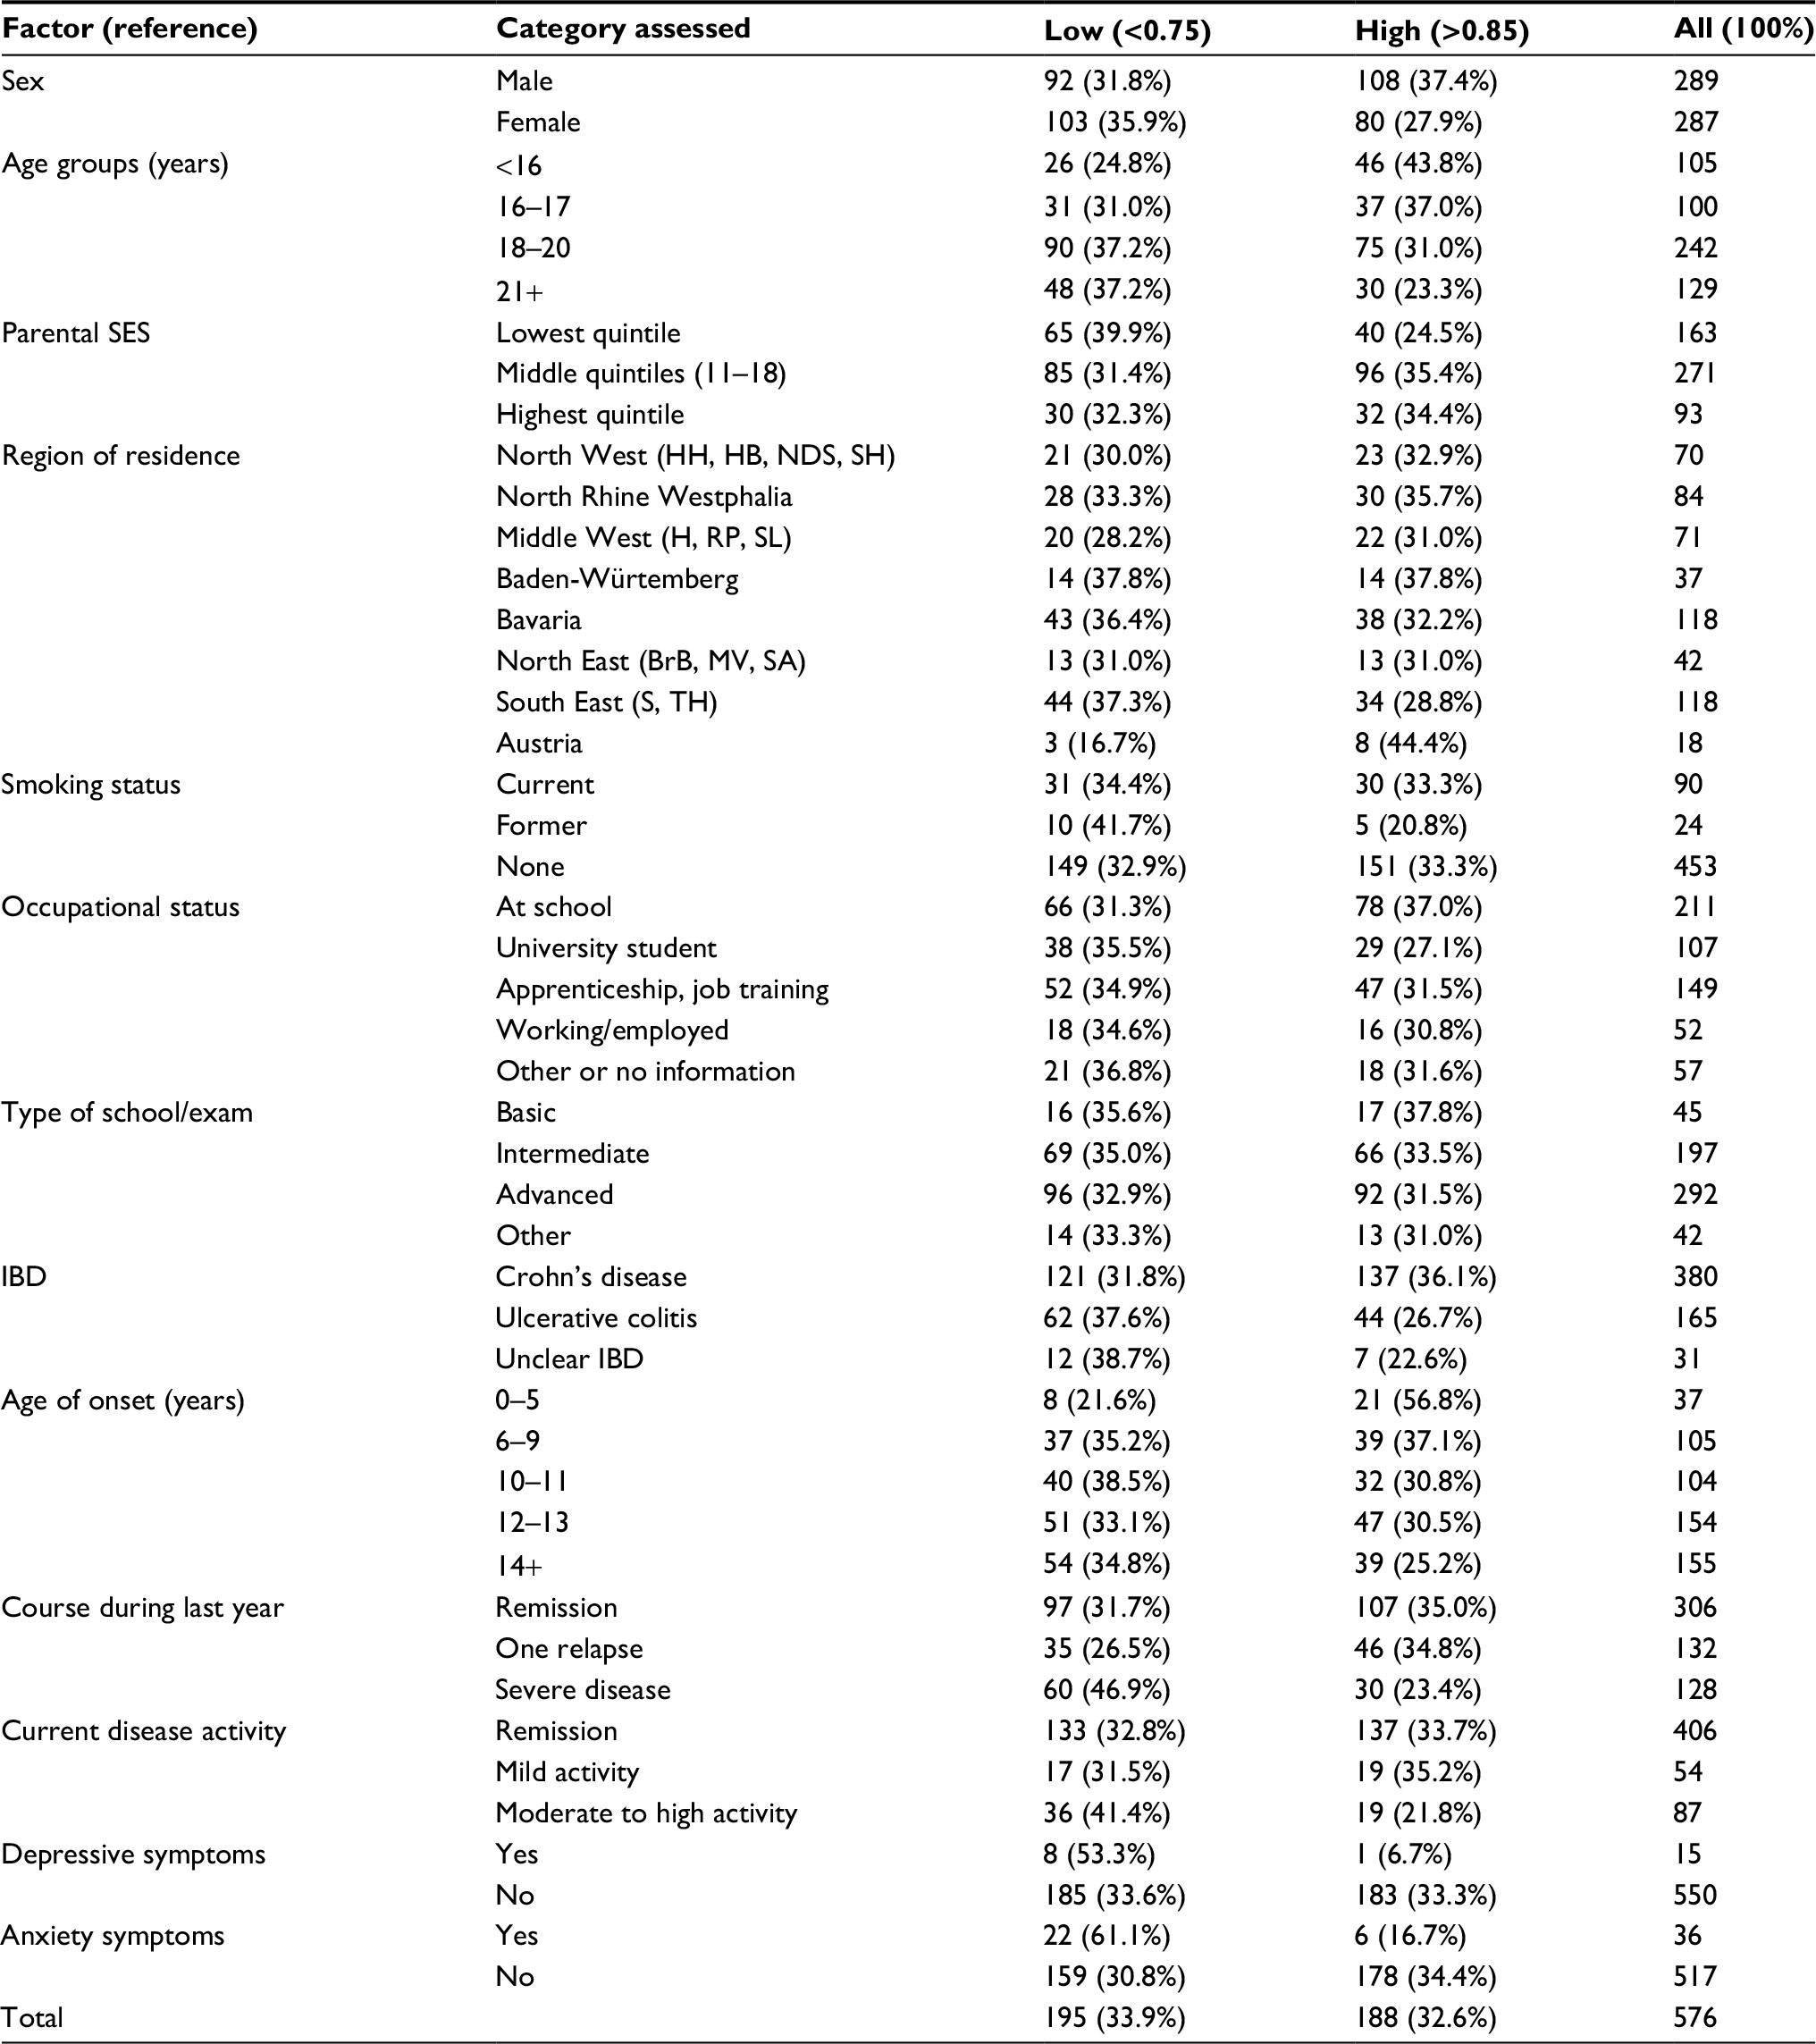 | Table S1 Differences by level of satisfaction (not shown: middle) Abbreviations: SES, socioeconomic status; IBD, inflammatory bowel disease. HH, Hamburg; HB, Bremen; NDS, Lower Saxony; SH, Schleswig-Holstein; H, Hessia; RP Rhineland Palatinum; SL, Saarland; Brb, Brandenburg-Berlin; MV, Mecklenburg-Vorpommern; SA Saxony Anhalt; S, Saxony; TH, Thuringia. |
 © 2018 The Author(s). This work is published and licensed by Dove Medical Press Limited. The full terms of this license are available at https://www.dovepress.com/terms.php and incorporate the Creative Commons Attribution - Non Commercial (unported, v3.0) License.
By accessing the work you hereby accept the Terms. Non-commercial uses of the work are permitted without any further permission from Dove Medical Press Limited, provided the work is properly attributed. For permission for commercial use of this work, please see paragraphs 4.2 and 5 of our Terms.
© 2018 The Author(s). This work is published and licensed by Dove Medical Press Limited. The full terms of this license are available at https://www.dovepress.com/terms.php and incorporate the Creative Commons Attribution - Non Commercial (unported, v3.0) License.
By accessing the work you hereby accept the Terms. Non-commercial uses of the work are permitted without any further permission from Dove Medical Press Limited, provided the work is properly attributed. For permission for commercial use of this work, please see paragraphs 4.2 and 5 of our Terms.