")
Back to Journals » Drug Design, Development and Therapy » Volume 13
Model-dependent pharmacokinetic analysis of enalapril administered to healthy adult volunteers using orodispersible minitablets for use in pediatrics
Authors Faisal M, Cawello W, Burckhardt BB, Laer S
Received 27 September 2018
Accepted for publication 10 December 2018
Published 25 January 2019 Volume 2019:13 Pages 481—490
DOI https://doi.org/10.2147/DDDT.S188417
Checked for plagiarism Yes
Review by Single anonymous peer review
Peer reviewer comments 3
Editor who approved publication: Dr Qiongyu Guo
Muhammad Faisal,* Willi Cawello,* Bjoern B Burckhardt, Stephanie Laer
On behalf of LENA Consortium
Institute of Clinical Pharmacy and Pharmacotherapy, Heinrich-Heine-University Düsseldorf, Düsseldorf, Germany
*These authors contributed equally to this work
Introduction: Comparative pharmacokinetic (PK) data analysis of drugs administered using developed child-appropriate and market authorized dosage formulation is sparse and is important in pediatric drug development.
Objectives: To compare and evaluate any differences in PK of enalapril administered using two treatments of child-appropriate orodispersible minitablets (ODMTs) and market authorized reference tablet formulation (Renitec®) using PK compartment model and validated least square minimization method (LSMM) of parameter estimation.
Methods: Full profile data sets were obtained from a phase I clinical trial, whereby three treatments of enalapril, ie, reference tablets with 240 mL water (treatment A), child-appropriate ODMTs with 240 mL (treatment B), and ODMTs dispersed in the mouth with 20 mL water (treatment C), were administered to 24 healthy adult volunteers. Virtual validation analysis was conducted using R program to select accurate and precise LSMM of parameter estimation. For the selection of PK model and estimation of parameters, enalapril data were fitted with one- and two-compartment models with first order of absorption and elimination, with and without incorporated lag time parameter (tlag). The log-transformed PK parameters were statistically compared by the two-sided paired t-test with the level of significance of P<0.05.
Results: One-compartment model with first-order absorption and elimination and incorporated lag time adequately predicted concentrations of enalapril. Reciprocal of predicted concentration using iteratively reweighted LSMM was selected as the most appropriate method of parameter estimation. Comparison of PK parameters including rate constant of absorption and elimination, volume of distribution, and tlag between the three treatments showed significant difference (P=0.018) in tlag between treatments B and A only.
Conclusion: Compared with reference formulation, enalapril administered from child-appropriate ODMTs administered with 240 mL water appeared 4 minutes earlier in serum. No other differences were observed in absorption, elimination, and relative bioavailability of drug between the three treatment arms.
Keywords: enalapril, orodispersible minitablets, least square minimization method, child-appropriate dosage forms, model-dependent pharmacokinetics
Introduction
Treatment and management of pediatric heart failure have usually been based on the evidence of heart failure treatment in adults due to a lack of pediatric clinical trials and subsequently a lack of approved drugs for children.1,2 Despite major successes of the US pediatric legislation initiative in 19973 and the European pediatric regulation in 2007,4 no drug had been successfully approved for US American or European children with heart failure under these legislations. This is regarded as a severe risk for children because pediatric heart failure is characterized by high mortality rates.5 Since the developing child undergoes maturation and growth6,7 and since children show a different etiology of heart failure compared with adults,8 pharmacokinetics (PKs) and pharmacodynamics are different and therefore dosing regimens for children are also considered to be different.
The European Medicine Agency’s Pediatric Heart Failure Expert Group Meeting had recommended angiotensin-converting enzyme (ACE) inhibitors as the first-line treatment for chronic heart failure in pediatrics with emphasis to evaluate safety-related data of the chronic use of these medicines.9 The ACE inhibitor enalapril has proven to prolong survival10 and has been put onto the priority list of drugs to be developed for pediatric heart failure treatment.11 At present, the drug has not been approved for pediatrics under the age of 6 years or 20 kg in Europe.12
Drug formulations like liquids and suspensions are usually recommended for children, but excipients and the specific challenges of palatability limit their use. Solid dosage formulations have advantages in this regard because they do not need excipients and can be masked for bitter taste. For children, solid dosage forms usually have to be crushed and used as extemporaneous preparations resulting in compounding errors and dosing inaccuracies.13,14 To account for these problems, child-appropriate solid dosage forms like orodispersible minitablets (ODMTs) are considered as a preferred choice of dosage formulation for drug administration in children.15 Moreover, they offer reduced transportation costs to developing areas16 than larger solid formulations.17
WHO18 and European Medicine Agency (EMA) have emphasized the need to develop child-appropriate dosage formulations,19 and the European Commission has launched an investigator-driven drug development programs for children20 for innovative child-appropriate formulations covering highly needed pediatric indications such as pediatric heart failure treatment with enalapril. Within this program, enalapril as ODMTs has been developed for children and a bioavailability study has been conducted in healthy volunteers35 comparing the oral dispersible minitablet formulation with the market available generic formulation of enalapril (Renitec®).35
Typically, noncompartmental PK analysis is performed to compare the bioavailability of drug reflected by the rate and extent (area under the curve and maximum serum concentrations) to which the active pharmaceutical ingredient or prodrug is absorbed from a drug product into systemic circulation.21 However, a PK compartmental modeling analysis is expected to give additional information regarding the comparison of absorption rate constant and delay in the appearance of enalapril in blood administered by the two formulations. The PK modeling of the parent drug enalapril provided here will enable a later PK modeling analysis of the parent drug together with the active metabolite enalaprilat in serum as well as in urine.
Objectives
Using a model-dependent PK approach with lag-time, rate constant of absorption (KA), volume of distribution (VD), fraction of dose absorbed (f), and rate constant of elimination (KE) of enalapril concentration-time profiles after application of 10 mg ODMTs and 10 mg of the reference generic formulation (5 mg tablet) in healthy adult volunteers were evaluated and compared. To substantiate the quality of the modeling approach, a validation study for the selection of an accurate and precise method of least square minimization using different weighting schemes was performed to evaluate and compare PK parameters of enalapril.
Materials and methods
Simulated validation study
The aim of the simulated validation study was to select an adequate least square minimization method (LSMM), which iterates the most accurate and precise parameters of a PK model.
PK model for the validation process
Goodness of fit plots indicated the one-compartment model to be adequate for the analysis of real data sets; therefore, a simulated validation process was carried out using the one-compartment model with the first order of absorption and elimination (Bateman function) (Equation 1).
|
|
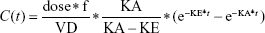
where dose represents the 100 μg of administered amount of XY drug through extravascular route, f is the factor of bioavailability, C represents the concentration, t represents time point after drug administration, KA and KE represent rate constants of absorption and elimination, and VD means the volume of distribution.
Source data for the validation process
An R program using R version 3.3 was written to generate simulated serum concentrations of 100 fictive subjects with predefined individual PK parameters. The values of each PK parameter of each subject were randomized with a lognormal distributed variability of 30% to imitate interindividual variability given in Table 1. Based on the generated random values of the set of PK parameters of all 100 subjects and the PK model (Equation 1), data sets of the concentration-time profiles at defined points of time were calculated by inserting individual set of PK parameters at each point of time t, ie, at 0.167, 0.25, 0.5, 0.75, 1, 1.25, 1.5, 2, 3, 4, 5, and 6 hours, respectively.
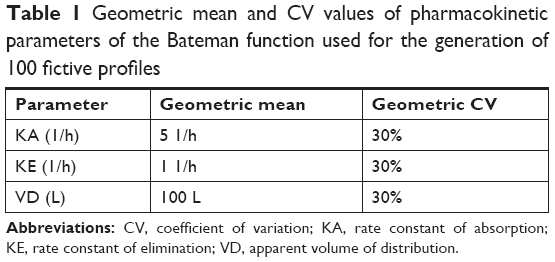 | Table 1 Geometric mean and CV values of pharmacokinetic parameters of the Bateman function used for the generation of 100 fictive profiles |
Calculated serum concentrations were assigned with a proportional error to imitate the case of typical errors occurring through analyzing the process for drug concentrations. For this step, R procedure rnorm was used to generate random numbers following a normal distribution around zero with a standard deviation (SD) of 30%.
Validation process
The generated data for validation were fitted with the selected Bateman function specified in the predefined Phoenix® WinNonlin® (Certara) version 8 model library. The Gauss–Newton algorithm, with Levenberg and Hartley modifications, was used for iteration. PK modeling of the generated data sets was performed using LSMM in which model parameters were iterated to minimize the sum of square residuals by applying weights on all fictive concentrations.22,23 Different weighting schemes were analyzed, for instance, uniform weights using ordinary least square (OLS) minimization method were applied on all the concentrations to give equal importance in minimizing the sum of squares. Similarly, weighted least square (WLS) and iterative reweighted least square (IRLS) minimization methods were analyzed by applying weights as reciprocal 1/y or squared of the reciprocal 1/y2 observed concentrations24 and reciprocal 1/y or squared of the reciprocal 1/y2 predicted concentrations on all fictively generated concentrations, respectively.25
The equations for the parameter iteration and minimization of OLS, WLS, and IRLS objective function are expressed in Equations 2, 3, and 4, respectively.
| (2) |

| (3) |

| (4) |

where the symbol Σ represents the sum of all individual observed concentrations Yi. The symbol f (pi, Θ) represents the concentrations pi predicted using the function f and iterated predicted parameters Θ, W represents weights applied as 1/y or 1/y2 observed concentrations, and PW represent weights applied as 1/y or 1/y2 predicted concentrations.26
Comparing the iterated and reference PK parameters
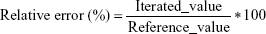
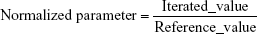
Adequacy of the LSMM used in the validation process was evaluated by using typical validation characteristics, namely, accuracy and precision of the PKs parameters, calculated by writing an R program by using the following calculations:
|
|
|
|
|
|
| (8) |

Accuracy and precision were chosen as desired statistical measures for evaluation, as proposed in the International Council on Harmonization (ICH) Tripartite Guideline for Validation of Analytical Procedures and were evaluated in the light of the Food and Drug Administration (FDA) guideline for bioanalytical method validation.27,28 It has to be considered that the FDA generally stated a replicate of samples or measurements that were necessary for these determinations, whereas the present evaluation was based on the precision and accuracy of iterated values compared with generated values (as representatives for measured values), of the individual subjects of a fictive study population. The mean value of accuracy should be within 15% of the actual value and the precision at each concentration level should not exceed 15% of the coefficient of variation.27
PK modeling of the real data
PK modeling of the real data was then performed based on the results obtained from the validation process. The most appropriate LSMM according to the results of the simulated validation study was used.
Trial design and source data of enalapril concentrations
Data were generated from a phase I clinical trial with a publically outlined design35 and part of the LENA project (labeling of enalapril from neonate to adolescence, European Union Seventh Framework Program [FP7/2007–2013] under the grant agreement no 602295). Approval for the trial protocol was given by the independent Ethics Committee of the University Hospitals KU Leuven, and the study was conducted in accordance with the ICH Tripartite Guideline on Good Clinical Practice.20 In brief, the PK modeling analysis was the second step using the measured concentration of enalapril and enalaprilat where 24 healthy male and female volunteers were included in an open-label, randomized crossover, three-treatment, three-period study. Blood samples were taken at 0.17, 0.33, 0.5, 0.75, 1, 1.25, 1.5, 2, 2.5, 3, 3.5, 4, 4.5, 5, 6, 8, 10, 12, 24, and 48 hours after administration of the drug. Treatment A contained two reference tablets each of 5 mg strength swallowed with 240 mL of water. Treatment B consisted of ten ODMTs each of 1 mg strength swallowed with 240 mL of water. Treatment C consisted of ten ODMTs each of 1 mg strength dispersed on the tongue following wetting of the mouth with 20 mL of water in fasting state. Subject no 5 of treatment A was pointed out as an outlier and follows an unusual double peak with an unusually delayed tmax of around 4 hours. Application of the Wagner–Nelson method found that after 3 hours of drug administration, only 30% of the drug was absorbed compared with the 95%–100% of the drug absorbed in almost all other subjects. Therefore, subject number 5 was excluded from the main PK modeling analysis.
Bioanalytics of enalapril
Prior to sample preparation, samples, standards, and quality controls were mixed with 5 μL benazepril working solution (IS) and 1,100 μL water. The samples were extracted with Oasis® 96-well MAX solid-phase extraction plates (10 mg, 1 mL). The latter were primed with 1 mL of formic acid in methanol (2%, v/v) followed by an equilibration step with 1 mL of water. After the sample was loaded into the cartridges and passed, the sorbent was washed by 1.0 mL of water, 1.0 mL of methanol–acetone mixture (60:40, v/v), 1.0 mL of ethyl acetate, and 500 μL methanol. Finally, the analytes were eluted from the cartridges with once 0.4 mL of formic acid in methanol (2%, v/v). The eluate was evaporated to dryness under a gentle stream of compressed air while shaking at 550 rpm at 40°C. The residue was reconstituted with 100 μL of methanol and water (40:60, v/v). This final step made for a dilution of the sample/standard concentration in the ratio of 1:2.
The enalapril determination in reconstituted solution was conducted utilizing liquid chromatography-triple quadrupole tandem mass spectrometry in positive ionization mode (Shimadzu HPLC 10 coupled with AB Sciex API 2000 mass spectrometer). Chromatographic separation was carried out on an XBridge® BEH C18 3.5 μm column (3.0×150 mm) applying a gradient of methanol and water (both acidified with 0.1% formic acid and 2 mM ammonium formate) within a run time of 7 minutes. For quantification, the ion transitions 377.2–234.2 m/z (mass-to-charge) for enalapril and 425.3–351.2 m/z for benazepril (internal standard) were used. Moreover, the applied bioanalytical method was characterized by a small sample volume of 50 μL serum encompassing a calibration range from 0.195 to 200 ng/mL. The method was fully validated according to EMA and FDA bioanalytical method validation guidelines by using European Pharmacopoeia Reference Standard of enalapril. Obtained mean accuracy values ranged from 92.1% to 108.4% of the nominal concentration at the lower limit of quantification (LLOQ) (0.195 ng/mL), from 91.6% to 100.2% at the low concentration level (3.125 ng/mL), from 94.3% to 100.4% at the medium level (25 ng/mL), and from 92.6% to 98% at the upper limit of quantification (200 ng/mL). The time-different intermediate precision varied between 5.0% and 9.5% across all concentration levels and was subsequently well within the guideline limits of ±15% (±20% at LLOQ).
All unknown serum samples were quantified using freshly prepared calibration curves with linear regression (1/x2 weighting). The calibration curves were established by plotting the concentration ratio of enalapril to IS against the peak area of enalapril to IS. Analyst software version 1.5.1 with IntelliQuan® as integration algorithm without smoothing was applied for data acquisition and evaluation. Study samples measured below the LLOQ were not included in the PK modeling analysis.
Software used and PK modeling
Phoenix® WinNonlin® version 8 was used for the nonlinear regression analysis. The data were fitted with the one- and two-compartment models, with and without incorporating a lag time of absorption, with the first order of absorption and elimination. Both models were analyzed on the basis of goodness of fit plots, including time vs log and linear observed and predicted plots, observed vs predicted plots, and residual vs predicted plots. Information from the validation step was used to select the LSMM, which predicts the most accurate and precise model parameters. Initial parameters were generated using an inbuilt curve stripping and grid search method of Phoenix® WinNonlin®. Upper and lower bounds were applied to the initial parameter values.
Descriptive and inductive statistics
Descriptive statistics, including the calculation of geometric mean, standard deviation, and % coefficient of variation of the PK parameters iterated for each treatment, was performed using Phoenix® WinNonlin®. An R program was written for a two-sided paired t-test on the log-transformed parameters to evaluate the statistically significant differences between the PK parameters of treatments A, B, and C iterated for each individual.
Results
Selection of LSMM
Weighting scheme, using reciprocal of the squared predicted concentration 1/y2 (IRLS minimization method) predicted all PK parameters of the Bateman function, ie, VD, KA, and KE, within the acceptable mean accuracy range of 15% specified by the FDA (Table 2). Especially, the percent inaccuracy of KA was 0.15%, while all other weighting schemes were not able to predict KA values in the acceptable accuracy range.
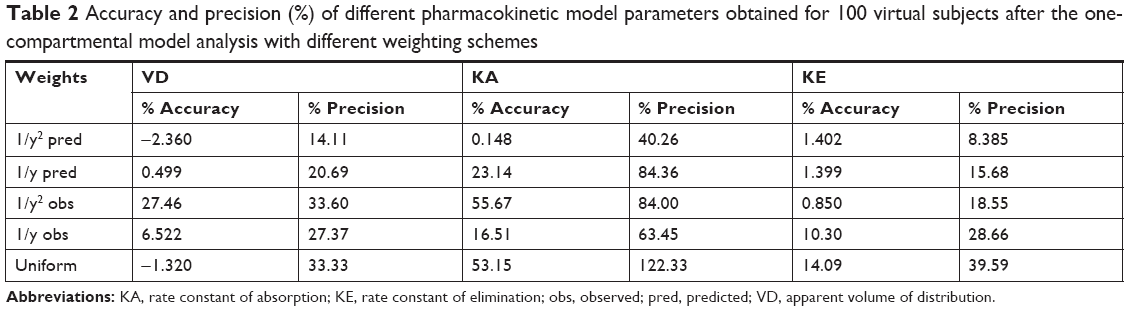 | Table 2 Accuracy and precision (%) of different pharmacokinetic model parameters obtained for 100 virtual subjects after the one-compartmental model analysis with different weighting schemes |
Similarly, weighting scheme applied as reciprocal of the squared predicted concentration (1/y2 pred) iterated the most precise PK parameters compared with all other weighting schemes. The precision of VD and KE parameters were within the FDA-specified precision range of 15%. However, the precision of KA was calculated to be 40% and was much higher than the specified limits. This may be due to the inclusion of less number of fictive time points of sampling in the absorption phase during the fictive data generation, which was not sufficient to iterate a precise value of KA for each subject. Still, weighting by reciprocal of the squared predicted concentration resulted in lower imprecision compared with the accuracy calculated using other weighting schemes as summarized in Table 2.
OLS minimization method resulted in the lowest sum of square residual value as summarized in Table 3. However, the method produced the least precise and less accurate PK parameters compared with other weighting schemes.
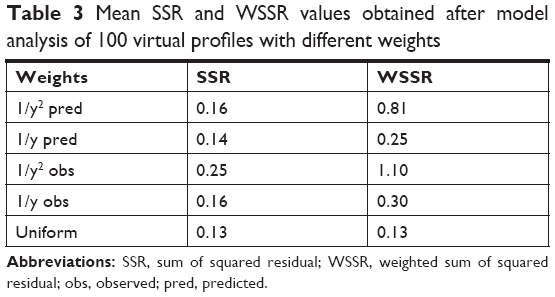 | Table 3 Mean SSR and WSSR values obtained after model analysis of 100 virtual profiles with different weights |
Therefore, accuracy and precision, not the sum of the squared residual values, were used in the selection of the appropriate LSM method for modeling of the real data set. Model performance for fitting the simulated data sets can be visualized using the goodness of fit plot in Figure 1, which shows that the model and weighting scheme adequately predicted the simulated data.
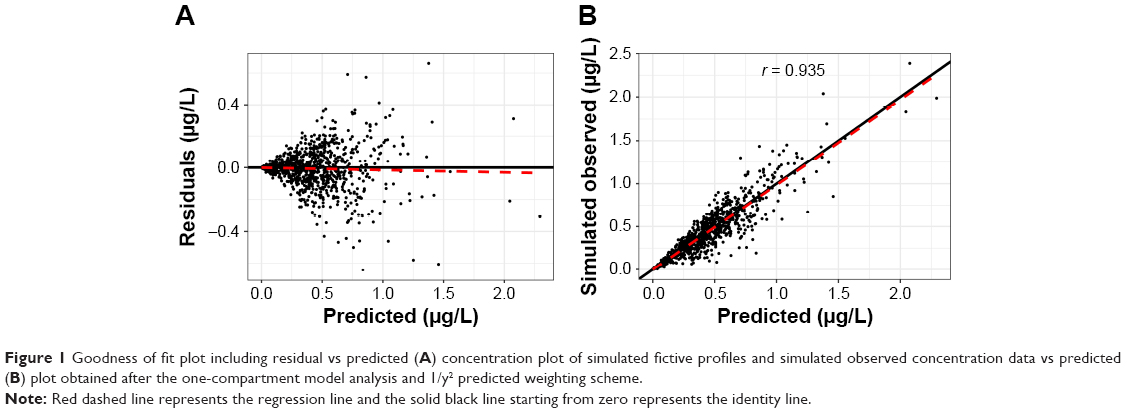 | Figure 1 Goodness of fit plot including residual vs predicted (A) concentration plot of simulated fictive profiles and simulated observed concentration data vs predicted (B) plot obtained after the one-compartment model analysis and 1/y2 predicted weighting scheme. |
Concentration-dependent residuals can be seen in Figure 1A. This is due to the proportional error added to the generated concentrations, which is in line with simulation to the proportional error found in the real data.
Result of the PK modeling analysis of the enalapril real data sets
The one-compartment model with the first order of absorption and elimination and an incorporated lag time adequately predicted the absorption, distribution, and elimination phases of enalapril time vs concentration profiles of the three treatments. The model was not adequate to predict few lower concentrations at the onset of absorption and the elimination phases as shown in Figure 2. A two-compartment model (results not shown in the present paper) was able to predict those few concentrations but resulted in higher standard errors for one or more model parameters. As the simpler one-compartment model predicted most of the concentrations of PK profile, the use of the two-compartment model with high standard error values shows over parametrization and the model was not selected as our final model. Table 4 summarizes the results of PK modeling for the three treatments of the real study.
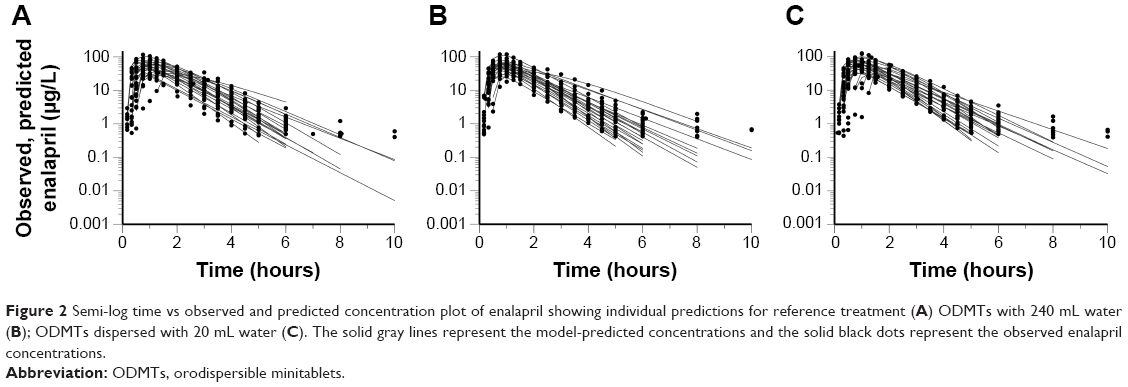 | Figure 2 Semi-log time vs observed and predicted concentration plot of enalapril showing individual predictions for reference treatment (A) ODMTs with 240 mL water (B); ODMTs dispersed with 20 mL water (C). The solid gray lines represent the model-predicted concentrations and the solid black dots represent the observed enalapril concentrations. |
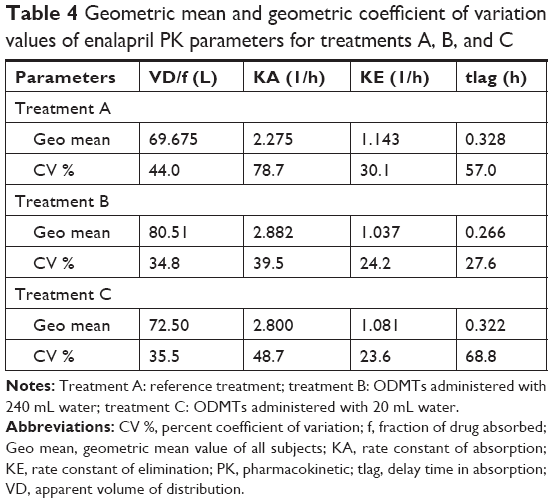 | Table 4 Geometric mean and geometric coefficient of variation values of enalapril PK parameters for treatments A, B, and C |
Observed vs predicted concentration plots show the model performance, where observed and predicted concentrations agree with each other around the regression line. Furthermore, the identity line was also near to the regression line as shown in Figure 3. Residual vs predicted plots show almost equal spread of residuals along the positive and negative sides as shown in Figure 4.
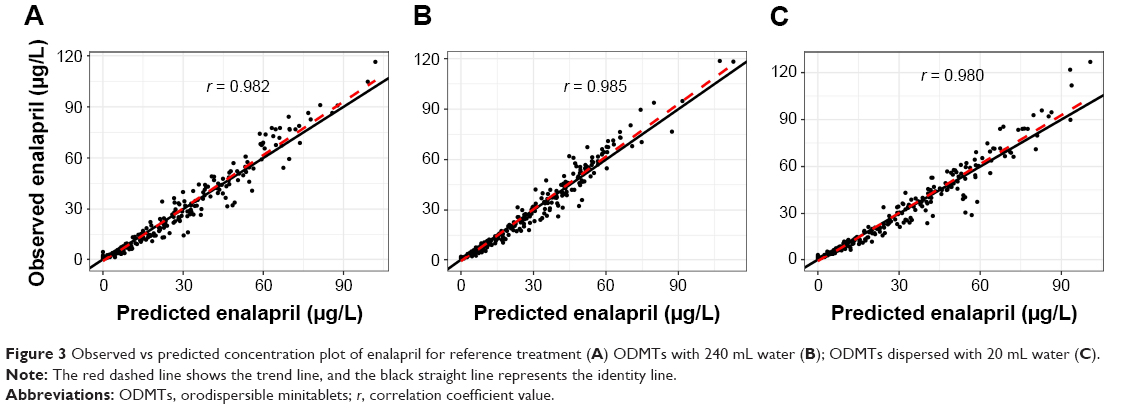 | Figure 3 Observed vs predicted concentration plot of enalapril for reference treatment (A) ODMTs with 240 mL water (B); ODMTs dispersed with 20 mL water (C). |
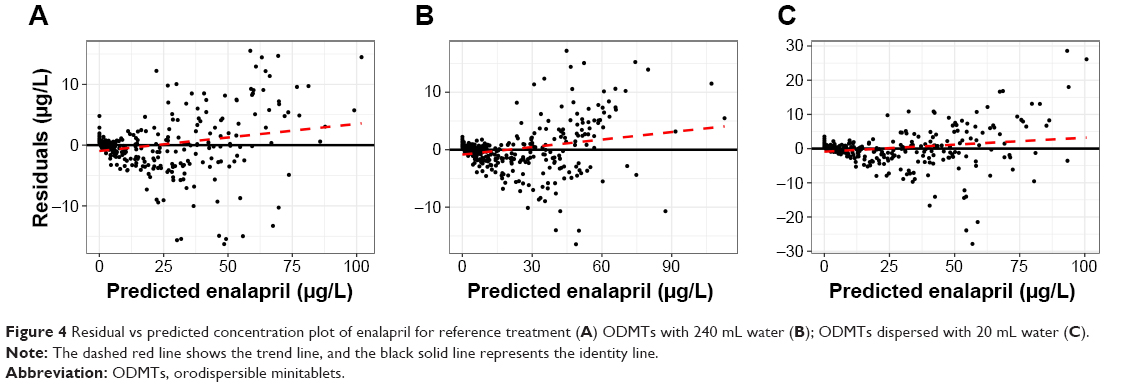 | Figure 4 Residual vs predicted concentration plot of enalapril for reference treatment (A) ODMTs with 240 mL water (B); ODMTs dispersed with 20 mL water (C). |
However, visual inspection of individual plots shows that the model was not adequate to predict few lower concentrations in the onset of absorption and terminal phase of elimination of some subjects. Therefore, higher weights were applied using reciprocal of the predicted concentrations (1/y pred) instead of reciprocal of square predicted (1/y2 pred) concentration on all observed concentrations. Model performance is shown in Figure 5, which indicates the simulation results, where the observed data were in the range of standard deviation of the mean profile of simulated profiles. The model adequately predicted the individual time vs observed concentration profiles of the three treatment arms as shown in Figure 2.
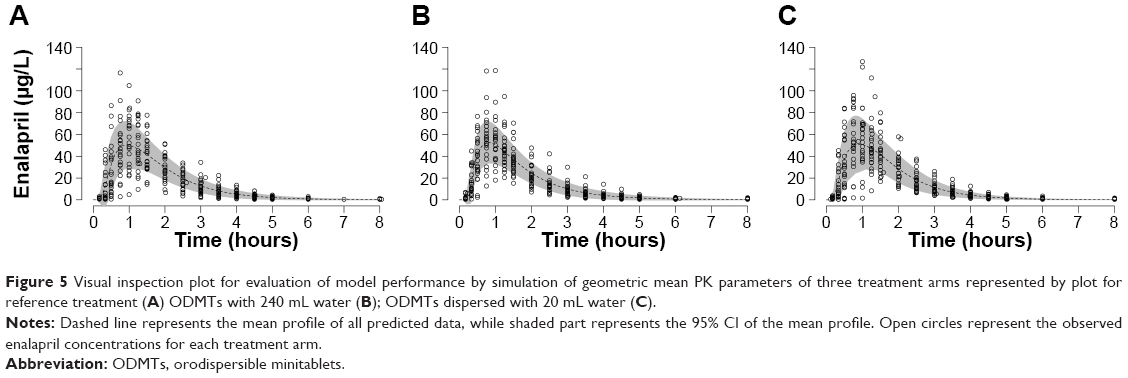 | Figure 5 Visual inspection plot for evaluation of model performance by simulation of geometric mean PK parameters of three treatment arms represented by plot for reference treatment (A) ODMTs with 240 mL water (B); ODMTs dispersed with 20 mL water (C). |
Statistical paired t-test applied on PK parameters iterated for treatments A, B, and C resulted in only a difference in the lag time of drug absorption between the treatments B and A (P=0.018). Statistical correlation of all other one-compartment model parameters showed no statistical difference as summarized in Table 5.
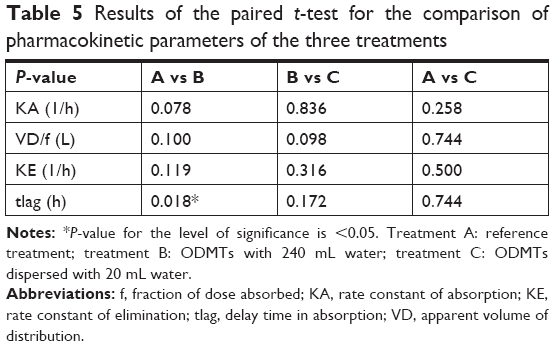 | Table 5 Results of the paired t-test for the comparison of pharmacokinetic parameters of the three treatments |
The mean time taken for the drug to appear in blood was 16 minutes from ODMTs administered with 240 mL water compared with 20 minutes from reference tablets. This means that enalapril appeared 4 minutes earlier after ODMTs administration when compared with the administration of reference formulation.
Discussion
A PK model-dependent approach revealed that ODMTs show 4 minutes earlier appearance of enalapril in the systemic circulation than the conventional tablets. The model-dependent approach also showed that the KA, the VD, and the KE were not different if ODMTs and conventional tablets were compared. The modeling approach was substantiated by a validation study, which validated the PK software by iterating accurate and precise model parameters. Validation process also shows that the parameter estimation method of least square minimization can iterate highly accurate model parameters with acceptable precision. Therefore, the method can be used in the PK modeling analysis. Validation study showed weighting scheme applied as reciprocal of the squared predicted concentration iterating the most accurate and precise model parameters. However, as the model was not able to predict few lower concentrations at absorption phase; therefore, higher weights were applied using reciprocal of the predicted concentration.
Visual enalapril time vs concentration plots given in the literature suggest that the one-compartmental model shall be the most appropriate PK model for enalapril after oral administration.29,30 Literature search has found that at present no PK model of enalapril has been published. The simulated validation study estimated weighting scheme applied as reciprocal of squared predicted concentration in a reiterative manner to iterate the most accurate and precise model parameters. The results were in line with the preference and recommendations given in the literature to use iteratively reweighted LSMM for PK modeling analysis.25,26
The significant difference in the earlier appearance of drug (tlag) in blood after the administration of ODMTs compared with conventional tablets may be linked to the fast disintegration and dissolution, which depends on the exposed surface area of ODMTs in the gastrointestinal tract preceding drug absorption.16 As ten ODMTs of 1 mg strength administered with 240 mL water provide a larger surface area compared with two 5 mg reference tablets; therefore, higher dissolution rates are expected from the ODMTs.36
Previously, lag time parameter has not been used as a model parameter in literature for enalapril. The KA is influenced by the disintegration and dissolution rates; therefore, formulation design may have an effect on the speed of release or absorption of the drug.31,32 However, enalapril is a BCS class III drug.33,34 Absorption of BCS class III drug depends on the permeability of drug across the intestinal membrane, which remains the same if permeability is not enhanced.31 As enalapril was administered to the same individuals, the permeability should remain the same and similar KAs were expected as were predicted by the PK model for the three treatments. Previously, no such model-dependent PK comparison of rate and delay in absorption of the drug was reported.
The VD of the drug is dependent on the elimination rate constant, which depends on the status of physiological eliminating organs such as liver and kidney function.31 As in the present analysis, each of the three treatments was administered in three separate periods to the same healthy individuals, the same KE, and apparent VD values in each subject was found by the applied PK modeling analysis. Since the apparent VD is not different between the three treatments administered to the same individuals, the same value for PK parameter VD/f indicates no difference in bioavailability between the three treatment arms. The current analysis was conducted using the LAG time model of absorption. The model did not account for the lower concentrations at the onset of absorption and the higher concentrations as can be seen in Figure 4. This limitation of LAG time model to perfectly account for the lower concentrations and disposition phase has been discussed in literature.37
While the current manuscript deals with the PK analysis of the parent prodrug enalapril administered using different treatments modalities, further detailed population PK analysis of enalapril and its pharmacologically active metabolite enalaprilat in serum and urine will be carried out to explain the complete absorption and disposition of the drug and metabolite. In addition to LAG time model, other absorption models with different residual errors shall be used and comparisons shall be made.
Conclusion
The child-appropriate enalapril ODMTs treatment was earlier absorbed and showed a slightly earlier appearance of 4 minutes in the systemic circulation of adult healthy volunteers compared with conventional reference tablets. The rate of absorption and elimination, as well as the VD, was not different, indicating that the relative bioavailability of enalapril is not different between the formulations. With the use of a model-dependent approach, deeper insights have been gained into the serum concentration profiles of enalapril after administration of ODMTs compared with reference conventional tablets in healthy volunteers.
Ethics approval and informed consent
Approval for the trial protocol was given by the independent Ethics Committee of the University Hospitals KU Leuven and the study was conducted in accordance with the International Council on Harmonization (ICH) Tripartite Guideline on Good Clinical Practice.
Data sharing statement
The data are being subjected to further analysis by population PK modeling approach and are needed for further communication with regulatory authorities, and hence cannot be shared.
Acknowledgments
We acknowledge the following colleagues from the LENA consortium who also participated in the LENA project for performing the bioavailability study, including Prof Jan de Hoon, Dr Anne van Hecken, and Marissa Herbort, Center for Clinical Pharmacology, Catholic University Leuven, Belgium; Prof Dr Jörg Breitkreutz and Dr Wolfgang Wiedey, Ethicare GmbH, Germany; Dr Ingrid Klingmann and Lucie Spatenkova, Pharmaplex bvba, Belgium; Dr Florian Lagler and Dr Angelika Moder, Medizinische Privatuniversität (PMU) Salzburg, Austria; and Dr Feras Khalil, Heinrich-Heine Universität Düsseldorf, Germany. We thank Dr Anne van Hecken, Dr Ingrid Klingmann, and Prof Dr Jörg Breitkreutz for critical commenting on this manuscript. The project LENA is funded by a European Union Seventh Framework Program (FP7/2007–2013) under the grant agreement no 602,295. The research work was supported by a scholarship from Higher Education Commission (HEC), Pakistan in collaboration with the German Academic Exchange Program (DAAD), Germany. The grants for the presentation of the research work were awarded by Heine Research Academies (HERA) University of Dusseldorf.
Disclosure
The authors report no conflicts of interest in this work.
References
Ponikowski P, Voors AA, Anker SD, et al. 2016 ESC guidelines for the diagnosis and treatment of acute and chronic heart failure. Eur Heart J. 2016;37(27):2129–2200. | ||
Hsu DT, Pearson GD. Heart failure in children: Part I: history, etiology, and pathophysiology. Circ Heart Fail. 2009;2(1):63–70. | ||
Food and Drug Administration Modernization Act (FDAMA) of 1997. Food and Drug Administration Authority; 1997. Available from: https://www.gpo.gov/fdsys/pkg/PLAW-105publ115/pdf/PLAW-105publ115.pdf. Accessed August 20, 2018. | ||
Regulation (EC) No 1901/2006 of the European parliament and of the council. The European parliament and of the council of 12 December 2006. Available from: https://ec.europa.eu/health/sites/health/files/files/eudralex/vol-1/reg_2006_1901/reg_2006_1901_en.pdf. Accessed January 11, 2019. | ||
Nandi D, Rossano JW. Epidemiology and cost of heart failure in children. Cardiol Young. 2015;25(8):1460–1468. | ||
Fernandez E, Perez R, Hernandez A, Tejada P, Arteta M, Ramos JT. Factors and mechanisms for pharmacokinetic differences between pediatric population and adults. Pharmaceutics. 2011;3(1):53–72. | ||
Kearns GL, Abdel-Rahman SM, Alander SW, Blowey DL, Leeder JS, Kauffman RE. Developmental pharmacology – drug disposition, action, and therapy in infants and children. N Engl J Med. 2003;349(12):1157–1167. | ||
Beggs S, Thompson A, Nash R, Tompson A, Peterson G; 17th Expert Committee on the Selection and Use of Essential Medicines Geneva,. Cardiac failure in children; March 2009. Available from: https://www.who.int/selection_medicines/committees/expert/17/application/paediatric/Paed_Cardiac_Failure_Review.pdf. Accessed January 11, 2019. | ||
Burch M, Devlieger H, Garcia A, et al; European Medicines Agency. Report on the Expert Group Meeting of Paediatric Heart Failure, London 29 November 2010. Available from: https://www.ema.europa.eu/documents/other/report-expert-group-meeting-paediatric-heart-failure-london-29-november-2010_en.pdf. Accessed January 11, 2019. | ||
Lewis AB, Chabot M. The effect of treatment with angiotensin-converting enzyme inhibitors on survival of pediatric patients with dilated cardiomyopathy. Pediatr Cardiol. 1993;14(1):9–12. | ||
European Medicines Agency. Presentations; 2017. Available from: http://www.ema.europa.eu/ema/. Accessed August 20, 2018. | ||
Summary of product characteristics, SPC was annexed to the commission decision. CPMP/3175/03/2003:1–13. Available from: www.ema.europa.eu/docs/en_GB/document_library/Referrals_document/Renitec_30/WC500010751.pdf. Accessed August 20, 2018. | ||
Brion F, Nunn AJ, Rieutord A. Extemporaneous (magistral) preparation of oral medicines for children in European hospitals. Acta Paediatr. 2007;92(4):486–490. | ||
Lopez FL, Ernest TB, Tuleu C, Gul MO. Formulation approaches to pediatric oral drug delivery: benefits and limitations of current platforms. Expert Opin Drug Deliv. 2015;12(11):1727–1740. | ||
Batchelor HK, Marriott JF. Formulations for children: problems and solutions. Br J Clin Pharmacol. 2015;79(3):405–418. | ||
Stoltenberg I, Breitkreutz J. Orally disintegrating mini-tablets (ODMTs) – a novel solid oral dosage form for paediatric use. Eur J Pharm Biopharm. 2011;78(3):462–469. | ||
Wittlieb-Weber CA, Lin KY, Zaoutis TE, et al. Pediatric versus adult cardiomyopathy and heart failure-related hospitalizations: a value-based analysis. J Card Fail. 2015;21(1):76–82. | ||
World Health Organization. Report of the Informal Expert Meeting on Dosage Forms of Medicines for Children. 2008; December: 1–15. Available from: http://www.who.int/selection_medicines/committees/expert/17/application/pediatric/Dosage_form_reportDEC2008.pdf. Accessed August 20, 2018. | ||
EMEA. Guideline on pharmaceutical development of medicines for paediatric use guideline on pharmaceutical development of medicines for paediatric use. EMEA. 2013;44:1–23. | ||
HEALTH. 2013.4.2-1 – Investigator-driven clinical trials for off-patent medicines using innovative, age-appropriate formulations and/or delivery systems. Available from: https://cordis.europa.eu/programme/rcn/18549_en.html. Accessed August 13, 2018. | ||
FDA. Bioavailability and Bioequivalence Studies Submitted in NDAs or INDs – General Considerations (Draft); 2014. Available from: http://www.fda.gov/downloads/drugs/guidancecomplianceregulatoryinformation/guidances/ucm389370.pdf. Accessed August 20, 2018. | ||
Muir KT. Nonlinear least-squares regression analysis in pharmacokinetics: application of a programmable calculator in model parameter estimation. Comput Biomed Res. 1980;13(4):307–316. | ||
Kiers HAL. Weighted least squares fitting using ordinary least squares algorithms. Psychometrika. 1997;62(2):251–266. | ||
Motulsky H, Christopoulos A. Fitting models to biological data using linear and nonlinear regression. San Diego: GraphPad Software Inc.; 2005. | ||
Peck CC, Sheiner LB, Nichols AI. The problem of choosing weights in nonlinear regression analysis of pharmacokinetic data. Drug Metab Rev. 1984;15(1–2):133–148. | ||
Gabrielsson J, Weiner D. Pharmacokinetic Pharmacodynamics Data Analysis: Concepts and Applications. 3rd ed. Sweden: Swedish Academy of Pharmaceutical Sciences; 2000. | ||
Food and Drug Administration. Guidance for Industry: Bioanalytical Method Validation. US Dep Heal Hum Serv. 2001;(May):4–10. Available from: http://www.labcompliance.de/documents/FDA/FDA-Others/Laboratory/f-507-bioanalytical-4252fnl.pdf. Accessed August 20, 2018. | ||
Ich. ICH Topic Q2 (R1) Validation of Analytical Procedures: Text and Methodology. Int Conf Harmon. 2005;1994(November 1996):17. Available from: http://www.ich.org/fileadmin/Public_Web_Site/ICH_Products/Guidelines/Quality/Q2_R1/Step4/Q2_R1__Guideline.pdf. Accessed August 20, 2018. | ||
Matalka K, Arafat T, Hamad M, Jehanli A. Determination of enalapril and enalaprilat by enzyme linked immunosorbent assays: application to pharmacokinetic and pharmacodynamic analysis. Fundam Clin Pharmacol. 2002;16(3):237–244. | ||
Gu Q, Chen X, Zhong D, Wang Y. Simultaneous determination of enalapril and enalaprilat in human plasma by liquid chromatography-tandem mass spectrometry. J Chromatogr B Analyt Technol Biomed Life Sci. 2004;813(1–2):337–342. | ||
Hedaya MA. Basic Pharmacokinetics. 2nd ed. New York: Taylor & Francis Group; 2012. | ||
Portolés A, Puerro M, Terleira A, et al. A new high-absorption-rate paracetamol 500-mg formulation: a comparative bioavailability study in healthy volunteers. Curr Ther Res Clin Exp. 2003;64(7):401–411. | ||
Report T. Who expert Committee on specifications for pharmaceutical preparations. Annex 5; 2005. Available from: http://apps.who.int/iris/bitstream/handle/10665/272452/9789241210195-eng.pdf. Accessed August 20, 2018. | ||
Verbeeck RK, Kanfer I, Löbenberg R, et al. Biowaiver Monographs for immediate-release solid oral dosage forms: enalapril. J Pharm Sci. 2017;106(8):1933–1943. | ||
ClinicalTrials.gov. Ethicare GmbH: National Library of Medicine (US). 30/9/2014. Identifier NCT02252692, Relative bioavailability study with enalapril in healthy volunteers; 2014. Available from: https://clinicaltrials.gov/ct2/show/NCT02252692?spons=Ethicare&rank=4. Accessed August 20, 2018. | ||
Dokoumetzidis A, Macheras P. A century of dissolution research: from Noyes and Whitney to the Biopharmaceutics Classification System. Int J Pharm. 2006;321(1–2):1–11. | ||
Savic RM, Jonker DM, Kerbusch T, Karlsson MO. Implementation of a transit compartment model for describing drug absorption in pharmacokinetic studies. J Pharmacokinet Pharmacodyn. 2007;34(5):711–726. |
 © 2019 The Author(s). This work is published and licensed by Dove Medical Press Limited. The full terms of this license are available at https://www.dovepress.com/terms.php and incorporate the Creative Commons Attribution - Non Commercial (unported, v3.0) License.
By accessing the work you hereby accept the Terms. Non-commercial uses of the work are permitted without any further permission from Dove Medical Press Limited, provided the work is properly attributed. For permission for commercial use of this work, please see paragraphs 4.2 and 5 of our Terms.
© 2019 The Author(s). This work is published and licensed by Dove Medical Press Limited. The full terms of this license are available at https://www.dovepress.com/terms.php and incorporate the Creative Commons Attribution - Non Commercial (unported, v3.0) License.
By accessing the work you hereby accept the Terms. Non-commercial uses of the work are permitted without any further permission from Dove Medical Press Limited, provided the work is properly attributed. For permission for commercial use of this work, please see paragraphs 4.2 and 5 of our Terms.