")
Back to Journals » International Journal of Chronic Obstructive Pulmonary Disease » Volume 14
Mixed Phenotype of Emphysema and Airway Wall Thickening Is Associated with Frequent Exacerbation in Chronic Obstructive Pulmonary Disease Patients
Authors Lim JU , Kim EK , Lim SY , Lee JH , Lee JS , Lee SD, Oh YM , Rhee CK
Received 15 August 2019
Accepted for publication 17 December 2019
Published 30 December 2019 Volume 2019:14 Pages 3035—3042
DOI https://doi.org/10.2147/COPD.S227377
Checked for plagiarism Yes
Review by Single anonymous peer review
Peer reviewer comments 2
Editor who approved publication: Dr Richard Russell
Jeong Uk Lim,1 Eun Kyung Kim,2 Seong Yong Lim,3 Jin Hwa Lee,4 Jae Seung Lee,5 Sang-Do Lee,5 Yeon-Mok Oh,5 Chin Kook Rhee1 On behalf of the KOLD Study Group
1Division of Pulmonary, Allergy and Critical Care Medicine, Department of Internal Medicine, Seoul St. Mary’s Hospital, College of Medicine, The Catholic University of Korea, Seoul, South Korea; 2Department of Internal Medicine, CHA Bundang Medical Center, CHA University, Seongnam, Gyeonggi-do, South Korea; 3Division of Pulmonary and Critical Care Medicine, Department of Medicine, Kangbuk Samsung Hospital, Sungkyunkwan University School of Medicine, Seoul, South Korea; 4Division of Pulmonary and Critical Care Medicine, Department of Internal Medicine, College of Medicine, Ewha Womans University, Seoul, South Korea; 5Department of Pulmonary and Critical Care Medicine, Clinical Research Center for Chronic Obstructive Airway Diseases, Asan Medical Center, University of Ulsan College of Medicine, Seoul, South Korea
Correspondence: Chin Kook Rhee
Division of Pulmonary, Allergy and Critical Care Medicine, Department of Internal Medicine, Seoul St. Mary’s Hospital, College of Medicine, The Catholic University of Korea, 222, Banpo-daero Seocho-gu, Seoul 06591, Republic of Korea
Tel +82-2-2258-6067
Fax +82-2-599-3589
Email [email protected]
Objective: The presence of both emphysema and airway wall thickening determined via volumetric computed tomography (CT) is defined as mixed phenotype. The long-term clinical course of this phenotype has not been studied in depth. This study compared the mixed phenotype to other phenotypes of chronic obstructive pulmonary disease (COPD) patients.
Methods: COPD patients enrolled in the Korean Obstructive Lung Disease (KOLD) study from June 2005 to October 2015 were evaluated. The emphysema index and the percentage of bronchial mean wall area were calculated from volumetric CT scans. Patients with COPD were classified into four phenotypes using two cutoffs: emphysema index of 15% and median value of mean wall area (MWA%).
Results: Of 435 patients with COPD, 99 (22.8%) were defined as CT-normal type, 119 (27.4%) as emphysema-dominant type, 113 (26.0%) as airway-dominant type, and 104 (23.9%) as mixed type. The mixed phenotype showed the highest baseline total COPD Assessment Test (CAT) and St. George’s Respiratory Questionnaire (SGRQ) scores. Moreover, it had the highest proportion of patients experiencing exacerbation of COPD (50.0%), and had the lowest baseline FEV1. Lower BMI, GOLD stages III–IV, and mixed phenotype were significant factors associated with severe exacerbation frequency in univariate analyses. Multivariate analyses showed that lower BMI and CT phenotype were significant factors associated with severe exacerbation frequency. Compared to the CT-normal phenotype, the mixed phenotype was significantly associated with more frequent severe exacerbation (IRR 4.134, 95% CI: 1.135–15.057, P=0.031).
Conclusion: Patients with mixed phenotype are more symptomatic, have poorer pulmonary function, and are associated with more frequent severe exacerbation.
Keywords: COPD, emphysema, computed tomography, mixed phenotype
Plain Language Summary
Patients with mixed phenotype of emphysema and airway wall thickening are more symptomatic, have poorer pulmonary function, and are associated with more frequent severe exacerbation.
Introduction
Chronic obstructive pulmonary disease (COPD) is a heterogeneous disease entity with different clinical presentation, disease progression, and concurrent lung lesions.1 There has been a great deal of research regarding COPD phenotypes to allow more individualized clinical approaches for patients with COPD.
However, when only spirometry and clinical presentations are used, phenotyping of patients with COPD could be inaccurate.2 Quantitative computed tomography (CT), a noninvasive imaging technique, has recently been used to evaluate patients with COPD. This diagnostic modality can be used to find the structural abnormalities of the lungs in patients with COPD, which could influence the clinical outcomes.1 Furthermore, the American Thoracic Society and American College of Chest Physicians recommend using thoracic CT as an aid for phenotyping COPD.3 The combination of spirometry and quantitative CT enables more accurate phenotyping of COPD and will eventually contribute to more individualized treatment.
Among the various phenotyping attempts, defining emphysema-dominant versus airway-dominant groups has been an issue of clinical interest, because the two groups of COPD patients show distinct clinical characteristics.4 In previous studies, several CT parameters were found to have significant associations with each phenotype. In emphysema-dominant COPD, the extent of the emphysema is associated with the percentage of volume of low attenuation (LAV%) calculated from volumetric chest CT.5 On the other hand, increased airway wall thickness has been reported to be associated with chronic bronchitis in COPD.6 The clinical characteristics of these two phenotypes and their associations with quantitative CT parameters have been demonstrated in previous studies.5,6
In addition to emphysema-dominant and airway-dominant phenotypes, the mixed phenotype is defined as the presence of both emphysema and airway wall thickening.7,8 There have been a number of attempts to phenotype patients with mixed phenotype COPD using both quantitative CT and spirometry, and their clinical characteristics were initially described by Lee et al.7 A subsequent study demonstrated that the CT-defined mixed phenotype requires more hospitalizations and is more symptomatic compared to other CT-based phenotypes.9 Furthermore, the European Respiratory Society group has defined “emphysematous,” “airway-dominant,” “mixed,” and “mild” COPD groups based on standardized quantitative CT (QCT) indices.10 In a previous study, the mixed phenotype was characterized as the coexistence of upper lung predominant emphysema and airway wall thickening, and a group with such radiological characteristics was associated with more frequent exacerbations and hospitalizations.11
Nevertheless, the longitudinal clinical outcomes of patients with mixed phenotype COPD have not been evaluated in depth. Moreover, further research is necessary to define this phenotype before applying to the management of patients with COPD. This study compared baseline clinical characteristics and the longitudinal clinical course of the mixed phenotype to other CT-based phenotypes of COPD patients.
Materials and Methods
Patients
Patients with COPD enrolled in the Korean Obstructive Lung Disease study cohort recruited from pulmonary clinics from 16 hospitals in South Korea from June 2005 to October 2015 were evaluated. Patients with postbronchodilator forced expiratory volume in 1 second (FEV1)/forced vital capacity (FVC) <0.7 and with a smoking history of a minimum of 10 pack-years were diagnosed with COPD. Patients with evident lung parenchymal destruction or large lung mass from chest radiograph were excluded. In initial and follow-up evaluations, pulmonary function tests (PFTs) and CT scans were performed on the same day.
Written informed consent was obtained from each patient. The institutional review boards of the participating hospitals approved use of the clinical and imaging data for evaluation (i.e., Asan Medical Center, Bundang CHA Hospital, Ewha Womans University Mokdong Hospital, Korea University Anam Hospital, Hanyang University Guri Hospital, Inje University Ilsan Paik Hospital, Kangbuk Samsung Hospital, Hallym University Kangnam Sacred Heart Hospital, Kangwon National University Hospital, Seoul National University Hospital, Seoul National University Bundang Hospital, Ajou University Hospital, Konkuk University Hospital, The Catholic University of Korea Yeouido St Mary’s Hospital, The Catholic University of Korea Seoul St Mary’s Hospital, and the National Medical Center).
Clinical Parameters
Patient sex, age at enrollment, and baseline total COPD Assessment Test (CAT) and St. George’s Respiratory Questionnaire (SGRQ) scores were included in the analyses. COPD-related visits to the hospital and admissions were also longitudinally recorded during the cohort observation period. FEV1, FVC, and FEV1/FVC were evaluated from the results of the initial PFT. The diffusion capacity of the lungs for carbon monoxide (DLco) and 6 min walking distance (6MWD) at baseline were also evaluated.
Computed Tomography
Volumetric CT scans of all patients were performed at full inspiration and expiration using a 16-MDCT scanner (Somatom Sensation; Siemens Healthineers, Erlangen, Germany). The scans were performed craniocaudally with the patient in the supine position, and no intravenous contrast medium was used. Scan parameters included 0.75 mm collimation, 100 eff. mAs, and 140 kVp with a pitch of 1.0. The scale of attenuation coefficients ranged from –1024 to 3072 Hounsfield units (HUs). Using the soft kernel (B30f; Siemens Medical Systems), the images were reconstructed from the thoracic inlet to the lung base, and extracted automatically. Using in-house software, whole lung images were extracted, and the attenuation coefficient of each pixel was measured and calculated.12,13 Airway dimensions were measured at the site near the origin of four segmental bronchi (RB1, LB1 + 2, LB10, and RB10). In accordance with previous studies, the cut-off level dividing normal lung density and area of low attenuation was –950 HU.13–15
A modified sharpening filter with a 3×9×3 kernel size was used for more accurate airway measurement. The validation process using polyacrylic tubes was performed beforehand, and the software discriminated the airway lumen and the inner and outer boundaries of the airway wall automatically by the full-width-maximum method.14–16 Wall area (WA) percentage, which was defined as WA/(WA + lumen area (LA)) × 100, was measured in each segmental bronchus. The mean value of each dimension value was used for statistical analyses.
COPD Phenotyping Based on CT
The mean bronchial wall area and emphysema index (EI) were calculated from the volumetric CT images. Patients with COPD were classified into four phenotypes using two cutoffs: emphysema index of 15% and mean wall area percentage (MWA%).17,18 The median value of MWA% was 66.5% and was used as a cutoff for phenotyping. Patients with an EI lower than 15% and MWA% lower than the median value were categorized into the CT-normal phenotype group. Patients with an EI higher than 15% and MWA% lower than the median value were categorized into the emphysema-dominant phenotype. Patients with an EI lower than 15% and MWA% higher than the median value were categorized into the airway-dominant phenotype. Patients with an EI higher than 15% and MWA% higher than the median value were categorized into the mixed phenotype.
Overall Survival
Overall survival was defined as time duration between the date of cohort enrollment and the date of death. The last survival status of each patient was checked on April 26, 2018.
COPD Exacerbation
Severe COPD exacerbations, defined as exacerbations requiring emergency room visit or admission, were analyzed. COPD patients with exacerbation were defined as those who experienced at least one COPD exacerbation during the first observation year from the cohort enrollment. Only exacerbations during the first post-enrollment year were evaluated. Exacerbation analyses were performed using exacerbation data from the first year after enrollment, which were collected prospectively. Patients with a follow-up period of less than 1 year were excluded. We also evaluated clinical parameters at enrollment to determine the association with rate of severe exacerbations during the first year.
Statistical Analyses
All statistical analyses were performed using SPSS version 18.0 (SPSS Inc., Chicago, IL). Data of continuous variables are presented as mean ±SD. The chi-square test was used to compare categorical parameters. Continuous variables were analyzed using one-way analysis of variance (ANOVA). Patients’ overall survival was evaluated via Kaplan–Meier analyses and compared statistically between CT-defined phenotypes using the log rank test.
Binary logistic regression analyses were performed to assess the associations between risk factors and the occurrence of severe COPD exacerbations. Factors that were significant in univariate analyses were entered into multivariate analyses.
To evaluate factors associated with the rate of severe exacerbation, we used negative binomial regression to estimate the incidence rate ratios (IRRs), as there were a substantial number of patients without exacerbations. Significant risk factors from the unadjusted model were entered into multivariate analyses. In all analyses, P<0.05 was taken to indicate statistical significance.
Ethics Statement
This study was conducted in accordance with the Declaration of Helsinki.
Results
Clinical Characteristics
Table 1 shows the baseline clinical characteristics of the four CT-defined phenotypes. Of the 435 patients, 99 (22.8%) were defined as CT-normal type, 119 (27.4%) were defined as an emphysema-dominant type, 113 (26.0%) were defined as airway-dominant type, and 104 (23.9%) were defined as mixed type.
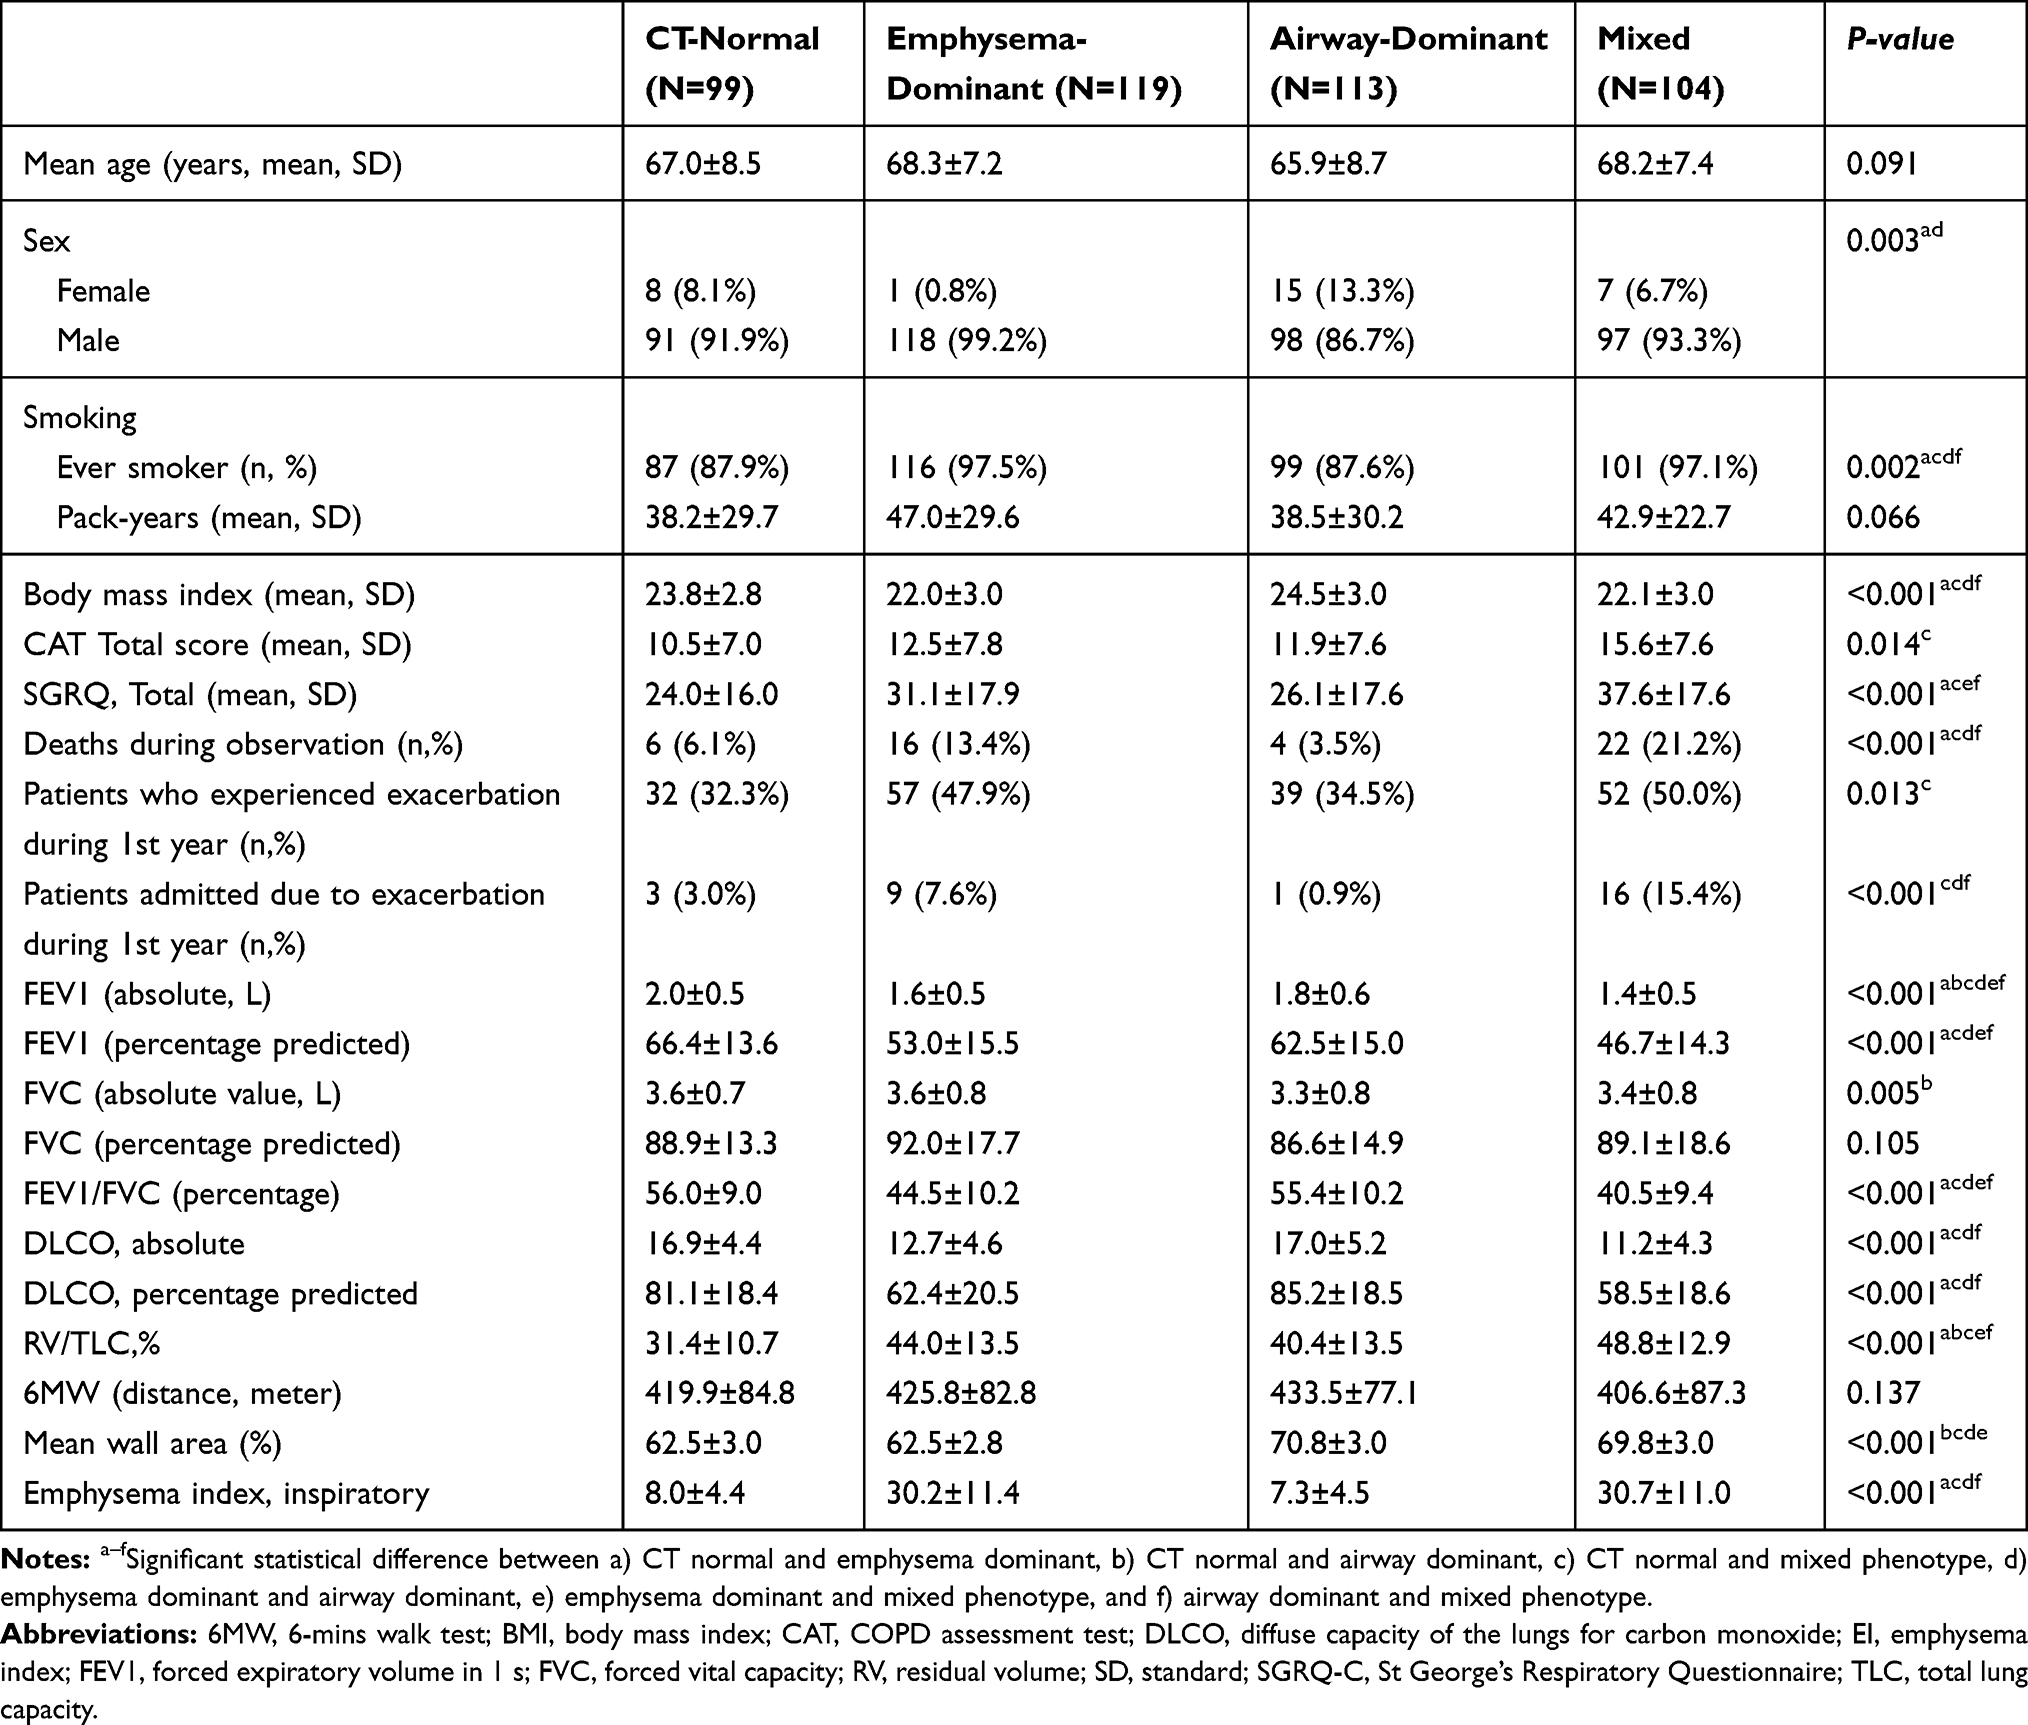 |
Table 1 Comparisons of Characteristics Among Four Computed Tomography-Based Phenotypes in 435 Patients with Chronic Obstructive Pulmonary Disease |
There were no significant differences in mean age between groups. The airway-dominant phenotype showed the highest proportion of female patients (13.3%). Nearly all of the patients with mixed and emphysema-dominant phenotypes had significant smoking histories (97.1% and 97.5%, respectively). The mean BMI was lower in the mixed phenotype group than in the CT-normal and airway-dominant groups (P<0.001). The mixed phenotype group had significantly higher baseline total CAT and SGRQ scores than the other phenotypes (15.6±7.6, P=0.014; and 37.6±17.6, P<0.001, respectively). That group also had the highest mortality rate (21.2%, P<0.001), the highest proportion of patients experiencing COPD exacerbation (50.0%, P=0.013), and the highest proportion of patients experiencing severe COPD exacerbation requiring admission (15.4%, P<0.001).
The patients in the mixed phenotype group had the lowest FEV1, both in absolute value and percentage. The mixed phenotype group also had the lowest FEV1/FVC, DLco (absolute value), and DLco (% predicted) (all P<0.001). RV/TLC, an index of air trapping, was highest in the mixed phenotype group (P<0.001).
Survival
Overall survival was compared between the four CT-defined phenotypes. The mean follow-up time of the overall patient population was 75.1 months (95% CI: 71.1–79.1 months). Kaplan–Meier curve analyses indicated a significant difference in overall survival among the groups (Figure 1). The mixed phenotype had the shortest mean overall survival (121.5 months, 95% CI: 112.2–130.9 months), while the airway-dominant phenotype had the longest (150.9 months, 95% CI: 145.7–156.2 months). The mixed type showed a statistically significant difference in overall survival when compared to the CT normal and the airway-dominant type. The airway-dominant type showed a significant difference when compared to the emphysema-dominant type, however, did not show significant difference when compared to the CT-normal type (Table 2). Multivariate analyses were performed for overall survival, but no significant associations were observed between shorter survival and CT-defined phenotypes.
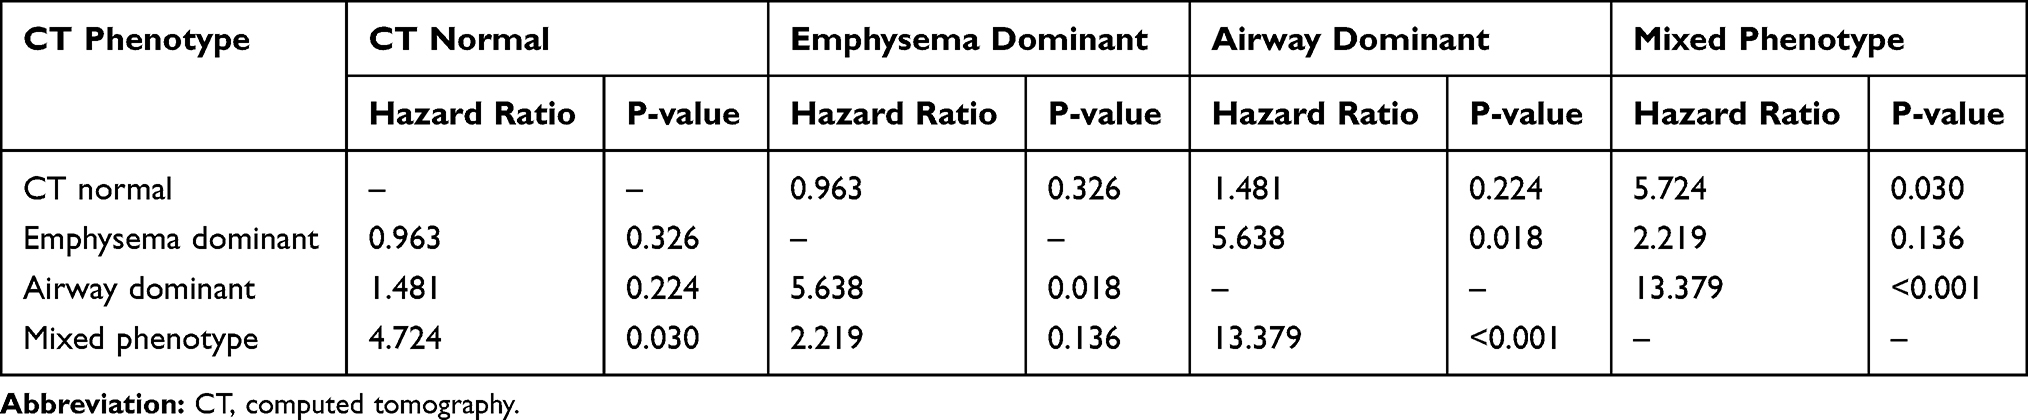 |
Table 2 Comparison of Mortality Risk Between the Different Types (Log Rank Test) |
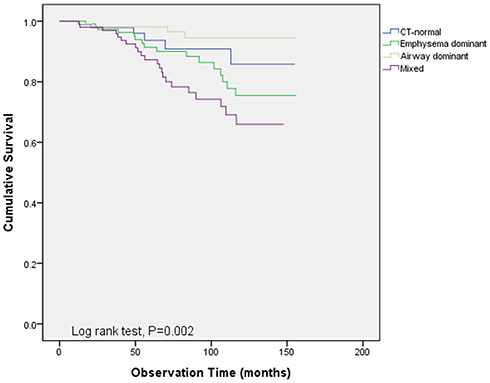 |
Figure 1 Overall survival was compared between the four CT-defined phenotypes. Kaplan–Meier curve analyses indicated significant differences among groups (P=0.002). |
Severe Exacerbation Frequency
Table 3 shows the results of analyses of factors associated with exacerbation frequency. Age, sex, GOLD stages, BMI, total CAT score, and CT-defined phenotypes were included in univariate analyses. Lower BMI, poor pulmonary function measured using GOLD stage, and mixed phenotype were significant factors associated with more frequent severe exacerbation of COPD. Significant factors in the unadjusted model were entered into multivariate analyses. Lower BMI was independently associated with more frequent severe exacerbation (IRR 0.843 per 1 kg/m2 increase, 95% CI: 0.744–0.954, P=0.007). Compared to the CT-normal phenotype, the mixed phenotype was associated with more frequent severe exacerbation (IRR 4.134, 95% CI: 1.135–15.057, P=0.031).
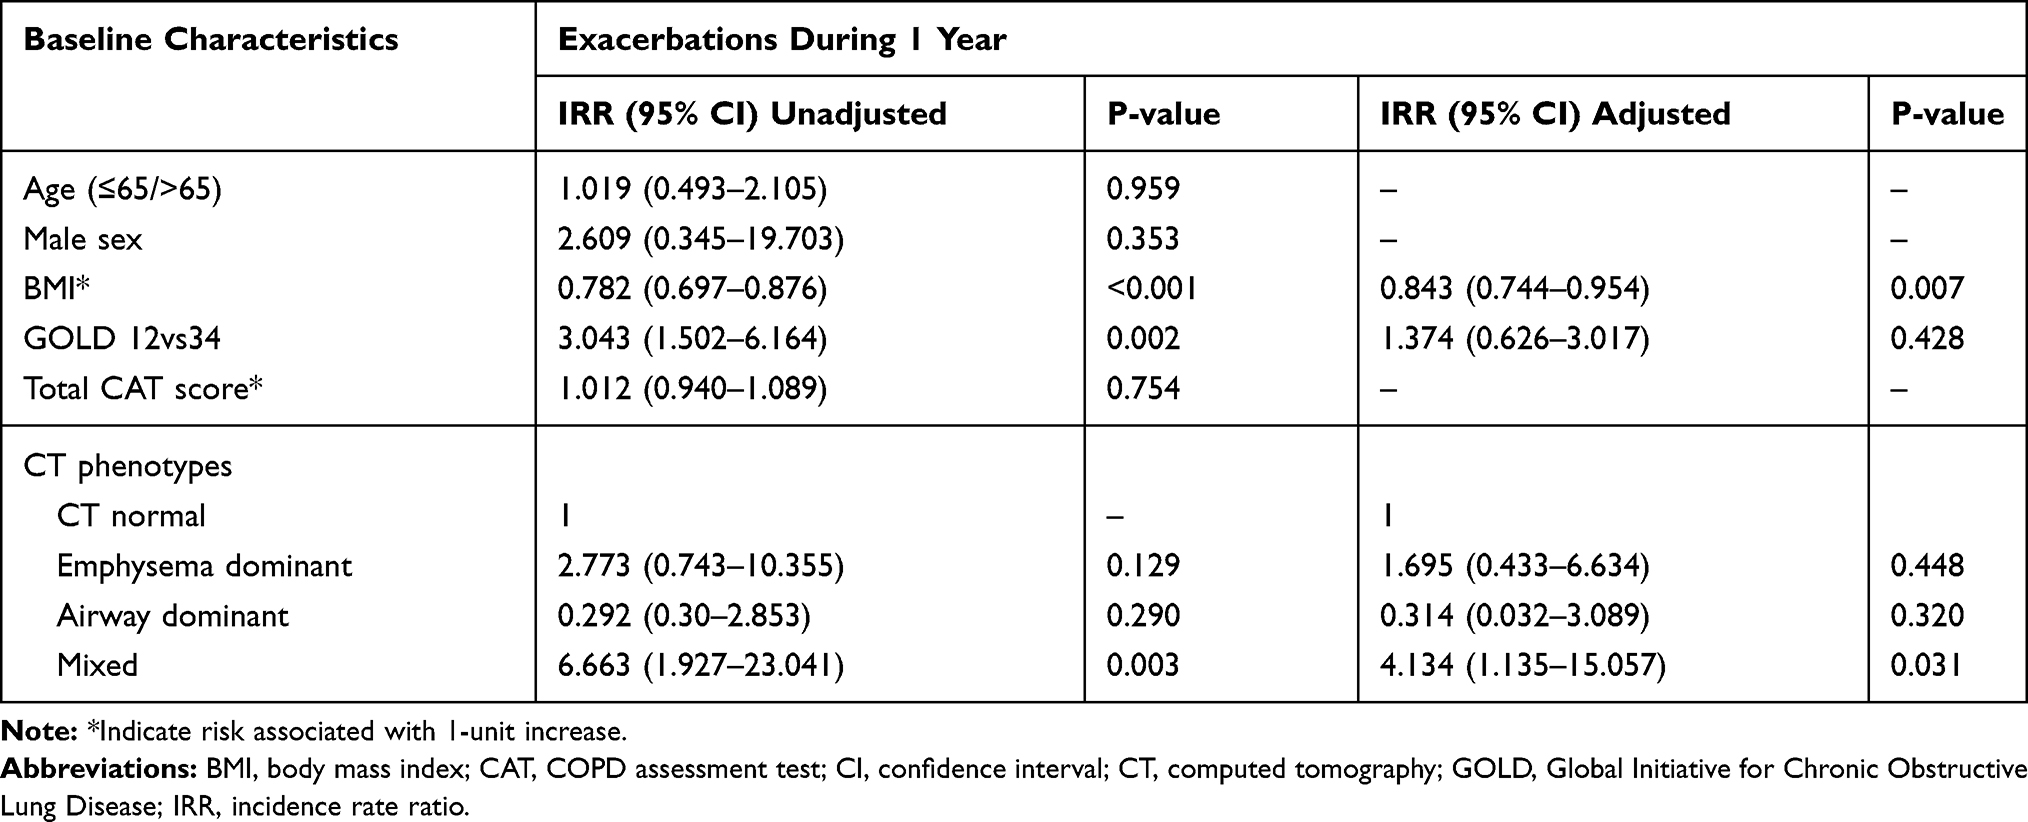 |
Table 3 Association of Patient Factors with Severe Exacerbations Frequency During 1st Post-enrolment Year |
Discussion
COPD patients with the mixed phenotype are more symptomatic, have poorer quality of life, and exhibit reduced pulmonary function compared to other phenotypes. Furthermore, the mixed phenotype was associated with more frequent severe COPD exacerbation.
With the lowest values of FEV1 and DLco, COPD patients with the mixed phenotype showed poorer pulmonary function. These results are consistent with a previous study that compared different COPD phenotypes.9 The clinical characteristics of the mixed phenotype in our study were similar to those of COPD patients with chronic bronchitis and low DLco. We previously found that patients with chronic bronchitis symptoms and low DLco are more symptomatic and are at higher risk for acute exacerbations than patients without CB or decreased DLco.19 A previous study that compared different COPD phenotypes demonstrated that FEV1, DLco, and BMI were significantly lower in a severe mixed phenotype than in other phenotypes.7 In line with these findings, we observed higher CAT scores and higher RV/TLC in the mixed phenotype in the present study.
We assumed that increased air trapping, chronic bronchitis, and small airway disease contributed to the poorer longitudinal clinical outcome and pulmonary functions in patients with mixed phenotype COPD compared to the emphysema-dominant phenotype. Patients with mixed phenotype had significantly lower FEV1 and higher RV/TLC than the emphysema-dominant phenotype. Increased RV/TLC is associated with small airway disease, frequent exacerbations of COPD, and increased mortality in patients with COPD.20–23 In addition, we assumed that the component of bronchial wall thickening was added to the emphysema component, which eventually contributed to poor outcome. Chronic bronchitis patients with COPD are characterized by airway wall thickening as detected via thoracic CT.6,14 Such patients are often more symptomatic and show more frequent exacerbations compared to patients without chronic bronchitis.24–27 Furthermore, MWA% is also correlated with small airway disease,10 and it may also have had a detrimental effect on COPD patients with mixed phenotype. We found that frequent exacerbations in the mixed phenotype may have led to increased mortality, consistent with previous studies.9,28
The definition of mixed phenotype in COPD can be variable. We applied EI for phenotyping the emphysema-dominant subgroup, and the MWA% for phenotyping the airway-dominant subgroup. Van Tho et al used the percentage of low attenuation area (%LAA) and internal perimeter of 10 mm (Pi10) for phenotyping subgroups,9 while Loh et al phenotyped patients using EI and postbronchodilator FEV1.8 Grouping mixed phenotype using quantitative CT usually involves the combination of CT parameters correlated with emphysema and chronic bronchitis in COPD. While LAA is associated with emphysema in COPD, airway wall thickening, manifested as Pi10 or MWA, is associated with chronic bronchitis.6,9,10
The strength of our study is the long observation time (median observation time 75 months). Due to the long study period, we could compare overall survival between the CT-based phenotypes. In the near future, when the observation time is extended, we will observe how the survival difference between the CT-based phenotype changes.
This study had some limitations. First, MWA% was used as a cutoff for phenotyping COPD patients, and application of this cutoff to other COPD populations is limited. However, there is as yet no clear cutoff for defining bronchial wall thickening, and MWA% was used for phenotyping the airway-dominant phenotype in a previous study.10 Furthermore, for airway wall thickness evaluation, only segmental bronchi were measured, and it is possible that severity of small airway disease was not reflected while phenotyping the study patients. Second, only severe COPD exacerbations were evaluated. Lastly, clinical features associated with chronic bronchitis were not evaluated comprehensively in this study, and should be discussed in a future study.
Conclusion
Patients with volumetric CT-defined mixed phenotype have poor pulmonary function and shorter overall survival as well as more frequent severe exacerbation than other phenotypes. The mixed phenotype is a subgroup of COPD with distinct clinical characteristics and prognosis. Various criteria should be applied to define the mixed phenotype in COPD.
Acknowledgment
We authors thank the members of the KOLD Study Group for the provision of the KOLD Cohort data (Obstructive Lung Disease Research Foundation http://www.oldrf.org)
Disclosure
Authors have no conflicts of interest in this work.
References
1. Han MK. Clinical correlations of computed tomography imaging in chronic obstructive pulmonary disease. Ann Am Thorac Soc. 2013;10(Suppl):S131–s137. doi:10.1513/AnnalsATS.201303-046AW
2. Agusti A, Calverley PM, Celli B, et al. Characterisation of COPD heterogeneity in the ECLIPSE cohort. Respir Res. 2010;11:122. doi:10.1186/1465-9921-11-122
3. Qaseem A, Wilt TJ, Weinberger SE, et al. Diagnosis and management of stable chronic obstructive pulmonary disease: a clinical practice guideline update from the American College of Physicians, American College of Chest Physicians, American Thoracic Society, and European Respiratory Society. Ann Intern Med. 2011;155(3):179–191. doi:10.7326/0003-4819-155-3-201108020-00008
4. Burrows B, Fletcher CM, Heard BE, Jones NL, Wootliff JS. The emphysematous and bronchial types of chronic airways obstruction. A clinicopathological study of patients in London and Chicago. Lancet. 1966;1(7442):830–835. doi:10.1016/S0140-6736(66)90181-4
5. Ogawa E, Nakano Y, Ohara T, et al. Body mass index in male patients with COPD: correlation with low attenuation areas on CT. Thorax. 2009;64(1):20–25. doi:10.1136/thx.2008.097543
6. Kim V, Davey A, Comellas AP, et al. Clinical and computed tomographic predictors of chronic bronchitis in COPD: a cross sectional analysis of the COPDGene study. Respir Res. 2014;15:52. doi:10.1186/1465-9921-15-52
7. Lee JH, Lee YK, Kim EK, et al. Responses to inhaled long-acting beta-agonist and corticosteroid according to COPD subtype. Respir Med. 2010;104(4):542–549. doi:10.1016/j.rmed.2009.10.024
8. Loh LC, Ong CK, Koo HJ, et al. A novel CT-emphysema index/FEV1 approach of phenotyping COPD to predict mortality. Int J Chron Obstruct Pulmon Dis. 2018;13:2543–2550. doi:10.2147/COPD.S165898
9. Van Tho N, Ogawa E, Trang LTH, et al. A mixed phenotype of airway wall thickening and emphysema is associated with dyspnea and hospitalization for chronic obstructive pulmonary disease. Ann Am Thorac Soc. 2015;12(7):988–996. doi:10.1513/AnnalsATS.201411-501OC
10. Subramanian DR, Gupta S, Burggraf D, et al. Emphysema- and airway-dominant COPD phenotypes defined by standardised quantitative computed tomography. Eur Respir J. 2016;48(1):92–103. doi:10.1183/13993003.01878-2015
11. Castaldi PJ, Dy J, Ross J, et al. Cluster analysis in the COPDGene study identifies subtypes of smokers with distinct patterns of airway disease and emphysema. Thorax. 2014;69(5):415–422. doi:10.1136/thoraxjnl-2013-203601
12. Lee JS, Ra SW, Chae EJ, et al. Validation of the lower limit of normal diffusing capacity for detecting emphysema. Respiration. 2011;81(4):287–293. doi:10.1159/000279757
13. Lee YK, Oh YM, Lee JH, et al. Quantitative assessment of emphysema, air trapping, and airway thickening on computed tomography. Lung. 2008;186(3):157–165. doi:10.1007/s00408-008-9071-0
14. Lim JU, Lee JH, Kim TH, et al. Alternative definitions of chronic bronchitis and their correlation with CT parameters. Int J Chron Obstruct Pulmon Dis. 2018;13:1893–1899. doi:10.2147/COPD.S164055
15. Gevenois PA, de Maertelaer V, De Vuyst P, Zanen J, Yernault JC. Comparison of computed density and macroscopic morphometry in pulmonary emphysema. Am J Respir Crit Care Med. 1995;152(2):653–657. doi:10.1164/ajrccm.152.2.7633722
16. Amirav I, Kramer SS, Grunstein MM, Hoffman EA. Assessment of methacholine-induced airway constriction by ultrafast high-resolution computed tomography. J Appl Physiol (1985). 1993;75(5):2239–2250. doi:10.1152/jappl.1993.75.5.2239
17. Boschetto P, Miniati M, Miotto D, et al. Predominant emphysema phenotype in chronic obstructive pulmonary. Eur Respir J. 2003;21(3):450–454. doi:10.1183/09031936.03.00048703
18. Orlandi I, Moroni C, Camiciottoli G, et al. Chronic obstructive pulmonary disease: thin-section CT measurement of airway wall thickness and lung attenuation. Radiology. 2005;234(2):604–610. doi:10.1148/radiol.2342040013
19. Lee HY, Kim JW, Lee SH, et al. Lower diffusing capacity with chronic bronchitis predicts higher risk of acute exacerbation in chronic obstructive lung disease. J Thorac Dis. 2016;8(6):1274–1282. doi:10.21037/jtd
20. Nishimura K, Izumi T, Tsukino M, Oga T. Dyspnea is a better predictor of 5-year survival than airway obstruction in patients with COPD. Chest. 2002;121(5):1434–1440. doi:10.1378/chest.121.5.1434
21. Budweiser S, Harlacher M, Pfeifer M, Jorres RA. Co-morbidities and hyperinflation are independent risk factors of all-cause mortality in very severe COPD. COPD. 2014;11(4):388–400. doi:10.3109/15412555.2013.836174
22. Shin TR, Oh YM, Park JH, et al. The prognostic value of residual volume/total lung capacity in patients with chronic obstructive pulmonary disease. J Korean Med Sci. 2015;30(10):1459–1465. doi:10.3346/jkms.2015.30.10.1459
23. Smith BM, Hoffman EA, Basner RC, Kawut SM, Kalhan R, Barr RG. Not all measures of hyperinflation are created equal: lung structure and clinical correlates of gas trapping and hyperexpansion in COPD: the Multi-Ethnic Study of Atherosclerosis (MESA) COPD study. Chest. 2014;145(6):1305–1315. doi:10.1378/chest.13-1884
24. Choi JY, Yoon HK, Park SJ, et al. Chronic bronchitis is an independently associated factor for more symptom and high-risk groups. Int J Chron Obstruct Pulmon Dis. 2016;11:1335–1341. doi:10.2147/COPD.S105516
25. Corhay JL, Vincken W, Schlesser M, Bossuyt P, Imschoot J. Chronic bronchitis in COPD patients is associated with increased risk of exacerbations: a cross-sectional multicentre study. Int J Clin Pract. 2013;67(12):1294–1301. doi:10.1111/ijcp.12248
26. de Oca MM, Halbert RJ, Lopez MV, et al. The chronic bronchitis phenotype in subjects with and without COPD: the PLATINO study. Eur Respir J. 2012;40(1):28–36. doi:10.1183/09031936.00141611
27. Yoo SH, Lee JH, Yoo KH, Jung KS, Rhee CK. Different pattern of chronic obstructive pulmonary disease assessment test score between chronic bronchitis and non-chronic bronchitis patients. Tuberc Respir Dis (Seoul). 2018;81(3):228–232. doi:10.4046/trd.2017.0088
28. Fujimoto K, Kitaguchi Y, Kubo K, Honda T. Clinical analysis of chronic obstructive pulmonary disease phenotypes classified using high-resolution computed tomography. Respirology. 2006;11(6):731–740. doi:10.1111/res.2006.11.issue-6
 © 2019 The Author(s). This work is published and licensed by Dove Medical Press Limited. The full terms of this license are available at https://www.dovepress.com/terms.php and incorporate the Creative Commons Attribution - Non Commercial (unported, v3.0) License.
By accessing the work you hereby accept the Terms. Non-commercial uses of the work are permitted without any further permission from Dove Medical Press Limited, provided the work is properly attributed. For permission for commercial use of this work, please see paragraphs 4.2 and 5 of our Terms.
© 2019 The Author(s). This work is published and licensed by Dove Medical Press Limited. The full terms of this license are available at https://www.dovepress.com/terms.php and incorporate the Creative Commons Attribution - Non Commercial (unported, v3.0) License.
By accessing the work you hereby accept the Terms. Non-commercial uses of the work are permitted without any further permission from Dove Medical Press Limited, provided the work is properly attributed. For permission for commercial use of this work, please see paragraphs 4.2 and 5 of our Terms.