")
Back to Journals » Cancer Management and Research » Volume 12
Mitochondrial Stress–Mediated Targeting of Quiescent Cancer Stem Cells in Oral Squamous Cell Carcinoma
Authors Saluja TS, Kumar V , Agrawal M, Tripathi A, Meher RK, Srivastava K, Gupta A , Singh A , Chaturvedi A , Singh SK
Received 12 March 2020
Accepted for publication 30 April 2020
Published 15 June 2020 Volume 2020:12 Pages 4519—4530
DOI https://doi.org/10.2147/CMAR.S252292
Checked for plagiarism Yes
Review by Single anonymous peer review
Peer reviewer comments 2
Editor who approved publication: Professor Rudolph Navari
Tajindra Singh Saluja,1 Vijay Kumar,2 Monika Agrawal,3 Abhilasha Tripathi,4 Rajesh Kumar Meher,5 Kamini Srivastava,1 Anurag Gupta,1 Anjana Singh,6 Arun Chaturvedi,2 Satyendra Kumar Singh1
1Stem Cell/Cell Culture Unit, Center for Advance Research, King George’s Medical University, Lucknow, Uttar Pradesh, India; 2Department of Surgical Oncology, King George’s Medical University, Lucknow, Uttar Pradesh, India; 3Department of Obstetrics & Gynecology, King George’s Medical University, Lucknow, Uttar Pradesh, India; 4Department of Pharmacology, King George’s Medical University, Lucknow, Uttar Pradesh, India; 5Department of Biotechnology and Bioinformatics, Sambalpur University, Sambalpur, Odisha, India; 6Department of Biochemistry, AIIMS, Rishikesh, Uttarakhand, India
Correspondence: Satyendra Kumar Singh
Stem Cell/Cell Culture Unit,Center for Advance Research, King George’s Medical University, Lucknow, Uttar Pradesh 226003, India
Tel +91 9415-204-356
Email [email protected]
Introduction: Despite improved therapeutics in oral squamous cell carcinoma (OSCC), tumor cells that are either quiescent and/or endowed with stem cell–like attributes usually survive treatment and recreate tumor load at relapse. Through this study, we aimed strategically to eliminate these stem cell–like cancer cells using a combination drug approach.
Methods: Primary cultures from 15 well–moderately differentiated OSCC were established, and the existence of cancer cells with stem cell–like characteristics using five cancer stem cell (CSC) specific markers — CD44, CD133, CD147, C166, SOX2 and spheroid assay was ascertained. Next, we assessed quiescence in CSCs under normal and growth factor–deprived conditions using Ki67. Among several gene signatures regulating quiescent cellular state, we evaluated the effect of inhibiting Dyrk1b in combination with topoisomerase II and histone deacetylase inhibitors in targeting quiescent CSCs. Multiple drug-effect analysis was carried out with CompuSyn software to determine combination-index values.
Results: We observed that CD44+CD133+ showed the highest level of SOX2 expression. CSCs showed varying degrees of quiescence, and inhibition of Dyrk1b decreased quiescence and sensitized CSCs to apoptosis. In the drug-combination study, Dyrk1b inhibitor was combined with topoisomerase II and histone deacetylase inhibitors to target quiescent CSCs. In combination, a synergistic effect was seen even at a 16-fold lower dose than IC50. Furthermore, combined treatment decreased glutathione levels and increased ROS and mitochondrial stress, leading to increased DNA damage and cytochrome c in CSCs.
Conclusion: We report marker-based identification of CSC subpopulations and synergy of Dyrk1b inhibitor with topoisomerase II and HDAC inhibitors in primary OSCC. The results provide a new therapeutic strategy to minimize quiescence and target oral CSCs simultaneously.
Keywords: oral cancer, cancer stem cells, drug combination, synergy, apoptosis
Introduction
Oral squamous cell carcinoma (OSCC) is an invasive head–neck malignancy with a 5-year survival rate of <50%. It is frequently associated with recurrences and locoregional and distant metastases. Although advances in therapeutic strategies have helped in achieving high rates of remission, sustaining disease-free status has been difficult to obtain. This is mainly due to intratumor heterogeneity, to which the major contributing factor is cancer stem cells (CSCs).1 Over the past decade, studies focusing on CSCs in tumors have been rolling in regularly to illustrate their role in tumor development and progression and the clinical implications of targeting these cells. It is now conceded that the existence of CSCs portends tumorigenic potential and therapeutic resistance and increases the likelihood of relapse. The ability to eliminate CSCs efficiently depends upon identification of their distinctive surface markers and optimal therapeutic strategies.2–4 However, CSCs cannot be defined based on the expression of a single specific marker,5 which makes cancer treatment even more challenging.
An additional challenge is slowly dividing or nondividing quiescent tumor cells.6 Increasing evidence suggests that cancer cells endowed with stem cell–like characteristics adopt a quiescent phenotype as a survival strategy. Several gene signatures, such as NR2F1, P21CDKN1A, PLK1, and DYRK1B, have been identified as regulating the quiescent cellular state.7 Either their expression or inactivation is critical in governing transition between cell proliferation and quiescence. A member of the Dyrk family of protein kinases, Dyrk1b is a druggable target regulating G0/G1–S phase transition. Dyrk1b confers a survival advantage to transformed and untransformed cells by modifying cell-cycle regulators and helping to maintain them in a quiescent (G0) state.8 It is expressed at low levels in most tissue types and is transcriptionally upregulated in quiescent cells.9 It modulates the cell cycle by preventing degradation of p27, while it destabilizes cyclin D and promotes its proteolysis.10,11 Therefore, inhibition of Dyrk1b would force quiescent tumor cells into the cell cycle, providing opportunity to target them efficiently.
In this study, we evaluated the effect of the topoisomerase II inhibitor (Topo-i) mitoxantrone (MX) and histone deacetylase inhibitor (HDAC-i) mocetinostat (MO) with the Dyrk1b inhibitor (Dyrk1b-i) AZ191 (AZ). Topo-i is known to inflict damage to rapidly proliferating cells by intercalating in DNA. In combination treatment, Dyrk1b inhibition would bring cells into the cycle, while Topo-i would target these proliferating cells. Furthermore, we also evaluated the combined effect of inhibiting Dyrk1b and HDAC, as HDAC modulates expression of several genes, particularly cell-cycle regulators and tumor suppressors. Given the antitumor effects of inhibiting HDAC alone in solid tumors provides limited therapeutic benefits,12,13 its use as part of combination treatment could be more effective. We established primary cultures from histopathologically diagnosed cases of OSCC and evaluated the expression of CSC-specific surface markers2 — CD44, CD133, CD147, and CD166 — and the pluripotent stem-cell marker SOX2. Thereafter, we investigated the effect of Dyrk1b-i with Topo-i and HDAC-i in targeting oral CSCs. This combination approach showed synergistic effects and promising results in OSCC.
Methods
Primary Cell Culture
This study was approved by the Institutional Ethics Committee (1057) of King George’s Medical University, Lucknow, India. Written informed consent was obtained from all participants included in the study prior to collection of tumor tissue. Single-cell suspensions from tumor samples were prepared as described previously.14,15 Briefly, tumor samples were collected in sterile Dulbecco’s PBS (Sigma–Aldrich, USA). Connective tissue was carefully removed and tumorous parts minced to obtain 1–2mm3 tissue, followed by enzymatic dissociation. The digested tissue was filtered through a cell strainer. Single-cell suspensions were suspended in MEM supplemented with 10% FBS (Fisher Scientific), 0.5% amphotericin B, and 1% penicillin–streptomycin and cultured in a humidified incubator at 37°C with 5% CO2. Media were changed every 3–4 days and cells passaged at 85%–90% confluence.
Assessing Expression of CSC Markers
After establishment of cultures, the epithelial nature of primary OSCC cells was determined between passages 1 and 3 by staining with the epithelial cell marker pancytokeratin (pan-CK) (Exbio, Czech Republic). Briefly, after trypsinization 2×10⁵ cells were fixed using a fixation/permeabilization solution kit (CytofixCytoperm; BD Biosciences, USA) for 20 mins at 4°C. Cells were washed twice in BD Perm/Wash buffer and stained with pan-CK antibody overnight at 4°C. The next day, cells were washed twice with BD Perm/Wash buffer before flow-cytometry analysis.
Subpopulations of CSCs were labeled using fluorochrome-conjugated antibodies — CD44 PE-Cy7, CD133 BV421, CD147 BV510, CD166 Alexa Fluor 647 (BD Biosciences) and the pluripotent stem-cell marker SOX2 PE (BioLegend, USA). Briefly, 2×10⁵ primary OSCC cells were stained with aforementioned CD-marker antibodies for 60 minutes in the dark on ice. After staining for surface markers, cells were washed with staining buffer (PBS with 1% BSA) and stained with anti-SOX2.
Ki67 Expression under Normal and Serum-Deprived Conditions
Under normal conditions (serum 10%), cells were seeded at a density of 3×10⁴ cells/well in 12-well flat-bottom tissue culture–treated plates. After 24 hours, staining for CSC surface-marker antibodies and purified mouse anti-Ki67 tagged with Alexa Fluor 488 (BD Biosciences) was carried out to assess the difference in Ki67 expression in the whole cancer-cell population and CSC subpopulation. Thereafter, we sought to evaluate the effect of serum deprivation (2%) and Dyrk1b inhibition on Ki67 expression. At 24 hours after cell seeding, cells were deprived of serum, and AZ at IC20 concentration was added for 36–48 hours before Ki67 staining.
Cell-Viability Assay and Drug-Combination Analysis
Sulforhodamine B assay16 was used to assess the cytotoxicity of drugs. Optical density was measured with a SpectraMax M5e (Molecular Devices, USA). Percentage cell growth was calculated as (absorbance sample/absorbance control) × 100. Percentage cell-growth inhibition was calculated as 100 – % cell growth. Tumor cells were initially exposed to individual drugs — MX, MO, and AZ (Cayman Chemical, USA) — to determine half–maximal inhibitory concentration (IC50), followed by combination treatment. Experiments were carried out in non-constant ratio combinations, where AZ was kept at constant IC20 and IC40 concentrations, while concentrations of MX and MO varied from four fold higher to 16-fold lower concentrations of IC50. The effect of drug combinations was evaluated using CompuSyn version 1.0 (ComboSyn, Paramus, NJ, USA) and combination index (CI) values calculated for each concentration of drug interaction to determine synergy (CI < 1.0), additive effect (CI = 1.0–1.1) or antagonism (CI > 1.1).17,18
Spheroid Assay
Tumor spheroid–formation assay19 was carried out to evaluate the effect of drug combinations. Initially, single-cell suspensions of primary OSCC culture were prepared as described earlier. After determination of cell density, an equal number of cells (2,000 cells/well) in 500 µL medium was seeded in 12-well ultralow-attachment plates (Corning Life Sciences, USA). After 24 hours, IC25 values of MX and MO with AZ IC10 were added. Number, size, and quality of spheroids were assessed under inverted microscopy after 5–7 days.
γH2AX and Apoptosis Assays
Apoptosis was determined using an annexin V–FITC apoptosis-detection kit (Sigma-Aldrich, USA) according to the manufacturer’s instructions. Apoptotic index values for CSCs were calculated as percentage of apoptotic cells divided by total number of cells.20 Cells were seeded in 12-well flat-bottom tissue culture–treated plates at a density of 3×10⁴ cells/well. After 24 hours, MX and MO IC50 were added alone and in combination with AZ IC20. After treatment, cells were trypsinized and stained with surface-marker antibodies. Thereafter, cells were suspended in binding buffer and incubated with annexin V–FITC conjugate for 20 minutes in the dark at room temperature before conducting flow cytometry. Nuclear sites of DNA damage were evaluated with γH2AX expression21 for DNA double-strand breaks using Alexa Fluor 488–conjugated purified mouse anti-H2AX (BD Biosciences). After staining with surface-marker antibodies, staining for γH2AX was performed.
Measurement of Mitochondrial Activity, Reactive Oxygen Species, and Cytochrome c Levels
Primary OSCC cells were exposed to drugs for 24 hours and stained with (a) MitoTracker deep red 25 nm for 20 minutes, (b) JC1 (mitochondrial membrane–potential probe) 2 µm for 30 minutes, (c) ThiolTracker violet (glutathione-detection reagent) 2 µm for 20 minutes, and (d) CellRox deep red (cellular oxidative stress detection) 2.5 µm for 30 minutes, as per the manufacturer’s instructions (Thermo Fisher Scientific). Cells were washed with PBS and analyzed immediately. Levels of cytochrome c were assessed at 24 hours after combination treatment using anti–cytochrome c antibody (BioLegend).
Flow-Cytometry Acquisition and Analysis
Data acquisition for CSC markers, Ki67 expression, apoptosis analysis, γH2AX expression, and measurement of mitochondrial membrane potential, glutathione, ROS, and mitochondrial mass were done with an FACSAria III cytometer (BD) and analyzed with FlowJo version 10 (Tree Star, USA).
Statistical Evaluation
Statistical significance for differences among groups was determined by unpaired t-tests. p≤0.05 was considered statistically significant.
Results
Immunophenotypic Characterization of Oral CSCs
The adherent culture of primary OSCC cells exhibited a characteristic epithelial morphology. Their epithelial nature was demonstrated by positive staining with pan-CK (Figure 1A). Thereafter, we did marker-based characterization of stem cell–like cancer populations. All cases showed moderate–high expression for CD44, while expression for other markers (CD133, CD147, and CD166) varied from mild to moderate. As CD44 expression is known to be an important regulator of cancer stemness,22–24 we analyzed the expression of Sox2 in CD44+ cells. Only a small percentage of cells coexpressed CD44 and Sox2. Further, we gated CD133+, CD147+, and CD166+ cells from CD44+ cells and assessed expression of Sox2 in double-positive (CD44+CD133+, CD44+CD166+, CD44+CD147+) cells. Interestingly, we found that the percentage of cells expressing Sox2 was higher in double-positive cells than CD44+ cells alone. CD44+CD133+ cells showed the highest expression for Sox2, followed by CD44+CD166+ and CD44+CD147+ (Figure 1B).
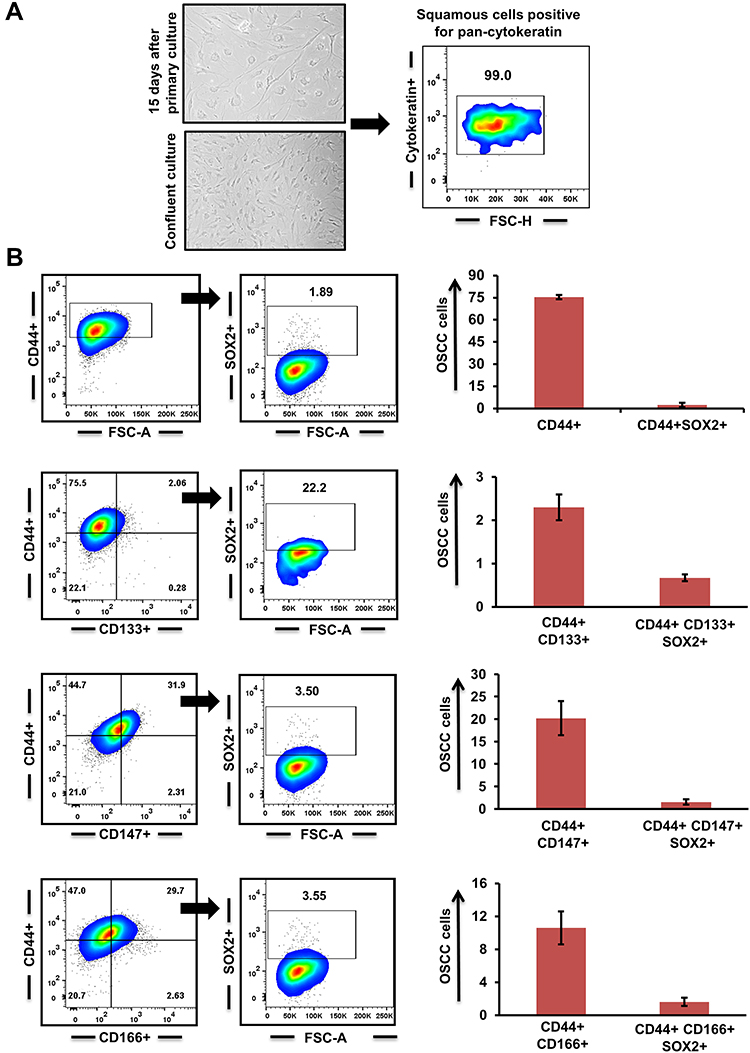 |
Figure 1 Cancer stem cells (CSCs) in primary oral squamous-cell carcinoma (OSCC) (n=15). (A) Primary culture of OSCC cells and characterization of their epithelial lineage with pancytokeratin. (B) Surface markers CD44, CD133, CD147, and CD166 used to identify CSC population and Sox2 expression in double-positive (CD44+CD133+; CD44+CD147+; CD44+CD166+) tumor cells. |
Exit from Quiescence Post–AZ Treatment
Coexpression analysis of CSC subpopulations was carried out with Ki67 for analyzing the fraction of cells present in the active phase of the cell cycle. We observed that within the entire population, Ki67 was predominantly expressed in CD44+CD133+ cells compared to CD44+CD147+ and CD44+CD166+ subpopulations (Figure 2A). Further, we encouraged quiescence by serum starvation (2% for 36–48 hours) and added AZ to half the serum-deprived wells. Percentages of quiescent cells in serum-starved culture with and without AZ were demonstrated by negative labeling of Ki67. We observed that a significant percentage of CSCs (p≤0.05) exited quiescence when Dyrk1b was inhibited (Figure 2B). On serum deprivation, approximately 60% of CD44+CD133+ cells exhibited a decrease in Ki67 expression, while 74% of CD44+CD147+ and 43% of CD44+CD166+ cells showed a quiescent phenotype. On the other hand, when under similar conditions Dyrk1b was inhibited, only around 32% of CD44+CD133+, 27% of CD44+CD147+, and 35% of CD44+CD166+ cells showed negative labeling for Ki67. These data suggest that inhibiting Dyrk1b activity in OSCC may help to overcome the main barrier of quiescence in effective elimination of CSCs.
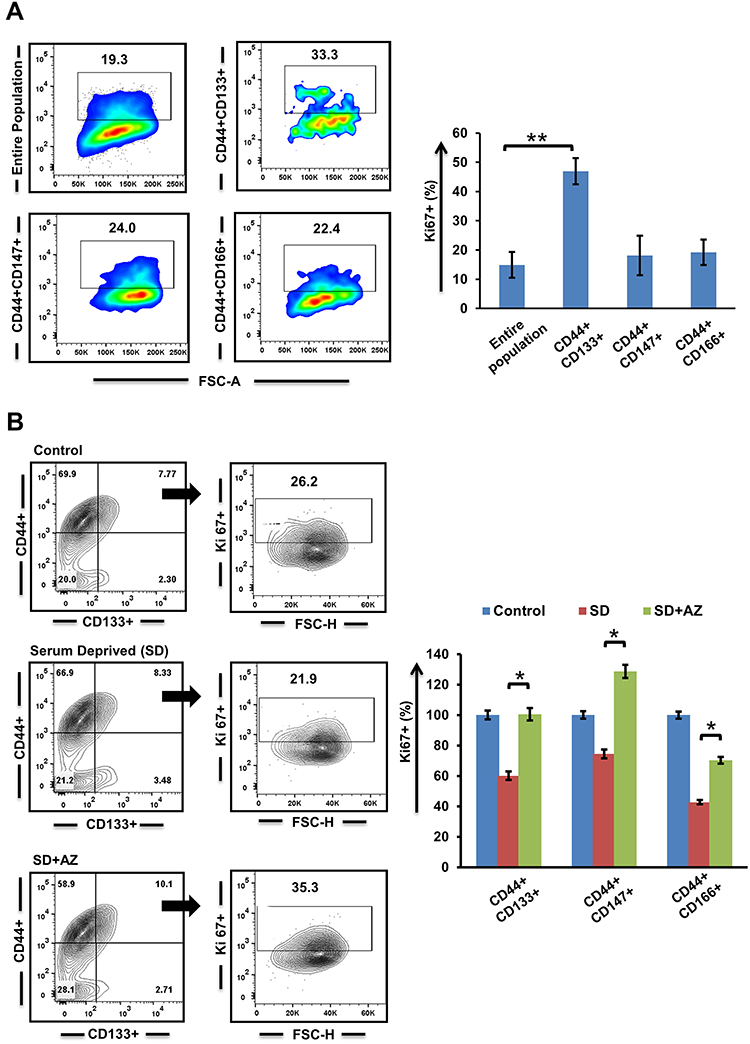 |
Figure 2 Evaluation of quiescence in cancer stem cells n (A) normal and (B) growth factor–deprived conditions post–Dyrk1b inhibition (n=4). *p≤0.05; **p≤0.01. |
Dyrk1b Inhibitor Synergized with Topoisomerase II and HDAC Inhibitors
We investigated the effect of each drug alone and in combination. Primary OSCC cells displayed considerable response to MX and MO. Approximate IC50 of MX and MO was 0.33µM and 4.5µM, respectively, while that of AZ was 10.9µM (Supplementary Figure 1A). After determining effects of individual drugs, interaction between MX and MO with AZ IC20 and IC40 was evaluated (https://www.dovepress.com/get_supplementary_file.php?f=252292.docx; Figure 3, A and B).
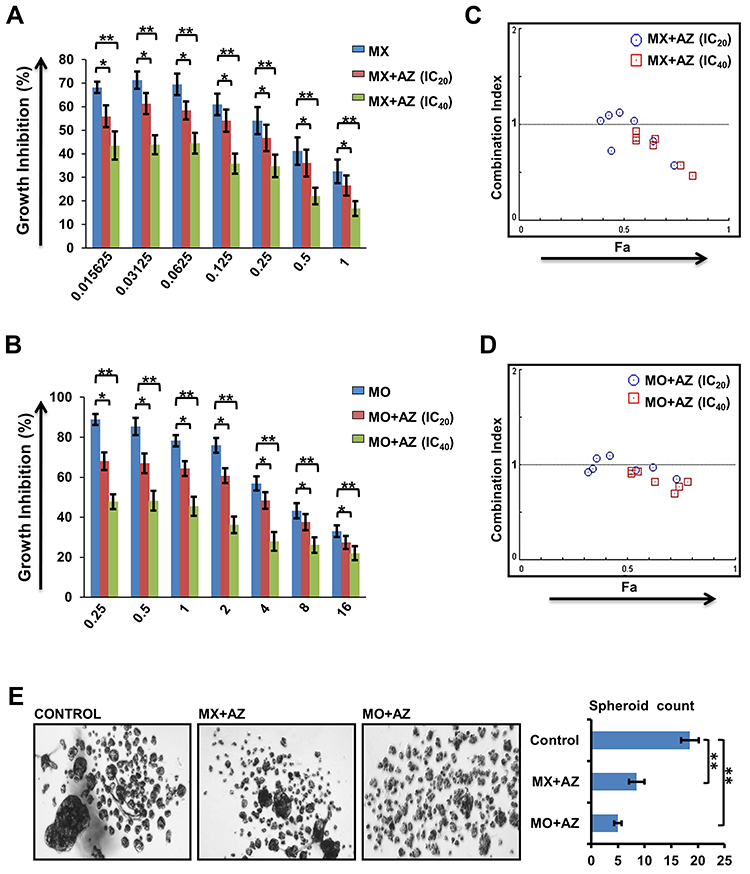 |
Figure 3 Dyrk1b inhibitors synergized with topoisomeraseII and HDAC inhibitors (n=10). (A) Growth inhibition of primary oral squamous-cell carcinoma (OSCC) cells treated with mitoxantrone (MX) + AZ191 (AZ) and (B) mocetinostat (MO) + AZ. (C) Results of drug–drug interaction for MX-AZ and (D) MO-AZ evaluated using the combination index; values <1.0, 1.0–1.1, and >1.1 indicate synergy, additive effect, and antagonism respectively. (E) Spheroid-forming efficiency of OSCC cells on combination treatment. *p≤0.05; **p≤0.01. |
The sensitivity of primary OSCC cells to MX and MO increased considerably when combined with AZ. Potent anti-proliferation effects were seen even at doses <IC50 for MX and MO. Analysis of the combined effect was performed using CompuSyn software based on the median-effect principle. The representative Fa-CI plot for the combination effect is illustrated in Figure 3, C and D. The effect of combination was additive to synergistic (CI < 1.1) with AZ IC20 (p≤0.05), while strong synergy was evident with AZ IC40 (p≤0.01).
The effect of drug combinations was evaluated in tumor spheroid–formation assays, a method for determining the number of CSCs. We observed a significant decrease in number (p≤0.01) and size of spheroids following combination treatment compared to controls. Spheroid-formation efficiency decreased by two- and three fold on combination treatment with MX (IC25) + AZ (IC10) and MO (IC25) + AZ (IC10), respectively. (Figure 3E).
Combination Treatment Enhanced DNA Double-Strand Breaks and Apoptosis
Initially, we evaluated the effect of Dyrk1b inhibition alone, and found that Dyrk1b-i (IC20) sensitized oral CSCs to apoptosis (Figure 4, A and B). Thereafter, to gain insight into the increased cell death evident on drug combination, we examined changes in γH2AX, the surrogate marker of DNA damage. As illustrated in Figure 4C, the percentage of γH2AX+ CSCs was higher in combination treatment than each drug alone (p≤0.05). DNA damage increased approximately 1.3- to 2.3-fold on combination. In the presence of DNA damage, apoptosis ensues if damage is beyond repair. Accordingly, we monitored the apoptotic response of CSCs by flow cytometry post–annexin V staining. Representative data for the apoptotic index are shown in Figure 4D. Treatment with MX and MO for 24 hours increased the proportion of apoptotic cells, and this increase was significantly high (p≤0.05) on combination with AZ. The increase was 1.4- to two fold higher on combination treatment. Further, apoptosis increased considerably with time (72 hours, data not shown). This indicates that drug combinations induced chemosensitivity in CSCs, elucidated in part by an increase in DNA double-strand breaks, resulting in increased apoptosis. These data are indirectly consistent with the synergistic effect seen in growth inhibition.
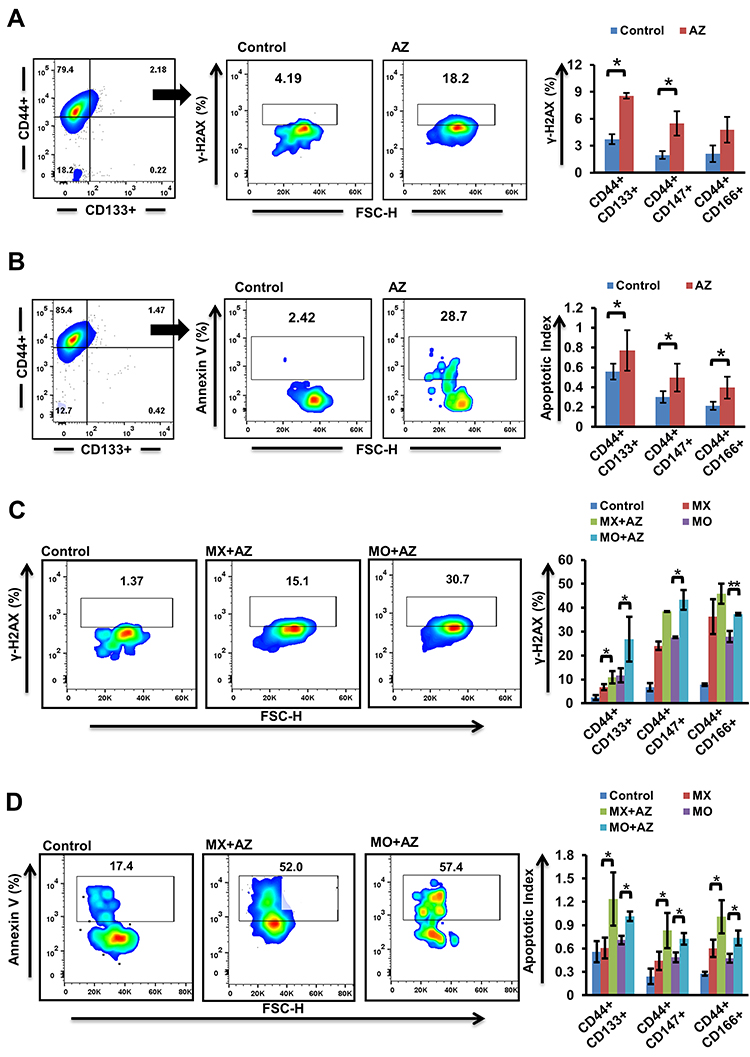 |
Figure 4 Effect of Dyrk1b inhibition and combination treatment (n=4). (A) Increase in γH2AX and (B) apoptosis in cancer stem cells (CSCs) 24 hours after Dyrk1b inhibition. (C) Changes seen in expression of γH2AX after 24 hours’ treatment with mitoxantrone (MX), mocetinostat (MO), and combinations (MX+AZ191, MO+AZ191). (D) Analysis of apoptosis in CSCs treated with MX, MO, MX+AZ, and MO+AZ. The percentage of apoptotic cells was evaluated using annexin V staining, and the apoptotic index was determined. *p≤0.05 and **p≤0.01. |
Combination Treatment Increased Mitochondrial Stress
ROS are essential mediators in myriad biological processes, playing a dual role in physiological functions where an increase in ROS is detrimental to cell survival. Therefore, a delicate balance between intracellular ROS levels and ROS-defence mechanisms is required for tumor development and progression. As combined treatment suppressed tumor-cell proliferation, we examined mitochondrial functioning by assessing parameters impacting mitochondrial function. Combination of MX and MO with AZ showed reduced mitochondrial biogenesis compared to MX and MO alone, but the results were not significant (p>0.05, Figure 5A). Increased mitochondrial stress in CSCs indicated by increased mitochondrial membrane depolarization (p≤0.05) was observed on combination treatment (Supplementary Figures 2A and 5B). We further demonstrated that drug combinations triggered ROS production (p≤0.05) and decreased levels of reduced thiols (p≤0.05) with ThiolTracker violet staining (Supplementary Figure 2B, Figure 5, C and D). Thereupon, an increase in cytochrome C (p≤0.01) post–combination treatment was observed (Figure 5E). Collectively, these data shows that the combination approach enhanced mitochondrial stress and induced death in oral CSCs.
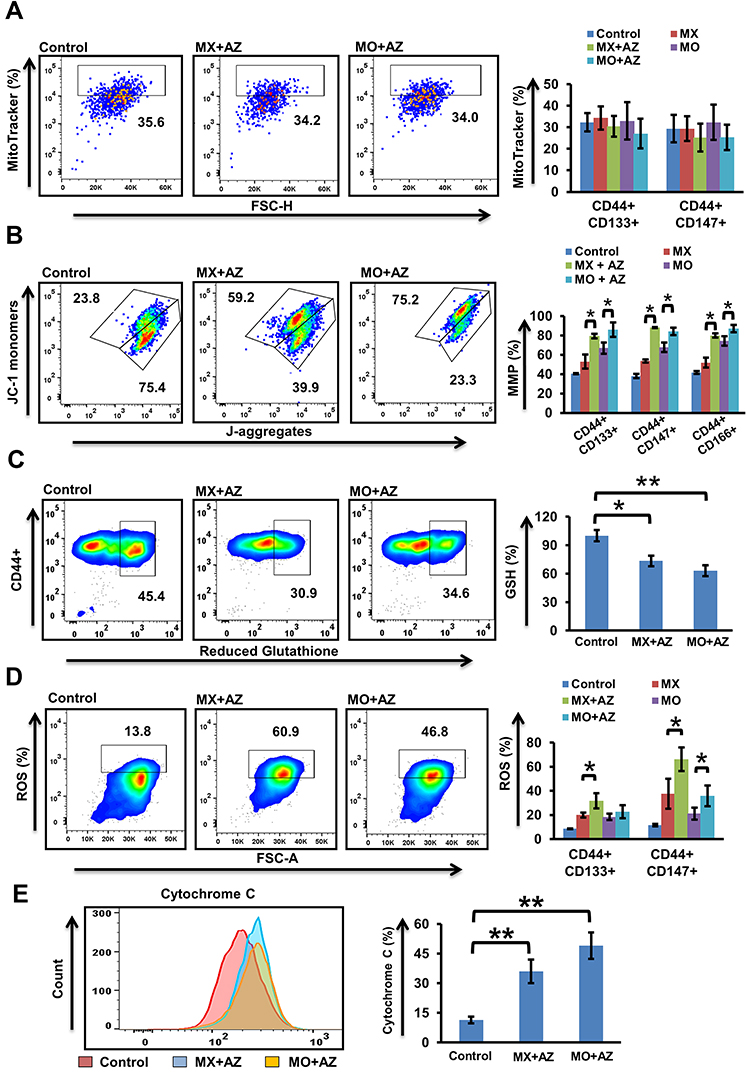 |
Figure 5 Quantification of mitochondrial stress (n=4). (A) Mitochondrial content in CSCs after 24 hours’ treatment with mitoxantrone (MX), mocetinostat (MO), and combinations (MX+AZ191, MO+AZ191) using MitoTracker deep red. (B) Mitochondrial membrane potential in CSCs using JC1 dye was assessed after 24 hours’ treatment with MX, MO, MX+AZ191, and MO+AZ191. JC1 ratio =([%green)/(%green+%red]) × 100. (C) Intracellular glutathione levels determined using ThiolTracker violet in primary OSCC cells after 24 hours’ combination treatment (MX+AZ191 and MO+AZ191). (D) ROS expression in CSCs using CellRox deep red following drug treatment. (E) Effect of combination treatment on cytochrome c levels. *p≤0.05; **p≤0.01. |
Efficient Targeting of Sox2+ Cancer Stem Cells
Accumulating evidence suggests SOX2 plays an indispensable role in mediating tumor progression and therapy resistance. As such, targeting Sox2+ cancer cells may potentially lead to better survival prospects. We evaluated DNA damage and cytochrome c levels in Sox2+ cancer cells post–combination treatment. Significant increases in γH2AX expression and cytochrome c levels in Sox2+ cells (p≤0.01) compared to double-positive CSCs were observed (Figure 6, A and B; Supplementary Figure 3).
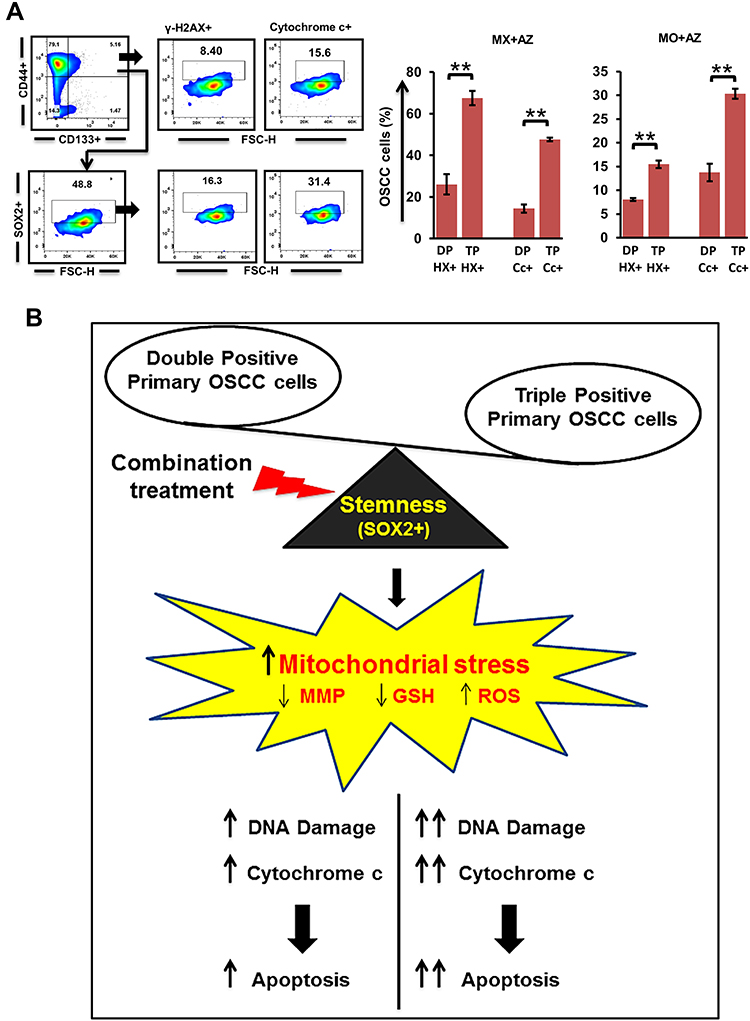 |
Figure 6 Quantification of DNA damage in Sox2+ cancer stem cells (CSCs; n=3). (A) γH2AX and cytochrome c levels in triple-positive (CD44+CD133+Sox2+) cells compared to double-positive tumor cells. (B) Mechanism model of our combination approach to target oral CSCs. **p≤0.01. Abbreviations: DP, double-positive (CD44+CD133+); TP, triple-positive (CD44+CD133+Sox2+); HX, γH2AX; Cc- Cytochrome c. |
Discussion
CSCs possess tumor-initiating ability and are critical in the development of metastasis and recurrence. Their role in mediating drug resistance is one of the main reasons for therapy failure.25–27 The existence of CSCs in malignancies like colorectal cancer, prostate cancer, gliomas, pancreatic cancer, and breast and lung carcinoma28–31 have been associated with chemoresistance and poor prognosis. Through this study, we immunophenotypically characterized putative CSCs in OSCC based on the expression of known CSC-specific markers2–4,32 and the undifferentiated cell marker SOX2, and showed that inhibiting Dyrk1b in combination with known drugs is therapeutically relevant.
We selected multiple markers, as no individual marker can be used universally for identifying CSCs.5,32,33 Primary OSCC cells were positive for CD44, CD133, CD147, and CD166, though the percentage varied slightly among cases. The expression of SOX2, a transcription factor that helps several stem cells in maintaining stemness and is usually upregulated in tumor cells with stem cell–like traits,4,34 was significantly high in double-positive CSCs. Among double-positive CSCs, CD44+CD133+ cells showed the highest expression of SOX2 (29.1±9.6). This further strengthened our approach of identifying an enriched population of oral CSCs, as CD133 is a known stem-cell marker and its expression usually associated with poor prognosis.35–39
The major hurdle in cancer treatment is effective elimination of slowly dividing quiescent tumor cells, which show limited chemotherapeutic sensitivity, as majority of drugs are cell cycle–dependent. We found that in serum-deprived conditions, CSCs became more quiescent. However, under similar conditions, treatment with Dyrk1b-i showed a significant decrease in quiescence (p≤0.05). This finding provided a compelling rationale for further investigation into the effect of combining Dyrk1b-i and chemotherapeutic drugs with different modus operandi. We observed that the combination of Dyrk1b-i with Topo-i and HDAC-i showed synergistic activity (p≤0.01), and this effect was evident even at 16-fold lower IC50. We studied non-constant drug-ratio combinations, and both MX and MO showed significant synergy in combination with AZ. Furthermore, drug combinations markedly increased DNA damage in CSCs (p≤0.05). This is an encouraging finding, as combination treatments aim to minimize therapeutic resistance. We found that this combination approach was effective in targeting CSCs by disrupting mitochondrial function.
CSCs maintain ROS levels within limits as a function of the antioxidant system, of which the critical reducing agent is glutathione (GSH). Increased GSH has been implicated in chemotherapy resistance. Several studies have demonstrated that CSC survival depends largely on antioxidant machinery, and interference with their cellular antioxidant system is potentially detrimental.40,41 As such, an effective way to target CSCs is to synergize the cytotoxicity of ROS-producing chemotherapeutic drugs. Drugs used in the current study enhanced loss of mitochondrial membrane potential and modulated ROS production (p≤0.05). The combination of AZ with MX led to >50% increase in membrane depolarization, while its combination with MO resulted in approximately 28%, 24%, and 17% additional loss of mitochondrial membrane potential in CD44+CD133+, CD44+CD166+, and CD44+CD147+ cells, respectively. Addition of AZ also enhanced ROS production in CSCs. An increase of nearly 30% in ROS was found in CD44+CD133+ and 56% in CD44+CD147+ cells. The present study also evinced significant depletion in levels of GSH (p≤0.05) on combination treatment. Therefore, the underlying mechanism involved mitochondrial dysfunction and subsequent release of cytochrome c to cytosol, leading to apoptosis of oral CSCs. Altogether, our findings may thus be an avenue to treatment of oral cancer with combination therapy.
In conclusion, we report marker-based identification of CSC subpopulations and synergy of Dyrk1b inhibitors with topoisomerase II and HDAC inhibitors in primary OSCC. Through our drug-combination strategy, it is also possible to target quiescent CSCs. We showed that when Dyrk1b was inhibited, it allowed CSCs to acquire a proliferating cellular state, revealed by increased Ki67 expression. Importantly, apart from conferring proliferation, Dyrk1b inhibition simultaneously sensitized cancer cells to apoptosis. This means that its combination with Topo-i and HDAC-i manifested a dual effect, targeting both quiescent and proliferating tumor cells simultaneously.
With the ever-changing landscape of cancer, the development and trials of new drugs are growing rapidly. Combination studies provide a platform to identify drug candidates for a possible clinically relevant synergistic effect. The results of our study are vindication for additional exploration of drug combinations in the clinical setting to reduce the likelihood of developing tumor relapse. Future studies need to focus on identifying those targets for combination treatment that minimize tumor drug resistance and simultaneously provide optimum therapeutic benefits.
Abbreviations
CSCs, cancer stem cells; OSCC, oral squamous cell carcinoma; Dyrk1b-i, Dyrk1b inhibitor; Topo-i, topoisomerase II inhibitor; HDAC-i, histone deacetylase inhibitor; pan-CK, pancytokeratin; MX, mitoxantrone; MO, mocetinostat; AZ, AZ191; ROS, reactive oxygen species; GSH, glutathione.
Data Sharing Statement
The data for the current study are available from the corresponding author on reasonable request.
Funding
The work was supported by Department of Health Research, New Delhi, India [R.12014/08/2017-HR].
Disclosure
The authors declare that they have no competing interests in this work.
References
1. Hartner L. Chemotherapy for oral cancer. Dent Clin. 2018;62(1):87–97. doi:10.1016/j.cden.2017.08.006
2. Shang W, Zhang Q, Huang Y, et al. Cellular plasticity–targeted therapy in head and neck cancers. J Dent Res. 2018;97(6):654–664. doi:10.1177/0022034518756351
3. Chen J, Li Y, Yu TS, et al. A restricted cell population propagates glioblastoma growth after chemotherapy. Nature. 2012;488(7412):522–526. doi:10.1038/nature11287
4. Boumahdi S, Driessens G, Lapouge G, et al. SOX2 controls tumour initiation and cancer stem-cell functions in squamous-cell carcinoma. Nature. 2014;511(7508):246–250. doi:10.1038/nature13305
5. Zapperi S, La Porta CA. Do cancer cells undergo phenotypic switching? The case for imperfect cancer stem cell markers. Sci Rep. 2012;2(1):1–7. doi:10.1038/srep00441
6. Izuishi K, Kato K, Ogura T, Kinoshita T, Esumi H. Remarkable tolerance of tumor cells to nutrient deprivation: possible new biochemical target for cancer therapy. Cancer Res. 2000;60(21):6201–6207.
7. Zhang J, Si J, Gan L, et al. Research progress on therapeutic targeting of quiescent cancer cells. Artif Cells Nanomed Biotechnol. 2019;47(1):2810–2819. doi:10.1080/21691401.2019.1638793
8. Friedman E. Mirk/Dyrk1B in cancer. J Cell Biochem. 2007;102(2):274–279. doi:10.1002/jcb.21451
9. Deng X, Mercer SE, Sun CY, Friedman E. The normal function of the cancer kinase Mirk/dyrk1B is to reduce reactive oxygen species. Genes Cancer. 2014;5(1–2):22. doi:10.18632/genesandcancer.1
10. Besson A, Gurian-West M, Chen X, Kelly-Spratt KS, Kemp CJ, Roberts JM. A pathway in quiescent cells that controls p27Kip1 stability, subcellular localization, and tumor suppression. Genes Dev. 2006;20(1):47–64. doi:10.1101/gad.1384406
11. Zou Y, Ewton DZ, Deng X, Mercer SE, Friedman E. Mirk/dyrk1B kinase destabilizes cyclin D1 by phosphorylation at threonine 288. J Biol Chem. 2004;279(26):27790–27798. doi:10.1074/jbc.M403042200
12. Suraweera A, O’Byrne KJ, Richard DJ. Combination therapy with histone deacetylase inhibitors (HDACi) for the treatment of cancer: achieving the full therapeutic potential of HDACi. Front Oncol. 2018;8:92. doi:10.3389/fonc.2018.00092
13. Newbold A, Falkenberg KJ, Prince HM, Johnstone RW. How do tumor cells respond to HDAC inhibition? FEBS J. 2016;283(22):4032–4046. doi:10.1111/febs.13746
14. Mitra A, Mishra L, Li S. Technologies for deriving primary tumor cells for use in personalized cancer therapy. Trends Biotechnol. 2013;31(6):347–354. doi:10.1016/j.tibtech.2013.03.006
15. Turin I, Schiavo R, Maestri M, et al. In vitro efficient expansion of tumor cells deriving from different types of human tumor samples. Med Sci. 2014;2(2):70–81. doi:10.3390/medsci2020070
16. Vichai V, Kirtikara K. Sulforhodamine B colorimetric assay for cytotoxicity screening. Nat Protoc. 2006;1(3):1112. doi:10.1038/nprot.2006.179
17. Chou TC. Drug combination studies and their synergy quantification using the Chou-Talalay method. Cancer Res. 2010;70(2):440–446. doi:10.1158/0008-5472.CAN-09-1947
18. Temmink OH, Hoebe EK, Van der Born K, Ackland SP, Fukushima M, Peters GJ. Mechanism of trifluorothymidine potentiation of oxaliplatin-induced cytotoxicity to colorectal cancer cells. Br J Cancer. 2007;96(2):231–240. doi:10.1038/sj.bjc.6603549
19. Nunes AS, Barros AS, Costa EC, Moreira AF, Correia IJ. 3D tumor spheroids as in vitro models to mimic in vivo human solid tumors resistance to therapeutic drugs. Biotechnol Bioeng. 2019;116(1):206–226. doi:10.1002/bit.26845
20. Prieto A, Díaz D, Barcenilla H, et al. Apoptotic rate: a new indicator for the quantification of the incidence of apoptosis in cell cultures. Cytometry. 2002;48(4):185–193. doi:10.1002/cyto.10132
21. Ivashkevich A, Redon CE, Nakamura AJ, Martin RF, Martin OA. Use of the γ-H2AX assay to monitor DNA damage and repair in translational cancer research. Cancer Lett. 2012;327(1–2):123–133. doi:10.1016/j.canlet.2011.12.025
22. Yan Y, Zuo X, Wei D. Concise review: emerging role of CD44 in cancer stem cells: a promising biomarker and therapeutic target. Stem Cells Transl Med. 2015;4(9):1033–1043. doi:10.5966/sctm.2015-0048
23. Trapasso S, Allegra E. Role of CD44 as a marker of cancer stem cells in head and neck cancer. Biologics. 2012;6:379. doi:10.2147/BTT.S37906
24. Ajani JA, Song S, Hochster HS, Steinberg IB. Cancer stem cells: the promise and the potential. Semin Oncol. 2015;42:S3–S17. doi:10.1053/j.seminoncol.2015.01.001
25. Mellor HR, Ferguson DJ, Callaghan R. A model of quiescent tumour microregions for evaluating multicellular resistance to chemotherapeutic drugs. Br J Cancer. 2005;93(3):302–309. doi:10.1038/sj.bjc.6602710
26. Jerjes W, Upile T, Petrie A, et al. Clinicopathological parameters, recurrence, locoregional and distant metastasis in 115 T1-T2 oral squamous cell carcinoma patients. Head Neck Oncol. 2010;2(1):9. doi:10.1186/1758-3284-2-9
27. Agliano A, Calvo A, Box C. The challenge of targeting cancer stem cells to halt metastasis. Semin Cancer Biol. 2017;44:25–42. doi:10.1016/j.semcancer.2017.03.003
28. Thapa R, Wilson GD. The importance of CD44 as a stem cell biomarker and therapeutic target in cancer. Stem Cells Int. 2016;2016. doi:10.1155/2016/2087204
29. Jang JW, Song Y, Kim SH, Kim J, Seo HR. Potential mechanisms of CD133 in cancer stem cells. Life Sci. 2017;184:25–29. doi:10.1016/j.lfs.2017.07.008
30. Toole BP. The CD147‐HYALURONAN axis in cancer. Anat Rec. 2019. doi:10.1002/ar.24147
31. Dalerba P, Dylla SJ, Park IK, et al. Phenotypic characterization of human colorectal cancer stem cells. Proc Natl Acad Sci USA. 2007;104(24):10158–10163. doi:10.1073/pnas.0703478104
32. Saluja TS, Ali M, Mishra P, Kumar V, Singh SK. Prognostic value of cancer stem cell markers in potentially malignant disorders of oral mucosa: a meta-analysis. Cancer Epidemiol Prev Biomarkers. 2019;28(1):144–153. doi:10.1158/1055-9965.EPI-18-0672
33. Quintana E, Shackleton M, Foster HR, et al. Phenotypic heterogeneity among tumorigenic melanoma cells from patients that is reversible and not hierarchically organized. Cancer Cell. 2010;18(5):510–523. doi:10.1016/j.ccr.2010.10.012
34. Novak D, Hüser L, Elton JJ, Umansky V, Altevogt P, Utikal J. SOX2 in development and cancer biology. Semin Cancer Biol. 2019. doi:10.1016/j.semcancer.2019.08.007
35. Abdelrahman AE, Ibrahim HM, Elsebai EA, Ismail EI, Elmesallamy W. The clinicopathological significance of CD133 and Sox2 in astrocytic glioma. Cancer Biomark. 2018;23(3):391–403. doi:10.3233/CBM-181460
36. Han S, Huang T, Wu X, et al. Prognostic value of CD133 and SOX2 in advanced cancer. J Oncol. 2019;2019:1–12. doi:10.1155/2019/3905817
37. Yu CC, Hu FW, Yu CH, Chou MY. Targeting CD133 in the enhancement of chemosensitivity in oral squamous cell carcinoma–derived side population cancer stem cells. Head Neck. 2016;38(S1):E231–E238. doi:10.1002/hed.23975
38. Zhang Q, Shi S, Yen Y, Brown J, Ta JQ, Le AD. A subpopulation of CD133+ cancer stem-like cells characterized in human oral squamous cell carcinoma confer resistance to chemotherapy. Cancer Lett. 2010;289(2):151–160. doi:10.1016/j.canlet.2009.08.010
39. Wu Y, Wu PY. CD133 as a marker for cancer stem cells: progresses and concerns. Stem Cells Dev. 2009;18(8):1127–1134. doi:10.1089/scd.2008.0338
40. Diehn M, Cho RW, Lobo NA, et al. Association of reactive oxygen species levels and radioresistance in cancer stem cells. nature. 2009;458(7239):780–783. doi:10.1038/nature07733
41. Estrela JM, Ortega A, Obrador E. Glutathione in cancer biology and therapy. Crit Rev Clin Lab Sci. 2006;43(2):143–181. doi:10.1080/10408360500523878
 © 2020 The Author(s). This work is published and licensed by Dove Medical Press Limited. The full terms of this license are available at https://www.dovepress.com/terms.php and incorporate the Creative Commons Attribution - Non Commercial (unported, v3.0) License.
By accessing the work you hereby accept the Terms. Non-commercial uses of the work are permitted without any further permission from Dove Medical Press Limited, provided the work is properly attributed. For permission for commercial use of this work, please see paragraphs 4.2 and 5 of our Terms.
© 2020 The Author(s). This work is published and licensed by Dove Medical Press Limited. The full terms of this license are available at https://www.dovepress.com/terms.php and incorporate the Creative Commons Attribution - Non Commercial (unported, v3.0) License.
By accessing the work you hereby accept the Terms. Non-commercial uses of the work are permitted without any further permission from Dove Medical Press Limited, provided the work is properly attributed. For permission for commercial use of this work, please see paragraphs 4.2 and 5 of our Terms.