")
Back to Journals » Cancer Management and Research » Volume 12
MiTF is Associated with Chemoresistance to Cisplatin in A549 Lung Cancer Cells via Modulating Lysosomal Biogenesis and Autophagy
Authors Li W, Qin X, Wang B , Xu G, Zhang J , Jiang X, Chen C , Qiu F, Zou Z
Received 1 April 2020
Accepted for publication 2 July 2020
Published 29 July 2020 Volume 2020:12 Pages 6563—6573
DOI https://doi.org/10.2147/CMAR.S255939
Checked for plagiarism Yes
Review by Single anonymous peer review
Peer reviewer comments 2
Editor who approved publication: Dr Chien-Feng Li
Wei Li,1,* Xia Qin,1,* Bin Wang,2 Ge Xu,2 Jun Zhang,2 Xuejun Jiang,3 Chengzhi Chen,4,5 Feng Qiu,1 Zhen Zou2,5
1Department of Pharmacy, The First Affiliated Hospital of Chongqing Medical University, Chongqing 400016, People’s Republic of China; 2Institute of Life Sciences, Chongqing Medical University, Chongqing 400016, People’s Republic of China; 3Center of Experimental Teaching for Public Health, Experimental Teaching and Management Center, Chongqing Medical University, Chongqing 400016, People’s Republic of China; 4Department of Occupational and Environmental Health, School of Public Health and Management, Chongqing Medical University, Chongqing 400016, People’s Republic of China; 5Dongsheng Lung-Brain Diseases Joint Lab, Chongqing Medical University, Chongqing 400016, People’s Republic of China
*These authors contributed equally to this work
Correspondence: Zhen Zou; Feng Qiu Email [email protected]; [email protected]
Background: Non-small cell lung carcinoma (NSCLC) is often fatal; advanced NSCLC has a 5-year survival rate less than 20%. Platinum-based chemotherapy, in particular, cis-diamminedichloroplatinum (II) (cisplatin or DDP), is employed for the treatment of NSCLC; however, the drug resistance occurs frequently. Autophagy is defined as the process of intracellular degradation of cytoplasmic materials in the lysosome; however, the correlation between autophagy and drug resistance remains controversial. Herein, we investigated the correlation between autophagy and cisplatin resistance and also explored the underlying mechanisms.
Methods and Results: We demonstrated that DDP-resistant NSCLC A549 (A549/DDP) cells had higher autophagy activity in comparison with its parental A549 cells; DDP treatment induced a time- and dose-dependent decrease of autophagy. Intriguingly, inhibition of autophagy with pharmacological drugs or knockdown of ATG5 or Beclin-1 aggravated cell death induced by DDP treatment, indicating that autophagy played protective roles during DDP treatment. Further mechanistic investigation revealed that DDP treatment could decrease the mRNA expression level of key autophagy-related genes, such as ATG5, Beclin-1, and ATG7, suggesting DDP repressed autophagy at the transcriptional level. The MiTF/TFE family (including TFEB, TFE3, TFEC, and MiTF) were involved in nutrient sensing and organelle biogenesis, and specifically, the lysosomal biogenesis. We found that only MiTF was dramatically decreased upon DDP treatment, and also a profound decrease of lysosomal markers, LAMP-1 or LAMP-2, suggesting that MiTF was involved in the modulation of lysosomal biogenesis and, consequently, the autophagy. Moreover, the knockdown of MiTF resulted in more severe cell death in A549/DDP cells, indicting the substantial correlation between MiTF and cisplatin chemoresistance.
Conclusion: Our study provides novel insights into the association between MiTF and DDP chemoresistance in NSCLC cells, and suggests targeting MiTF and/or autophagy might be a potential strategy for the reversal of DDP chemoresistance for NSCLC treatment.
Keywords: cisplatin, NSCLC, chemoresistance, autophagy, MiTF
Introduction
More than one million cases of lung cancer are diagnosed each year and lung cancer is still the most common cause of cancer-related mortality worldwide.1 Non-small-cell lung carcinoma (NSCLC) is any type of epithelial lung cancer and accounts for about 85% of all lung cancers. Platinum-based drugs, and in particular cis-diamminedichloroplatinum (II) (cisplatin or DDP), are employed for the treatment of a wide array of solid malignancies, including non-small cell lung cancer (NSCLC). NSCLCs are relatively insensitive to chemotherapy, compared to small cell carcinoma. Although early diagnosis and novel therapeutic approaches have markedly prolonged the overall survival of patients with NSCLC, advanced NSCLC has a 5-year survival rate around 10%, chemotherapy resistance might be one of the major reasons.2
The cytotoxic effects of cisplatin are mediated by its interaction with DNA, resulting in the formation of DNA adducts which activate multiple signal transduction pathways and culminate in the activation of apoptosis. Accumulating evidence suggests that numerous underlying mechanisms might be responsible for the development of resistance against cisplatin.3 Recently, the mechanisms underlying autophagy have gained increasing attention. Autophagy is an intracellular evolutionarily conserved catabolic degradation process in which cytoplasmic macromolecules, aggregated proteins, aberrant organelles, or pathogen are delivered to lysosomes, and digested by lysosomal hydrolases to generate nucleotides, amino acids, fatty acids, sugars, and ATP, and ultimately recycled into the cytosol.4,7 Up to now, the dual role of autophagy both in cancer progression and inhibition remains controversial, in which the numerous ATG proteins and their core complexes including ULK1/2 kinase core complex, autophagy-specific class III PI3K complex, ATG9A trafficking system, ATG12, and LC3 ubiquitin-like conjugation systems give multiple activities of the autophagy pathway and are involved in autophagy initiation, nucleation, elongation, maturation, fusion, and degradation. These ATG proteins are recruited hierarchically proximal to the vacuole and organize the pre-autophagosomal structure that is essential for autophagosome formation.5,8 Lysosomes are the degradative end points for both intracellular and exogenous cargo. The catabolic function of the lysosome is accomplished by an array of approximately 60 proteases, lipases, nucleases, and other hydrolytic enzymes that break down complex macromolecules into their constituent building blocks.9 The transcription factor EB (TFEB), a master gene for lysosomal biogenesis, has been demonstrated could drive expression of autophagy and lysosomal genes.10 Recently, besides TFEB, the other members of the microphthalmia family (MITF, TFE3, and TFEC) of transcription factors are emerging as global regulators of cancer cell survival and energy metabolism, both through the promotion of lysosomal genes.11
Autophagy plays a dynamic tumor-suppressive or tumor-promoting role in different contexts and stages of cancer development. However, what the role of autophagy plays during DDP chemoresistance in NSCLC and the underlying mechanism are still largely unknown. We previously had obtained cisplatin-resistant non-small cell lung cancer (NSCLC) A549 cell lines (A549/DDP) and its parental A549 cells.12,13 In this study, we aim to observe the difference of autophagy between A549/DDP and A549, and also determine the role autophagy plays and the underlying regulation mechanisms during DDP treatment in A549/DDP. Our study may provide novel insights for the reversal of NSCLC chemotherapy resistance.
Materials and Methods
Cell Lines and Culture Conditions
The cisplatin (DDP)-resistant human lung adenocarcinoma A549 cell line (A549/DDP) and its parental A549 cell line were purchased from Rui Cong Laboratory Equipment Co., Ltd. (Shanghai, China) and reserved in our laboratory. Detailed information of the two cells was described in our previously published works.12,13 The cells were cultured in RPMI-1640 medium (Gibco; Grand Island, NY, USA) supplemented with 10% fetal bovine serum (Gibco), 100 U/mL of penicillin, and 100 mg/mL of streptomycin at 37°C with 5% CO2. To maintain the drug resistance of A549/DDP cells, 2 mg/mL cisplatin (QILU PHARMACEUTICAL, Shandong, China) were added in the culture medium. DDP-free RPMI-1640 medium was used 2 days before starting the subsequent experiment.
Reagents and Antibodies
3-Methyladenine (3-MA) (S2767), Rapamycin (S1039), and Wortmannin (S2758) were purchased from Selleckchem (Houston, TX, USA). Chloroquine diphosphate salt (C6628) was purchased from Sigma-Aldrich (MO, USA). cis-Diamminedichloroplatinum (Cisplatin, DDP, Lot.No:8L012A88) was purchased from QILU Pharmaceutical (Shandong, China). Antibodies against ATG5 (ab109490), ATG7 (ab133528), MITF (ab140606), and LC3B (ab192890) were purchased from Abcam (Cambridge, UK). Antibodies against p62 (18420-1-AP) and GAPDH (60004-1-Ig) were purchased from Proteintech (Chicago, IL, USA). Antibody against LC3B (83506S) and Beclin 1 were purchased from Cell Signaling Technology (Danvers, MA, USA). LAMP-1 (sc-19992) and LAMP-2 (sc-18822) were purchased from Santa Cruz (Dallas, TX, USA).
Cell Viability Assay (MTS)
The cells at the exponential growth phase were seeded in 96-well plates at a density of 5x10³ cells/well and cultured for 24 hours. Then, indicated concentrations of DDP and reagents were added to the wells. After incubation for 48 hours, MTS reagent (G3581, Promega, Madison, WI, USA) in culture medium was added to each well of the plate and the plate was incubated at 37°C for 1 hour. The absorbance of each well was measured at 490 nm using a VERS Amax Microplate Reader (Molecular Devices Corp; Sunnyvale, CA, USA). In the siRNA knock down experiment, cells were transfected with siRNA for 48 hours, and then the MTS assay was performed.
siRNA Transfection
All small interfering RNAs (siRNAs) used in this study were synthesized by GenePharma (Shanghai, China). The cells were seeded in 12-well plates before siRNA transfection. After 24 hours, cells were transfected with siRNA duplexes (final concentration 75 nM) with Lipofectamine RNAi MAX reagent (Invitrogen, Waltham, MA, USA) diluted in Opti-MEM (Gibco) according to the manufacturer’s instructions. Next, at 48 hours after siRNA transfection, the siRNA-mediated knockdown efficiency was determined by real-time quantitative PCR analysis or Western blot analysis. The siRNA sequences were listed below:
si-ATG5: 5′-GACGUUGGUAACUGACAAAtt-3′;
si-BECN1: 5′-GCUGCCGUUAUACUGUUCUtt-3′;14
si-MITF: 5′-CCACAUACAGCAAGCCCAAtt-3′;
Negative control siRNA: 5′-UUCUCCGAACGUGUCACGUtt-3′.
Real-Time Quantitative PCR Analysis
Total RNA was extracted using Eastep Super Total RNA Extraction Kit (Promega, Madison, WI, USA), then 1.5 μg of total RNA was used to synthesize cDNA with Go Script Reverse Transcription Kit (Promega) according to the standard protocol provided by the manufacturer. PCR amplification assays were performed with Go Taq Real-time Quantitative PCR Master Mix (Promega) on the CFX Connect Real-Time PCR Detection System (Bio-Rad, CA, USA). The relative gene expression levels were calculated using the CT value and normalized to the expression of the TATA-binding protein (TBP) reference gene. The specific primers were synthesized by Sangon (Shanghai, China) and the sequences are listed in Table 1.
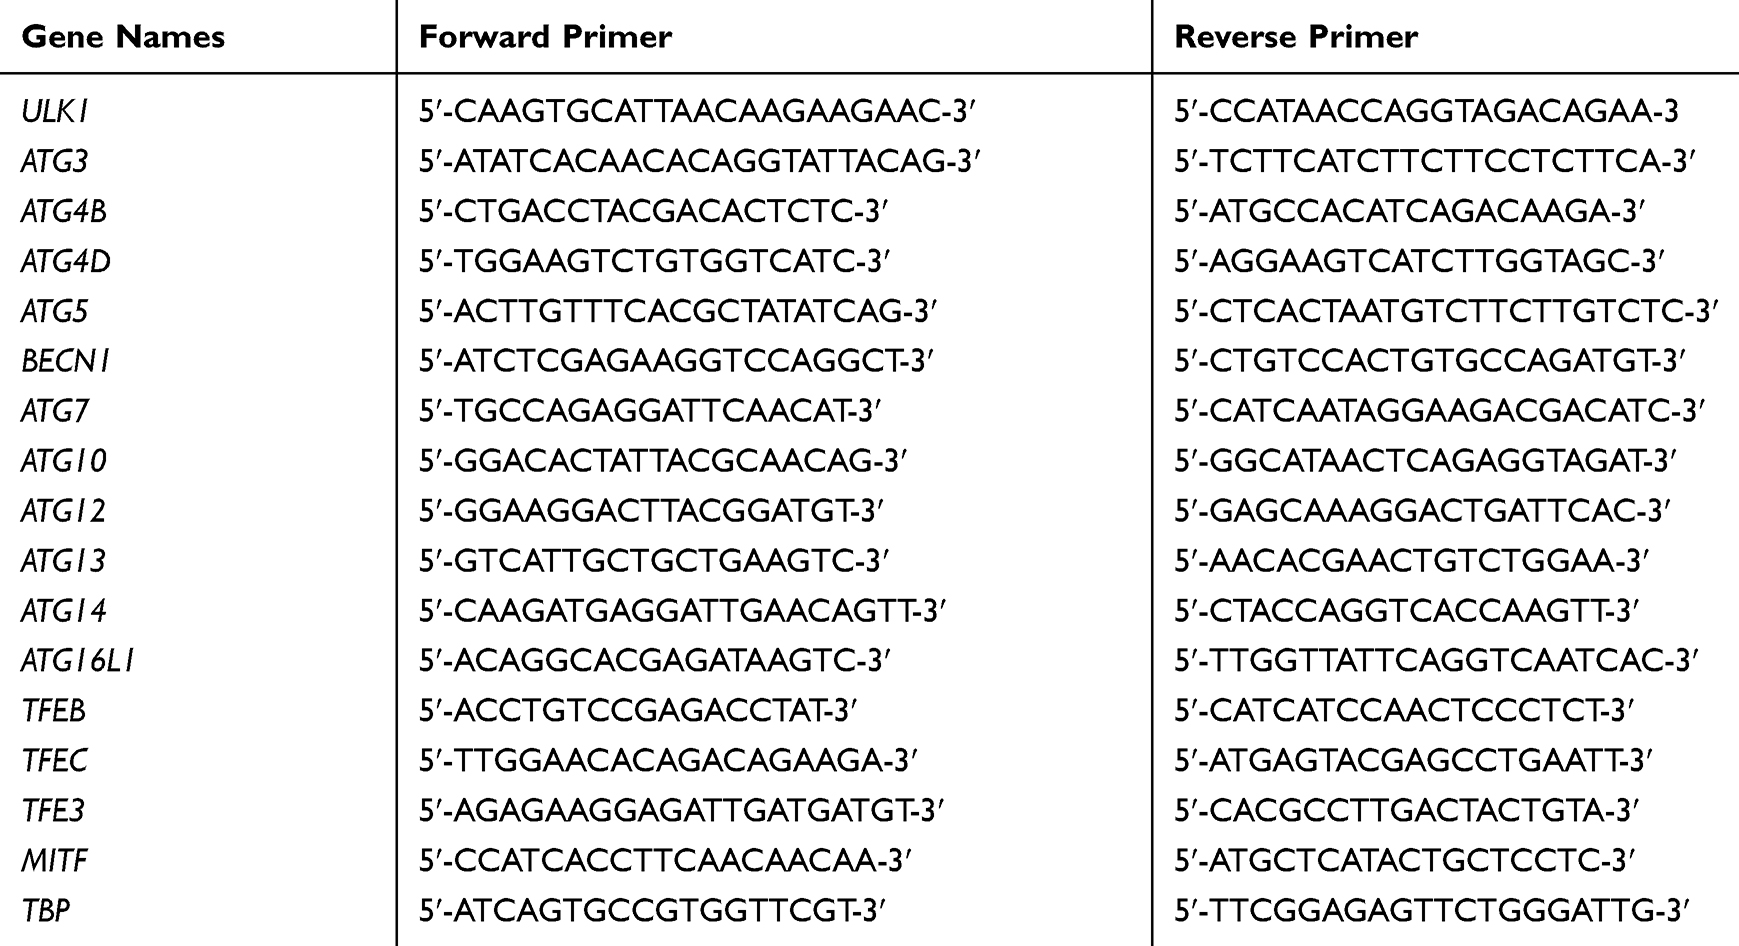 |
Table 1 The sequences of primers used in this study |
Western Blotting
Cells were collected at indicated times after treatment with DDP or drugs. After washing three times with pre-cold PBS, cells were treated with ice-cold RIPA lysis buffer (Abcam, Cambridge, MA, USA) containing PMSF (Sigma-Aldrich) and protease inhibitors (Thermo Fisher Scientific, Waltham, MA, USA). The protein concentrations of cell lysates were determined by the BCA Assay Kit (Bio-Rad). Proteins were separated by sodium dodecyl sulfate polyacrylamide gel electrophoresis, and then transferred on the PVDF membrane (Bio-Rad). After blocking with 5% non-fat skim milk in PBS-Tween 20 for 2 hours, the PVDF membrane was incubated with specific primary antibodies at 4°C overnight. The next day, PVDF membranes were incubated with horse radish peroxidase-conjugated secondary antibodies (Biosharp Life Sciences, Shanghai, China) at room temperature for 1 hour after being washed four times. Enhanced chemiluminescence reagents were used to visualize the brands by a Molecular Imager Gel Doc XR System (Bio-Rad). The intensity of the bands was analyzed by Image J software (NIH, Bethesda, MD, USA).
Confocal Microscopy
Cells were seeded in 24-well plates. At the indicated time points after DDP treatment, the cover slips were washed three times with PBS and fixed with cold methanol for 10 minutes at room temperature. After washing three times with PBS, the cells were permeabilized and blocked with 3% BSA and 0.3 M glycine and 0.1% TritonX-100 for 1 hour at room temperature. The cover slips were then incubated with antibody against LC3B (83506S, Cell Signaling Technology, 1:50) at 4°C overnight and then incubated with Alexa Fluor 596-labeled secondary antibody (Thermo Fisher Scientific) together with DAPI (Thermo Fisher Scientific) at room temperature for 1 hour. The subcellular localization of LC3B was observed using a Nikon A1R+/A1 confocal laser scanning microscopy (Nikon, Tokyo, Japan), and the images were analyzed using NIS-ElementsViewer4.20 (Nikon, Tokyo, Japan). Images were representative of at least five images/slide; n=3 slides/condition. Fluorescence intensities of LC3B were analyzed by Image J software (NIH, Bethesda, MD, USA).
Transmission Electron Microscopy (TEM)
A549 and A549/DDP cells were centrifuged at 1000 × g for 5 minutes after trypsinization, fixed with 4% glutaraldehyde in 0.1 M PBS (pH 7.4) for 2 hours at 4°C, washed three times with PBS (pH 7.4), and post-fixed with 1% osmium tetroxide in 0.1 M PBS for 1 hour at 4°C, dehydrated in a graded series of alcohol and acetone, and then embedded in Epon 812. The ultrathin sections were obtained using a Leica ultramicrotome (Leica Microsystems, Buffalo Grove, IL, USA). The ultrathin sections stained with uranyl acetate and lead citrate were examined with a JEM-1400 plus transmission electron microscope (JEOL, Peabody, MA, USA).
Statistics Analysis
All data are shown as means±standard deviation (SD). Differences among different groups were analyzed by either Student’s t-test or one-way ANOVA analysis. All statistical tests were conducted using Prism 6.0 (Graph Pad Software, San Diego, CA, USA). *P<0.05 indicates statistical significance, and N.S. indicates not significant.
Results
Autophagy is Higher Activated in A549/DDP Cells in Comparison with A549 Cells
A549/DDP cells exhibited higher DDP resistance compared with its parental A549 cells, the MTS analysis clearly showed that A549/DDP cells had higher cell viability of about 80%, whereas A549 cells only had cell viability of about 30%, in response to DDP at a concentration of 40 μM (Figure 1A). We determined whether A549/DDP cells had higher autophagy activity by multiple methods. Firstly, the Western blotting analysis showed that A549/DDP cells had a higher ratio of LC3B-II/LC3B-I (the marker of autophagy activity) and lower expression of p62/SQSTM1 (the substrate of autophagy) compared with A549 cells, suggesting that A549/DDP had higher autophagy activity and the autophagic flux was fluent (Figure 1B). Secondly, the immunofluorescent analysis also showed that A549/DDP cells had more LC3B puncta compared with A549 cells (Figure 1C). Thirdly, the result of transmission electron microscopy (TEM) clearly showed that A549/DDP cells had more autophagic vacuoles compared with A549 cells (Figure 1D). Lastly, we detected the expression level of several key autophagy-related proteins. The Western blotting results showed that the expression level of Beclin-1, ATG7, and ATG5 were upregulated in A549/DDP cells compared with A549 cells (Figure 1E). Our data suggested that autophagy was higher activated in A549/DDP cells.
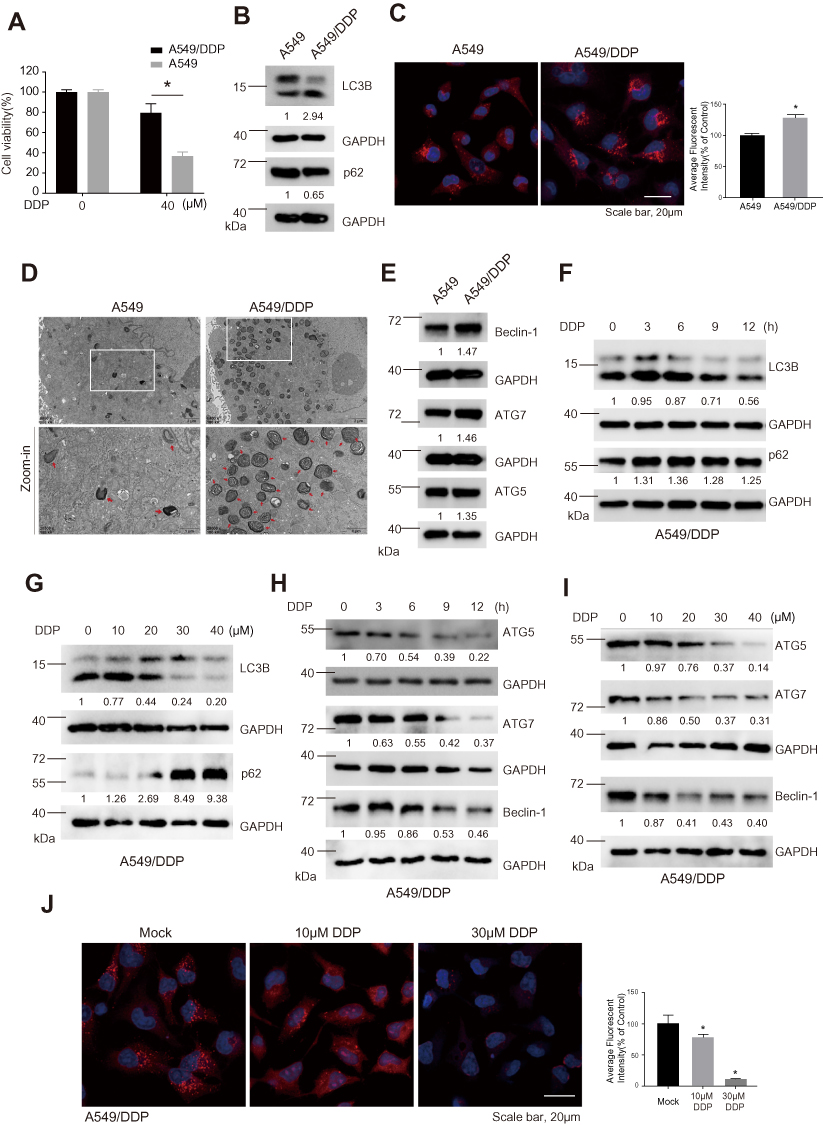 |
Figure 1 A549/DDP cells exhibited higher autophagy activity and DDP treatment decreased autophagy in A549/DDP cells. (A) MTS analysis was applied to determine the cell viability of A549 and A549/DDP cells in response to 40 μM DDP at 48 hours post treatment. *P<0.05. (B) The expression levels of LC3B-II/I and p62 in A549 and A549/DDP cells were determined by Western blotting analysis. GAPDH was served as a loading control and the relative expression ratios were calculated. (C) Immunofluorescence analysis for the LC3B puncta (Red signal) in A549 and A549/DDP cells. DAPI (Blue signal) was used to stain the nucleus. Scale bar, 20 μm. *P<0.05. (D) Transmission electron microscopy (TEM) was used to observe autophagic vacuoles in A549 and A549/DDP cells. The bottom panel was zoom-in images. Red arrows indicated autophagic vacuoles. Scale bar (upper panel), 2 μm and scale bar (bottom panel), 1 μm. (E) The expression levels of Beclin-1, ATG5, and ATG7 in A549 and A549/DDP cells were determined by Western blotting analysis. GAPDH was served as a loading control and the relative expression ratio was calculated. (F) The expression levels of LC3B-II/I and p62, and (G) ATG5, ATG7, and Beclin-1 in A549/DDP cells in response to 30 μM DDP at indicated time points post treatment were determined by Western blotting analysis. GAPDH was served as loading control and the relative expression ratios were calculated. (H) The expression levels of LC3B-II/I and p62, and (I) ATG5, ATG7, and Beclin-1 in A549/DDP cells in response to various concentrations of DDP at 24 hours post treatment were determined by Western blotting analysis. GAPDH was served as loading control and the relative expression ratios were calculated. (J) The expression level of LC3B puncta (Red signal) was determined by immunofluorescence analysis in A549/DDP cells in response to 0, 10, and 30 μM DDP at 24 hours post treatment. DPAI (Blue signal) was used to stain the nucleus. Scale bar, 20 μm. *P<0.05. |
DDP Treatment Caused the Decrease of Autophagy
We further determined the autophagic activity in A549/DDP cells in response to DDP treatment. We found that the ratio of LC3B-II/LC3B-I was sharply decreased, while the p62 expression level was elevated, in response to DDP at a concentration of 30 μM at various time-points (Figure 1F). Meanwhile, the expression levels of several key autophagy-related proteins, such as ATG5, ATG7, and Beclin-1, were downregulated in a time-dependent manner in response to DDP treatment (Figure 1H). We also found that the decrease of LC3B-II/LC3B-I and increase of p62 was dose-dependent in response to various concentrations of DDP (Figure 1G). The decreases of ATG5, ATG7, and Beclin-1 were also in a dose-dependent manner in response to DDP treatment (Figure 1I). Furthermore, the immunofluorescent results showed the LC3B puncta were decreased in response to various concentrations of DDP (Figure 1J). These results together indicated that DDP treatment could lead to decreased autophagy in A549/DDP cells.
Autophagy Activity was Negatively Correlated with Chemosensitivity of DDP
We further determined the role of autophagy in A549/DDP cells in response to DDP treatment. DDP treatment could induced cell death in A549/DDP cells in a dose-dependent manner (Figure 2A). Pharmacological activation of autophagy using rapamycin increased the cell viability of A549/DDP cells in response to DDP treatment (Figure 2B), while pharmacological inhibition of autophagy using wortmannin, chloroquine, and 3-MA significantly decreased the cell viability of A549/DDP cells in response to DDP treatment (Figure 2C–E). To exclude the possibility that the off-target effects of the drugs went beyond influencing autophagy, we downregulated the expression level of ATG5 and Beclin-1 via siRNA-mediated knockdown. Western blotting results showed that the siRNA-mediated knockdown targeting ATG5 (Figure 2F) or Beclin-1 (Figure 2G) was effective. Moreover, we found that knockdown of ATG5 or Beclin-1 aggravated cell death induced by DDP treatment in A549/DDP cells, suggesting that autophagy might exhibit a protective role in response to DDP treatment (Figure 2H).
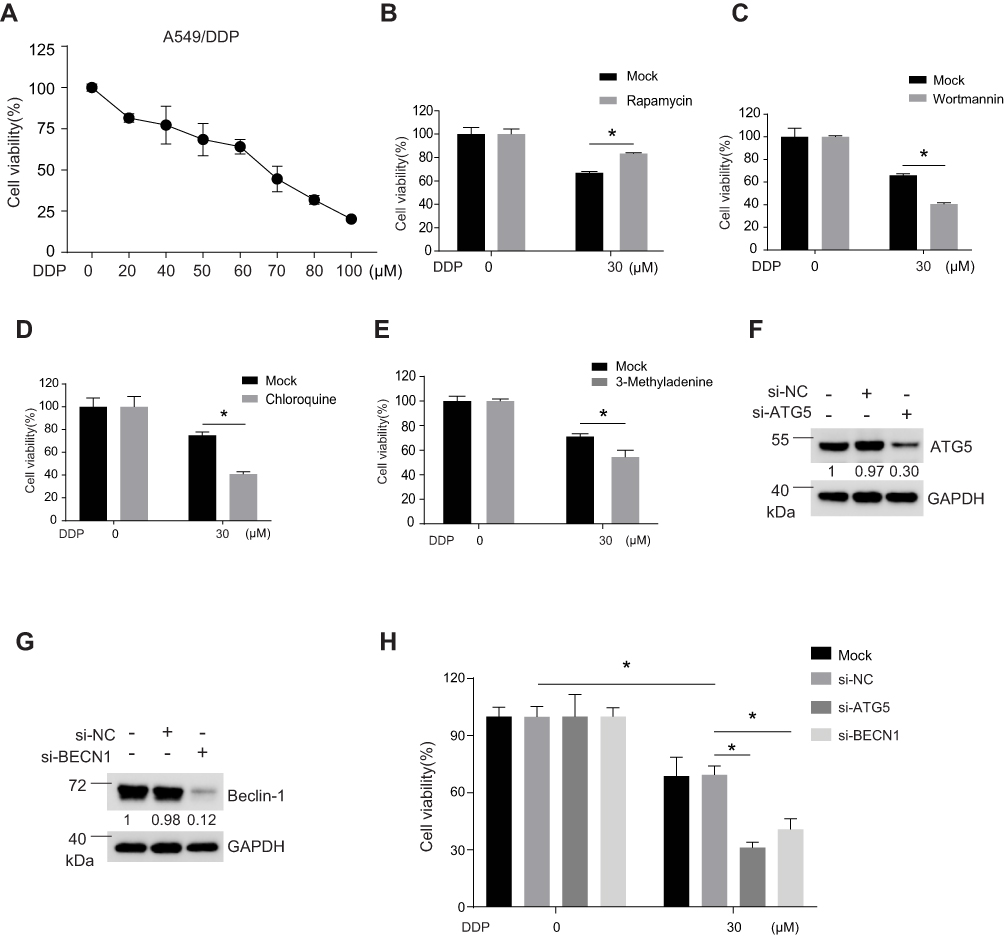 |
Figure 2 Inhibition of autophagy enhanced cell death induced by DDP treatment. (A) MTS analysis was applied to determine the cell viability of A549/DDP cells in response to various concentrations of DDP at 48 hours. (B–E) Cell viability of A549/DDP cells in response to DDP or DDP plus with (B) rapamycin (200 nM), (C) wortmannin (2.5 μM), (D) chloroquine (5 μM), or (E) 3-MA (5 mM) at 48 hours post treatment was determined by MTS analysis. *P<0.05. The expression level of (F) ATG5 or (G) Beclin-1 were determined by Western blotting analysis 48 hours after treatment with either negative control siRNA or siRNA targeting ATG5 or Beclin-1. GAPDH was served as loading control and the relative expression ratios were calculated. (H) Cell viability of A549/DDP cells in response to 30 μM at 48 hours post treatment. The cells were pre-treated with either negative control siRNA or siRNA targeting ATG5 or Beclin-1 for 48 hours. *P<0.05. |
DDP Treatment Caused the Decrease of Key Autophagic Gene Expression
To determine how the DDP decreased autophagy activity in A549/DDP cells, we screened the mRNA expression of the major autophagy gene, including ULK1, ATG3, ATG4B, ATG4D, ATG5, BECN1, ATG7, ATG10, ATG12, ATG13, ATG14, and ATG16L1, in response to DDP treatment. Our results showed that 30 μM DDP treatment induced a significant decrease of mRNA expression levels of ATG5, BECN1, ATG7, and ATG10 in a time-dependent manner (Figure 3A). Meanwhile, we also found that DDP treatment could lead to decreased mRNA expression levels of ATG5, BECN1, ATG7, and ATG10 in a dose-dependent manner (Figure 3B). These results indicated that DDP treatment could dampen autophagic activity through the inhibition of mRNA expression of several key autophagic gene.
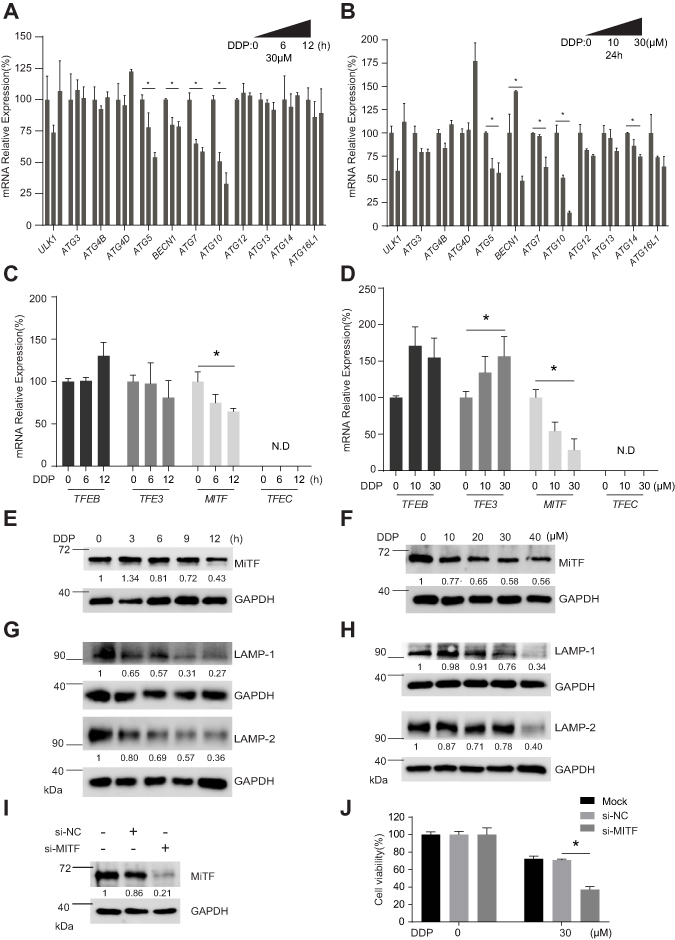 |
Figure 3 MiTF were probably involved in decreased autophagy induced by DDP treatment. (A) The relative expression levels of key autophagy-related genes were determined by QPCR in A549/DDP cells in response to 30 μM DDP at 0, 6, and 12 h post treatment. *P<0.05. (B) The relative expression levels of key autophagy-related genes were determined by QPCR in A549/DDP cells in response to 0, 10, and 30 μM DDP at 24 hours post treatment. *P<0.05. (C) The relative expression levels of TFEB, TFE3, MIFT, and TFEC were determined by QPCR in A549/DDP cells in response to 30 μM DDP at 0, 6, and 12 hours post treatment. *P<0.05. N.D., not detectable. (D) The relative expression levels of TFEB, TFE3, MIFT, and TFEC were determined by QPCR in A549/DDP cells in response to 0, 10, and 30 μM DDP at 24 hours post treatment. *P<0.05. N.D., not detectable. (E) The expression level of MiFT in A549/DDP cells in response to 30 μM DDP at indicated time points post treatment was determined by Western blotting analysis. GAPDH was served as loading control and the relative expression ratios were calculated. (F) The expression level of MiFT in A549/DDP cells in response to 0, 10, 20, 30, and 40 μM DDP at 24 hours post treatment was determined by Western blotting analysis. GAPDH was served as loading control and the relative expression ratios were calculated. (G) The expression levels of LAMP-1 and LAMP-2 in A549/DDP cells in response to 30 μM DDP at indicated time points post treatment were determined by Western blotting analysis. GAPDH was served as loading control and the relative expression ratios were calculated. (H) The expression levels of LAMP-1 and LAMP-2 in A549/DDP cells in response to 0, 10, 20, 30, and 40 μM DDP at 24 hours post treatment was determined by Western blotting analysis. GAPDH was served as loading control and the relative expression ratios were calculated. (I) The expression level of MiTF was determined by Western blotting analysis 48 hours after treatment with either negative control siRNA or siRNA targeting MiTF. GAPDH was served as a loading control and the relative expression ratios were calculated. (J) Cell viability of A549/DDP cells in response to 30 μM at 48 hours post treatment. The cells were pre-treated with either negative control siRNA or siRNA targeting MiTF for 48 hours. *P<0.05. |
DDP Treatment Could Influence MiTF and Lysosomal Biogenesis
Microphthalmia-associated transcription factor (MITF), transcription factor EB (TFEB), TFE3, and TFEC constitute the MiTF/TFE (Microphthalmia/TFE) subfamily of basic/helix-loop-helix/leucine zipper (bHLH-LZ) transcription factors. The MiTF/TFE family is involved in nutrient sensing and organelle biogenesis, and specifically, the lysosomal biogenesis.10,15,17 To our surprise, we did not observe a decrease of mRNA expression level of TFEB, however we found that DDP treatment significantly decreased the mRNA expression level of MIFT in a time-dependent (Figure 3C) and dose-dependent manner (Figure 3D). The result of Western blot analysis confirmed that DDP treatment could cause a decrease of MiTF protein expression in a time-dependent (Figure 3E) and dose-dependent manner (Figure 3F). Lysosome-associated membrane glycoprotein 1 (LAMP-1) and LAMP-2 are the most abundant proteins in lysosome.9 The results of Western blotting showed that DDP treatment caused a decrease of LAMP-1 and LAMP-2 protein expression levels in a time-dependent (Figure 3G) and dose-dependent manner (Figure 3H), suggesting the dysfunction of lysosomal biogenesis in A549/DDP cells in response to DDP treatment. More importantly, we found that siRNA-mediated knockdown of MiTF (Figure 3I) enhanced cell death induced by DDP treatment in A549/DDP (Figure 3J), indicating a substantial correlation between MiTF and cisplatin chemoresistance.
High Expression Level of ATG5 or ATG7 Were Negative Correlated with Outcome of NSCLS Patients
We analyzed the lung patients’ data from The Cancer Genome Atlas (TCGA), and the results indicated that the patients with a higher expression level of ATG5 or ATG7 had a shorter overall survival time, and had shorter progression-free survival time (Figure 4A and B), suggesting that autophagy activity might be negatively correlated with lung cancer outcome.
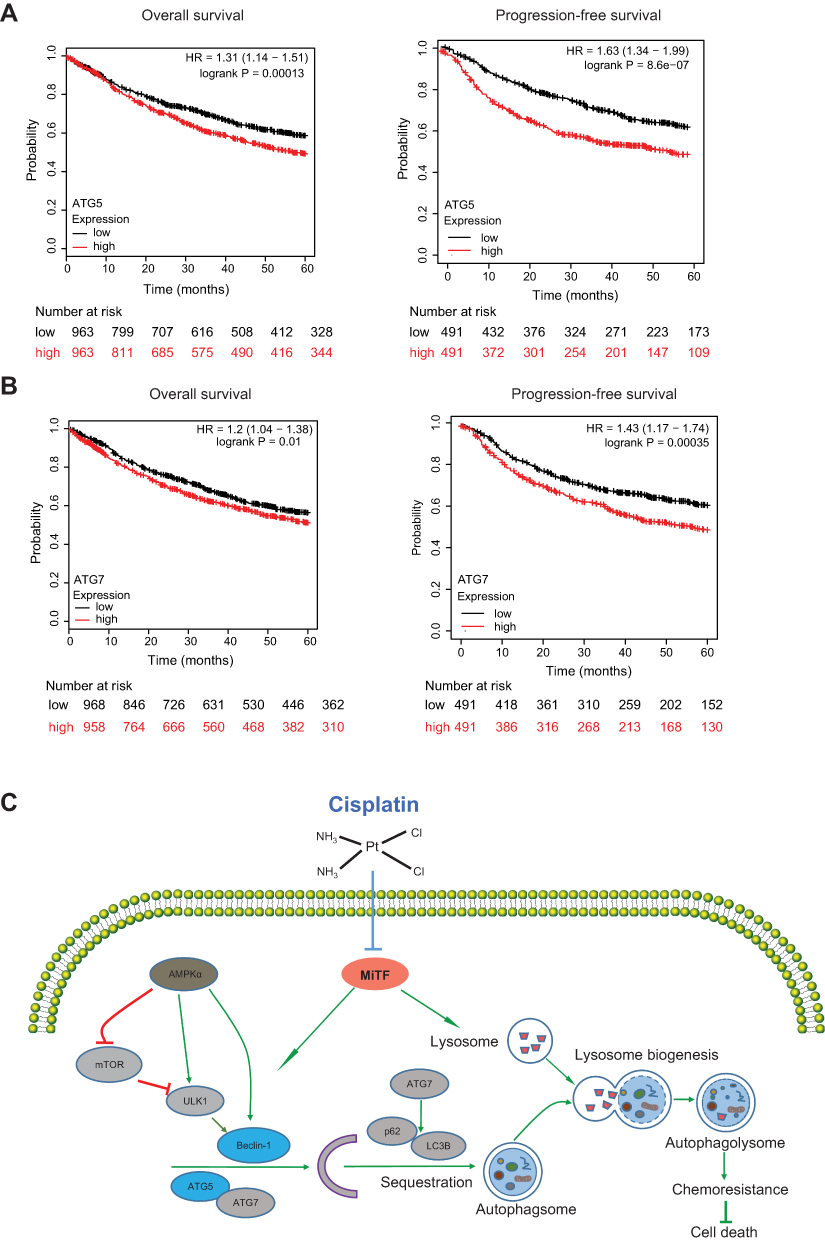 |
Figure 4 ATG5 and ATG7 were correlated to outcome in lung cancer patients. (A and B) A Kaplan-Meier analysis of the data in www.kmplot.com was used to determine the overall survival (OS) and progression-free survival time of patients with high ATG5 and AGT7 expression and patients with low ATG5 and AGT7 expression, respectively, followed by the Log rank test. Note that lower ATG5 and ATG7 levels were correlated with a longer overall survival (OS) of NSCLC patients. (C) autophagy might play a protective role during DDP treatment in A549/DDP cells. A549/DDP cells had higher autophagy activity compared with its parental A549 cells. DDP treatment could sharply decrease autophagy in A549/DDP cells through repressing AMPKα and MiTF. Combination of DDP with knockdown key autophagy-related gene, such as ATG5 and Beclin-1, could enhance the chemosensitivity of DDP and consequently induced aggravated cell death in A549/DDP cells. |
Discussion
The current study has four major findings: 1) We demonstrated that A549/DDP cells had higher activity of autophagy compared with its parental A549 cells; 2) We demonstrated that DDP treatment could lead to decreased autophagy in a dose- and time-dependent manner; 3) We found that DDP treatment could repress mRNA expression of several autophagy-related gene, such as ATG5, Beclin-1, and ATG7; We proposed that the inhibition of MiTF might be responsible for the decreased autophagy induced by DDP treatment; and 4) Our results indicated that a combination of ATG5 or Beclin-1 knockdown and DDP treatment could aggravate cell death of A549/DDP cells, suggesting that autophagy played a protective role during DDP treatment (Figure 4C). Consistently, clinical data supports our notion since lung cancer patients with a relative high expression level of ATG5 or ATG7 have shorter overall survival time and progression-free survival time. Therefore, this study provides a clue that combination usage of autophagy inhibitor with DDP could be a potential strategy for the reversal of DDP chemoresistance in NSCLC patients.
Our results indicated that A549/DDP had higher autophagy activity compared with its parental A549 cells. We found that the expression levels of LCB-II/I, ATG5, Beclin-1, and ATG7 in A549/DDP cells were higher than in A549 cells, and the expression level of p62 exhibited an opposite tendency, suggesting that complete autophagic flux existed in A549/DDP, while not incomplete autophagic flux induced elevation of ATG proteins. We also detected whether a blockade of proteasome function would influence the expression level of ATGs, and the results showed that proteasome inhibitor bortezomib and MG-132 could further upregulate the expression level of ATGs, such as ATG5, Beclin-1, and ATG7 (data not shown), suggesting that the elevation of ATGs might not be due to the dysfunction of proteasome, which was the other major protein degradation system besides autophagy.
Interestingly, previous studies showed that DDP treatment could induce the elevation of autophagy, as evidenced by the higher ratio of LC3B-II/I or more fluorescence puncta of LC3 in the MG63 human osteosarcoma cell line18 or HOS-CRL-1543 cell line,19 and, more relevant, one study found that DDP treatment enhanced CD133+ cell ratios in clinical NSCLC specimens and the NSCLC cell line A549. The CD133+ cells enriched by DDP exhibited higher autophagy levels.20 However, in our study, we found that A549/DDP cells had a relative autophagy activity and a decreased tendency of autophagy was observed in response to DDP treatment. There are several possible explanations for this discrepancy. Firstly, the different cell type or the heterogeneity of NSCLC cell line. Secondly, the shock methods for the establishment of DDP-resistant cell lines and the maintaining condition were different. Our finding supported the notion that A549/DDP cells had higher activity in basal condition, and DDP treatment could cause a decrease of autophagy, as evidenced by downregulated mRNA and protein expression level of several ATGs, and upregulated p62 expression level.
We found that DDP treatment caused the downregulated mRNA or protein expression level of ATG5, Beclin-1, or ATG7, however other ATGs (such as ATG3, data not shown) were not significantly influenced, suggesting the DDP treatment repressed autophagy might selectively target specific ATGs (such as ATG5, Beclin-1, and ATG7), however the underlying mechanisms need further investigations. We firstly reported here that MiTF, while not the other members of the MiTF/TFE subfamily (such as TFEB, TFE3, or TFEC), was sharply downregulated in response to DDP treatment in a time- and dose-dependent manner. Consequently, the expression level of LAMP-1 or LAMP-2 were decreased, suggesting DDP treatment could dampen lysosomal biogenesis and the transcriptional activity of key autophagy related genes. Recently, MiTF was recognized as a key component for the autophagy regulation. Ozturk et al21 reported that the MiTF-MIR211 axis constitutes a novel and universal autophagy amplification system that sustains autophagic activity under stress conditions. Möller et al16 demonstrated that MiTF had a central role in regulating starvation-induced autophagy in melanoma. Zhang et al22 provided the evidence that an ancient module comprising MiTF, v-ATPase, and TORC1 might serve as a dynamic modulator of metabolism for cellular homeostasis. Given that the important roles of MiTF in autophagy and cellular homeostasis have been well-demonstrated, we would further investigate MiTF in ongoing study.
We provided direct evidence which showed that autophagy plays a protective role during DDP treatment. Pharmacological inhibition with wortmannin, 3-MA, or chloroquine, or knockdown of ATG5 or Beclin-1 could aggravate cell death induced by DDP treatment. Moreover, we demonstrated the correlation between MiTF and cisplatin chemoresistance. It is suggested that an autophagy inhibitor could contribute to the reversal of DDP chemoresistance for NSCLC therapy. Anyway, clinical data was likely concordant to our notions because lung cancer patients with a higher expression level of ATG5 or ATG7 had lower OS time and progress-free survival time. However, the findings in A549/DDP should be validated in mouse models in the future.
Taken together, we demonstrate that A549/DDP cells have higher autophagy activity and DDP treatment can repress autophagy through inhibition of MiTF. Autophagy plays a protective role in response to DDP treatment and inhibition of autophagy leads to aggravated cell death induced by DDP treatment, indicating that targeting MiTF or combination use of autophagy inhibitor could serve as a novel strategy for the reversal of DDP chemoresistance.
Disclosure
The authors report no conflicts of interest in this work.
References
1. Siegel RL, Miller KD, Jemal A. Cancer statistics, 2019. CA Cancer J Clin. 2019;69(1):7–34. doi:10.3322/caac.21551
2. Molina JR, Yang P, Cassivi SD, Schild SE, Adjei AA. Non-small cell lung cancer: epidemiology, risk factors, treatment, and survivorship. Mayo Clin Proc. 2008;83(5):584–594. doi:10.1016/S0025-6196(11)60735-0
3. Galluzzi L, Senovilla L, Vitale I, et al. Molecular mechanisms of cisplatin resistance. Oncogene. 2012;31(15):1869–1883. doi:10.1038/onc.2011.384
4. Shintani T, Klionsky DJ. Autophagy in health and disease: a double-edged sword. Science. 2004;306(5698):990–995. doi:10.1126/science.1099993
5. Klionsky DJ. Autophagy: from phenomenology to molecular understanding in less than a decade. Nat Rev Mol Cell Biol. 2007;8(11):931–937. doi:10.1038/nrm2245
6. Levine B. Cell biology: autophagy and cancer. Nature. 2007;446(7137):745–747. doi:10.1038/446745a
7. Levine B, Kroemer G. Autophagy in the pathogenesis of disease. Cell. 2008;132(1):27–42. doi:10.1016/j.cell.2007.12.018
8. Mizushima N, Yoshimori T, Ohsumi Y. The role of Atg proteins in autophagosome formation. Annu Rev Cell Dev Biol. 2011;27:107–132. doi:10.1146/annurev-cellbio-092910-154005
9. Lawrence RE, Zoncu R. The lysosome as a cellular centre for signalling, metabolism and quality control. Nat Cell Biol. 2019;21(2):133–142. doi:10.1038/s41556-018-0244-7
10. Settembre C, Di Malta C, Polito VA, et al. TFEB links autophagy to lysosomal biogenesis. Science. 2011;332(6036):1429–1433. doi:10.1126/science.1204592
11. Slade L, Pulinilkunnil T. The MiTF/TFE family of transcription factors: master regulators of organelle signaling, metabolism, and stress adaptation. Mol Cancer Res. 2017;15(12):1637–1643. doi:10.1158/1541-7786.MCR-17-0320
12. Qin X, Qiu F, Zou Z. TRIM25 is associated with cisplatin resistance in non-small-cell lung carcinoma A549 cell line via downregulation of 14-3-3sigma. Biochem Biophys Res Commun. 2017;493(1):568–572. doi:10.1016/j.bbrc.2017.08.151
13. Qin X, Chen S, Qiu Z, Zhang Y, Qiu F. Proteomic analysis of ubiquitination-associated proteins in a cisplatin-resistant human lung adenocarcinoma cell line. Int J Mol Med. 2012;29(5):791–800. doi:10.3892/ijmm.2012.912
14. Zhang J, Qin X, Wang B, et al. Zinc oxide nanoparticles harness autophagy to induce cell death in lung epithelial cells. Cell Death Dis. 2017;8(7):e2954. doi:10.1038/cddis.2017.337
15. Martina JA, Diab HI, Li H, Puertollano R. Novel roles for the MiTF/TFE family of transcription factors in organelle biogenesis, nutrient sensing, and energy homeostasis. Cell Mol Life Sci. 2014;71(13):2483–2497. doi:10.1007/s00018-014-1565-8
16. Moller K, Sigurbjornsdottir S, Arnthorsson AO, et al. MITF has a central role in regulating starvation-induced autophagy in melanoma. Sci Rep. 2019;9(1):1055. doi:10.1038/s41598-018-37522-6
17. Martina JA, Puertollano R. Rag GTPases mediate amino acid-dependent recruitment of TFEB and MITF to lysosomes. J Cell Biol. 2013;200(4):475–491. doi:10.1083/jcb.201209135
18. Zhang Z, Shao Z, Xiong L, Yang S. Inhibition of autophagy enhances cisplatin-induced apoptosis in the MG63 human osteosarcoma cell line. Oncol Lett. 2015;10(5):2941–2946. doi:10.3892/ol.2015.3692
19. Mukherjee S, Dash S, Lohitesh K, Chowdhury R. The dynamic role of autophagy and MAPK signaling in determining cell fate under cisplatin stress in osteosarcoma cells. PLoS One. 2017;12(6):e0179203. doi:10.1371/journal.pone.0179203
20. Hao C, Liu G, Tian G. Autophagy inhibition of cancer stem cells promotes the efficacy of cisplatin against non-small cell lung carcinoma. Ther Adv Respir Dis. 2019;13:1753466619866097. doi:10.1177/1753466619866097
21. Ozturk DG, Kocak M, Akcay A, et al. MITF-MIR211 axis is a novel autophagy amplifier system during cellular stress. Autophagy. 2019;15(3):375–390. doi:10.1080/15548627.2018.1531197
22. Zhang T, Zhou Q, Ogmundsdottir MH, et al. Mitf is a master regulator of the v-ATPase, forming a control module for cellular homeostasis with v-ATPase and TORC1. J Cell Sci. 2015;128(15):2938–2950. doi:10.1242/jcs.173807
 © 2020 The Author(s). This work is published and licensed by Dove Medical Press Limited. The full terms of this license are available at https://www.dovepress.com/terms.php and incorporate the Creative Commons Attribution - Non Commercial (unported, v3.0) License.
By accessing the work you hereby accept the Terms. Non-commercial uses of the work are permitted without any further permission from Dove Medical Press Limited, provided the work is properly attributed. For permission for commercial use of this work, please see paragraphs 4.2 and 5 of our Terms.
© 2020 The Author(s). This work is published and licensed by Dove Medical Press Limited. The full terms of this license are available at https://www.dovepress.com/terms.php and incorporate the Creative Commons Attribution - Non Commercial (unported, v3.0) License.
By accessing the work you hereby accept the Terms. Non-commercial uses of the work are permitted without any further permission from Dove Medical Press Limited, provided the work is properly attributed. For permission for commercial use of this work, please see paragraphs 4.2 and 5 of our Terms.