")
Back to Journals » Cancer Management and Research » Volume 12
miRNA Expression Profile in the N2 Phenotype Neutrophils of Colorectal Cancer and Screen of Putative Key miRNAs
Authors Wang L, Yang J, Huang J, Wen ZQ, Xu N, Liu X, Zhang JH, Li WL
Received 26 February 2020
Accepted for publication 26 May 2020
Published 7 July 2020 Volume 2020:12 Pages 5491—5503
DOI https://doi.org/10.2147/CMAR.S251427
Checked for plagiarism Yes
Review by Single anonymous peer review
Peer reviewer comments 2
Editor who approved publication: Dr Antonella D'Anneo
Liang Wang,1 Jun Yang,1 Jian Huang,1 Zheng-Qi Wen,1 Ning Xu,1 Xuan Liu,1 Jian-Hua Zhang,2 Wen-Liang Li1
1Department of Oncology, The First Affiliated Hospital of Kunming Medical University, Kunming, Yunnan Province 650032, People’s Republic of China; 2Department of General Surgery, Hong He Prefecture Third People’s Hospital, Gejiu City 661100, People’s Republic of China
Correspondence: Wen-Liang Li
Department of Oncology, The First Affiliated Hospital of Kunming Medical University, No. 295 Xichang Road, Kunming 650051, People’s Republic of China
Email [email protected]
Objective: Colorectal cancer (CRC) is one of the most common malignant tumors in the digestive tract, which accounts for 10% of all the malignant tumors in the world. The aim of this study was to identify key genes and miRNAs in CRC diagnosis, prognosis, and therapy and to further explore the potential molecular mechanisms of CRC.
Methods: The infiltration and metastasis of neutrophils in primary colorectal cancer tissue and paracancerous tissue were observed by immunohistochemical staining. After inducing N2 neutrophils with TGF-β 1 in vitro, exosomes were extracted and sequenced, and then the expression differences of miRNAs were screened by using Agilent miRNA microarrays. The data were imported to the Web CARMA for differential expression analysis. The GO and KEGG enrichment analysis were performed using DIANA-MirPath v3.0 using TargetScan database. And the corresponding targets were imported into Gephi for network analysis. The expression level of differentially expressed miRNA using quantitative real-time polymerase chain reaction (RT-PCR) was validated.
Results: A total of 2 miRNAs were found to be associated with N2 neutrophils, in which the expression of hsa-miR-4780 was upregulated and the expression of hsa-miR-3938 was downregulated in N2 neutrophils, compared with the neutrophils. In addition, the results of miRNA-targets networks showed that the hsa-mir-3938 and hsa-mir-4780 could regulate TUSC1 and ZNF197. The expression level of hsa-miR-4780 and hsa-miR-3938 wase validated in accordance with the results of RT-PCR.
Conclusion: The hsa-mir-3938 and hsa-mir-4780 were differentially expressed between N2 neutrophils and neutrophils. Moreover, the regulation of TUSC1 and ZNF197 by these DEmiRNA established the theoretical basis for the mechanism of N2 type neutrophils regulating the invasion and metastasis of CRC cells and provided the potential biomarker for prognosis for clinical treatment of CRC.
Keywords: miRNA, N2 phenotype neutrophils, colorectal cancer
Introduction
Colorectal cancer (CRC) is one of the most common malignant tumors in the digestive tract, which accounts for 10% of all the malignant tumors in the world.1 With the rapid development of social and economic life and the change of diet lifestyle and diet structure, the incidence and prevalence of colorectal cancer are increasing gradually.2 Although the treatment of CRC has improved significantly in recent decades, the five year survival rate is only 8–10%.3 Therefore, it is more important to study the pathogenesis mechanism of CRC, and to find the right drug target to promote the effect of treatment and prolong the survival time.
Tumor microenvironment includes tumor cells themselves, various immune cells and interstitial cells. Immune cells mainly include neutrophils, macrophages, NK cells, lymphocytes and dendritic cells.4 Many recent researches have denoted that the neutrophils play important roles in the formation of the tumor microenvironment.5 Tumor-associated neutrophils (TANs) secrete various proteases, reactive oxygen species and cytokines, which play an important role in tumor growth, metastasis, angiogenesis and immune regulation.6 TANs can be further divided into two subtypes as N1 TANs and N2 TANs. N1 TANs have antitumor effect, while N2 TANs can promote the occurrence, development and metastasis of tumors.7 In addition, a number of studies revealed that the increase of neutrophil count in peripheral blood was related to poor clinical outcomes in CRC, but the mechanism of this process was unclear.8–11
miRNAs are small molecule RNA with a length of 20–25 nucleotides, which are involved in the regulation of various physiological and biochemical processes in organisms.12 It has been found that miRNAs played an important regulatory role in the occurrence and development of diseases, especially tumors. If the expression of miRNAs which can regulate cell proliferation and differentiation was abnormal, it might lead to the occurrence of tumor.13 In addition, previous studies showed that miRNAs expression were different in various tissues of CRC, and it were related to the proliferation and metastasis of CRC tumor cells. For example, studies showed that long chain noncoding RNA MIR17HG promoted metastasis of CRC via miR-17,14 and the increased expression of miR-17 also promotes metastasis of CRC.15 Another research showed that the miR-200 families were key factor in the occurrence of epithelial to mesenchymal transition (EMT) in tumor cells and abnormal expression of miR-200 might promote EMT in tumor cells and lead to metastasis.16 However, the relationship between miRNA in type N2 neutrophils and CRC is still unclear and a considerable amount of research is needed in this area.
Based on the above background, we used transforming growth factor-β1 (TGF-β1) to induce N2 phenotype neutrophils in vitro, extracted exosomes for sequenced, and screened miRNAs with different expression. We analyzed the mechanism of N2 neutrophil miRNA regulating the invasion and metastasis of CRC cells, which provided new therapeutic target for CRC, and provided the theoretical basis for individualized treatment of CRC.
Materials and Methods
Immunohistochemical Staining
Tissue samples were obtained from 20 patients diagnosed with colorectal cancer between July 2019 and December 2019 at the First Affiliated Hospital of Kunming Medical University (degree of differentiation: I: n=6; II: n=14). Twenty specimens of primary colorectal cancer tissues and 20 specimens of paracancerous tissues were taken. Formalin-fixed, paraffin-embedded colon biopsy sections were deparaffinized in xylene for 20 min and rehydrated in a graded ethanol series (100–70%) for 8 min. Endogenous peroxidase were deactivated with 3% hydrogen peroxide for 5–10 min at room temperature after deparaffinization. Antigen retrieval was performed with a sodium citrate buffer (10 mM, pH = 6) for 10 min. A mouse IgM antihuman monoclonal antibody specific for CD11b, CD66b (ab197678) and mmp9 (BD Biosciences, San Diego, California) was used to identify neutrophils. Negative controls were stained with a rabbit IgG negative control prediluted in phosphate-buffered saline (Life Technologies). Slides were counterstained with hematoxylin. The staining protocol was the same for all samples with regard to processing, incubation times, and temperature. In addition, this study was approved by the ethics committee of the first affiliated hospital of Kunming Medical University, and this study was conducted in accordance with the Declaration of Helsinki.
TGF-β1 Induced Neutrophils to N2 Polarization in vitro
The acute promyelocytic leukemia (APL) cell line (NB-4) was cultured in RPMI-1640 culture medium containing 10% fetal bovine serum at 37°C in the presence of 5% CO2 (NB-4 cells were provided by Shanghai Bioleaf Biotech Co., Ltd). Then, using all-trans retinoic acid (ATRA) induced the differentiation of NB-4 cells into neutrophils. After NB-4 cells were differentiated by 1μmol/L ATRA on the 4th or 5th day, we verified by flow cytometry. A mouse IgM antihuman monoclonal antibody specific for CD11b (BD Biosciences, San Diego, California) was used to identify neutrophils. The verification results were shown in the supplementary materials (Supplementary Figure 1). According to different polarity disposal conditions, neutrophils were divided into 2 groups, normal control group and N2 polarization group (neutrophil group and neutrophil+TGF-β1 group). Neutrophils in the normal control group were intact. Neutrophils in the N2 polarization group were incubated with 10ng/mL TGF-β1 for 24h. Then, the miRNAs in neutrophil-derived exosomes were extracted, used sequencing to screen out the differentially expressed miRNAs, and then bio-informatics analysis was performed.
Exosome Purification and Characterization
Exosomes were prepared from neutrophil supernatants using differential centrifugation. Supernatants had been centrifuged at 2000g for 30 min to remove any contaminating exosomes. Add 1/3 (400ul) volume of exosome extraction reagent (Ribo™ Exosome Isolation Reagent) to the supernatants after centrifugation, mix well and put it at 4°C overnight. Finally, centrifuged at 1500g for 30min, discarded the supernatant, and the off-white precipitate at the bottom of the tube was the exosome.
Total RNA Extraction
Total RNA was extracted from samples using a TRIzol® Reagent (Invitrogen life technologies) according to the manufacturer’s introductions. RNA quantity and quality were measured by NanoDrop ND-1000. The integrity of RNA was assessed by standard denaturing agarose gel electrophoresis.
MiRNA Microarrays
The Whole Human MiRNA Microarray was a broad view that represents all known miRNAs in the human transcriptome. Sequences were compiled from a broad source survey, and then verified and optimized by alignment to the assembled human transcriptome.
RNA Labeling and Array Hybridization
Sample labeling and array hybridization were performed according to the Agilent miRNA Microarray System with miRNA Complete Labeling and Hyb Kit protocol (Agilent Technology). Briefly, total miRNA from each sample was labeled with Cyanine 3-pCp under the action of T4 RNA ligase. The labeled cRNA over the procession of inspissation and desiccation and then redissolved with water. 1 μg of each labeled cRNA was fragmented by adding 11 μL 10 × Blocking Agent and 2.2 μL of 25×Fragmentation Buffer, then heated at 60°C for 30 min, and finally 55 μL 2 × GE Hybridization buffer was added to dilute the labeled cRNA. 100 μL of hybridization solution was dispensed into the gasket slide and assembled to the gene expression microarray slide. The slides were incubated for 17 hours at 65°C in an Agilent Hybridization Oven. The hybridized arrays were washed, fixed and scanned by using the Agilent Microarray Scanner (part number G2505C).
Data Analysis
The normalized circRNA and miRNA expression data were imported to the WebCARMA for differential expression analysis. Moderated t-test (from limma package in R) was used to detect the difference between neutrophil+TGF-β1 group (2–1, 2–2, 2–3) and neutrophil group (1–1, 1–2, 1–3). The results were stored in “miRNA_DE.csv” in the DE_analysis fold, where the column “rawp” is the raw p value, the column “BH” is BH adjusted FDR and “meanM” is the mead difference between TEST group and CONTROL group.
Differentially expressed miRNAs with statistical significance between the two groups were identified through Volcano Plot filtering. Differentially expressed miRNAs between the two samples were identified through Fold Change filtering. Hierarchical Clustering was performed using the R scripts.
GO and KEGG Pathway Analysis
The Gene Ontology (GO) and Kyoto Encyclopedia of Genes and Genomes (KEGG) enrichment analysis were performed using DIANA-miRPath v3.0 using TargetScan database. The target prediction was also conducted using DIANA-miRPath v3.0 (TargetScan database) and the top 10 miRNAs (based on raw p-value). GO results were mainly classified into three subgroups, namely, biological process (BP), cellular component (CC), and molecular function (MF).
Construction of the miRNA-Targets Network Analysis
The corresponding targets were imported into Gephi for network analysis. The network is shown in Figure 1 (red nodes represent the miRNA and green nodes represent targets).
 |
Figure 1 Heat map generated by hierarchical clustering of differentially expressed miRNAs in neutrophil and N2 neutrophil samples. (A) Group 1: neutrophi samples, (B) Group 2: N2 neutrophil samples, the highly-expressed and lowly-expressed miRNAs are represented in red and green respectively. |
Construction of hsa-miR-3938 and hsa-miR-4780 Lentiviral Vector
CRCs were transfected with miR-4780 mimic, miR-4780 mimic NC, miR-3938 inhibitor, miR-3938 inhibitor NC using siRNA and siRNA-MateTM transfection reagent (ribo FECT ™ CP Transfection Kit). Briefly, 50–100 nM siRNA and 5ug/mL polybrene were mixed together and then added to cells that were 50–60% confluent. At 24–36 h after transfection, cells were collected for subsequent experiments.
qRT-PCR Assay
The content of the differentially expressed miRNAs in neutrophil group and neutrophil+TGF-β1 group were detected by utilizing real-time PCR. RT-PCR was performed using the Applied Biosystems 7300 Sequence Detection System (Ambion, Austin TX, USA). Glyceraldehyde 3-phosphate dehydrogenase (GAPDH) were quantified as an internal control for data normalization. The sequences of targets primers were as follows: TUSC1 forward primer was 5′-GACTTGAGAAGCTGGAA-3′, and reverse primer was 5′-TCGGGTTCCTGTAGAG-3′. ZNF197 forward primer was 5′-CTTCACTTCAGAGGAATG-3′, and reverse primer was 5′-ATAATTCTCCAGCATCAC-3′.
Statistical Analysis
All data were presented as mean ± SD. The comparison between two groups was conducted using unpaired Student’s t-test. p-value less than 0.05 were considered statistically significant.
Results
Comparison of the Neutrophil Infiltration Among the Different Groups
As shown in Figure 2, the expression of CD11b (CD11b is the most important adhesion molecule on neutrophil membrane) and CD66b (CD66b is a surface-specific molecular marker of tumor-infiltrating neutrophils (TINs)) were significantly increased in primary colorectal cancer. The matrix metalloproteinase-9 (mmp9) is a tumor angiogenesis protein produced by tumor-associated neutrophils, regarding the result of immunohistochemical staining, the expression of mmp9 was significantly increased in primary colorectal cancer (Figure 2A). Furthermore, we performed an IOD analysis on the number of CD11b, CD66b and mmp9 positive cells in primary colorectal cancer tissues and paracancerous tissues. The results were consistent with immunohistochemical staining (Figure 2B). These results suggested that neutrophils were associated with tumor cell adhesion, invasion and metastasis in colorectal cancer.
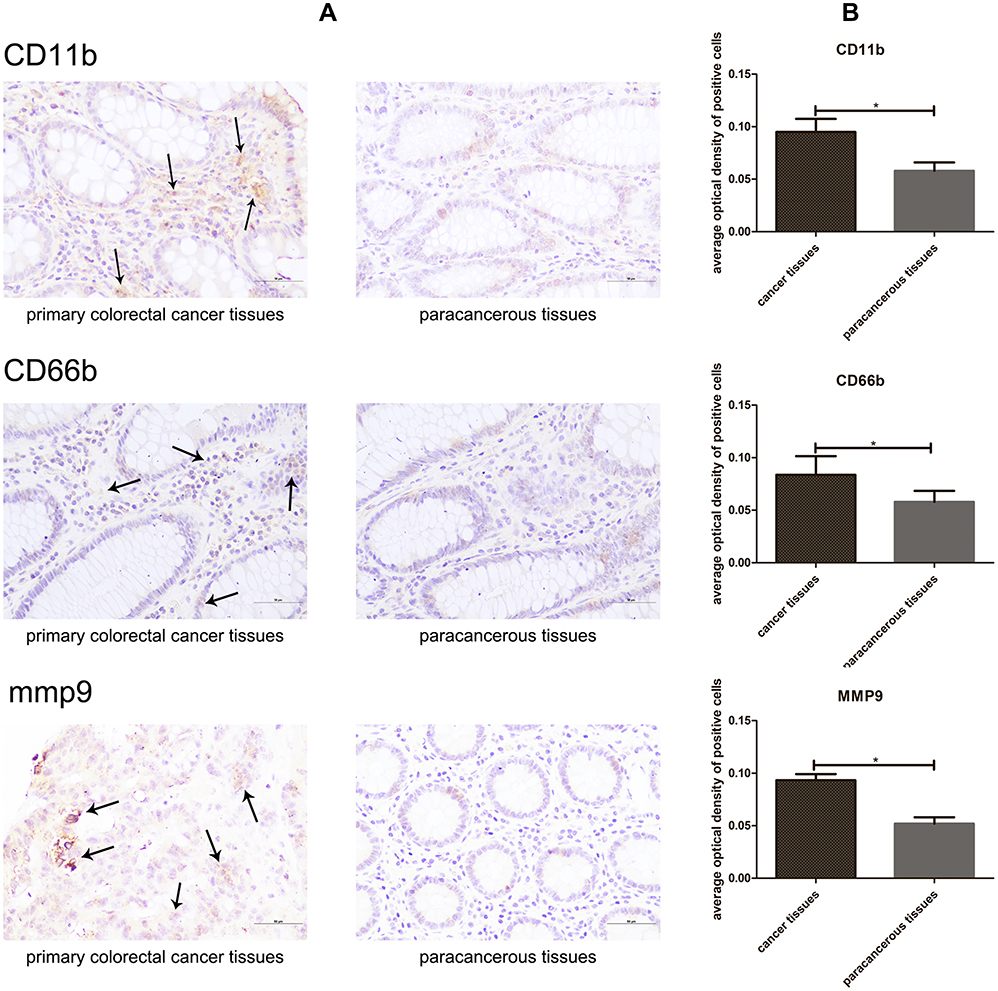 |
Figure 2 Representative immunohistochemical images (A) and IOD analysis (B) of neutrophil infiltration in primary colorectal cancer and paracancerous tissues. Both CD66b, CD11b and mmp9 showed positive staining (arrows).*P < 0.05. |
Expression Profiles of miRNAs in N2 Neutrophils
All DEmiRNAs were displayed in the hierarchical clustering (Figure 1), with red color representing high read counts and green color representing low read counts of miRNAs. We identified a total of 799 upregulated miRNAs and 902 downregulated miRNAs in all samples. There were 33 miRNAs with raw p-value lower than 0.05 (only 2 have FDR lower than 0.05). These 33 miRNAs were used for downstream analysis. All the significantly different miRNAs are listed in Table 1. Based on raw p value (neutrophil+TGF-β1 group VS. neutrophil group), the top 5 up-regulated miRNA were hsa-miR-4780, hsa-miR-513b-3p, hsa-miR-5703, hsa-miR-630, hsa-miR-4684-3p, and the top 5 down-regulated miRNA were hsa-miR-3938, hsa-miR-6089, hsa-miR-2114-3p, hsa-miR-1301-5p, hsa-miR-6736-3p. Moreover, there were 6/33 miRNA containing chromosomal distribution information: hsa-miR-2114-3p (chX), hsa-miR-1307-3p (ch10), hsa-miR-1273g-5p (ch1), hsa-miR-3151-5p (ch8), hsa-miR-3136-5p (ch3), hsa-miR-627-5p (ch15). As shown in Table 1, we used the Benjamin-Hochberg (BH) method to adjusted false discovery rate (FDR), thereby reducing the proportion of false positives in the results. Therefore, based on the value of BH-FDR, we chose hsa-mir-3938 and hsa-mir-4780 for further experiments.
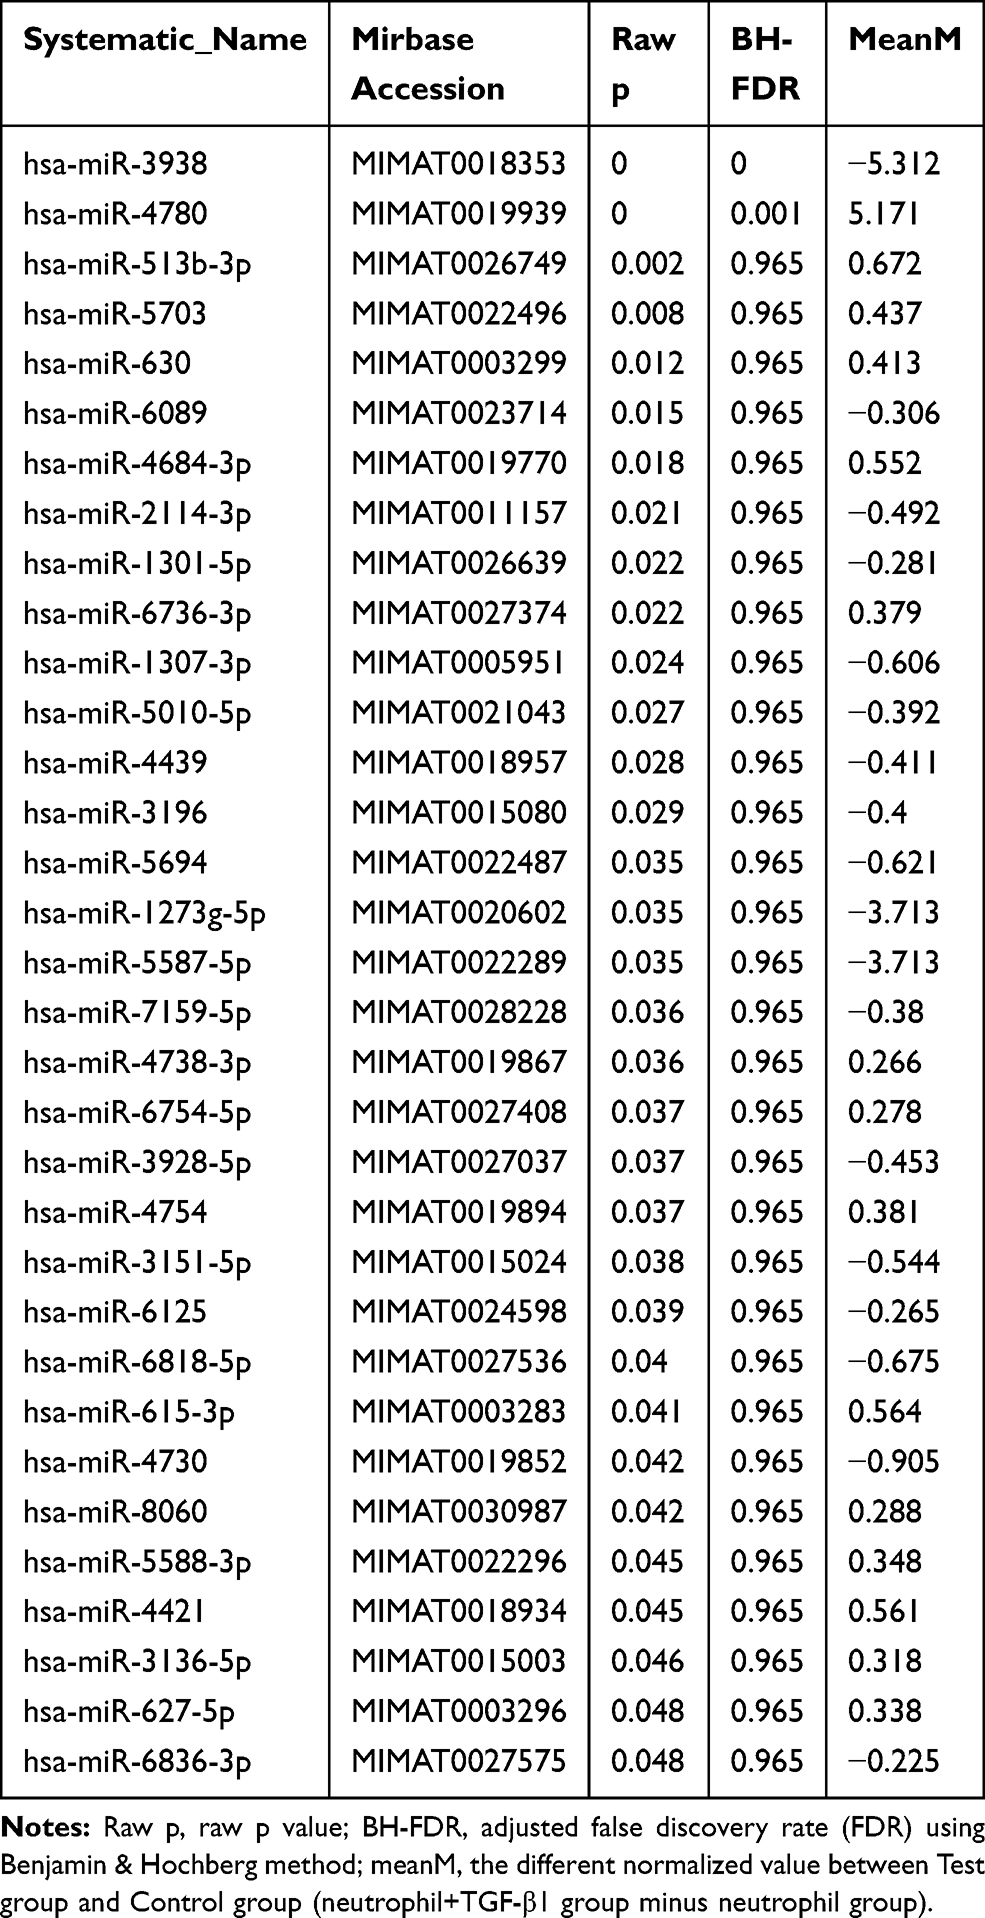 |
Table 1 Deferential Expression miRNA (Based on Raw p-value) |
In addition, as shown in Figure 3, enrichment of total miRNAs in the 3 neutrophils and 3 N2 neutrophils was estimated in the Box Plot. In the volcano plot and Scatter Plot, the up-regulated miRNAs were represented as the red dots, while the down-regulated miRNAs were represented as the green dots (Figure 4A and B).
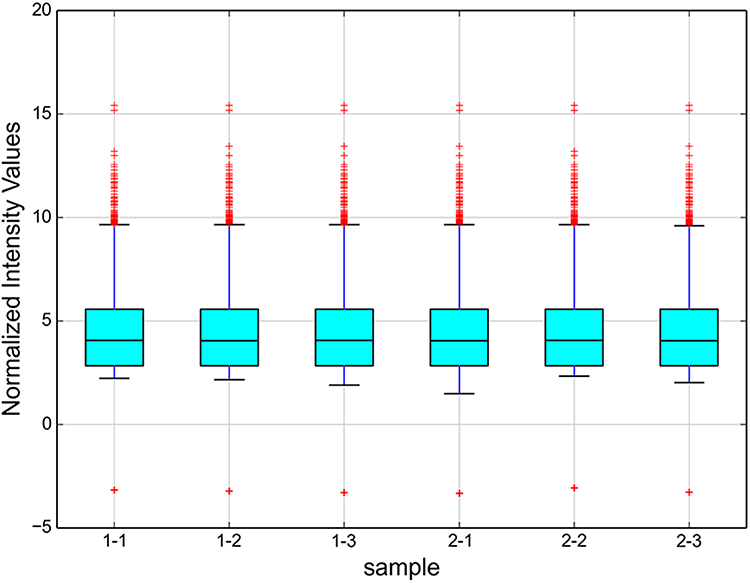 |
Figure 3 The box plot shows the enrichment of total miRNAs in each sample. Box plot was used for intuitive analysis and comparison of the average level and degree of variation of multiple sets of data, and was a convenient method for quickly observing the data distribution. The y-axis shows the total miRNA enrichment as the log2-ratio. In the resulting profile, all enrichment > 0 are shown. |
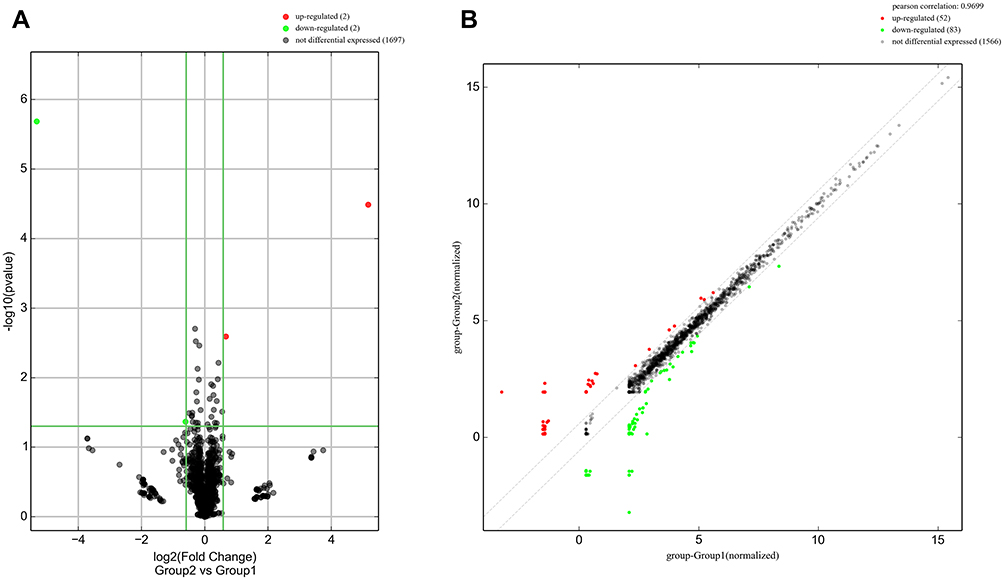 |
Figure 4 The volcano plot and Scatter Plot. (A) The volcano plot represented the differentially expressed miRNAs with statistical significance; (B) Scatter plot illustrated the normalized circRNA expression in both groups. The x-axis represented the miRNA level in neutrophil group, the y-axis represented the miRNA level in N2 neutrophil group. In the volcano plot and Scatter Plot, the up-regulated miRNAs were represented as the red dots, while the down-regulated miRNAs were represented as the green dots. |
GO and KEGG Analysis of miRNAs
The top 10 enriched GO-BP terms, the top 9 enriched GO-MF and the top 5 enriched GO-BP terms that may be associated with the mechanism of N2 neutrophils in tumor tissue infiltration are shown in Figure 5. According to the results, the most enriched and meaningful GO-BP terms were related to “cellular nitrogen compound metabolic process,” “biosynthetic process,” “small molecule metabolic process,” “symbiosis encompassing mutualism through parasitism,” “viral process,” “neurotrophic TRK receptor signaling pathway,” “gene expression,” “cellular protein modification process,” “cellular protein metabolic process” and “catabolic process.” Within the GO-CC terms, the largest number of predicted target genes were involved in organelle, cellular component, protein complex, cytosol and nucleoplasm. Regarding the GO-MF terms, the predicted target genes were mainly associated with ion binding, enzyme binding, nucleic acid binding transcription factor activity, molecular function, cytoskeletal protein binding, enzyme regulator activity, transmembrane transporter activity, protein binding transcription factor activity and small conjugating protein binding.
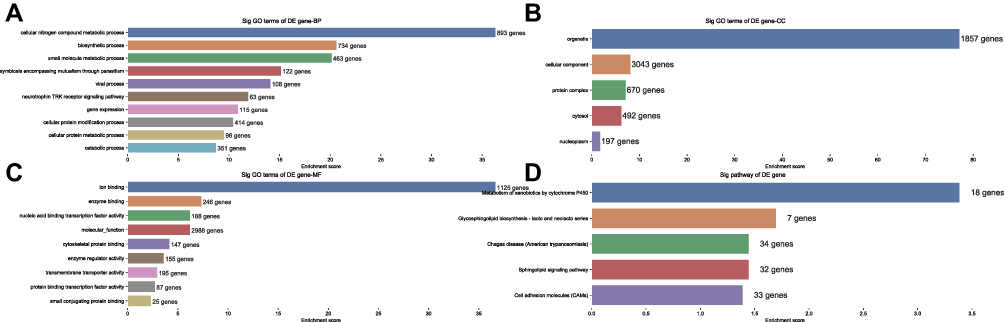 |
Figure 5 Gene Ontology and KEGG Pathway enrichment for the host genes encoding DEmiRNAs. |
Regarding the KEGG analyses, the most significantly enriched pathways of the miRNA host genes were metabolism of xenobiotics by cytochrome P450, Glycosphingolipid biosynthesis-lacto and neolacto series, Chagas disease (American trypanosomiasis), sphingolipid signaling pathway and cell adhesion molecules (CAMs) (Figure 5).
Construction of miRNA-Targets Networks
These 10 miRNAs in total were used for prediction of their targets and a network containing these miRNAs and genes was constructed (Figure 6). In addition, the target genes regulated by DEmiRNAs were listed, as shown in Table 2, which showed that 80 target genes were regulated by hsa-miR-3938, and 101 target genes were regulated by hsa-miR-4780. The results showed that 2 target genes, including TUSC1 and ZNF197, were regulated by hsa-mir-3938 and hsa-mir-4780 simultaneously.
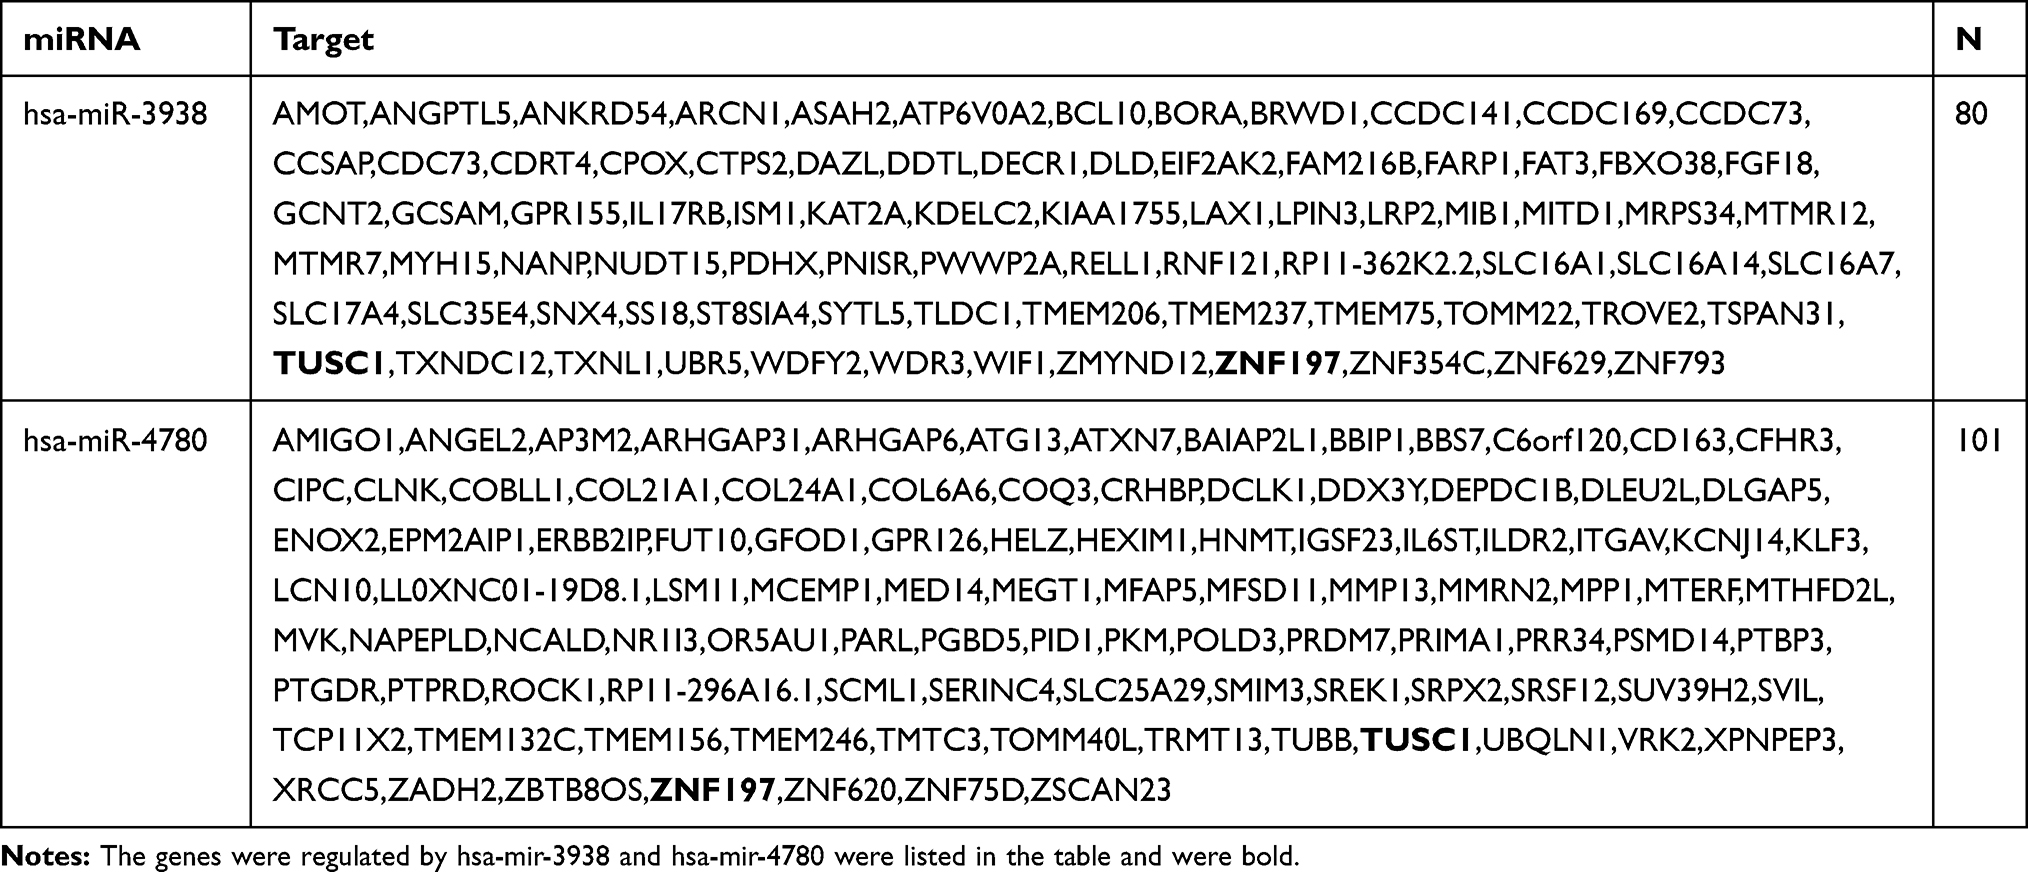 |
Table 2 DEmRNAs Target Genes |
 |
Table 3 List of Abbreviations |
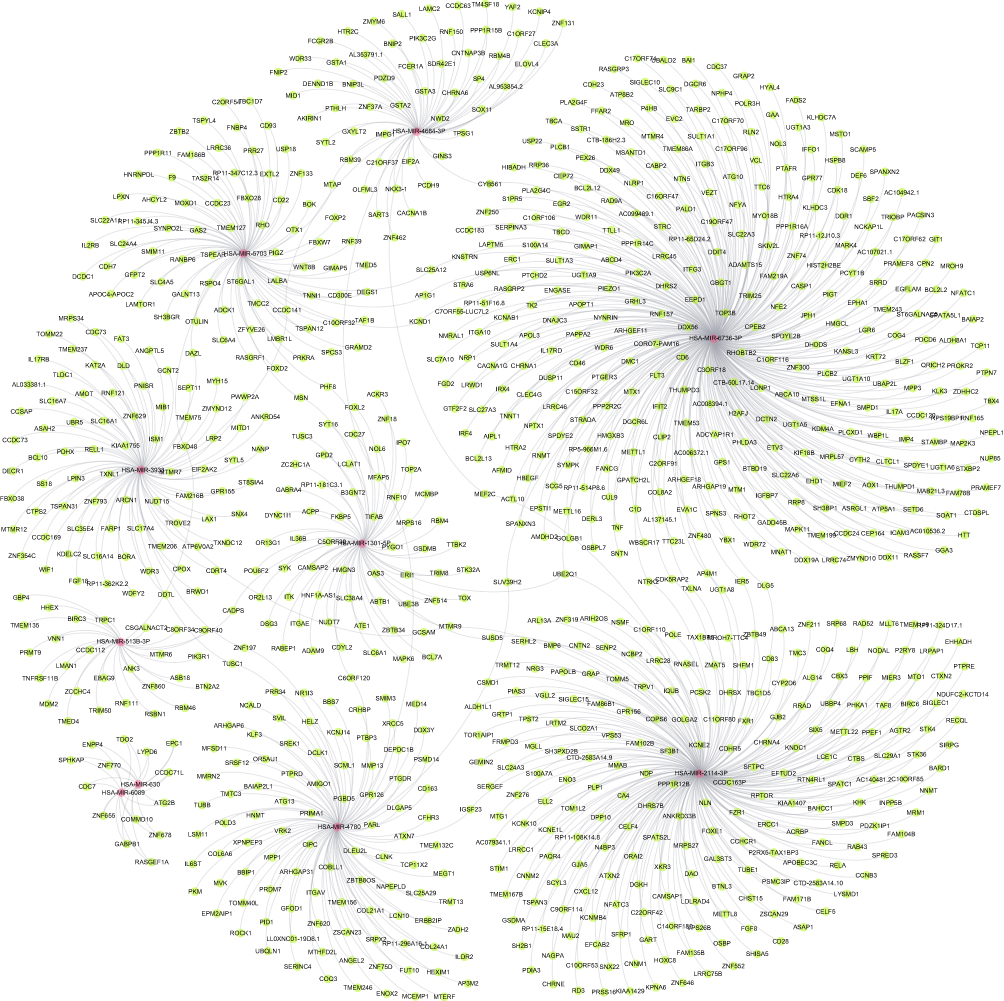 |
Figure 6 The predicted downstream miRNA-targets network of the validated DEmiRNAs. |
The Expression Levels of DEmiRNA, TUSC1 and ZNF197
Figure 7A and B showed the expression levels of DEmiRNA in neutrophil group and neutrophil+TGF-β1 group. As shown in Figure 7, in the neutrophil+TGF-β1 group, the expression levels of hsa-miR-3938 were significantly decreased (P = 0.0130), while the hsa-miR-4780 expression increased significantly (P = 0.0188). In addition, as shown in Figure 7C, the expression level of DEmiRNA targets also showed significant difference in the two groups. Regarding the neutrophil+TGF-β1 group, the expression levels of TUSC1 were significantly decreased (P = 0.0024), while the ZNF197 expression increased significantly (P = 0.0058).
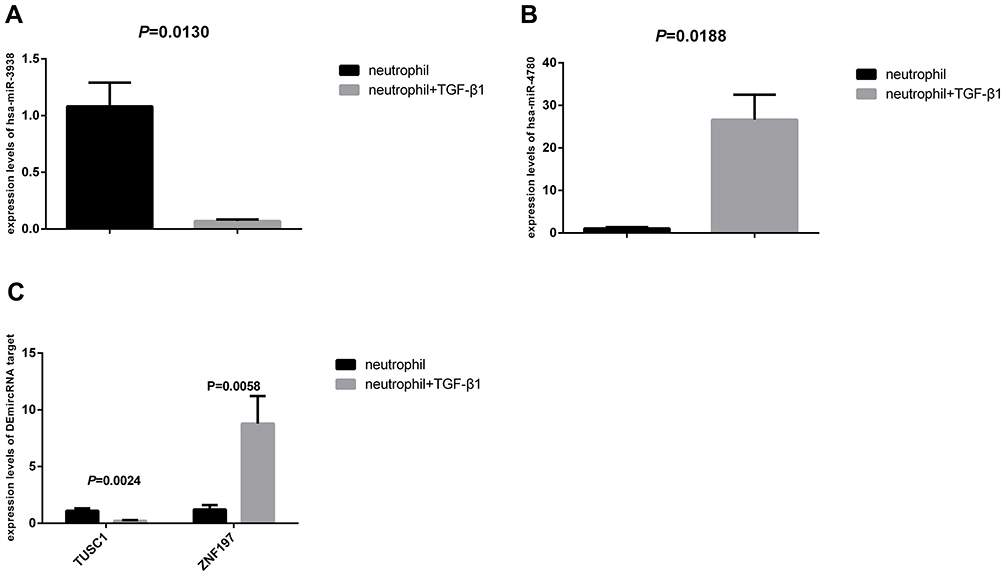 |
Figure 7 The expression levels of DEmiRNA, TUSC1 and ZNF197. (A) The expression levels of hsa-miR-3938 in neutrophil group and neutrophil+TGF-β1 group; (B) The expression levels of hsa-miR-4780 in neutrophil group and neutrophil+TGF-β1 group; (C) The expression levels of TUSC1 and ZNF197 in neutrophil group and neutrophil+TGF-β1 group. |
The Correlation Between hsa-mir-3938 and hsa-mir-4780 and TUSC1 and ZNF197 in CRC Cells
Figure 8 shows the effects of hsa-mir-3938 and hsa-mir-4780 on expression of TUSC1 and ZNF197. As shown in Figure 8, compared with the NC group, down-regulation of hsa-mir-3938 expression and up-regulation of hsa-mir-4780 expression both resulted in decreased expression of TUSC1 gene (Figure 8A) and increased ZNF197 gene (Figure 8B) expression. In addition, CRC cells co-transfected with low-expressing hsa-mir-3938 and high-expressing hsa-mir-4780 showed more decreased TUSC1 gene expression and more increased ZNF197 gene expression.
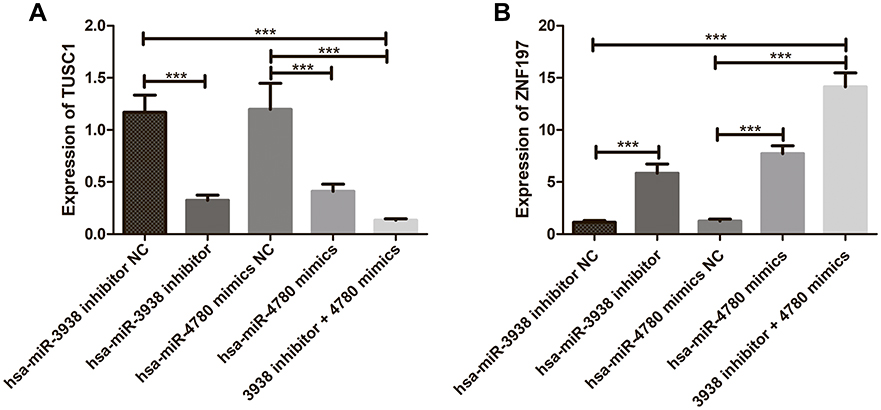 |
Figure 8 (A) The effects of hsa-mir-3938 and hsa-mir-4780 on expression of TUSC1; (B) The effects of hsa-mir-3938 and hsa-mir-4780 on expression of ZNF197. ***P < 0.001. |
Discussion
CRC is the most common malignant tumor of digestive tract in the world, which seriously endangers people’s health and quality of life. However, its pathogenesis has not been completely elucidated, and progression of CRC is a process that involves multiple genetic changes, multi-factor, multi-step process.17,18 Previous studies indicate that one-third of CRC patients may develop liver metastases, and most of CRC-related death is usually attributed to distant metastasis. More and more evidences showed that neutrophils played an important role in tumor tissue infiltration to promoting the growth, invasion, angiogenesis and metastasis of various types of cancer.19,20 In addition, studies showed that exosomes as a novel mechanism of intercellular communication, could lead to the exchange of genetic information and reprogramming of recipient cells and transport various biomolecules, such as proteins, messenger RNAs (mRNAs), miRNAs, and long non-coding RNAs (lncRNAs).21,22 Recent studies showed that exosomes play multiple roles in promoting tumor growth, metastasis and drug resistance. However, the function of neutrophil-derived exosomes in development, invasion and metastasis of CRC has not been well characterized. In this study, we reported miRNA profiles in the neutrophils of CRC for the first time. Additionally, a network between miRNAs in neutrophils and targets, which may participate in tumor tissue infiltration in CRC, was constructed.
In this study, a total of 33 differentially expressed miRNAs were identified in TGF-β1-infected neutrophils. KEGG pathway and GO category analysis demonstrated that the target miRNAs were associated with many physiological processes. GO analysis implied that the DEmiRNAs were presumably involved in the biosynthetic and small molecules metabolic process of organelles, nuclei and cytoplasm in cells. The KEGG pathway analysis showed enrichment in the biological processes of cytochrome P450 metabolism xenobiotics, Glycosphingolipid biosynthesis-lacto and neolacto series, sphingolipid signaling pathway and CAMs. The results of miRNA-targets networks showed that the hsa-mir-3938 and hsa-mir-4780 could regulate TUSC1 and ZNF197. These results suggested that the TUSC1 and ZNF197 gene regulated by DEmiRNAs in N2 neutrophils might be related to biosynthesis, metabolism and signal transduction in colorectal cancer cells.
Tumor suppressor candidate 1 (TUSC1) gene is located within the region of chromosome 9p that harbors tumor suppressor genes critical in carcinogenesis. It is an intronless gene which is downregulated in non-small-cell lung cancer and small-cell lung cancer cell lines, suggesting that it may play a role in lung tumorigenesis (provided by RefSeq, Jul 2008).23 Furthermore, a previous study provided further evidence that TUSC1 expression was downregulated in lung cancer cell lines and a trend towards higher expression of TUSC1 was correlated with longer survival times for lung cancer patients.24 However, there is no report about biological functions and regulatory mechanisms of the TUSC1 gene in the CRC. In the current study, the results showed that TUSC1 protein decreased significantly in N2 type neutrophils compared with neutrophils. Another result showed that in N2 type neutrophils, hsa-mir-3938 expression decreased significantly, while hsa-mir-4780 expression increased significantly. In N2 neutrophils, TUSC1 gene might inhibit the adhesion, invasion and metastasis of colorectal cancer cells, which might be related to the downregulation of hsa-mir-3938 expression and the upregulation of hsa-mir-4780 expression in the tumor microenvironment.
Zinc finger protein 197 (ZNF197) gene product belongs to the zinc finger protein superfamily, members of which are regulatory proteins characterized by nucleic acid-binding zinc finger domains. The encoded protein contains 20 tandemly arrayed C2H2-type zinc fingers, a Kruppel-associated box (KRAB) domain, and a SCAN box. This gene is located in a cluster of zinc finger genes at 3p21. It is overexpressed in some thyroid papillary carcinomas (provided by RefSeq, May 2017).25 However, there is no report about biological functions and regulatory mechanisms of the ZNF197 gene in the CRC. In our study, the results showed that ZNF197 protein increased significantly in N2 type neutrophils group. According to the results of miRNA-targets networks, also suggesting that the ZNF197 gene regulated by hsa-mir-3938 and hsa-mir-4780 in N2 neutrophils might be related to the tumor cell growth, invasion, metastasis and occurrence/development of CRC. The current research on this area is relatively less, there is much research work needs to be done in future.
Conclusion
Our study indicated that the regulation of TUSC1 and ZNF197 by hsa-mir-3938 and hsa-mir-4780 established the theoretical basis for the mechanism of N2 type neutrophils regulating the invasion and metastasis of CRC cells, and provided experimental evidence for future clinical research and also provided the potential biomarker for clinical treatment of CRC, but more studies should be conducted to support this new hypothesis.
List of abbreviations
A list of abbreviations was provided in Table 3.
Ethics Approval and Informed Consent
This study received a documented review and approval from a formally constituted review board (The ethics committee of the first affiliated hospital of Kunming Medical University). Written informed consent have been provided by the patients.
Acknowledgment
This work was supported by Yunnan Fundamental Research Projects (NO. 2019FA039), National Natural Science Foundation of China (No.31660312), and leading medical talents in Yunnan (NO. L-2017001).
Author Contributions
All authors contributed to data analysis, drafting or revising the article, gave final approval of the version to be published, and agree to be accountable for all aspects of the work.
Disclosure
The authors report no conflicts of interest in this work.
References
1. Swiderska M, Choromańska B, Dąbrowska E, et al. The diagnostics of colorectal cancer. Contemp Oncol (Pozn). 2014;18(1):1–6. doi:10.5114/wo.2013.39995
2. Hu J-M, Shen C-J, Chou Y-C, et al. Risk of colorectal cancer in patients with periodontal disease severity: a nationwide, population-based cohort study. Int J Colorectal Dis. 2018;33(3):349–352. doi:10.1007/s00384-018-2965-2
3. Haggar FA, Boushey RP. Colorectal cancer epidemiology: incidence, mortality, survival, and risk factors. Clin Colon Rectal Surg. 2009;22(04):191–197. doi:10.1055/s-0029-1242458
4. Shaul ME, Fridlender ZG. Neutrophils as active regulators of the immune system in the tumor microenvironment. J Leukoc Biol. 2017;102(2):343–349. doi:10.1189/jlb.5MR1216-508R
5. Joyce JA, Pollard JW. Microenvironmental regulation of metastasis. Nat Rev Cancer. 2009;9(4):239–252. doi:10.1038/nrc2618
6. Masucci MT, Minopoli M, Carriero MV, et al. Tumor associated neutrophils. Their role in tumorigenesis, metastasis, prognosis and therapy. Front Oncol. 2019;9:1146. doi:10.3389/fonc.2019.01146
7. Allavena P, Sica A, Garlanda C, et al. The Yin-Yang of tumor-associated macrophages in neoplastic progression and immune surveillance. Immunol Rev. 2008;222(1):155–161. doi:10.1111/j.1600-065X.2008.00607.x
8. Stojkovic Lalosevic M, Pavlovic Markovic A, Stankovic S, et al. Combined diagnostic efficacy of Neutrophil-to-Lymphocyte Ratio (NLR), Platelet-to-Lymphocyte Ratio (PLR), and mean Platelet Volume (MPV) as biomarkers of systemic inflammation in the diagnosis of colorectal cancer. Dis Markers. 2019;2019:6036979. doi:10.1155/2019/6036979
9. Pedrazzani C, Mantovani G, Fernandes E, et al. Assessment of neutrophil-to-lymphocyte ratio, platelet-to-lymphocyte ratio and platelet count as predictors of long-term outcome after R0 resection for colorectal cancer. Sci Rep 2017;7:1494.
10. Li H, Zhao Y, Zheng F, et al. Prognostic significance of elevated preoperative neutrophil-to-lymphocyte ratio for patients with colorectal cancer undergoing curative surgery: a meta-analysis. Medicine. 2019;98(3):e14126. doi:10.1097/MD.0000000000014126
11. Tanio A, Saito H, Uejima C, et al. A prognostic index for colorectal cancer based on preoperative absolute lymphocyte, monocyte, and neutrophil counts. Surg Today. 2019;49(3):245–253. doi:10.1007/s00595-018-1728-6
12. Ma X, Becker Buscaglia LE, Barker JR, et al. miRNAs in NF-kappaB signaling. J Mol Cell Biol. 2011;3(3):159–166. doi:10.1093/jmcb/mjr007
13. Lai H, Zhang J, Zuo H-Q, et al. Advances in research on the correlation between miRNA and colorectal cancer metastasis. Chin J New Clin Med. 2019;12:1168–1171.
14. Xu J, Meng Q, Li X, et al. Long noncoding RNA MIR17HG promotes colorectal cancer progression via miR-17-5p. Cancer Res. 2019;79:4882–4895.
15. Fu F, Jiang W, Zhou L, et al. Circulating exosomal miR-17-5p and miR-92a-3p predict pathologic stage and grade of colorectal cancer. Transl Oncol. 2018;11(2):221–232. doi:10.1016/j.tranon.2017.12.012
16. Diaz-Riascos ZV, Ginesta MM, Fabregat J, et al. Expression and role of miRNAs from the miR-200 family in the tumor formation and metastatic propensity of pancreatic cancer. Mol Ther Nucleic Acids. 2019;17:491–503. doi:10.1016/j.omtn.2019.06.015
17. Caraglia M, Correale P, Giannicola R, et al. GOLFIG chemo-immunotherapy in metastatic colorectal cancer patients. A critical review on a long-lasting follow-up. Front Oncol. 2019;9:1102. doi:10.3389/fonc.2019.01102
18. Arai H, Battaglin F, Wang J, et al. Molecular insight of regorafenib treatment for colorectal cancer. Cancer Treat Rev. 2019;81:101912. doi:10.1016/j.ctrv.2019.101912
19. Mizuno R, Kawada K. The role of tumor-associated neutrophils in colorectal cancer. Int J Mol Sci. 2019;20:529.
20. Fridlender ZG, Albelda SM. Tumor-associated neutrophils: friend or foe? Carcinogenesis. 2012;33(5):949–955. doi:10.1093/carcin/bgs123
21. Zhang X, Shi H, Yuan X, et al. Tumor-derived exosomes induce N2 polarization of neutrophils to promote gastric cancer cell migration. Mol Cancer. 2018;17(1):146. doi:10.1186/s12943-018-0898-6
22. Han Q, Zhao H, Jiang Y, et al. HCC-derived exosomes: critical player and target for cancer immune escape. Cells. 2019;8(6):558. doi:10.3390/cells8060558
23. Shan Z, Parker T, Wiest JS, et al. Identifying novel homozygous deletions by microsatellite analysis and characterization of tumor suppressor candidate 1 gene, TUSC1, on chromosome 9p in human lung cancer. Oncogene. 2004;23(39):6612–6620. doi:10.1038/sj.onc.1207857
24. Shan Z, Shakoori A, Bodaghi S, et al. TUSC1, a putative tumor suppressor gene, reduces tumor cell growth in vitro and tumor growth in vivo. PLoS One. 2013;8(6):e66114. doi:10.1371/journal.pone.0066114
25. Li Z, Wang D, Na X, Schoen SR, Messing EM, Wu G. The VHL protein recruits a novel KRAB-A domain protein to repress HIF-1alpha transcriptional activity. EMBO J. 2003;22(8):1857–1867. doi:10.1093/emboj/cdg173
 © 2020 The Author(s). This work is published and licensed by Dove Medical Press Limited. The full terms of this license are available at https://www.dovepress.com/terms.php and incorporate the Creative Commons Attribution - Non Commercial (unported, v3.0) License.
By accessing the work you hereby accept the Terms. Non-commercial uses of the work are permitted without any further permission from Dove Medical Press Limited, provided the work is properly attributed. For permission for commercial use of this work, please see paragraphs 4.2 and 5 of our Terms.
© 2020 The Author(s). This work is published and licensed by Dove Medical Press Limited. The full terms of this license are available at https://www.dovepress.com/terms.php and incorporate the Creative Commons Attribution - Non Commercial (unported, v3.0) License.
By accessing the work you hereby accept the Terms. Non-commercial uses of the work are permitted without any further permission from Dove Medical Press Limited, provided the work is properly attributed. For permission for commercial use of this work, please see paragraphs 4.2 and 5 of our Terms.