")
Back to Journals » OncoTargets and Therapy » Volume 12
miRNA-15a regulates the proliferation and apoptosis of papillary thyroid carcinoma via regulating AKT pathway
Authors Jin J, Zhang J, Xue Y, Luo L, Wang S, Tian H
Received 23 April 2019
Accepted for publication 23 June 2019
Published 6 August 2019 Volume 2019:12 Pages 6217—6226
DOI https://doi.org/10.2147/OTT.S213210
Checked for plagiarism Yes
Review by Single anonymous peer review
Peer reviewer comments 2
Editor who approved publication: Professor Gaetano Romano
Jin Jin,1 Jie Zhang,2 Yigui Xue,3 Li Luo,2 Siyao Wang,2 Haoming Tian1
1Department of Endocrinology, West China School of Medicine/West China Hospital of Sichuan University, Chengdu, Sichuan 610041, People’s Republic of China; 2Department of Endocrinology, The Fifth Affiliated Hospital of Xinjiang Medical University, Urümqi, Xinjiang 830011, People’s Republic of China; 3Teaching and Research Laboratory of Field Medical, Border Defense Training Group of Land Force Military Medical University, Changji, Xinjiang 831200, People’s Republic of China
Aim: Aberrantly expressed microRNAs (miRNAs) are involved in many diseases including cancer. The expression of miR-15a was reported to be downregulated in papillary thyroid carcinoma (PTC) compared to control tissue. However, the mechanism underlying this downregulation remains unclear.
Methods: The effects of miR-15a on the proliferation and invasion of PTC cells were evaluated by CCK-8 and transwell assays, respectively. Expression levels of AKT and rearranged during transfection (RET) in cells were assessed using Western blotting. The correlation of RET and miR-15a was validated by luciferase reporter assay. Moreover, in vivo assay was performed to demonstrate the effect of miR-15a on tumor growth.
Results: We confirmed that the expression of miR-15a was significantly lower in PTC tissue than that in normal tissue. Overexpression of miR-15a notably inhibited PTC cell proliferation and invasion via promoting apoptosis. Additionally, RET was found to be a target of miR-15a and this correlation was confirmed by dual-luciferase assay and Western blot. Furthermore, in vivo study revealed that overexpression of miR-15a inhibited tumor growth via downregulating the levels of RET and phosphorylated AKT.
Conclusion: In the present study, we demonstrated that miR-15a played an antitumor role in regulating PTC via targeting RET/AKT pathway. Therefore, miR-15a may serve as a potential molecular target for the treatment of PTC.
Keywords: miRNA-15a, papillary thyroid carcinoma, AKT pathway, apoptosis
Introduction
Thyroid carcinoma (TC), the most common malignancy of the endocrine system, accounted for 94% of the endocrine system cancers and 66% of the deaths due to endocrine organ cancer. TC includes four histological subtypes: papillary thyroid carcinoma (PTC), follicular TC, medullary TC, and anaplastic TC. Among them, PTC accounts for more than 80% of the TC patients.1
MicroRNA (miRNA) is a small noncoding RNA molecule (about 22 nucleotides) and found in plants, animals, and viruses. It functions in RNA silencing and post-transcriptional regulation of gene expression. By base-pairing with complementary sequences within mRNA molecules, it could silence its paired mRNA. Several miRNAs have been reported to link with cancers, such as lung cancer, ovarian cancer, breast cancer, prostate cancer, and so on.2–5 The expressions of miRNAs between cancer and normal tissues vary greatly among different cancer types.2–5 Specific patterns of miRNA expression, either overexpressed or downexpressed compared with normal tissues, have also been identified in tumors, including TCs.6–11 It was reported that miRNA-146b, miRNA-221, miRNA-222, and miRNA-181b were overexpressed in PTCs as compared with that in normal thyroid tissues, and such upregulations were positively associated with tumor aggressiveness.12–16
miR-15a was found dysregulated in pancreatic cancer tissue compared to normal tissue, and an in vitro study confirmed that upregulation of miR-15a inhibited the viability of pancreatic cancer cells.17 In prostate cancer, miR-15a regulated prostate cancer cells by targeting multiple oncogenic activities.18 In addition, miR-15a was also reported to be aberrantly expressed in ovarian cancer, non-small cell lung cancer, lymphocytic leukemia, and so on.19–21 A recent miRNA expression profiling study demonstrated that miR-15a had a >2-fold decrease in expression between PTC tissue and normal tissues.22 However, the mechanism underlying this differential expression remains unclear. Therefore, the present study aimed to explore the antitumor effects of miR-15a on human PTC cells TPC-1 in vitro and in vivo.
Materials and methods
Patient sample collection
A total of 30 patients with PTC who received surgery and 30 healthy people without any abnormal conditions in the thyroid were treated at West China Hospital of Medicine. Clinical samples used in the present experiment were obtained from January 2014 to February 2019. Written informed consent was obtained from all participants. The study protocol was approved by the situational Ethics Committee at West China Hospital of Medicine and in accordance with the Declaration of Helsinki. The samples were stored in a refrigerator at −80°C. The differential expression of miR-15a between patients with PTC and healthy people was detected with RT-qPCR.
Cell culture and cell transfection
Human PTC cell line TPC-1 was purchased from ATCC. TPC-1 cells were cultured in DMEM medium supplemented with 5% FBS, 100 U/mL penicillin, 1 μg/mL streptomycin, and 100 μg/ml amphotericin at 37°C and 5% CO2 atmosphere. TPC-1 cells were transfected with miR-15a mimics, miR-15a inhibitor, and miR-NC with Lipofectamine® 2000 (Thermo Fisher Scientific, Waltham, MA, USA). miR-15a mimics and inhibitor were purchased from Genepharma (Shanghai, China). Total RNAs were extracted from TPC-1 cells with TRIzol® 48 hrs after transfection.
Quantitative RT-PCR
Total RNAs extracted from tissue or TPC-1 cells were reversely transcribed to cDNA using the NCode™ miRNA first-strand cDNA synthesis (Invitrogen, Carlsbad, CA, USA). according to the manufacturer’s instructions. qRT-PCR analysis for miR-15a was performed in triplicate by the aid of SYBR® Green PCR Master Mix (Applied Biosystems, Foster City, CA, USA). U6 snRNA level was used for normalization. The fold change of miRNA for different comparing groups was calculated using the 2-ΔΔCT method. The primers for miR-15a measurement are as follows: reverse-transcription primer: GTCGTATCCAGTGCAGGGTCCGAGGTATTCGCACTGGATACGACCTCAAA; forward primer: 5ʹ-TAGCAGCACATAATGG-3ʹ; reverse primer: 5ʹ-GTGCAGGGTCCGAGGT-3ʹ. The primers for U6: F, 5ʹ-CTCGCTTCGGCAGCACA-3ʹ; R, 5ʹ-AACGCTTCACGAATTTGCGT-3ʹ.
Cell proliferation assay
The cell proliferation value was measured by Cell Counting kit-8 assay (CCK-8, Dojindo, Kumamoto, Japan) at 24, 48, and 72 hrs after transfection in triplicate. CCK-8 reagent (10 μL) was added into TPC-1 cells followed by incubation of 1 hr at 37°C. Next, the absorbance was measured at 450 nm using a microplate reader (L-117; Thermo Fisher Scientific).
Cell apoptosis assay
TPC-1 cells at 48 hrs after transfection were washed by cold PBS and centrifuged at 1000 g for 5 mins. The residue was resuspended in 100 μL binding buffer. Subsequently, 4 μL Annexin V-fluorescein isothiocyanate and 3 μL propidium iodide were added. Following incubationg for 15 mins at room temperature (RT), 200 μL binding buffer was added and measured by an FCM flow cytometer (BD Bioscience, San Jose, CA, USA). The same experiments were performed in triplicate.
Matrigel invasion assay
The cell invasion assay was conducted with BioCoat Matrigel Invasion Chambers (Corning Incorporated, Corning, NY, USA) according to the manufacturer’s protocol. The upper chamber was precoated with 100 μL Matrigel and exposed to UV light for 2 hrs. Following transfection with miR-15a mimics, the HUVECs, in serum-free medium, were added in double to the upper well. Subsequently, the cells were incubated at 37°C for 24 hrs. Next, cells on the surface of the upper chamber membrane were discarded with cotton swabs. The cells on the underside of the membrane were fixed in 100% methanol and stained with a solution containing 50% isopropanol, 1% formic acid, and 0.5% crystal violet. Subsequently, cells were counted using a light microscope. Samples were run in sextuple for each experiment.
Dual-luciferase reporter system assay
The wild-type (WT) or mutant (MT) 3′UTR of rearranged during transfection (RET) was cloned into the Renilla luciferase gene. A mutant 3′UTR of RET was cloned by use of GeneChem (Shanghai, China). The TPC-1 cells were co-transfected with the vectors carrying WT 3′UTR or MT 3′UTR and miR-15a mimics. Cells were collected 48 hrs after transfection and analyzed using the Dual-Luciferase Reporter Assay System (Promega Corporation, Fitchburg, MA, USA). Luciferase activity values were normalized relative to that of the Renilla luciferase internal control.
Western blot analysis
A total of 30 μg of samples were run on 10% SDS-PAGE. The proteins were then transferred to NC filter membranes. The membranes were blocked overnight in 5% skim milk in Tris-buffered saline. For immunoblotting, the membranes were incubated at 4°C overnight with the RET antibody (cat. #14,556, 1:500; Cell Signaling Technology, Danvers, MA, USA), phospho-RET (Tyr905) antibody (cat. #3221, Cell Signaling Technology), AKT (C67E7) rabbit mAb (cat. #4691, Cell Signaling Technology), phospho-Akt (Ser473) (193H12) rabbit mAb (cat. #4058, Cell Signaling Technology, Inc.), PI3 kinase p110α (C73F8) rabbit mAb (cat. #4249, Cell Signaling Technology), phospho-PI3 kinase p85 (Tyr458)/p55 (Tyr199) (E3U1H) rabbit mAb (cat. #17366, Cell Signaling Technology), and β-actin (13E5) rabbit mAb (cat. #4970, Cell Signaling Technology). Next, membranes were incubated with the appropriate peroxidase-conjugated secondary antibody for 2 hrs at RT. Subsequently, the NC membranes were incubated with enhanced chemiluminescence reagent (Santa Cruz Biotechnology, Dallas, TX, USA) to develop the blots. All values were normalized to those of β-actin.
In vivo animal study
To investigate the effects of miR-15a on PTC cell line TPC-1 in vivo, animal study was performed. Fifteen male BALB/nude mice (aged 6–8 weeks) were purchased from Shanghai Slac Animal Center (Shanghai, China) and housed within a constant temperature of 18–23°C and 55–65% humidity.
A total of 5×10⁶ TPC-1 cells and treatment reagents (blank, miR-NC, and miR-15a mimics, 50 nM) were injected subcutaneously into the right armpit area of the mice. Tumor volume was measured by caliper according to the formula: 1/2 × (length × width) weekly. When the tumor volume reached about 200 mm3, nude mice were randomly divided into 3 groups (4 mice/group): blank, miR-NC, and miR-15a mimics. Each mouse was intratumorally injected with 50 mM miR-15a mimics, miR-NC, or PBS twice weekly for 4 weeks until euthanasia under anesthesia. Body weight and tumor weight were recorded during the entire procedure. Tumor tissues were resected and stored at −20°C before analysis. All animal experiments were performed in accordance with institutional guidelines, following a protocol approved by the Ethics Committees of West China Hospital of Medicine. National Institutes of Health guide for the care and use of laboratory animals was followed by us.
TUNEL assay
Apoptotic cells on paraffin-embedded tissue were detected using Apo-BrdU-IHC™ Kit (Pheonix Flow System, SanDiego, CA, USA) according to the manufacturer’s instruction. Tumor samples were fixed by methanol at 4°C for 24 hrs, followed by dehydration and embedment in paraffin. Samples were deparaffinized and rehydrated upon the conduction of TUNEL assay. The samples were incubated with 100 μL antibody solution and 100 mL DAB solution at RTfor 15 mins. Methyl green was applied as a counterstain. TUNEL positively stained cells represent the cells undergoing apoptosis.)
Statistical analysis
Version 7.0 Prism (GraphPad, San Diego, CA, USA) was used to conduct data analysis. The comparison for the two groups was analyzed by Student’s t-test. The comparison among multiple groups was analyzed with one-way ANOVA followed by Tukey’s test. Each expreiment was executed at least three time, and all data were expressed as the mean±SD. P<0.05 indicates a statistically significant difference.
Results
Differentiate expressions of miR-15a in human PTC tissues and normal tissues
To investigate the potential role of miR-15a in human PTC, we compared the expression level of miR-15a in human PTC tissues and normal tissues from healthy people without any abnormal conditions in the thyroid. Results revealed that the level of miR-15a was significantly lower in PTC tissues than that in normal tissues (P<0.05, area under curve =0.7854; Figure 1A and B). This observation indicated the potential function of miR-15a in the pathogenesis of PTC.
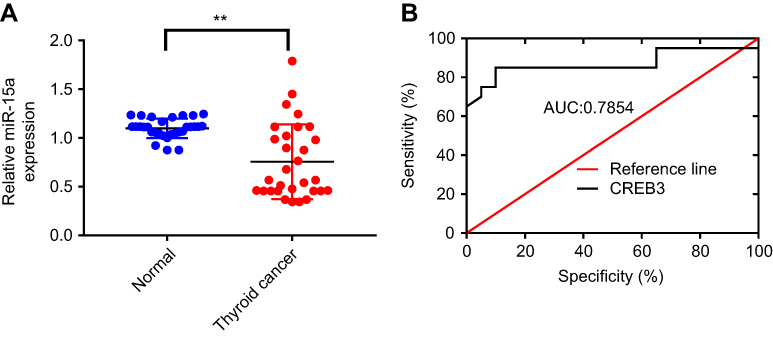 |
Figure 1 Levels of miR-15a in papillary thyroid carcinoma (PTC) and normal tissues. (A) Quantitative PCR to determine the level of miR-15a in PTC and normal tissues. **Indicates P<0.05, as compared to the control group. (B) Area under the curve (AUC) demonstrated the differential expression level of PTC tissue and healthy tissue. |
miR-15a mimics inhibited PTC cell proliferation and invasion via promoting apoptosis
CCK-8 assay was performed to determine the effect of miR-15a mimics on the viability of TPC-1. As indicated in Figure 2A, 10 nM miR-15a mimics significantly increased the expression of miR-15a in TPC-1 cells. In addition, CCK-8 assay revealed that miR-15a mimics time-dependently inhibited the proliferation of TPC-1 cells (Figure 2B), which was further confirmed by EdU staining (Figure 2C and D).
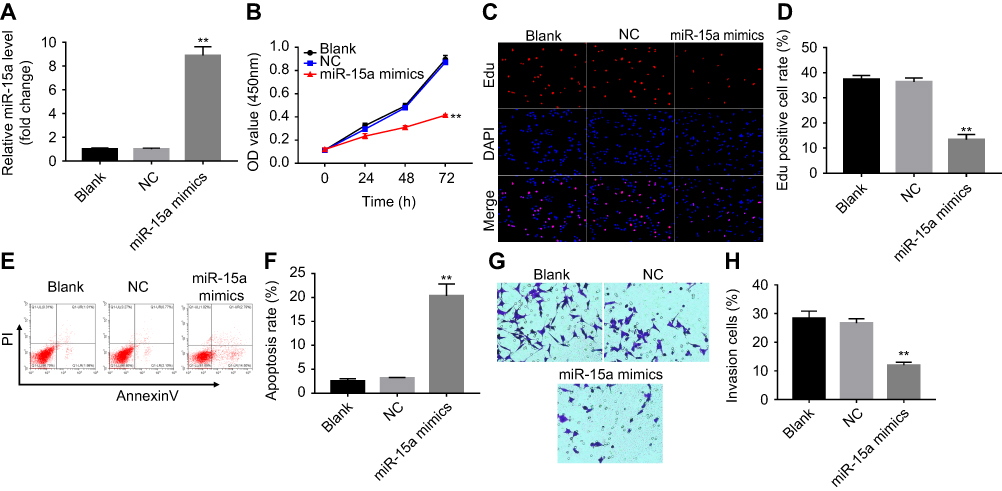 |
Figure 2 miR-15a mimics inhibited proliferation and invasion of TPC-1 cells via promoting apoptosis. TPC-1 cells were transfected with 10 nM miRNA mimics or 10 nM scramble for 24, 48, and 72 hrs. (A) The levels of miR-15a in blank, miR-NC, and miR-15a mimics groups were evaluated using RT-PCR. (B, C) Cell viability was detected with CCK8 assay and Edu staining. (D) Quantification of Edu-positive cell rate in each group. (E, F) Effect of miR-15a mimics on apoptosis was detected with annexin V/PI staining. (G, H) Effect of miR-15a mimics on cell invasion was evaluated using Matrigel invasion assay. Cells with invasion were counted under a light microscope (views were randomly selected, at least 5 views/well). **Indicates P<0.05, compared to NC group. |
To demonstrate the effect of miR-15a mimics on cell apoptosis, flow cytometry was performed. The results showed that the apoptosis rate of TPC-1 was significantly increased to about 6 folds compared to the NC group after the treatment with miR-15a mimics (Figure 2E and F). Next, we evaluated the effect of miR-15a mimics on the invasion capacity of TPC-1 by performing the Matrigel assay. As depicted in Figure 2G and H, miR-15a mimics markedly inhibited invasion of TPC-1 cells compared with NC group.
MiR-15a inhibitor promoted proliferation and invasion of TPC-1
In order to validate the role of miR-15a in TPC-1 cells, miR-15a inhibitor was used. After transfection with miR-15a inhibitor (10 nM) for 48 hrs, the expression of miR-15a in TPC-1 cells was significantly decreased compared with the NC group (Figure 3A). In addition, CCK-8 assay revealed that miR-15a inhibitor markedly increased the proliferation capability of TPC-1 cells (Figure 3B). Based on the result of transwell assay, the invasion ability of TPC-1 in the miR-15a inhibitor group was notably increased compared with the NC group (Figure 3C and D). Collectively, these results demonstrated that downregulation of miR-15a promoted TPC-1 cell proliferation and invasion.
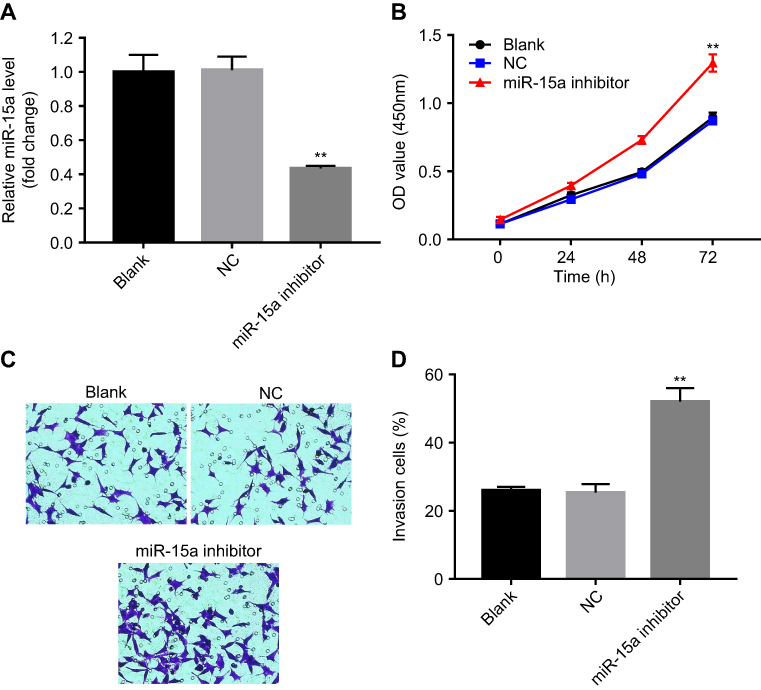 |
Figure 3 miR-15a inhibitor increased TPC-1 cell proliferation and invasion. TPC-1 cells were transfected with 10 nM miRNA inhibitor or 10 nM scrambled 22 nt nucleotides for 24, 48, and 72 hrs. (A) Forty-eight hours after transfection of miR-15a inhibitor, the miR-15a expression level was evaluated. (B) CCK8 assay evaluated the effect of miR-15a on cell viability of TPC-1 cells. (C, D) Effect of miR-15a inhibitor on cell invasion was evaluated using Matrigel invasion assay. **Indicates P<0.05, compared to NC group. |
RET was the direct target of miR-15a
As predicted by miRanda, miRDB, and TargetScan, there was complementarity between miR-15a and RET (Figure 4A), indicating that RET might be a putative target of miR-15a. In order to confirm the correlation of RET and miR-15a in PTC-1 cells, we established constructs which expressed wild-type RET (WT-RET) and mutant RET (MT-RET).23 The promoter activities of WT-RET)and MT-RET constructs were determined by dual-luciferase assay after 24 hrs of transfection. Co-transfection of WT-RET with miR-15a mimics specifically decreased luciferase expression, while such decrease of luciferase expression was not observed in cells co-transfected with MT-RET and miR-15a mimics (Figure 4B). These data indicated that RET was a putative target of miR-15a.
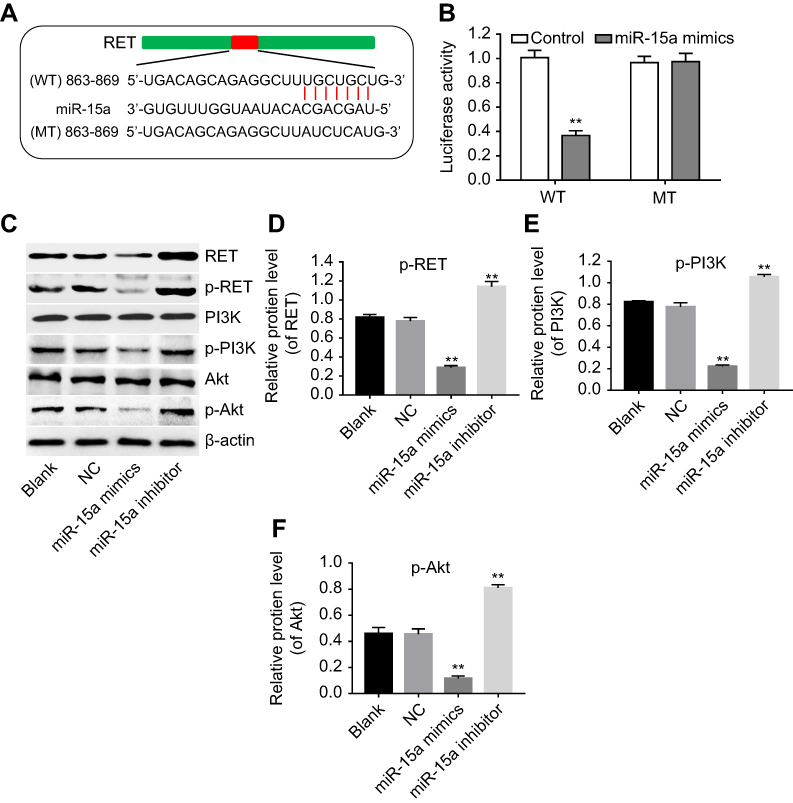 |
Figure 4 RET was the direct target of miR-15a expression levels in TPC-1 cells. (A) The differential DNA sequence of wild-type-RET (WT) and mutant-RET (MT). (B) The luciferase activity was measured by using the dual-luciferase reporter assay in TPC-1 cells. Cells in both WT and MT groups were treated with miR-NC or miR-15a mimics. (C) Western blot demonstrated the effect of miR-15a mimics and inhibitor on the expression level of RET, p-RET, p-PI3K, and p-AKT. (D- F) Quantification of p-RET/total-RET, p-PI3K/total-PI3K, and p-AKT/total-AKT in each group. **Indicates P<0.05, compared to NC group. |
The function of RET in tumorigenesis requires activation of the phosphatidylinositol 3-kinase/AKT signaling pathway.24 To evaluate the role of AKT from RET signal pathway in the tumorigenesis of papillary carcinomas, the protein levels of RET, p-RET, p-PI3K, and p-AKT were assessed. Western blot results indicated that the expressions of RET, p-RET, p-PI3K, and p-AKT were downregulated by miR-15a mimics, but upregulated by miR-15a inhibitor (Figure 4C). The ratios of p-RET/total-RET, p-PI3K/total-PI3K, and p-AKT/total-AKT were quantified and depicted in Figure 4D–F. These results indicated that miR-15a affected the tumorigenesis of TPC-1 cells via regulation of AKT pathway.
miR-15a mimics inhibited tumor growth in nude mice
Next, we further investigated the effect of miR-15a on tumor growth of TPC-1 xenografts in vivo. We observed that miR-15a mimics markedly inhibited tumor growth in nude mice compared to the control group (Figure 5A and B). In addition, the tumor volume of miR-15a mimics group was significantly smaller than that of the control group (Figure 5C). Meanwhile, qPCR results showed the level of miR-15a in tumor tissues was notably upregulated in miR-15a mimics group compared with the control group (Figure 5D). Furthermore, the cell apoptosis in tumor tissues was detected with TUNEL assays. As expected, samples from miR-15a mimic group had more positive-stained cells (apoptotic cells) than those from control groups. These findings suggested that miR-15a mimics induced apoptosis in vivo, which was in accordance with in vitro observations (Figure 5E).
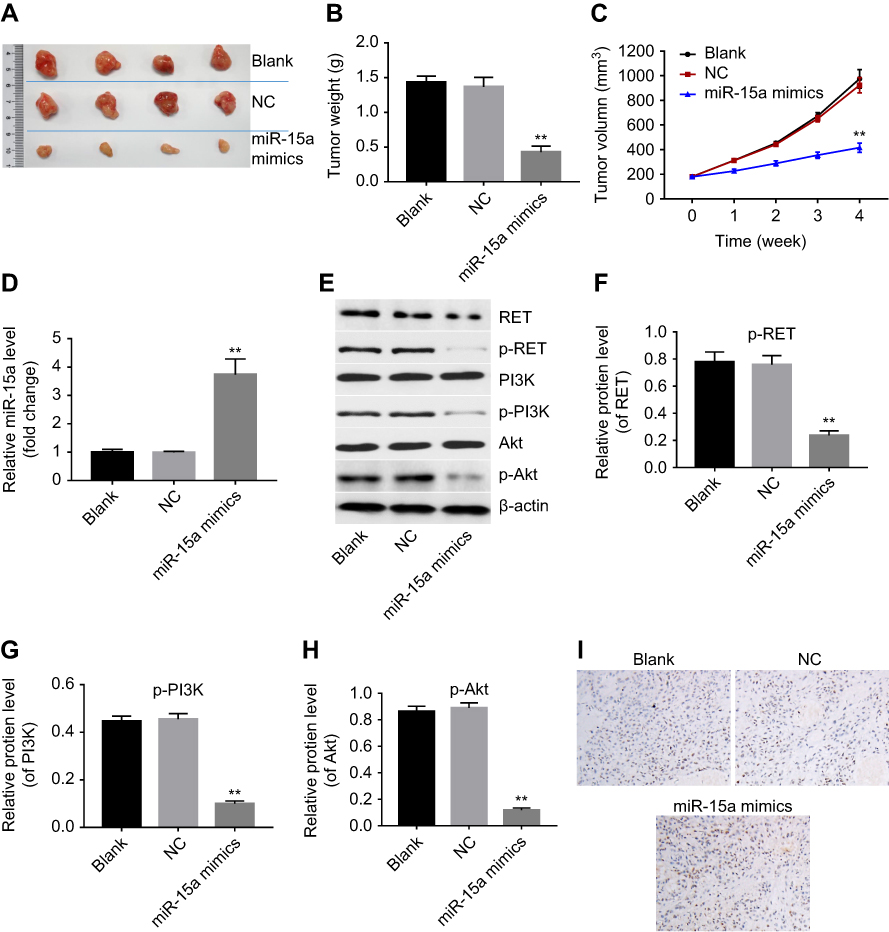 |
Figure 5 miR-15a mimics inhibited papillary thyroid carcinoma (PCT) tumor growth in vivo. Mice were randomly divided into 3 groups: blank, miR-NC, or miR-15a mimics. Mice in each group received intratumor injection of reagents (blank, miR-NC, or miR-15a mimics) twice weekly for 4 weeks. (A, B) Tumors in each group were isolated and weighted after 4 weeks of treatment. (C) Tumor weight volumes in each group were monitored weekly. (D) Expressions of miR-15a in each group were detected with qRT-PCR. (E) TUNEL apoptosis assay assessed the effect of miR-15a mimics on apoptosis of TPC-1 cells in vivo. Sections of xenograft tumor samples from mice of each group were applied to TUNEL-IHC assay. Representative images of TUNEL assay were shown. (F) Western blot was used to detect the expressions of RET and p-AKT in each group. (G-I) Quantification of p-RET/total-RET, p-PI3K/total-PI3K, and p-AKT/total-AKT in each group. **Indicates P<0.05, compared to NC group. |
Moreover, the protein levels of RET, p-RET, p-PI3K, and p-AKT were also decreased in tumors treated with miR-15a mimics, compared with NC group (P<0.05, Figure 5F, G, and I). These data further confirmed that upregulation of miR-15a inhibited PTC tumor growth via inhibiting RET/AKT pathway.
Discussion
In the present study, the function and target gene of miR-15a in PTC cells were investigated. We found that miR-15a was downexpressed in human PTC tissues. According to the results of proliferation, apoptosis, and invasion assay, overexpression of miR-15a significantly inhibited cell proliferation and invasion of TPC-1 and enhanced apoptosis of TPC-1. However, downregulation of miR-15a stimulated proliferation and invasion of TPC-1. We also demonstrated that AKT pathway is involved in the regulation of RET by miR-15a. And the in vivo experiments revealed that upregulation of miR-15a mimics could inhibit tumor growth, and AKT pathway was involved in the regulation of RET by miR-15a.
This study suggested that miR-15a was downexpressed in human PTC tissues, which was echoed with previous reports.22,25 The functions of miR-15a in cell survival, proliferation, and invasion have already been confirmed in other cancer types. Bonci et al revealed that knockdown of miR-15a could promote survival, proliferation, and invasiveness of untransformed prostate cells, whereas reconstitution of miR-15a expression could result in growth arrest, apoptosis, and marked regression of prostate tumor xenografts. These evidence indicated that miR-15a could regulate tumor-suppressor genes in prostate cancer through the control of cell survival, proliferation, and invasion.18 It was also reported that miR-15a inhibited cell proliferation, invasion, and migration in invasive pituitary tumor tissues.26 On the other hand, several miRNAs have been reported to be functional in PTC. For example, upregulation of miR-34a promoted cell proliferation and inhibited apoptosis.27 Overexpression of miR‑101 could inhibit cell proliferation in PTC.28 Although dysregulation of miR-15a was reported in PTC, there is barely a report on the mechanism underlying effect of miR-15a on PTC. In this study, we found upregulation of miR-15a significantly inhibited TPC-1 cell proliferation and invasion and enhanced the apoptosis, indicating that miR-15a could be a potential therapeutic target for the treatment of PTC.
The RET proto-oncogene, encoding the RET receptor tyrosine kinase, plays essential roles in the pathogenesis of PTC.29 Activating mutations of RET are important in cell survival, apoptosis, and proliferation, and function as oncogene through regulating the activation of multiple signal pathways, including the PI3K/AKT pathway.30 AKT, the human homolog of the viral oncogene v-Akt, is related to protein kinases A (PKA) and C (PKC) in humans. The pathway that involves AKT inactivates several proapoptotic factors, including BAD, procaspase-9, and Forkhead (FKHR) transcription factors.31,32 AKT also activates transcription factors which promote ant-apoptotic genes, including cyclic-AMP response element-binding protein, IκB kinase, and so on. Several miRNAs were reported to associate with AKT pathway. miR-34b inhibited cell proliferation, colony formation, and migration/invasion and triggered G0/G1 cell-cycle arrest and apoptosis by directly targeting the AKT and its downstream proliferative genes.33 miRNA-221 and miRNA-222 induced apoptosis via the KIT/AKT signaling pathway in gastrointestinal stromal tumors.34 Based on these evidence, we investigated the protein expression level of RET and p-Akt in TPC-1 cells. As expected, RET and p-Akt were downregulated by overexpression of miR-15a and upregulated by inhibition of miR-15a in TPC-1 cells. These results suggested that the AKT pathway is involved in the PTC regulation by miR-15a.
Collectively, as a specific regulator of AKT pathway, miR-15a served a vital role in PTC. Overexpression of miR-15a inhibited the activation of AKT pathway, which inhibited the cell proliferation and promoted the process of apoptosis. Therefore, miR-15a may have the potential to be used as a biomarker in identifying PTC and therapeutic target for treatment of PTC. Further research on the functions between miR-15a and signaling pathways will provide an essential insight into basic and clinical knowledge of PTC.
Disclosure
The authors declare no competing financial interests in this work.
References
1. Davies L, Welch HG. Increasing incidence of thyroid cancer in the United States, 1973–2002. JAMA. 2006;295(18):2164–2167. doi:10.1001/jama.295.18.2164
2. Dahiya N, Sherman-Baust CA, Wang TL, et al. MicroRNA expression and identification of putative miRNA targets in ovarian cancer. PLoS One. 2008;3(6):e2436. doi:10.1371/journal.pone.0002436
3. Xie Y, Todd NW, Liu Z, et al. Altered miRNA expression in sputum for diagnosis of non-small cell lung cancer. Lung Cancer. 2010;67(2):170–176. doi:10.1016/j.lungcan.2009.04.004
4. Mulrane L, McGee SF, Gallagher WM, O’Connor DP. miRNA dysregulation in breast cancer. Cancer Res. 2013;73(22):6554–6562. doi:10.1158/0008-5472.CAN-13-1841
5. Shi XB, Xue L, Yang J, et al. An androgen-regulated miRNA suppresses Bak1 expression and induces androgen-independent growth of prostate cancer cells. Proc Natl Acad Sci U S A. 2007;104(50):19983–19988. doi:10.1073/pnas.0706641104
6. Nikiforova MN, Tseng GC, Steward D, Diorio D, Nikiforov YE. MicroRNA expression profiling of thyroid tumors: biological significance and diagnostic utility. J Clin Endocrinol Metab. 2008;93(5):1600–1608. doi:10.1210/jc.2007-2696
7. Mian C, Pennelli G, Fassan M, et al. MicroRNA profiles in familial and sporadic medullary thyroid carcinoma: preliminary relationships with RET status and outcome. Thyroid. 2012;22(9):890–896. doi:10.1089/thy.2012.0045
8. Dettmer M, Vogetseder A, Durso MB, et al. MicroRNA expression array identifies novel diagnostic markers for conventional and oncocytic follicular thyroid carcinomas. J Clin Endocrinol Metab. 2013;98(1):E1–E7. doi:10.1210/jc.2012-2694
9. Duan L, Hao X, Liu Z, Zhang Y, Zhang G. MiR-129-5p is down-regulated and involved in the growth, apoptosis and migration of medullary thyroid carcinoma cells through targeting RET. FEBS Lett. 2014;588(9):1644–1651. doi:10.1016/j.febslet.2014.03.002
10. Gulino R, Forte S, Parenti R, Memeo L, Gulisano M. MicroRNA and pediatric tumors: future perspectives. Acta Histochem. 2015;117(4–5):339–354. doi:10.1016/j.acthis.2015.02.007
11. Calabrese G, Dolcimascolo A, Torrisi F, Zappala A, Gulino R, Parenti R. MiR-19a overexpression in FTC-133 cell line induces a more de-differentiated and aggressive phenotype. Int J Mol Sci. 2018;19:12. doi:10.3390/ijms19123944
12. Chou CK, Chen RF, Chou FF, et al. miR-146b is highly expressed in adult papillary thyroid carcinomas with high risk features including extrathyroidal invasion and the BRAF(V600E) mutation. Thyroid. 2010;20(5):489–494. doi:10.1089/thy.2009.0027
13. Zhou YL, Liu C, Dai XX, Zhang XH, Wang OC. Overexpression of miR-221 is associated with aggressive clinicopathologic characteristics and the BRAF mutation in papillary thyroid carcinomas. Med Oncol. 2012;29(5):3360–3366. doi:10.1007/s12032-012-0315-8
14. Wang Z, Zhang H, He L, et al. Association between the expression of four upregulated miRNAs and extrathyroidal invasion in papillary thyroid carcinoma. Onco Targets Ther. 2013;6:281–287. doi:10.2147/OTT.S43014
15. Rosignolo F, Memeo L, Monzani F, et al. MicroRNA-based molecular classification of papillary thyroid carcinoma. Int J Oncol. 2017;50(5):1767–1777. doi:10.3892/ijo.2017.3960
16. Stokowy T, Gawel D, Wojtas B. Differences in miRNA and mRNA profile of papillary thyroid cancer variants. Int J Endocrinol. 2016;2016:1427042. doi:10.1155/2016/1427042
17. Zhang XJ, Ye H, Zeng CW, He B, Zhang H, Chen YQ. Dysregulation of miR-15a and miR-214 in human pancreatic cancer. J Hematol Oncol. 2010;3:46. doi:10.1186/1756-8722-3-50
18. Bonci D, Coppola V, Musumeci M, et al. The miR-15a-miR-16-1 cluster controls prostate cancer by targeting multiple oncogenic activities. Nat Med. 2008;14(11):1271–1277. doi:10.1038/nm.1880
19. Klein U, Lia M, Crespo M, et al. The DLEU2/miR-15a/16-1 cluster controls B cell proliferation and its deletion leads to chronic lymphocytic leukemia. Cancer Cell. 2010;17(1):28–40. doi:10.1016/j.ccr.2009.11.019
20. Bhattacharya R, Nicoloso M, Arvizo R, et al. MiR-15a and MiR-16 control Bmi-1 expression in ovarian cancer. Cancer Res. 2009;69(23):9090–9095. doi:10.1158/0008-5472.CAN-09-2552
21. Bandi N, Zbinden S, Gugger M, et al. miR-15a and miR-16 are implicated in cell cycle regulation in a Rb-dependent manner and are frequently deleted or down-regulated in non-small cell lung cancer. Cancer Res. 2009;69(13):5553–5559. doi:10.1158/0008-5472.CAN-08-4277
22. Zhao Y, Liu X, Zhong L, et al. The combined use of miRNAs and mRNAs as biomarkers for the diagnosis of papillary thyroid carcinoma. Int J Mol Med. 2015;36(4):1097–1103. doi:10.3892/ijmm.2015.2305
23. Diaz-Beya M, Navarro A, Ferrer G, et al. Acute myeloid leukemia with translocation (8;16)(p11;p13) and MYST3-CREBBP rearrangement harbors a distinctive microRNA signature targeting RET proto-oncogene. Leukemia. 2013;27(3):595–603. doi:10.1038/leu.2012.278
24. Segouffin-Cariou C, Billaud M. Transforming ability of MEN2A-RET requires activation of the phosphatidylinositol 3-kinase/AKT signaling pathway. J Biol Chem. 2000;275(5):3568–3576. doi:10.1074/jbc.275.5.3568
25. Huang Y, Liao D, Pan L, et al. Expressions of miRNAs in papillary thyroid carcinoma and their associations with the BRAFV600E mutation. Eur J Endocrinol. 2013;168(5):675–681. doi:10.1530/EJE-12-1029
26. Renjie W, Haiqian L. MiR-132, miR-15a and miR-16 synergistically inhibit pituitary tumor cell proliferation, invasion and migration by targeting Sox5. Cancer Lett. 2015;356(2 Pt B):568–578. doi:10.1016/j.canlet.2014.10.003
27. Ma Y, Qin H, Cui Y. MiR-34a targets GAS1 to promote cell proliferation and inhibit apoptosis in papillary thyroid carcinoma via PI3K/Akt/Bad pathway. Biochem Biophys Res Commun. 2013;441(4):958–963. doi:10.1016/j.bbrc.2013.11.010
28. Lin X, Guan H, Li H, et al. miR‑101 inhibits cell proliferation by targeting Rac1 in papillary thyroid carcinoma. Biomed Rep. 2014;2(1):122–126. doi:10.3892/br.2013.192
29. Giordano TJ, Kuick R, Thomas DG, et al. Molecular classification of papillary thyroid carcinoma: distinct BRAF, RAS, and RET/PTC mutation-specific gene expression profiles discovered by DNA microarray analysis. Oncogene. 2005;24(44):6646–6656. doi:10.1038/sj.onc.1208822
30. Drosten M, Putzer BM. Mechanisms of disease: cancer targeting and the impact of oncogenic RET for medullary thyroid carcinoma therapy. Nat Clin Pract Oncol. 2006;3(10):564–574. doi:10.1038/ncponc0610
31. Chen X, Thakkar H, Tyan F, et al. Constitutively active Akt is an important regulator of TRAIL sensitivity in prostate cancer. Oncogene. 2001;20(42):6073–6083. doi:10.1038/sj.onc.1204736
32. Wang Q, Wang X, Hernandez A, Hellmich MR, Gatalica Z, Evers BM. Regulation of TRAIL expression by the phosphatidylinositol 3-kinase/Akt/GSK-3 pathway in human colon cancer cells. J Biol Chem. 2002;277(39):36602–36610. doi:10.1074/jbc.M206306200
33. Majid S, Dar AA, Saini S, et al. miRNA-34b inhibits prostate cancer through demethylation, active chromatin modifications, and AKT pathways. Clin Cancer Res. 2013;19(1):73–84. doi:10.1158/1078-0432.CCR-12-2952
34. Ihle MA, Trautmann M, Kuenstlinger H, et al. miRNA-221 and miRNA-222 induce apoptosis via the KIT/AKT signalling pathway in gastrointestinal stromal tumours. Mol Oncol. 2015;9(7):1421–1433. doi:10.1016/j.molonc.2015.03.013
 © 2019 The Author(s). This work is published and licensed by Dove Medical Press Limited. The full terms of this license are available at https://www.dovepress.com/terms.php and incorporate the Creative Commons Attribution - Non Commercial (unported, v3.0) License.
By accessing the work you hereby accept the Terms. Non-commercial uses of the work are permitted without any further permission from Dove Medical Press Limited, provided the work is properly attributed. For permission for commercial use of this work, please see paragraphs 4.2 and 5 of our Terms.
© 2019 The Author(s). This work is published and licensed by Dove Medical Press Limited. The full terms of this license are available at https://www.dovepress.com/terms.php and incorporate the Creative Commons Attribution - Non Commercial (unported, v3.0) License.
By accessing the work you hereby accept the Terms. Non-commercial uses of the work are permitted without any further permission from Dove Medical Press Limited, provided the work is properly attributed. For permission for commercial use of this work, please see paragraphs 4.2 and 5 of our Terms.