")
Back to Journals » OncoTargets and Therapy » Volume 12
miR-937 regulates the proliferation and apoptosis via targeting APAF1 in breast cancer
Authors Fang H, Jiang W, Jing Z, Mu X, Xiong Z
Received 28 February 2019
Accepted for publication 31 May 2019
Published 17 July 2019 Volume 2019:12 Pages 5687—5699
DOI https://doi.org/10.2147/OTT.S207091
Checked for plagiarism Yes
Review by Single anonymous peer review
Peer reviewer comments 3
Editor who approved publication: Dr Arseniy Yuzhalin
Huiying Fang, Wei Jiang, Zhouhong Jing, Xiaosong Mu, Zhongxun Xiong
Department of Breast Disease, Chongqing University Cancer Hospital, Chongqing City, 400000, People’s Republic of China
Background: Previous research had shown that an imbalance in cell proliferation and apoptosis is a vital mechanism for tumorigenesis and cancer progression that may directly influence biological behaviors of cancer. microRNAs are associated with the occurrence and development of tumors. This study aimed to explore the influence of miR-937 on breast cancer regulation of APAF1 expression.
Methods: Cancer Genome Altas microarray analysis (fold change > 2, p<0.05) was used to verify differentially expressed microRNAs and RT-qPCR was used to detect miR-937 mRNA level in breast cancer. Cell viability and proliferation were measured using CCK8 and colony formation assays, respectively, after the miR-937 mimics/inhibitors and their negative control were transfected into MCF7 cells. The variations in cell cycle and apoptosis were examined using flow cytometry. DAVID database was used to perform GO enrichment analysis. We use dual luciferase report system to detect the effect of miR-937 on the transcriptional activity of APAF1. APAF1 protein level was determined by Western blot assay.
Results: miR-937 was up-regulated in breast cancer cell lines and high miR-937 expression is associated with a poorer survival rate in cancer patients. miR-937 overexpression promoted the viability, down-regulated the G1 phase ratios and increased the ability of colony formation in breast cancer cells. miR-937 inhibition inhibited the viability and the ability of colony formation, promoted the apoptosis and up-regulated the G1 phase ratios. Our results showed that miR-937 targeted bind to the APAF1-3′UTR. APAF1 overexpression inhibited the viability and the ability of colony formation, promoted the apoptosis and up-regulated the G1 phase ratios. After cells were co-transfection miR-937 mimics and APAF1, cell apoptosis level was increased.
Conclusion: APAF1 up-regulation or APAF1 down-regulation in breast cancer may regulate cell proliferation and apoptosis.
Keywords: miR-937, APAF1, cell proliferation, apoptosis, breast cancer
Introduction
Breast cancers constitute a group of frequently occurring malignant tumors in women. They pose a serious threat to the lives of women worldwide. The data showed that breast cancers accounted for 25% of all cancers.1 The occurrence and progression of breast cancer particularly involve complex pathological processes caused by various biological, physical and chemical factors. Cells with clonal abnormal growth lead to the occurrence and development of tumors. According to a report, the cancer was characterized by genome mutation, persistent proliferative signals, suppressed cell apoptosis, and increased cell metastasis, inducing angiogenesis, immune escape, inflammation responses, and imbalance in cellular energy metabolism.2 Briefly, the development and progression of tumors result from loss of apoptosis in tumor cells, therefore, inducing or restoring cell apoptosis can have an anticancer effect.
miRNAs single-stranded, endogenous 19–22-nucleotide-long noncoding RNAs. They regulate post-transcriptional silencing by binding to the 3′-untranslated region (3′-UTR) of the target mRNAs with partial complementarity and affect the expression and regulation of genes.3,4 Furthermore, miRNAs are highly conserved and regulate ~30% of human genes.5 miRNAs are reported to be closely associated with cell proliferation, apoptosis, invasion, and migration, and miRNAs, including miR-200, let-7 and miR-10b, are abnormally expressed in breast cancer.6 To develop effective strategies to prevent and treat tumors, miRNA expression and the associated regulatory mechanisms that control the occurrence and progression of tumors must be studied further.
Cancer has a molecular map that includes somatic mutations, copy number variations, gene expression profile variations, and epigenetic variations.7 The rapid development of high-speed sequencing technologies and biotechnology has ushered in a new era of cancer genomes research. The Cancer Genome Atlas (TCGA) (http://cancergenome.nih.gov/) consists of genome, proteome, transcriptome, epigenome and clinical data from 32 tumor types that are not limited or restricted by the NHGRI and NCI.8 Subsequently, differential expression analysis performed by the Database for Annotation, Visualization andIntegrated Discovery (DAVID) (https://david.ncifcrf.gov/) identified gene ontology (GO) terms.9 Target genes were predicted using miRDB (http://mirdb.org/) and Targetscan (http://www.targetscan.org/).10,11
Materials and methods
Bioinformatics analysis
The TCGA database provided 5-year survival profiling data sets and miRNA expression data (http://cancergenome.nih.gov/). The gene list was then submitted to DAVID Bioinformatics Resources 6.8 (http://david.abcc.ncifcrf.gov) for GO pathway enrichment analysis. p<0.05 was set as the threshold to screen for significant molecular function, cellular component and biological process terms.
Cell culture and transient of miRNA mimics/inhibitors
The Cell Bank of the Chinese Academy of Sciences provided human breast cancer cell lines (MCF7, MDA-MB-231, HER-2, and MDA-MB-415) and human mammary epithelial cells (MCF10A). Cells were incubated at 37°C in a humidified atmosphere containing 5% CO2. Next, the cells were cultured in DMEM (Gibco, ThermoFisher Scientific, Inc., Grand Island, NY, USA) containing 10% fetal bovine serum (FBS). 2×10⁵ MCF7 cells were seeded in 60-mm plates 24 hrs prior to transfection. Synthetic miRNA mimics/inhibitions and their negative control (from Genepharma Technology Co. LTD) (Shanghai, China) were transfected into cells using HiPerFect reagent (QIAGEN, Germany) in OPTI-MEM media (Gibco; ThermoFisher Scientific, Inc.). The final concentrations of miR-937 mimic/inhibitors and their negative control were 50 nM. The transfected cells were incubated at 37°C with 5% CO2, and the subsequent experiments were performed 48 hrs after transfection. All experiments were repeated 3 times. The sequences for the primers were as follows: miR-937 mimics, sense 5ʹ- AUCCGCGCUCUGACUCUCUGCC-3ʹ and antisense 5ʹ-GGCAGAGAGUCAGAGCGCGGAUUU-3ʹ; mimic controls, sense 5′-UUCUCCGAACGUGUCACGUTT-3′ and antisense 5′-ACGUGACACGUUCGGAGAATT-3′; miR-937 inhibitors, sense 5ʹ- GGCAGAGAGUCAGAGCGCGGAU-3ʹ and inhibitor controls, sense 5ʹ CAGUACUUUUGUGUAGUACAA-3.
Lentiviral transfection
The lentivirus vector carrying miR-937APAF1 (pLV-APAF1), the negative control vector (pLV-NC), and the corresponding viruses (1×10⁸ PFU) were provided by Genepharma. The cells were inoculated into a 6-well plate at a density of 5×10⁵/well. When 50–60% cells were fused, the lentivirus was added for transfection using 8 µg/mL polybrene (Sigma-Aldrich; Merck KGaA, Darmstadt, Germany). After the transfection of APAF1 in MCF7 cells for 48 hrs, the cells underwent the selection with the use of puromycin (2.0 µg/mL; Sigma-Aldrich; Merck KGaA) for 48 hrs. Then, cells were harvseted, and the efficacy of transfection was test by RT-qPCR or Western blot analysis. All experiments were repeated 3 times. APAF1 sequences: sense, 5′- ATGGATGCAAAAGCTCG -3′ and antisense, 5′- TTATTCTAAAGTCTGTAAAATATAT -3′. Negative control (NC) sequences: sense, 5′-UUCUCCGAACGUGUCACGUTT-3′, and antisense, 5′-ACGUGACACGUUCGGAGAATT-3′.
Co-transfection of cells with APAF1-overexpression plasmid vector and miR-937 mimics
The APAF1 overexpression and negative control plasmids were obtained from Genepharma (pLVX-APAF1-Zsgreen and pLVX-IRES-Zsgreen, respectively). Cells (5 × 10⁵ per well in 6-well plates) were cultured to 80% confluence in complete growth medium; then, co-transfection of miR-937 mimics and APAF1 expression vector into MCF7 cells was performed using Lipofectamine 2000 (Thermo, Massachusetts, USA) according to the manufacturer’s instructions.
Cell viability analysis
Cell viability was assayed using a Cell Counting Kit 8(CCK8) (Beyotime Institute of Biotechnology, Jiangsu, China), according to the manufacturer’s instructions. In brief, nearly 1×10³ cells were seeded 96-well plates and were grown overnight in complete DMEM (Hyclone; GE Healthcare) at 37°C. the next day, 10 µL CCK8 solution was added to each well, and the solution was incubated for 2 hrs. The absorbance in every well was evaluated using a microplate reader at 450 nm (Bio-Rad Laboratories, Inc., Hercules, CA, USA). After cell transfection with miR-937 mimic/inhibitors and their negative control or APAF1 overexpression and negative control plasmids, OD values were detected using CCK8 kit at 12, 24, 48, and 72 hrs. ALl experiments were performed 3 times. The viability was calculated using the OD ratio of a transfection group relative to the control.
Cell cycle and apoptosis and analysis
MCF7 cells were seeded in 6-well plates and then transfected with miR-937 mimics/inhibitors/NC or APAF1/NC for 24–48 hrs. For cell apoptosis detection, 5 µL Annexin V-phycoerythrin and 5 µL 7-aminoactinomycin D (Beyotime Institute of Biotechnology) were added to the cells, followed by incubation for 20 mins at room temperature. Cell apoptosis was evaluated by flow cytometer (BD Biosciences; Becton, Dickinson and Company) and apoptosis rates were analyzed with FlowJo software (FlowJo LLC, Ashland, OR, USA).
To synchronize cell cultures, cells were cultured in medium supplemented with 10% FBS overnight, rinsed with PBS, and then transferred to serum-free medium for 24 hrs. To test the cell cycle distribution, transfected cells were digested using trypsin, centrifuged at 425× g (cell density, 1×10⁶ cells/mL), washed twice with PBS and fixed in −20°C ethanol for 2 hrs. For cell cycle distribution detection, 1 µL DAPI was added per 100 µL cell suspension, and the cells were incubated for 40 mins in the dark. All samples were evaluated by flow cytometry (BD Biosciences; Becton, Dickinson and Company)
Caspase activity assays
Caspase-3/9 activity was assayed using the Caspase-3/9 activity assay kit (Beyotime, Beijing, China) according to the manufacturer's instructions. After transfection, the cells were washed with cold PBS and centrifuged at 800× g. The cell pellet was then lysed by the addition of 50 μL of chilled cell lysis buffer and incubation on ice for 10 mins. The lysed mixture was clarified by centrifugation at 10,000× g for 1 mins and the supernatant was transferred to a new microcentrifuge tube. The protein concentration in the supernatant of each sample was measured using the Bradford assay and then adjusted to 100 μg of protein per 50 μL of cell lysis buffer for subsequent application to each well of a 96-well plate. Next, 50 μL of 2× reaction buffer containing dithiothreitol at a final concentration of 10 mM was added into each sample well. After mixing, the respective substrate of each caspase was added to each well and the plate was incubated at 37°C for 1–2 hrs. Finally, the absorbance of each reaction at 400–405 nm was measured on a microplate reader. Each experiment was performed in triplicate.
Colony formation assay
After MCF-7 cells were transfected with miR-937 mimic/inhibitors and their negative control or APAF1 overexpression and negative control plasmids for 48 hrs, nearly 1×10³ cells were plated in 6-well plates and incubated in a serum-free medium. Fourteen days later, cells were washed thrice PBS and fixed in 4% paraformaldehyde for 10 mins at 37°C. Cells were stained with 0.1% crystal violet (Sigma-Aldrich Co.).
The number of colonies were counted using ImageJ software (National Institutes of Health, Bethesda, MD, USA). All experiments were performed in triplicates.
Luciferase reporter assay
In the luciferase reporter assay, MCF7 cells were transfected with using 10 ng Renilla luciferase vector with Lipofectamine® 2000 and 200 ng of APAF1-3′-UTR or APAF1-mut and 20 mM miR-937 mimics/inhibitors/control (Invitrogen; Thermo Fisher Scientific, Inc.). The cells were collected 48 hrs after transfection and were analyzed using the Dual-Luciferase Reporter Assay System (Promega Corporation, Madison, WI, USA). The luciferase activity was detected using the GloMax fluorescence reader (Promega Corporation), and the authors detected luciferase activity. The pRL-CMV Renilla luciferase reporter was used for contrast correction in transfection efficiency. Each experiment was performed in triplicate.
Protein extraction and western blotting assay
Total protein was obtained from cells using a protein extraction kit (Solarbio, Beijing, China). The protein sample concentrations were measured using a BCA kit (Solarbio) according to the manufacturer’s instructions. A total of 50 μL of cell lysate was loaded and run on 8% SDS-PAGE gel and then transferred onto a polyvinylidene difluoride membrane. After blocking with 5% nonfat dry milk, the membrane was incubated using the indicated antibodies at 4°C overnight. After washing with Tris-buffered saline-Tween 20 (TBST) 3 times, the membrane was incubated with horseradish peroxidase–-conjugated secondary antibodies at 37°C for 1 hr and washed with TBST 3 times. Finally, the proteins were visualized using an ECL Western blotting detection kit (Amersham Biosciences, Little Chalfont, UK) according to the manufacturer’s instructions. The authors used the following antibodies and dilutions: APAF1 (1:1000, ab2001; Abcam, UK); β-actin (1:3,000; ab124964; Abcam, Cambridge, UK). Each experiment was performed in triplicate.
RNA extraction and RT-qPCR
Total RNA was extracted from cells using TRIzol reagent (Thermo Fisher Scientific) according to the manufacturer’s protocol. Next, 2 μg of extracted total RNA was used to synthesize cDNA using a one-step RT-PCR kit (TaKaRa, Tokyo, Japan). Then, SYBR Green Mix (Roche Diagnostics, Mannheim, Germany) was used to perform real-time PCR using a 7300 real-time PCR system (ABI). β-actin and U6 were used as internal controls. The relative gene expression was calculated using the 2–ΔΔCq method. The primers used were as follows: APAF1, forward: 5′- AACTTGTAGGCCCTGCTCAT -3′ and reverse: 5′- AAGTTTCCGGCTCACAGAGA -3′ (product: 177 bp); β-actin, forward: 5′- AGGAGCATCCTGTCCTCCTA -3′ and reverse: 5′- GACACCATCACCAGAGTCCA′ (product: 182 bp); miR-937, forward: 5′-CGGTGAGTAGGTGGGTGGG-3′ and reverse: 5′- GTGCAGGGTCCGAGGT-3′;12 U6, forward: 5ʹ- CGCTTCGGCAGCACATATACTA -3′ and reverse: 5ʹ- CGCTTCACGAATTTGCGTGTCA -3ʹ.13 All experiments were repeated three times.
Statistical analysis
For statistical analyses, SPSS software v13.0 (SPSS, Inc., Chicago, IL, USA) was used. The data are reported as the mean ± SD. For comparison of protein or mRNA expression, a paired sample t-test was employed. Spearman’s correlation analysis was used to analyze the correlation between miR-937 and APAF1. ap<0.05 was considered statistically significant.
Results
Bioinformatics analysis of miR-937 expression in breast cancer and miR-937 highly expressed in breast cancer cell lines
Firstly, microRNA expression was analyzed in 1096 breast cancer tissues and 112 normal breast tissues based on the breast cancer gene expression profiles in the TCGA database. A total of 86 genes were identified as differentially expressed genes (DEGs) (Figure 1A and B, p<0.05, logFC>2), including 67 up-regulated and 19 downregulated genes. Survival analysis revealed that miR-301b, miR-204, miR-3677, miR-105, miR-133a-2, miR-1258, miR-937, and miR-449c were strongly associated with breast cancer survival rate (p<0.05). The survival rate of high miR-937 expression was lower than that of low miR-937 expression in breast cancer patients (Figure 1C, p<0.05). Thus, this indicates that miR-937 may be involved in the related biological functions. To confirm the above idea, the expression level of miR-937 was detected by RT-qPCR assay. miR-937 was significantly highly expressed in breast cancer cell lines (Figure 1D, p<0.05). After MCF-7 cells underwent the transfection using miR-937 mimics/inhibitors/control for 48 hrs, RT-qPCR assay was performed to identify the transfection efficiency (Figure 1E and F).
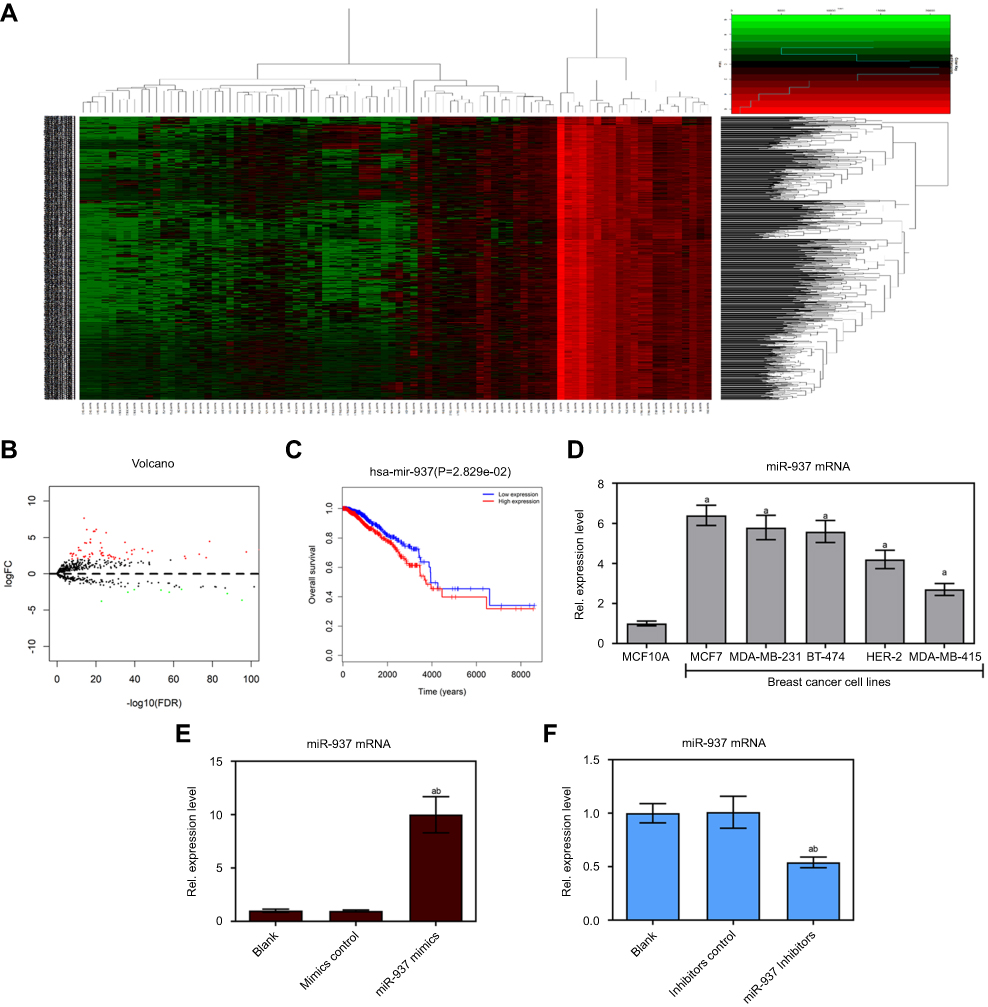 |
Figure 1 miR-937 was associated with survival rate and regulated cell viability in breast cancer cells. (A) Heatmap of 86 genes differentially expressed in breast cancer from TCGA database; (B) volcano plot of 67 genes was significantly up-regulated and Volcano plot of 67 genes was significantly down-regulated; (C) miR-937 was significantly associated with survival rate in patients with breast cancer; (D) miR-937 highly expressed in breast cancer cell lines by RT-PCR analysis (E and F) the mRNA expression of miR-937 in MCF7 cells transfection with mimics/inhibitors/negative control was detected by RT-PCR analysis. β-actin was used as a load control. Data are presented as the mean ± standard deviation. ap<0.05 versus Blank group, bp<0.05 versus mimics/inhibitors group. |
The role of miR-937 mimics in the proliferation and apoptosis of MCF7 cells
According to results from CCK8 assay, up-regulation of miR-937 could increase cell viability (Figure 2A). The caspase-3/9 activities measured using biochemical analysis were consistent with the results of the flow cytometric analysis (Figure 2B and C). Flow cytometric analysis indicated that overexpression of miR-937 could significantly down-regulate the G1 phase ratios and increase G2 phase ratios (Figure 2D and E, p<0.05). However, cell apoptosis in MCF7 cells transfection with miR-937 mimics did not differ between these three groups (Figure 2F and G, p<0.05). Further studies showed that MCF7 cells with high miR-937 had stronger continuous colony forming ability (Figure 2H and I, p<0.05).
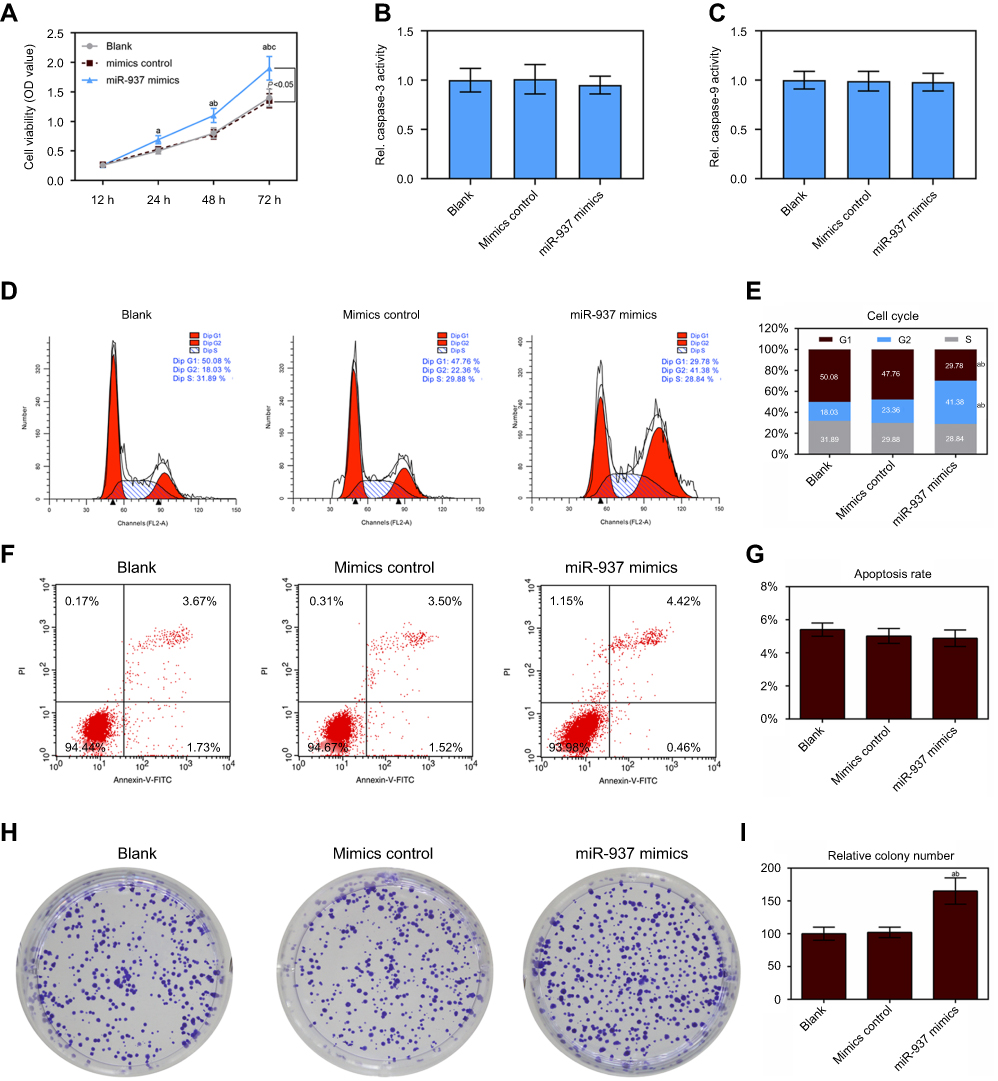 |
Figure 2 Effect of up-regulated miR-937 on apoptosis and proliferation. (A) The cell viability was detected by CCK8 assay in MCF7 cells transfection with mimics and their negative control; (B and C) the caspase-3/9 activities measured using biochemical analysis in MCF7 cells transfection with mimics/negative control; (D and E) cell cycle was estimated by flow cytometry assay in MCF7 cells transfection with mimics and negative control; (F and G) cell apoptosis was detected by flow cytometry assay in MCF7 cells transfection with mimics/negative control; (H and I) colony formation was used to detect the ability of cell proliferation in MCF7 cells transfection with mimics/negative control. Data are presented as the mean ± standard deviation. ap<0.05 versus blank group, bp<0.05 versus mimics group. |
The role of miR-937 inhibitors in the proliferation and apoptosis of MCF7 cells
According to results from CCK8 assay, down-regulation of miR-937 decreased cell viability (Figure 2A). Caspase-3/9 activities measured using biochemical analysis were consistent with the results of the flow cytometric analysis (Figure 2B and C). Flow cytometric analysis indicated that low expression of miR-937 could arrest MCF7 cells at the G1/S phase (Figure 3D and E). The apoptotic cells were detected by flow cytometry to detect labeled Annexin V-FITC/PI. miR-937 inhibitors could significantly promote cell apoptosis (Figure 3F and G, p<0.05). Cell proliferation ability was measured by colony forming assay. The results showed that colony forming efficiency significantly decreased (Figure 3H and I, p<0.05).
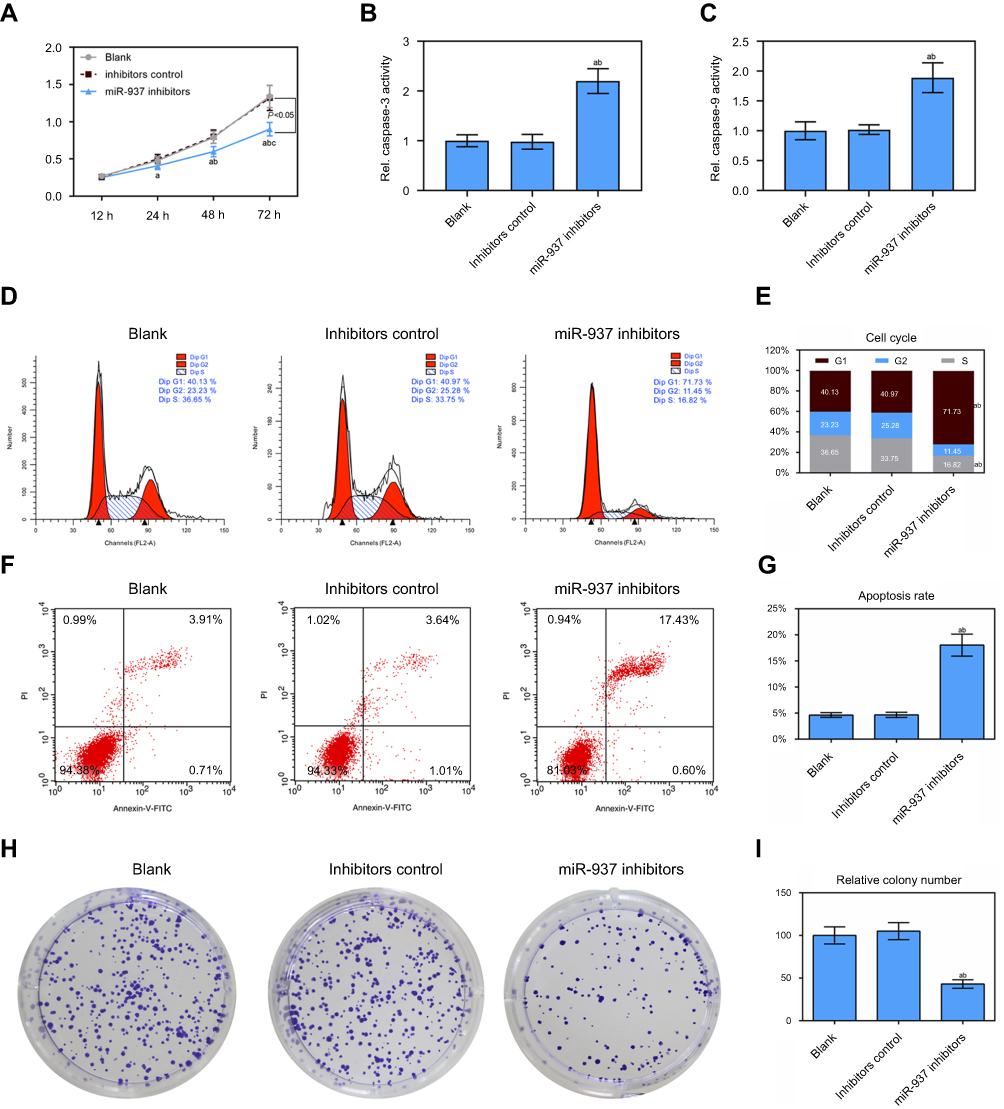 |
Figure 3 Effect of down-regulated miR-937 on apoptosis and proliferation. (A) The cell viability was detected by CCK8 assay in MCF7 cells transfection with inhibitors and their negative control; (B and C) the caspase-3/9 activities measured using biochemical analysis in MCF7 cells transfection with inhibitors/negative control; (D and E) cell cycle was estimated by flow cytometry assay in MCF7 cells transfection with inhibitors/negative control; (F and G) cell apoptosis was detected by flow cytometry assay in MCF7 cells transfection with inhibitors/negative control; (H and I) colony formation was used to detect the ability of cell proliferation in MCF7 cells transfection with inhibitors/negative control. Data are presented as the mean ± standard deviation. ap<0.05 versus blank group, bp<0.05 versus inhibitors group. |
APAF1 is a miR-937 target gene of and is negatively regulated by miR-937
miR-937 was identified using miRNAs that overlapped 200 target genes, including APAF1, across different databases (miRDB, http://mirdb.org/and Targetscan, http://www.targetscan.org/) (Figure 4A). miR-937 functions were predicted using GO analysis, while the authors found that APAF1 was mainly enriched in positive regulation of apoptotic process and signaling pathway terms (Figure 4B and C). APAF1’s mRNA and protein expression levels were detected using RT-qPCR and Western blotting. APAF1 was lowly expressed in breast cancer cell lines (Figure 4D–F). Luciferase assay was performed to validate the target sites in the APAF1 3ʹUTR (Figure 4G). Luciferase reporter assay showed that the relative luciferase activity of APAF1 significantly decreased after miR-937 overexpression in MCF7 cells, but it increased after miR-937 suppression. However, no significant effect was found after mutationg APAF1 (Figure 4H and I). In addition, the mRNA and protein expression levels of APAF1 were significantly suppressed after up-regulating of miR-937 and increased after down-regulating miR-937 in MCF7 cells (Figure 5A–D).
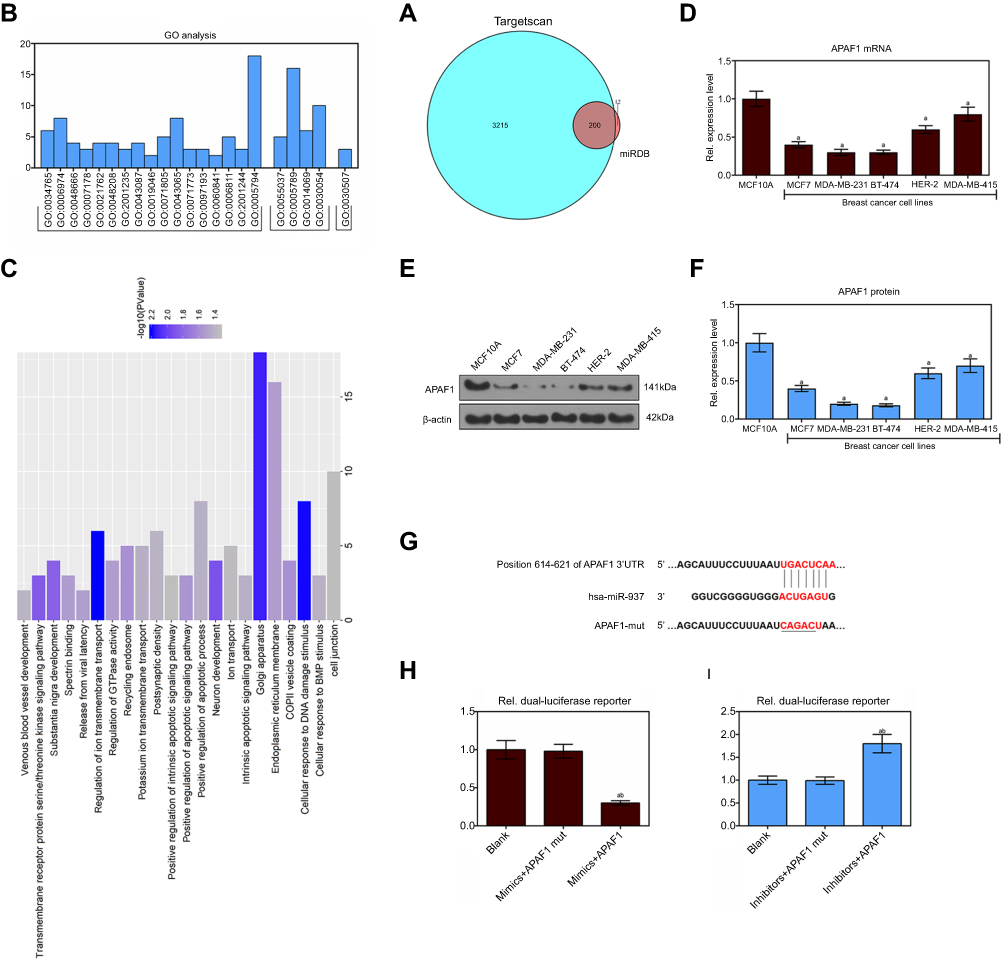 |
Figure 4 The target genes of miR-937 were predicted by miRDB and TargetScan databases and functional annotation. (A) Venn of 200 overlapping 3415 target genes and 212 target genes in the two databases (miRDB and TargetScan); (B and C) GO annotations analysis revealed that these target transcripts were implicated in a broad range of biological processes, cell component and molecular function; (D–F) APAF1 lowly expressed in breast cancer cell lines by RT-PCR and Western blot assays; (G–I) dual lucfierase report system to detect the effect of miR-937 on APAF1. β-actin was used as a load control. Data are presented as the mean ± standard deviation. ap<0.05 versus MCF10A cells group. |
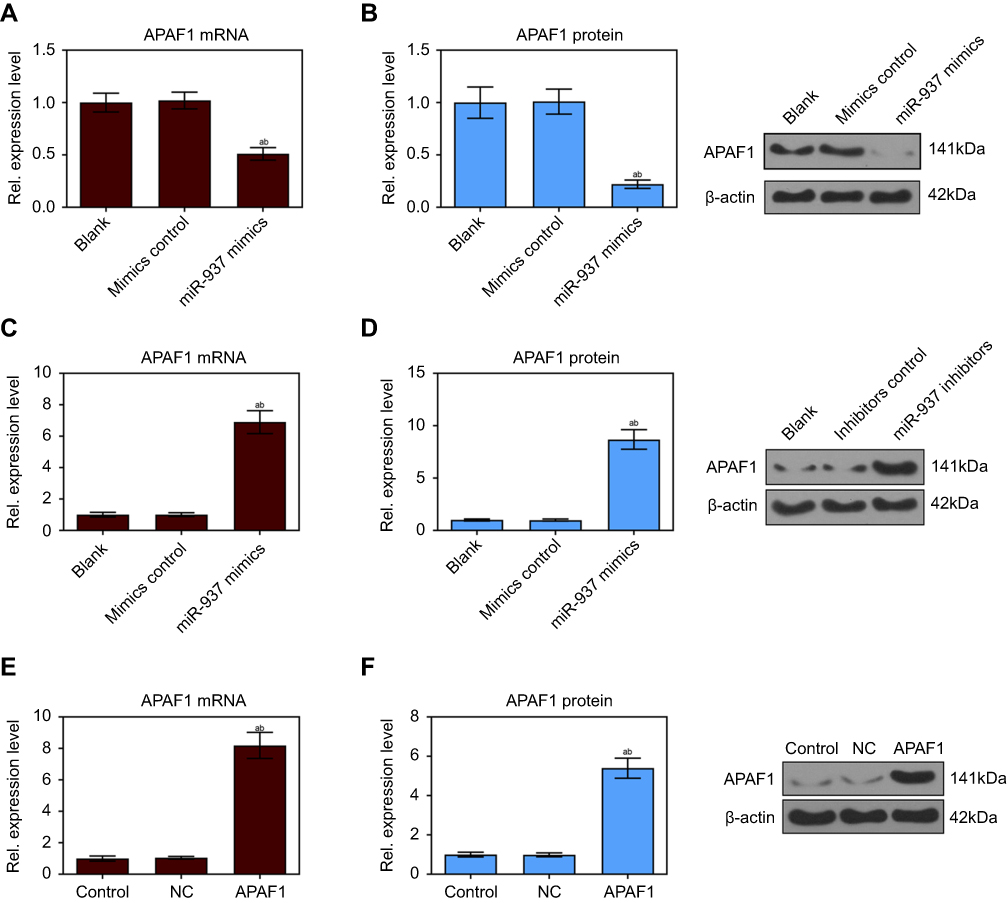 |
Figure 5 miR-937 significantly regulated the expression level of APAF1 gene. (A and B) The mRNA and protein expression level of APAF1 gene were detected by RT-PCR and Western blot assays after MCF7 cells transfection with miR-937 mimics/negative control; (C and D) the mRNA and protein expression level of APAF1 gene were detected by RT-PCR and Western blot assays after MCF7 cells transfection with miR-937 inhibitors/negative control; (E and F) RT-PCR and Western blot assays were used to dectect the transfection efficiency. β-actin was used as a load control. Data are presented as the mean ± standard deviation. ap<0.05 versus blank group/or control group, bp<0.05 versus mimics/inhibitors group/or NC group. |
Up-regulation of APAF1 affected cell cycle, proliferation, and apoptosis
First, cell transfection efficiency was detected using RT-qPCR and Western blotting after MCF7 cells transfection with APAF1 (Figure 5E and F). CCK8 assay showed that the cell viability significantly decreased after APAF1 overexpression in MCF7 cells (Figure 6A). Caspase-3/9 activities measured using biochemical analysis were consistent with the results of the flow cytometric analysis (Figure 6B and C). Flow cytometric analysis indicated that up-regulation of APAF1 could arrest MCF7 cells at the G1/S phase and promote cell apoptosis (Figure 6D–G). The cloning efficiency of MCF7 cells declined sharply in the APAF1 group (Figure 6H and I).
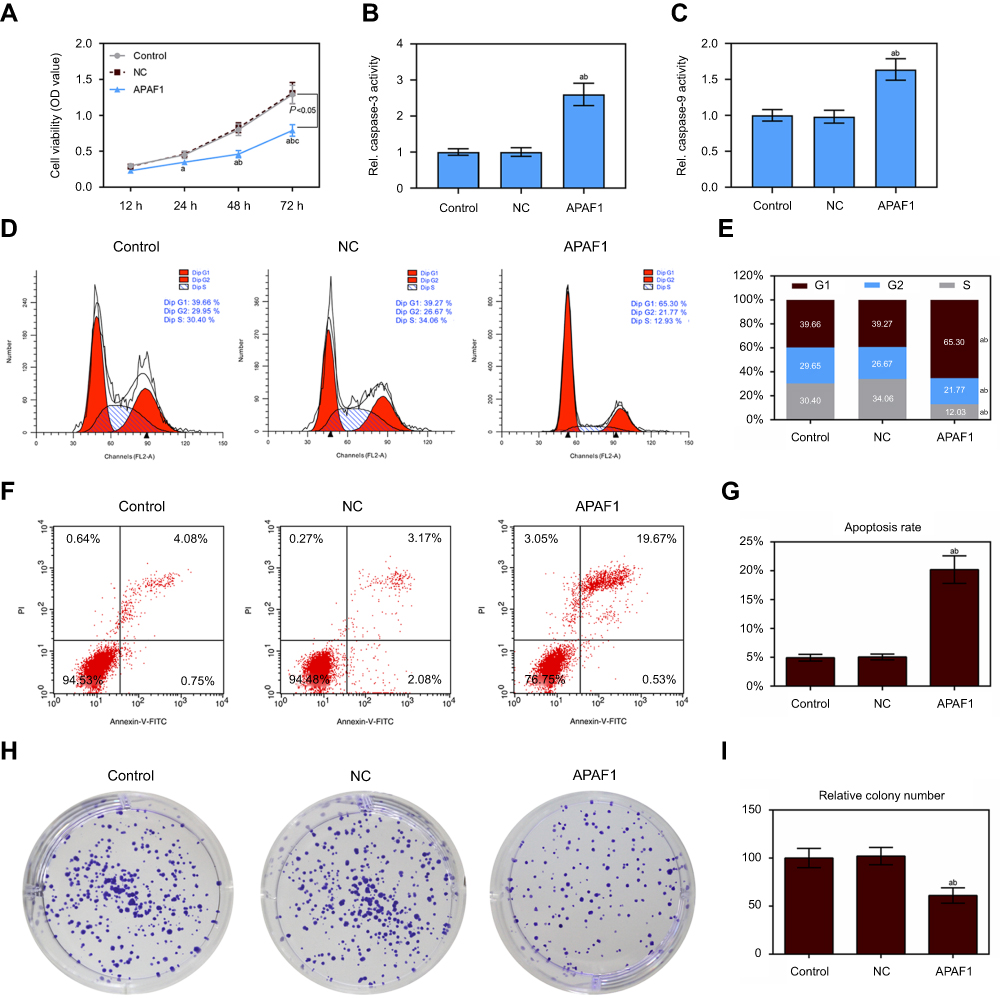 |
Figure 6 Up-regulation of APAF1 regulated cell proliferation and apoptosis in MCF7 cells. (A) The cell viability was detected by CCK8 assay in MCF7 cells transfection with APAF1 and negative control; (B and C) the caspase-3/9 activities measured using biochemical analysis in MCF7 cells transfection with APAF1/negative control; (D and E) cell cycle was estimated by flow cytometry assay in MCF7 cells transfection with APAF1/negative control; (F and G) cell apoptosis was detected by flow cytometry assay in MCF7 cells transfection with APAF1/negative control; (H and I) colony formation was used to detect the ability of cell proliferation in MCF7 cells transfection with APAF1/negative control. Data are presented as the mean ± standard deviation. ap<0.05 versus control group, bp<0.05 versus NC group. |
miR-937 regulated cell proliferation and apoptosis by targeting APAF1 in MCF7 cells
Cell viability was promoted by miR-937 overexpression in MCF7 cells, which was also decreased after MCF7 cells co-transfection with miR-937 mimics and APAF1 based on CCK8 analysis (Figure 7A). Further, the cell apoptosis rate and caspase-3/9 activity of control, control + NC, and miR-937 mimics+NC groups showed no obvious difference. The cell apoptosis rate and caspase-3/9 activity increased after MCF7 cells were co-transfected with miR-937 mimics and APAF1 based on flow cytometry results (Figure 7B and E).
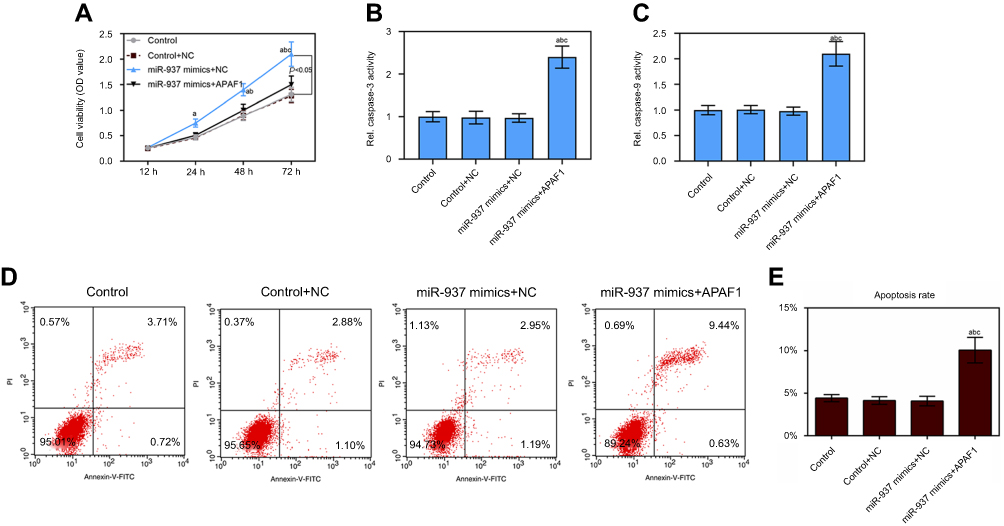 |
Figure 7 miR-937 regulated cell proliferation and apoptosis by targeting APAF1 gene. (A) The cell viability was detected by CCK8 assay in MCF7 cells co-transfection with miR-937 mimics and APAF1; (B and C) the caspase-3/9 activities measured using biochemical analysis in MCF7 cells co-transfection with miR-937 mimics and APAF1; (D and E) cell apoptosis was detected by flow cytometry assay in MCF7 cells transfection with inhibitors/negative control. Data are presented as the mean ± standard deviation. ap<0.05 versus control group, bp<0.05 versus control+NC group, cp<0.05 versus miR-937 mimics + NC group. |
Discussion
It reported that microRNA feedback loops induced apoptosis in breast cancer and colorectal cancer.14,15 A study showed that 13 miRNAs were expressed in breast cancer tissues and serum, but they showed variations.16 Thus, miRNAs may be released into the blood via breast cancer cells and be involved in different molecular mechanisms in tissues and serum. There were 1096 patients with breast cancer and 112 controls in the TCGA cohort (Figure 1A and B). The average miRNAs expression level in the TCGA cohort was analyzed. From the expression data in 86 DEGs, 8 miRNAs are closely related to the breast cancer survival rate (Figure 1C). miR-301b, miR-204, miR-3677, miR-105, miR-133a-2, and miR-1258 were reported in the previous literature. Therefore, miR-937 was studied further using RT-qPCR. The results here showed that miR-937 was highly expressed in breast cancer cell lines (Figure 1D), and the results agreed with the bioinformatic analysis. Research found that miR-937 played an important role in cell proliferation in gastric cancer17 and lung cancer.12 According to the study results, the authors speculated that miR-937 may be involved in breast cancer cell proliferation. Our results reveal that down-regulation of miR-937 suppressed cell proliferation increased caspase-3/9 activity to induced cell apoptosis, and arrested the cells at the G1/S phase (Figures 1–3). The balance between proliferation and apoptosis was broken in the development of cancer, the ability of proliferation much higher than the ability of apoptosis in the malignant tumor cell.18,19 The current study found that the role of miR-937 in proliferation was higher than that of apoptosis. This is consistent with the previous results.12,17 Accordingly, these results demonstrate a correlation between cellular biological function and miR-937. Next, the miR-937 target genes were predicted using the miRDB and TargetScan databases, and 200 genes were identified (Figure 4A). To identify the enrichment of target genes, 3 GO terms, namely molecular function, cellular component, and biological process, were employed (Figure 4B and C). In addition, the authors found that APAF1 was mainly enriched in the cell apoptosis function. But apoptin-induced apoptosis is caspase-dependent and also engages in the Apaf-1apoptosome-mediated mitochondrial death pathway.20 Therefore, further study is needed to explore whether miR-937 affects cell proliferation and apoptosis by altering APAF1 expression.
APAF1 is a critical component of the apoptosome that could be activated by various cellular stimuli, DNA damage, and oncogene activation.13 APAF1 inactivation suggests that it may serve as a tumor suppressor.13 Previous studies verified that the mitochondrial death gene APAF1 is highly expressed in breast cancer cells after high-dose 5-FU treatment21 and gastric cancer cell after oridonin treatment.22 APAF1 is also closely correlated with cell apoptosis in cutaneous squamous cell carcinoma,13 prostate cancer,23 lung cancer,24 and colorectal cancer.25 According to our results, APAF1 is lowly expressed in breast cancer cell lines. A dual-luciferase reporter assay revealed that the relative luciferase activity decreased significantly after miR-937 mimics treatment in the WT-3′-UTR-APAF1 system, but it was not significantly changed by miR-937 mimics in the MUT-3′-UTR-APAF1 system (Figure 4). The overexpression of AFAP1 significantly promoted cell apoptosis and suppressed cell proliferation (Figures 5–6). To further explore the correlation between APAF1 and miR-937, cell viability and apoptosis were assessed using the CCK8 and flow cytometry assays, and caspase-3/9 activity detection after MCF7 cells were co-transfected with miR-937 mimics and AFAP1. The results showed that cell proliferation was suppressed and cell apoptosis was promoted by increasing caspase-3/9 activity after MCF7 cells were co-transfected with miR-937 mimics and AFAP1 (Figure 7).
In conclusion, the frequent up-regulation of AFAP1 and/or down-regulation of miR-937 in breast cancer may shift the balance of cell proliferation and apoptosis.
Abbreviation list
APAF1, apoptotic peptidase activating factor 1; TCGA, Cancer Genome Atlas; GO, gene ontology; CCK8, Cell Counting Kit-8; UTR, untranslated region; DAVID, Database for Annotation, Visualization and Integrated Discovery; NHGRI, National Human Genome Research Institute; NCI, National Cancer Institute NCI.
Availability of data and materials
The datasets used and/or analyzed during the present study are available from the corresponding author on reasonable request.
Author contributions
All authors contributed to data analysis, drafting and revising the article, gave final approval of the version to be published, and agree to be accountable for all aspects of the work.
Disclosure
The authors report no conflicts of interest in this work.
References
1. Kohler BA, Sherman RL, Howlader N, et al. Annual report to the nation on the status of cancer, 1975–2011, featuring incidence of breast cancer subtypes by race/ ethnicity,poverty, and state. J Natl Cancer Inst. 2015;107(6):djv048. doi:10.1093/jnci/djv048
2. Loumaye A, Thissen JP. Biomarkers of cancer cachexia. Clin Biochem. 2017;50(18):1281–1288. doi:10.1016/j.clinbiochem.2017.07.011
3. Cheng D, Li J, Zhang L, Hu L. miR-142-5p suppresses proliferation and promotes apoptosis of human osteosarcoma cell line, HOS, by targeting PLA2G16 through the ERK1/2 signaling pathway. Oncol Lett. 2019;17(1):1363–1371. doi:10.3892/ol.2018.9712
4. Lin R, He L, He J, et al. Comprehensive analysis of microRNA-Seq and target mRNAs of rice sheath blight pathogen provides new insights into pathogenic regulatory mechanisms. DNA Res. 2016. doi:10.1093/dnares/dsw024
5. Lewis BP, Burge CB, Bartel DP. Conserved seed pairing, often flanked by adenosines, indicates that thousands of human genes are microRNA targets. Cell. 2005;120(1):15–20. doi:10.1016/j.cell.2004.12.035
6. O’Day E, Lal A. MicroRNAs and their target gene networks in breast cancer. Breast Cancer Res. 2010;12(2):201. doi:10.1186/bcr2722
7. Hanahan D, Weinberg RA. Hallmarks of cancer: the next generation. Cell. 2011;144(5):646–674. doi:10.1016/j.cell.2011.02.013
8. Wen DY, Huang JC, Wang JY, et al. Potential clinical value and putative biological function of miR-122-5p in hepatocellular carcinoma: a comprehensive study using microarray and RNA sequencing data. Oncol Lett. 2018;16(6):6918–6929. doi:10.3892/ol.2018.9523
9. Yu F, Duan C, Zhang X, et al. RNA-seq analysis reveals different gene ontologies and pathways in rheumatoid arthritis and Kashin-Beck disease. Int J Rheum Dis. 2018;21(9):1686–1694. doi:10.1111/1756-185X.13358
10. Lin P, Wen DY, Li Q, et al. Genome-wide analysis of prognostic lncRNAs, miRNAs, and mRNAs forming a competing endogenous RNA network in hepatocellular carcinoma. Cell Physiol Biochem. 2018;48(5):1953–1967. doi:10.1159/000492519
11. Morii I, Iwabuchi Y, Mori S, et al. Inhibiting the MCM8-9 complex selectively sensitizes cancer cells to cisplatin and olaparib. Cancer Sci. 2019. doi:10.1111/cas.13941
12. Zhang L, Zeng D, Chen Y, et al. miR-937 contributes to the lung cancer cell proliferation by targeting INPP4B. Life Sci. 2016;155:110–115.
13. Tian J, Shen R, Yan Y, et al. miR-186 promotes tumor growth in cutaneous squamous cell carcinoma by inhibiting apoptotic protease activating factor-1. Exp Ther Med. 2018;16(5):4010–4018. doi:10.3892/etm.2018.6679
14. Chen J, Zhao X, Li X, et al. Calycosin induces apoptosis by the regulation of ERbeta/miR-17 signaling pathway in human colorectal cancer cells. Food Funct. 2015;6(9):3091–3097. doi:10.1039/C5FO00374A
15. Tian J, Wang Y, Zhang X, et al. Calycosin inhibits the in vitro and in vivo growth of breast cancer cells through WDR7-7-GPR30 Signaling. J Exp Clin Cancer Res. 2017;36(1):153. doi:10.1186/s13046-017-0625-y
16. Zheng T, Zhang X, Wang Y, et al. Predicting associations between microRNAs and target genes in breast cancer by bioinformatics analyses. Oncol Lett. 2016;12(2):1067–1073. doi:10.3892/ol.2016.4731
17. Yu L, Chen J, Liu Y, Zhang Z, Duan S. MicroRNA-937 inhibits cell proliferation and metastasis in gastric cancer cells by downregulating FOXL2. Cancer Biomark. 2017;21(1):105–116. doi:10.3233/CBM-170310
18. Chen L, Yang H, Yi Z, et al. LncRNA GAS5 regulates redox balance and dysregulates the cell cycle and apoptosis in malignant melanoma cells. J Cancer Res Clin Oncol. 2019;145(3):637–652. doi:10.1007/s00432-018-2820-4
19. Escrich R, Costa I, Moreno M, et al. A high-corn-oil diet strongly stimulates mammary carcinogenesis, while a high-extra-virgin-olive-oil diet has a weak effect, through changes in metabolism, immune system function and proliferation/apoptosis pathways. J Nutr Biochem. 2019;64:218–227.
20. Burek M, Maddika S, Burek CJ, et al. Apoptin-induced cell death is modulated by Bcl-2 family members and is Apaf-1 dependent. Oncogene. 2006;25(15):2213–2222. doi:10.1038/sj.onc.1209258
21. Hernandez-Vargas H, Ballestar E, Carmona-Saez P, et al. Transcriptional profiling of MCF7 breast cancer cells in response to 5-Fluorouracil: relationship with cell cycle changes and apoptosis, and identification of novel targets of p53. Int J Cancer. 2006;119(5):1164–1175. doi:10.1002/ijc.21938
22. Sun KW, Ma YY, Guan TP, et al. Oridonin induces apoptosis in gastric cancer through Apaf-1, cytochrome c and caspase-3 signaling pathway. World J Gastroenterol. 2012;18(48):7166–7174. doi:10.3748/wjg.v18.i48.7166
23. Bowler E, Porazinski S, Uzor S, et al. Hypoxia leads to significant changes in alternative splicing and elevated expression of CLK splice factor kinases in PC3 prostate cancer cells. BMC Cancer. 2018;18(1):355. doi:10.1186/s12885-018-4242-8
24. He J, Feng X, Hua J, et al. miR-300 regulates cellular radiosensitivity through targeting p53 and apaf1 in human lung cancer cells. Cell Cycle. 2017;16(20):1943–1953. doi:10.1080/15384101.2017.1367070
25. Ahn BK, Kim SH, Paik SS, Lee KH. Loss of APAF-1 expression is associated with early recurrence in stage I, II, and III colorectal cancer. Langenbecks Arch Surg. 2016;401(8):1203–1210. doi:10.1007/s00423-016-1483-3
 © 2019 The Author(s). This work is published and licensed by Dove Medical Press Limited. The full terms of this license are available at https://www.dovepress.com/terms.php and incorporate the Creative Commons Attribution - Non Commercial (unported, v3.0) License.
By accessing the work you hereby accept the Terms. Non-commercial uses of the work are permitted without any further permission from Dove Medical Press Limited, provided the work is properly attributed. For permission for commercial use of this work, please see paragraphs 4.2 and 5 of our Terms.
© 2019 The Author(s). This work is published and licensed by Dove Medical Press Limited. The full terms of this license are available at https://www.dovepress.com/terms.php and incorporate the Creative Commons Attribution - Non Commercial (unported, v3.0) License.
By accessing the work you hereby accept the Terms. Non-commercial uses of the work are permitted without any further permission from Dove Medical Press Limited, provided the work is properly attributed. For permission for commercial use of this work, please see paragraphs 4.2 and 5 of our Terms.