")
Back to Journals » OncoTargets and Therapy » Volume 11
miR-361-5p inhibits glioma migration and invasion by targeting SND1
Authors Liu J , Yang J, Yu L , Rao C, Wang Q, Sun CY, Shi CJ, Hua D, Zhou XX, Luo WJ, Wang R, Li WP, Yu SZ
Received 18 April 2018
Accepted for publication 1 June 2018
Published 28 August 2018 Volume 2018:11 Pages 5239—5252
DOI https://doi.org/10.2147/OTT.S171539
Checked for plagiarism Yes
Review by Single anonymous peer review
Peer reviewer comments 2
Editor who approved publication: Prof. Dr. Takuya Aoki
Jing Liu,1,2,* Jie Yang,3,* Lin Yu,3,* Chun Rao,2,4,5 Qian Wang,2,4,5 Cuiyun Sun,2,4,5 Cuijuan Shi,2,4,5 Dan Hua,2,4,5 Xuexia Zhou,2,4,5 Wenjun Luo,2,4,5 Run Wang,2,4,5 Weiping Li,1 Shizhu Yu2,4,5
1Department of Neurosurgery and Shenzhen Key Laboratory of Neurosurgery, The First Affiliated Hospital of Shenzhen University, Shenzhen Second People’s Hospital, Shenzhen University School of Medicine, Shenzhen 518035, People’s Republic of China; 2Department of Neuropathology, Tianjin Neurological Institute, Tianjin Medical University General Hospital, Tianjin 300052, People’s Republic of China; 3Department of Biochemistry and Molecular Biology, School of Basic Medical Sciences of Tianjin Medical University,Tianjin 300070, People’s Republic of China; 4Department of Neuropathology, Key Laboratory of Post-Trauma Neuro-Repair and Regeneration in Central Nervous System, Ministry of Education, Tianjin 300052, People’s Republic of China; 5Department of Neuropathology, Tianjin Key Laboratory of Injuries, Variations and Regeneration of the Nervous System, Tianjin 300052, People’s Republic of China
*These authors contributed equally to this work
Background: Downregulation of miR-361-5p contributes to epithelial–mesenchymal transition of glioma cells. However, the relevance of miR-361-5p to migration and invasion of gliomas remains unknown.
Materials and methods: The relationship between miR-361-5p and SND1 expression was analyzed in 120 human gliomas and 8 glioma cell lines by in situ hybridization, immunohistochemistry, and Western blot. Dual-luciferase reporter assay was used to identify SND1 as a target of miR-361-5p. The mechanisms through which miR-361-5p inhibits glioma cell migration and invasion were studied by in vitro assays.
Results: miR-361-5p expression was significantly downregulated in glioma tissues and glioma cell lines, and was inversely correlated with glioma grades. However, SND1 expression was positively correlated with glioma grades and inversely correlated with miR-361-5p expression. miR-361-5p overexpression suppressed glioma cell migration and invasion through targeting SND1 and subsequently decreasing MMP-2 expression. In glioma cell lines, SND1 overexpression could partly reverse the antitumor effects of miR-361-5p.
Conclusion: The findings provide evidence that miR-361-5p directly targets SND1 to degradation and then reduces MMP-2 gene transcription, thus inhibiting glioma migration and invasion. miR-361-5p is an important tumor suppressor and a novel diagnostic biomarker of glioma, and miR-361-5p and SND1 are potential therapeutic candidates for malignant gliomas.
Keywords: miR-361-5p, glioma, SND1, migration, invasion
Introduction
Gliomas are the most common tumors in the brain and are among the deadliest of all cancers. The most aggressive type of glioma, glioblastoma multiforme (GBM), has a median survival of only 15 months.1 The poor prognosis and survival rates of GBM are due to its highly invasive nature.2 Despite significant advances in neurosurgical techniques and the introduction of novel chemotherapies, the overall prognosis of GBM patients remains dismal.3 Therefore, new therapeutic approaches for the treatment of GBM are urgently needed.
miRNAs are small, noncoding RNAs, which are important negative regulators of posttranscriptional gene expression and work by directly targeting the 3′-UTRs of target mRNAs.4 Numerous studies have shown that miRNAs are aberrantly expressed in various human malignancies. Normal regulations can be destroyed by tumor-suppressive or oncogenic miRNAs in malignancies.5 miR-361-5p has not been described as an oncogenic miRNA or a tumor-suppressive miRNA until now. A study on prostate cancer reported that miR-361-5p can act as a tumor suppressor by targeting STAT6.6 However, in cervical cancer, it turns out to be an oncogenic miRNA that facilitates its progression through mediation of epithelial–mesenchymal transition (EMT).7 Some researches have also presented that miR-361-5p could play an important role in human cutaneous squamous cell carcinoma, gastric cancer, and lung cancer, but the underlying mechanism is not very clear.8–10 Recently, it has been reported that miR-361-5p can inhibit EMT in glioma through targeting Twist1.11 However, the relevance of miR-361-5p to migration and invasion in glioma remains totally unknown.
SND1, also named Tudor-SN, p100, or TSN, was identified as a transcriptional coactivator that could interact with EBNA-2, Pim-1, STAT6, and STAT5 and help facilitate their transcriptional activity.12–15 In addition, being one of the components of RNA-induced silencing complex, SND1 interacts with AEG-1 and results in increased degradation of tumor suppressor mRNAs, thus exerting carcinogenic effects in colon cancer, hepatocellular carcinoma, and breast carcinoma.16–18 Recently, studies have reported that SND1 also modulated the expression of miRNA by somehow involving in the processing of the precursors to the mature miRNAs.19,20
As we know, the most fundamental role of MMP-2 protein secreted by tumor cells is to degrade extracellular matrix (ECM), thereby promoting the invasion and migration of tumor cells.21 Among gliomas, the expression of MMP-2 is the highest in GBM compared to low-grade astrocytoma, and MMP-2 is the most important factor in the invasion and migration of glioma cells.22,23
In this study, we confirmed for the first time that miR-361-5p downregulation results in SND1 overexpression in gliomas and miR-361-5p upregulation may restrain the migration and invasion of glioma cells through directly targeting SND1. In addition, we discovered that SND1 may activate the transcription of MMP-2 gene in GBM cells, resulting in increased cell motility and digestion of ECM, thereby promoting the migration and invasion of GBM cells. Our present data indicate that miR-361-5p may serve as a novel diagnostic biomarker and a potential therapeutic target for human malignant gliomas.
Materials and methods
Tissue samples and slide preparation
Surgical specimens of 120 astrocytic gliomas and 20 nontumoral brain tissues (control) were collected from the patients admitted to Tianjin Medical University General Hospital (TMUGH), and written informed consent was obtained from all the patients. The 20 nontumoral brain tissue samples were obtained using decompressive craniectomy performed for traumatic brain injury. After surgical excision, specimens were immediately fixed in 3.7% buffered formaldehyde solution. The formalin-fixed, paraffin-embedded (FFPE) samples were stored at room temperature (RT). The FFPE tissue sections of 5 μm thickness were cut for H&E staining, miR-361-5p in situ hybridization (ISH) and immunohistochemistry (IHC) detection of SND1. Pathological diagnoses were independently made by 2 neuropathologists according to the 2016 World Health Organization (WHO) classification of central nervous system tumors.24 The pathological diagnoses of all glioma tissue samples are listed in Table 1. This study was carried out in accordance with the principles of the Declaration of Helsinki and approved by the Ethics Committee of TMUGH.
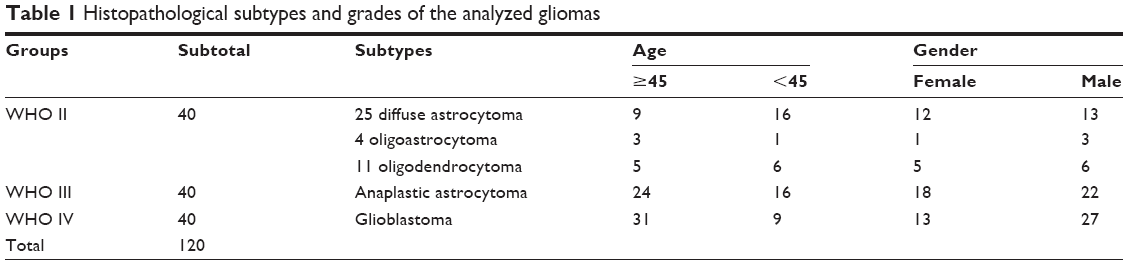 | Table 1 Histopathological subtypes and grades of the analyzed gliomas |
ISH and IHC
For ISH detection, deparaffinized tissue sections were hybridized with 50 nM LNA-modified and digoxin-labeled miR-361-5p oligonucleotide probe (Exiqon, Vedbaek, Denmark) for 1 h at 55°C, incubated with 5 μg/mL anti-digoxin-Rhodamine antibody (Roche Applied Science, Penzberg, Germany) overnight at 4°C, and stained with DAPI in the dark for 15 min at RT. The red fluorescence in the cytoplasm indicated positive signal. The IHC staining was performed according to the standard ABC protocol with the antibodies of mouse anti-human SND1 (1:100; Abcam, Cambridge, UK). The brown signal in the cytoplasm was considered to indicate positive result. The labeling index (LI) was calculated as the percentage of positive cell number to the total cell number.
Cell lines and cell culture
The human glioma cell lines U87MG, LN229, and U118 were obtained from the American Type Culture Collection (ATCC); U251, SNB19, and LN308 were purchased from China Academia Sinica Cell Repository (Shanghai, People’s Republic of China). We also detected the miR-361-5p and SND1 protein expression in the domestic human GBM cell lines TJ899 and TJ905, as they reflect the biological features of Chinese patients to some extent. The TJ899 and TJ905 cell lines were established by Institute of Neurology, TMUGH. The TJ899 cell line was taken from a surgical specimen of a male patient with temporal and occipital gliomas, while the TJ905 cell line was obtained from a male patient with parietal glioma. Both the cases were diagnosed as GBM by histopathological examination. Immortalized normal human astrocyte cell line UC2 was also used. It was provided by Southwestern Medical Center, University of Texas (UTSW). The cells were cultured in DMEM (Thermo Fisher Scientific, Waltham, MA, USA) with 10% FBS (Thermo Fisher Scientific) at 37°C with 5% CO2.
miR-361-5p mimics and SND1-overexpression pSG5-SND1 transfection
The dsRNA oligonucleotides of miR-361-5p mimics and scrambled sequence (Scr) were purchased from Ribobio. Before transfection, the U87MG and U251 cell lines in logarithmic growth phase were inoculated into 60 mm plates until the cells grew to 50% confluence. The U87MG and U251 cells of miR-361-5p groups and Scr groups were, respectively, transfected with the corresponding dsRNA oligonucleotides (2 μg) using 10 μL X-tremeGENE siRNA Transfection Reagent (Hoffmann-La Roche Ltd., Basel, Switzerland) at a final concentration of 50 nM for 48 h.
The SND1 overexpression plasmid pSG5-SND1 and control plasmid pSG5 were constructed as described previously.25 Before transfection, the U87MG and U251 cell lines in logarithmic growth phase were inoculated into 60 mm plates until the cells grew to 90% confluence. Then, the U87MG and U251 cell lines were cotransfected with pSG5-SND1 (2 μg) or control pSG5 (2 μg) and miR-361-5p mimics (1 μg) or Scr (1 μg) using 10 μL X-tremeGENE siRNA Transfection Reagent (Hoffmann-La Roche Ltd.) and pSG5 (5 μg) or pSG5-SND1 (5 μg) using 5 μL X-tremeGENE HP Transfection Reagent (Hoffmann-La Roche Ltd.) for 48 h.
Quantitative reverse transcription PCR (qRT-PCR)
Total RNA from each group of the 2 cell lines was extracted using TRIzol reagent (Thermo Fisher Scientific). miR-361-5p was quantified with Bulge-loop miRNA qRT-PCR Detection Kit (Ribobio). Reverse Transcription System and GoTaq qPCR Master Mix Kit (Promega) were used for the qRT-PCR detection of SND1 mRNA. U6 and GAPDH were used as the internal controls of miR-361-5p and SND1 mRNA, respectively. Specific primers for SND1 detection are listed in Table 2. All reactions were performed on a CFX Connect™ Real-Time PCR Detection System (Bio-Rad). The fold changes of miR-361-5p and SND1 mRNA levels were calculated by the 2−ΔΔCt method.
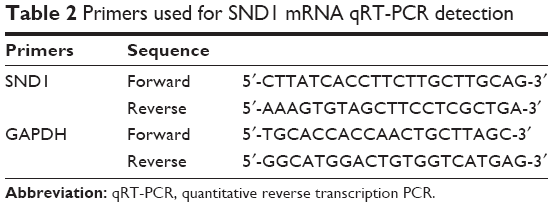 | Table 2 Primers used for SND1 mRNA qRT-PCR detection |
Western blot
The cells were collected and lysed in RIPA (Solarbio). The protein concentrations were quantified with the BCA method, and 20 μg total protein of each sample was separated by SDS-PAGE. Western blot was performed according to the standard procedure. Antibodies against SND1 (Abcam), MMP-2 (Cell Signaling Technology), and β-actin (Boster) were used in Western blot analysis in accordance with the manufacturers’ instruction.
Luciferase plasmid construction
The candidate targets of miR-361-5p were predicted using TargetScan (http://www.Targetscan.org/). The pEZX-MT01 Luciferase miRNA Expression Reporter Vector (GeneCopoeia) was applied to construct the wild (p-WT) and mutant (p-MT) reporter vectors of SND1 3′-UTR. The SND1 3′-UTR contains one predicted well-conserved miR-361-5p target region. The cDNA fragment encoding the full-length 3′-UTR of SND1 was obtained by RT-PCR from the total RNA of U87MG, and 207 base pairs of 3′-UTR of SND1 were inserted into the corresponding sites of the pEZX-MT01 vector (GeneCopoeia) to construct p-WT. We also constructed p-MT bearing deletions of the SND1 3′-UTR by using enzyme cutting technology. The sequences and orientations of the inserts in the 2 vectors were validated by DNA sequencing.
Dual-luciferase reporter assay
Before transfection, the U87MG and U251 cell lines in logarithmic growth phase were inoculated into 96-well plates until the cells grew to 90% confluence. Then, U87MG and U251 cells were cotransfected with 0.15 μg p-WT or p-MT and 0.08 μg miR-361-5p mimics or Scr using 0.8 μL X-tremeGENE siRNA Transfection Reagent (Hoffmann-La Roche Ltd.) for 48 h. The mock controls were set up by transfecting the 2 cell lines using only the above recombinant reporter vectors. The activities of both Renilla and firefly luciferases were detected with Dual-Luciferase Reporter Assay System (Promega) on a Synergy 2 Microplate Reader Fluorometer (BioTek). The results were presented after normalization with the measured values of firefly luciferase.
Transwell-chamber migration and invasion assay
Transwell inserts (24-well, 8-μm pore size; EMD Millipore, Billerica, MA, USA) with or without a 1:4 diluted Matrigel (BD Biosciences) coating layer were used to assess the cells’ invasive and migratory abilities, respectively. The GBM cells were suspended at a final density of 3.5 × 10⁴ cells/mL in a serum-free medium and seeded in the upper well of the chamber. The lower well of the chamber contained media supplemented with 10% FBS. After 24 h, cells on the upper surface of the filter were removed using a cotton swab. Cells that had migrated through the filter to the lower surface were fixed with 4% paraformaldehyde and stained with 1% crystal violet. Cells were counted from 3 randomly selected fields per each chamber.
Cell-based scratch assay
For this assay, 1 × 10⁵ cells from each group were grown to confluent monolayers in 6-well plates and scratched uniformly with a pipette tip. Cells were then washed twice with HBSS and cultured for 0, 12, and 24 h in serum-free DMEM. The wound area was measured from the image taken with a microscope (Olympus) by ImageJ program at 3 different sites of wound area of gaps. Three different sites of wound area were measured and averaged from 3 independent experiments.
Chromatin immunoprecipitation (ChIP)
ChIP assay was performed using the EZ-Magna-ChIP™-Chromatin Immunoprecipitation Kit (EMD Millipore) according to the manufacturer’s protocol. Immunoprecipitation was performed with the anti-SND1 antibody (8 μg; Abcam) and anti-IgG antibody (8 μg; Sigma, St Louis, MO, USA). The purified immunoprecipitated DNA samples were used in PCRs. Primers were synthesized by Sangon Biotechnology Co. Ltd. (Shanghai, People’s Republic of China). PCR products were resolved electrophoretically on a 2% agarose gel and visualized by ethidium bromide staining. qPCR was also used to detect the purified immunoprecipitated DNA samples.
SND1 rescue experiments
U87MG and U251 cells cultivated in 6-well plates were randomly subdivided into the Scr + pSG5 group, the miR-361-5p + pSG5 group, and the miR-361-5p + pSG5-SND1 group. Cell transfection and protein quantification were performed as described previously. Then, the cells’ ability of migration and invasion was detected by transwell-chamber migration and invasion assay as described above.
Statistical analyses
All statistical analyses were performed using SPSS 18.0 software. Data were presented as mean ± SD. The normality of distributions was estimated using Kolmogorov–Smirnov test. The differences among/between sample groups were analyzed by 1-way ANOVA or Student’s t-test. Pearson’s correlation analysis was used to determine the correlations between miR-361-5p and SND1 protein. To determine the optimal cutoff level of miR-361-5p and SND1 expression for diagnosis of glioma, receiver operating characteristic (ROC) curve analysis was performed. To determine the optimal cutoff level, Youden’s index (J = sensitivity + specificity − 1) was used. The cutoff value to obtain the highest Youden’s index was considered as the best cutoff level. Differences with a P-value <0.05 were considered statistically significant. Statistical significance was assigned at P < 0.05 (*), P < 0.01 (**), or P < 0.001 (***). All the experiments of cell lines were performed at least 3 times with triplicate samples.
Results
miR-361-5p is decreased in gliomas and correlates with grades
To identify the relationships between miR-361-5p expression in gliomas and histopathological grades, endogenous miR-361-5p levels in the FFPE specimens of 120 gliomas and 20 nontumoral control brain tissues obtained from patients were detected by ISH with LNA-modified probes. We found that miR-361-5p expression in gliomas was lower than that in the control (P < 0.001), and the expression was significantly decreased with increased glioma grade and was the lowest in GBM (P < 0.001; Figure 1A and B). ROC curve of miR-361-5p expression between low-grade glioma and high-grade glioma showed that the area under the ROC curve was 0.9481 (95% CI: 0.8956–0.9819, P < 0.0001; Figure 2A and B), which indicates that miR-361-5p expression in glioma tissues was helpful in differentiating glioma grades. The optimal cutoff value for glioma diagnosis using miR-361-5p LI was ≤12.78% (sensitivity 68.75%; specificity 97.5%).
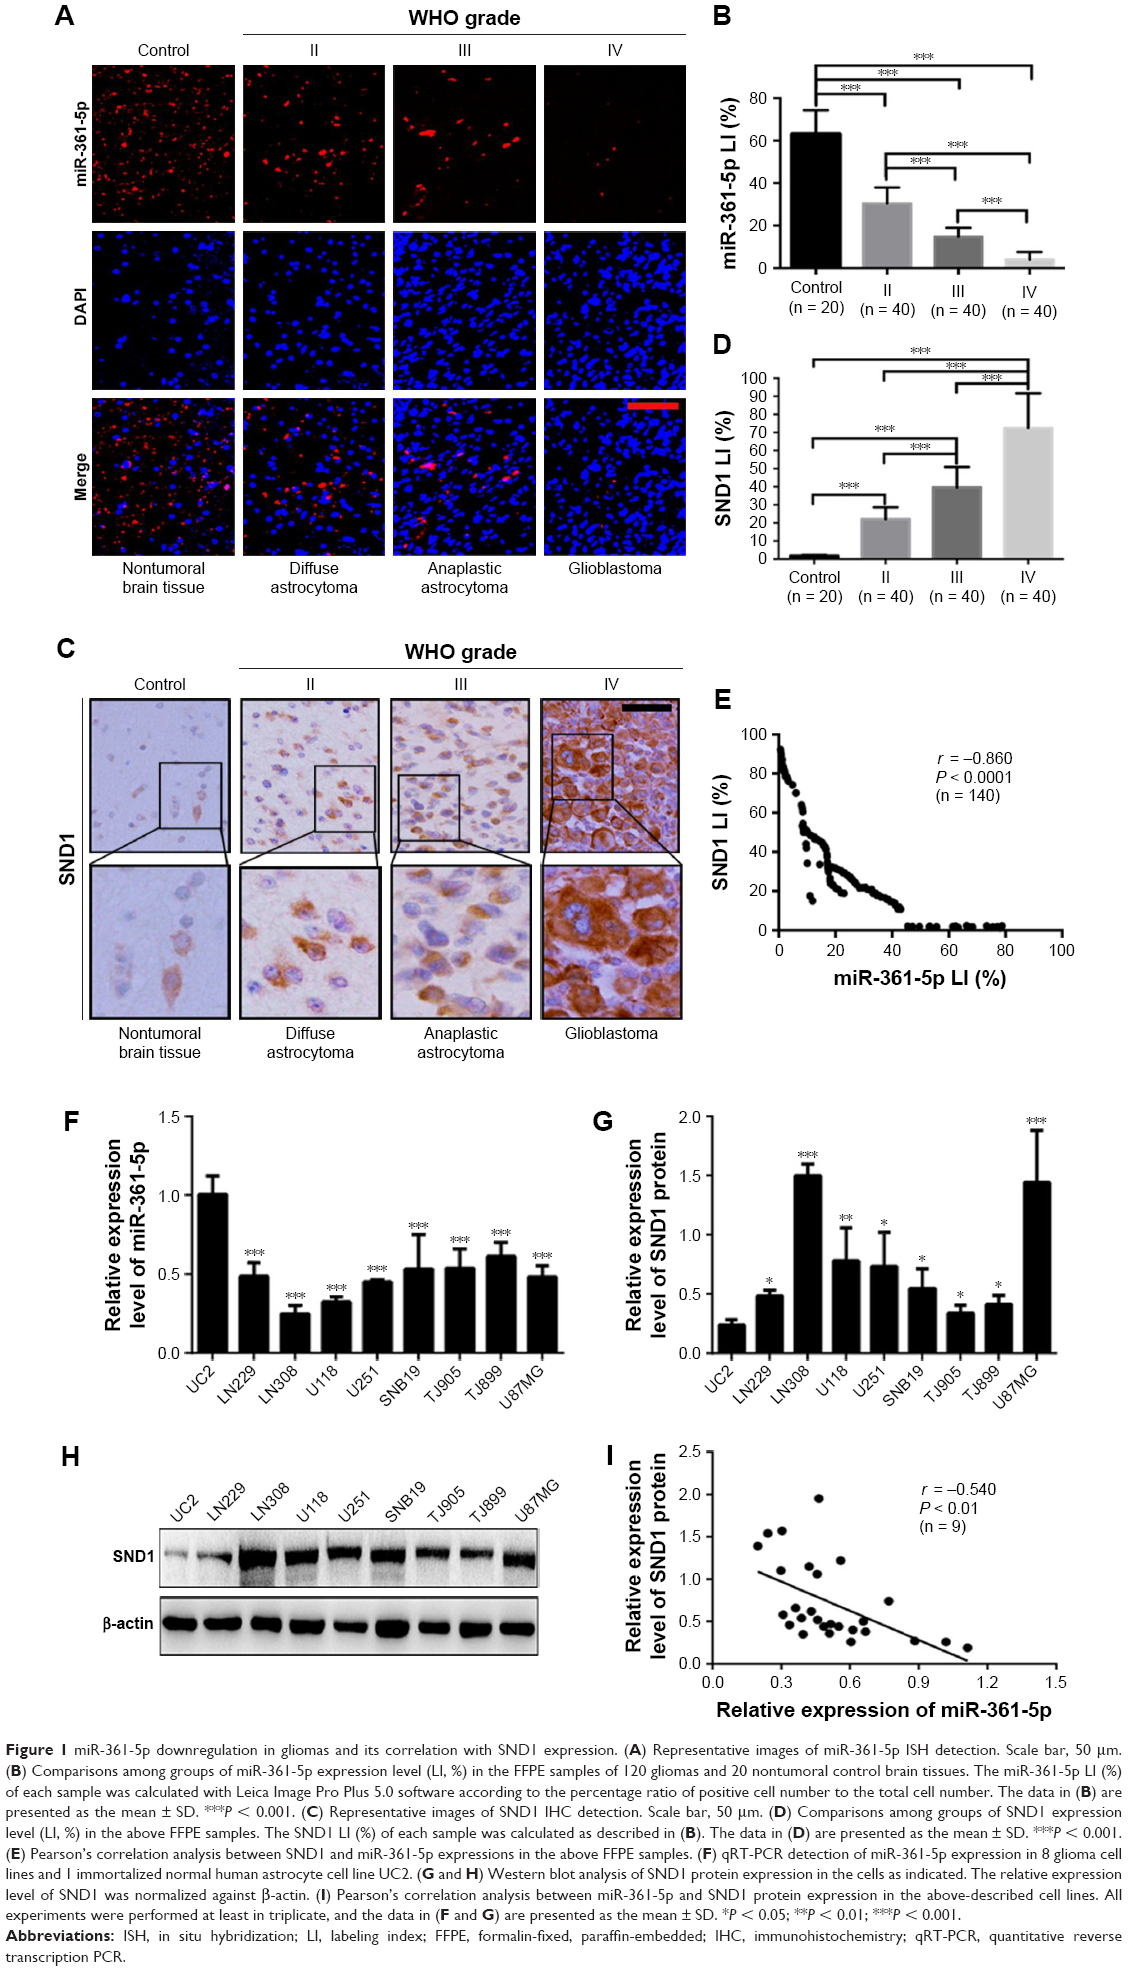 | Figure 1 miR-361-5p downregulation in gliomas and its correlation with SND1 expression. (A) Representative images of miR-361-5p ISH detection. Scale bar, 50 μm. (B) Comparisons among groups of miR-361-5p expression level (LI, %) in the FFPE samples of 120 gliomas and 20 nontumoral control brain tissues. The miR-361-5p LI (%) of each sample was calculated with Leica Image Pro Plus 5.0 software according to the percentage ratio of positive cell number to the total cell number. The data in (B) are presented as the mean ± SD. ***P < 0.001. (C) Representative images of SND1 IHC detection. Scale bar, 50 μm. (D) Comparisons among groups of SND1 expression level (LI, %) in the above FFPE samples. The SND1 LI (%) of each sample was calculated as described in (B). The data in (D) are presented as the mean ± SD. ***P < 0.001. (E) Pearson’s correlation analysis between SND1 and miR-361-5p expressions in the above FFPE samples. (F) qRT-PCR detection of miR-361-5p expression in 8 glioma cell lines and 1 immortalized normal human astrocyte cell line UC2. (G and H) Western blot analysis of SND1 protein expression in the cells as indicated. The relative expression level of SND1 was normalized against β-actin. (I) Pearson’s correlation analysis between miR-361-5p and SND1 protein expression in the above-described cell lines. All experiments were performed at least in triplicate, and the data in (F and G) are presented as the mean ± SD. *P < 0.05; **P < 0.01; ***P < 0.001. |
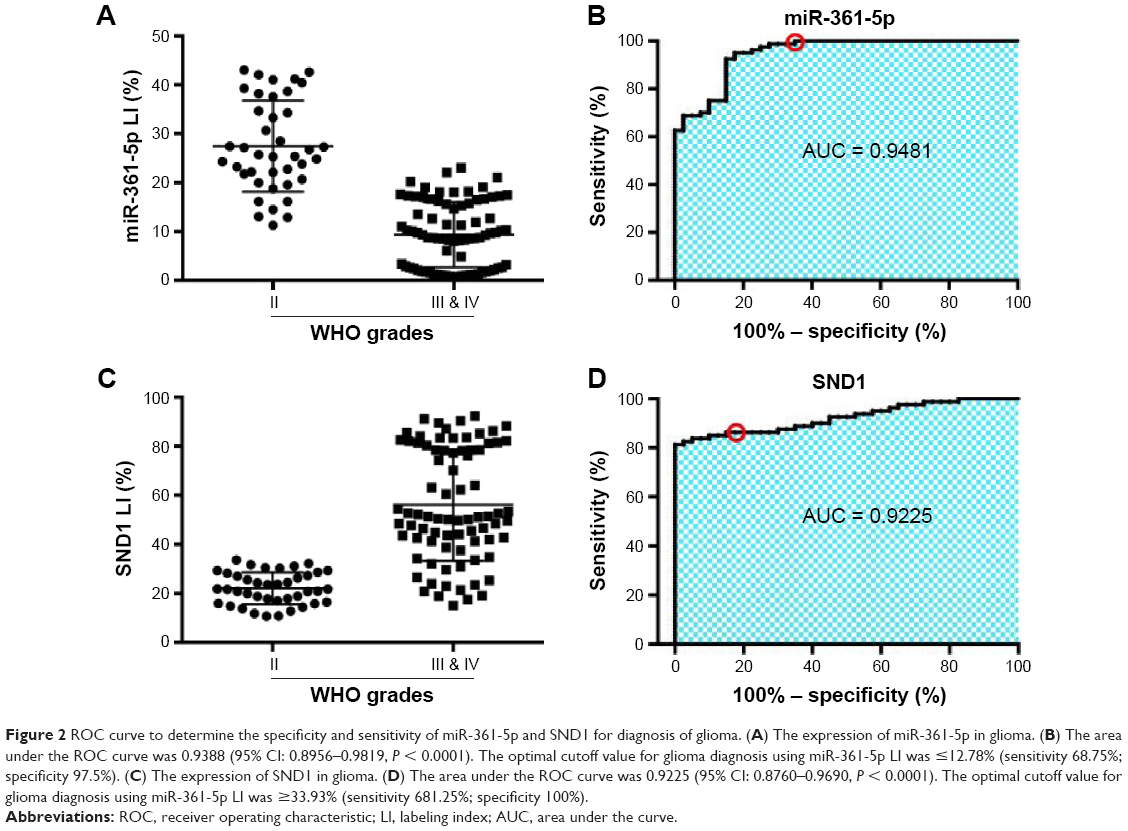 | Figure 2 ROC curve to determine the specificity and sensitivity of miR-361-5p and SND1 for diagnosis of glioma. (A) The expression of miR-361-5p in glioma. (B) The area under the ROC curve was 0.9388 (95% CI: 0.8956–0.9819, P < 0.0001). The optimal cutoff value for glioma diagnosis using miR-361-5p LI was ≤12.78% (sensitivity 68.75%; specificity 97.5%). (C) The expression of SND1 in glioma. (D) The area under the ROC curve was 0.9225 (95% CI: 0.8760–0.9690, P < 0.0001). The optimal cutoff value for glioma diagnosis using miR-361-5p LI was ≥33.93% (sensitivity 681.25%; specificity 100%). |
SND1 correlates with grades and its overexpression in glioma is associated with miR-361-5p downregulation
We then detected SND1 in the FFPE specimens of gliomas and control brain tissues by IHC, and found that SND1 expression was higher in gliomas than in control brain tissues (P < 0.001), and the expression was significantly increased with increased glioma grade and was the highest in GBM (P < 0.001; Figure 1C and D). Furthermore, SND1 expression was negatively correlated with miR-361-5p expressions in gliomas (r = 0.860, P < 0.0001; Figure 1E). ROC curve of SND1 expression between low-grade glioma and high-grade glioma showed that the area under the ROC curve was 0.9225 (95% CI: 0.8760–0.9690, P < 0.0001; Figure 2C and D), which indicates that SND1 expression in glioma tissues was helpful in differentiating glioma grades. The optimal cutoff value for glioma diagnosis using miR-361-5p LI was ≥33.93% (sensitivity 681.25%; specificity 100%).
miR-361-5p expression in glioma cell lines at various levels is negatively correlated with SND1 expression
We also analyzed the expression of miR-361-5p and SND1 protein in the immortalized normal human astrocyte cell line UC2 and glioma cell lines LN229, LN308, U118, U251, SNB19, TJ905, TJ899, and U87MG. Results showed that the expression of miR-361-5p in 8 GBM cell lines as described above was significantly lower than the immortalized normal human astrocyte cell line UC2 (P < 0.001; Figure 1F). However, the expression of SND1 protein had the opposite tendency (P < 0.05–0.001; Figure 1G and H). Pearson’s correlation analysis revealed a negative correlation between the expressions of miR-361-5p and SND1 protein (r = −0.540, P < 0.01; Figure 1I).
SND1 is a direct target of miR-361-5p in human glioma cells
TargetScan prediction revealed that the 3′-UTR of SND1 mRNA contained a conserved target region bound by miR-361-5p (Figure 3A). To confirm this prediction, we monitored the changes of miR-361-5p levels and SND1 levels in the cell lines transfected with miR-361-5p by qRT-PCR and Western blot. As shown in Figure 3D–F, the mRNA and protein of SND1 were significantly decreased in the cell lines transfected with miR-361-5p (P < 0.05–0.001), as compared with the negative control. The results revealed that miR-361-5p may directly target SND1 in GBM cells and downregulate the expression of SND1 protein by inducing degradation of its mRNA. To further verify whether miR-361-5p directly targeted SND1, we constructed 2 recombinant luciferase reporter vectors of SND1 3′-UTR, that is, p-WT and p-MT. The recombinant luciferase mRNA transcribed by p-WT carried the miR-361-5p target region (SND1-3′-UTR-WT) predicted in SND1 3′-UTR, while the one transcribed by p-MT lacked the predicted target region (SND1-3′-UTR-MT) (Figure 3A). The dual-luciferase assay showed that miR-361-5p cotransfection led to an approximately 50% decrease of the luciferase activities in the p-WT transfected cells but no changes in the p-MT transfected cells (P < 0.01; Figure 3B and C).
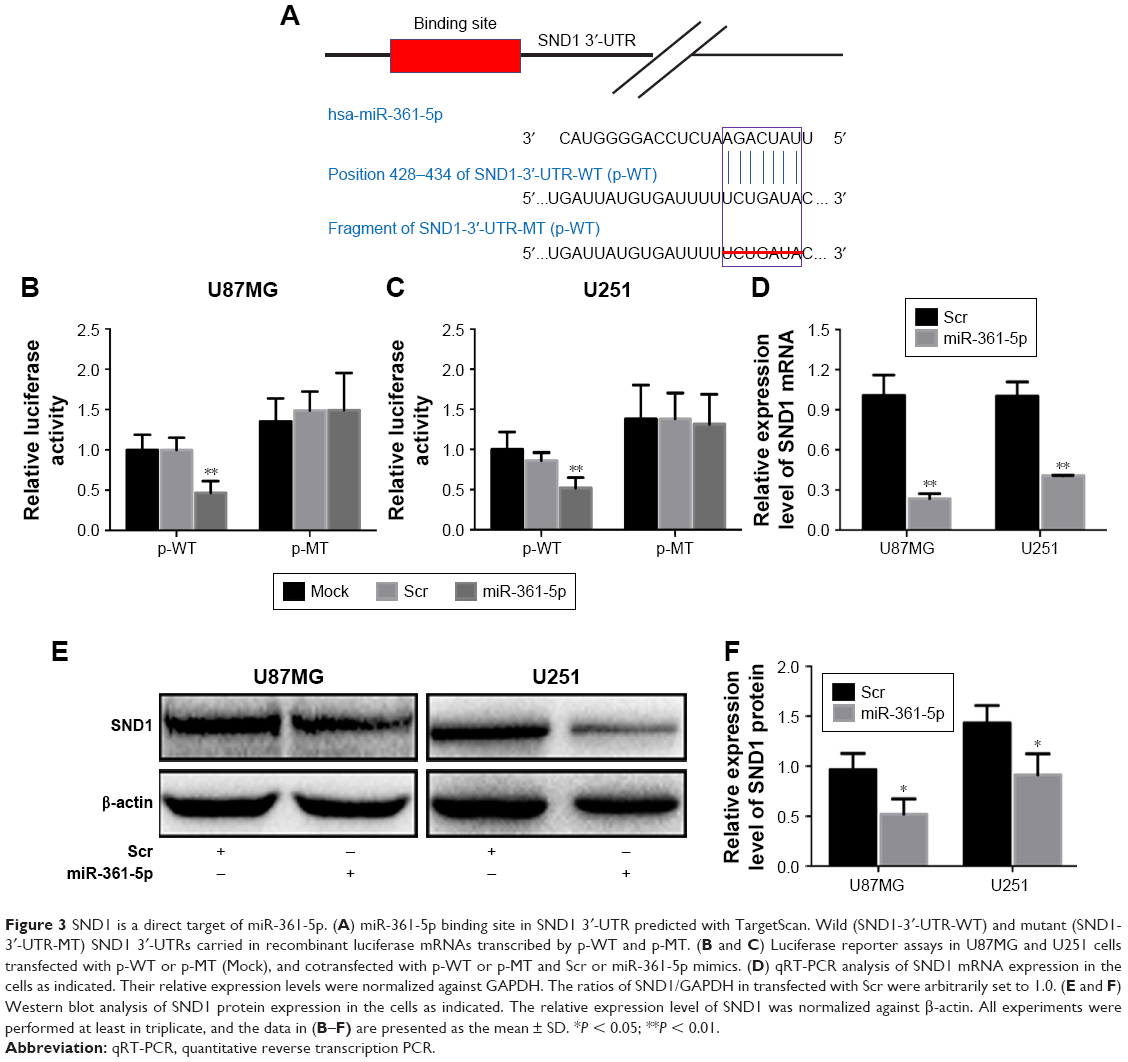 | Figure 3 SND1 is a direct target of miR-361-5p. (A) miR-361-5p binding site in SND1 3′-UTR predicted with TargetScan. Wild (SND1-3′-UTR-WT) and mutant (SND1-3′-UTR-MT) SND1 3′-UTRs carried in recombinant luciferase mRNAs transcribed by p-WT and p-MT. (B and C) Luciferase reporter assays in U87MG and U251 cells transfected with p-WT or p-MT (Mock), and cotransfected with p-WT or p-MT and Scr or miR-361-5p mimics. (D) qRT-PCR analysis of SND1 mRNA expression in the cells as indicated. Their relative expression levels were normalized against GAPDH. The ratios of SND1/GAPDH in transfected with Scr were arbitrarily set to 1.0. (E and F) Western blot analysis of SND1 protein expression in the cells as indicated. The relative expression level of SND1 was normalized against β-actin. All experiments were performed at least in triplicate, and the data in (B–F) are presented as the mean ± SD. *P < 0.05; **P < 0.01. |
miR-361-5p inhibits the migration and invasion of GBM cell lines
Transwell-chamber migration and invasion assay showed that the migratory and invasive abilities of miR-361-5p-transfected groups were significantly lower than those of their corresponding controls (P < 0.05–0.001; Figure 4A–D). We then detected the expression of MMP-2 protein after transfection with miR-361-5p. Results showed that overexpression of miR-361-5p could effectively downregulate the expression of MMP-2 protein (P < 0.001; Figure 4E and F). We also used cell-based scratch assays to detect the migration of GBM cells, and similar results were obtained with transwell-chamber migration assay (P < 0.001; Figure 5A–D). All the above results demonstrated that miR-361-5p could decrease the expression of MMP-2 and thus inhibit the migration and invasion of GBM cells.
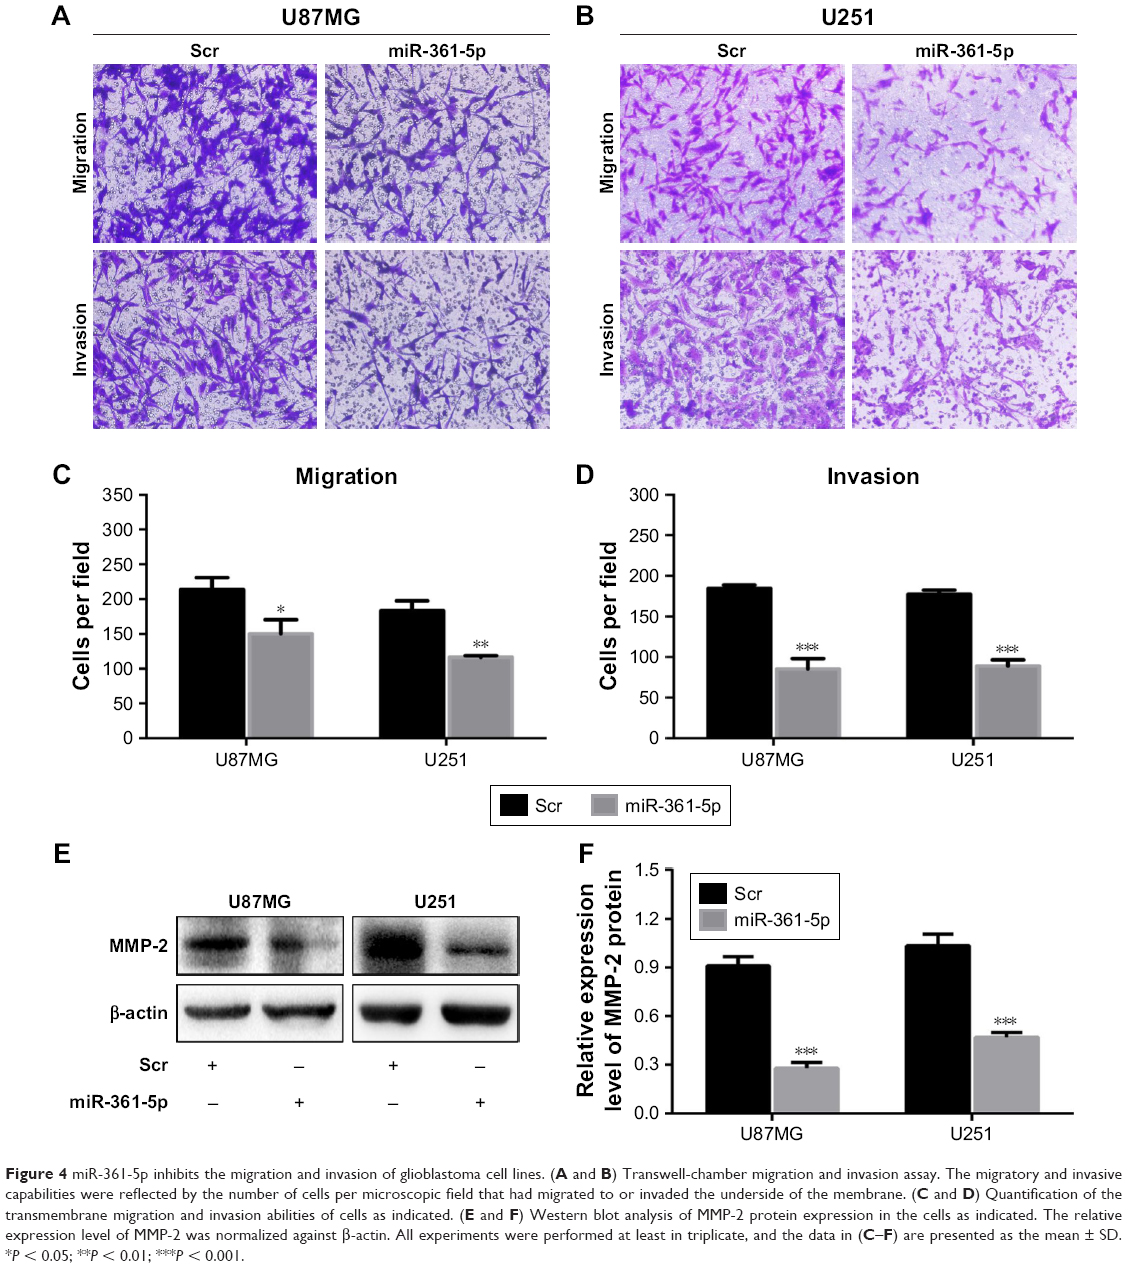 | Figure 4 miR-361-5p inhibits the migration and invasion of glioblastoma cell lines. (A and B) Transwell-chamber migration and invasion assay. The migratory and invasive capabilities were reflected by the number of cells per microscopic field that had migrated to or invaded the underside of the membrane. (C and D) Quantification of the transmembrane migration and invasion abilities of cells as indicated. (E and F) Western blot analysis of MMP-2 protein expression in the cells as indicated. The relative expression level of MMP-2 was normalized against β-actin. All experiments were performed at least in triplicate, and the data in (C–F) are presented as the mean ± SD. *P < 0.05; **P < 0.01; ***P < 0.001. |
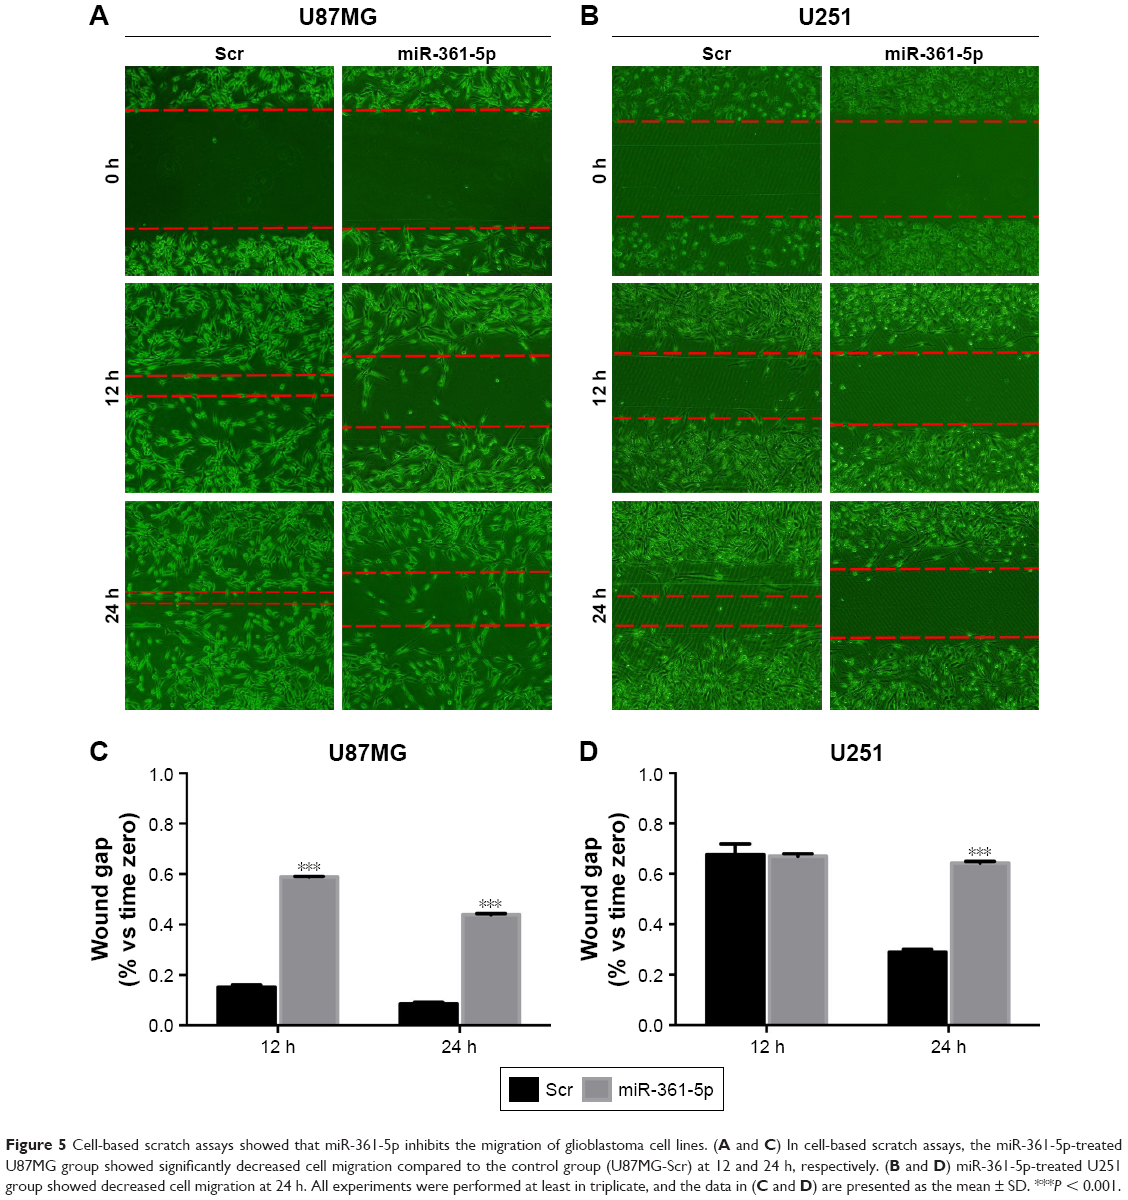 | Figure 5 Cell-based scratch assays showed that miR-361-5p inhibits the migration of glioblastoma cell lines. (A and C) In cell-based scratch assays, the miR-361-5p-treated U87MG group showed significantly decreased cell migration compared to the control group (U87MG-Scr) at 12 and 24 h, respectively. (B and D) miR-361-5p-treated U251 group showed decreased cell migration at 24 h. All experiments were performed at least in triplicate, and the data in (C and D) are presented as the mean ± SD. ***P < 0.001. |
SND1 could induce the expression of MMP-2 via gene transcription activation
MMP-2 is crucial for the invasion of malignant tumors. To further determine whether SND1 overexpression promotes the invasion of GBM cells by upregulating MMP-2 expression, we used Western blot to detect SND1 and MMP-2 protein expression in U87MG-pSG5, U87MG-pSG5-SND1, U251-pSG5, and U251-pSG5-SND1 cells. Results demonstrated that overexpression of SND1 can cause corresponding increase in the MMP-2 expression (P < 0.01–0.001; Figure 6A and B). Then, we performed standard ChIP assays with the cells described above. We found that both the SND1-binding regions (−493 to −471 bp and −251 to −219 bp) of the MMP-2 promoter were bound to SND1 protein in all cells. Moreover, in the U87MG-pSG5-SND1 and U251-pSG5-SND1 cells that expressed high SND1 levels, 2 to 3 times more DNA promoters were bound to SND1 than in U87MG-pSG5 or U251-pSG5 cells that expressed relatively low SND1 levels (P < 0.01; Figure 6C–F). Collectively, our findings demonstrated that SND1 was bound specifically to SND1-binding sites in the MMP-2 promoter in vivo.
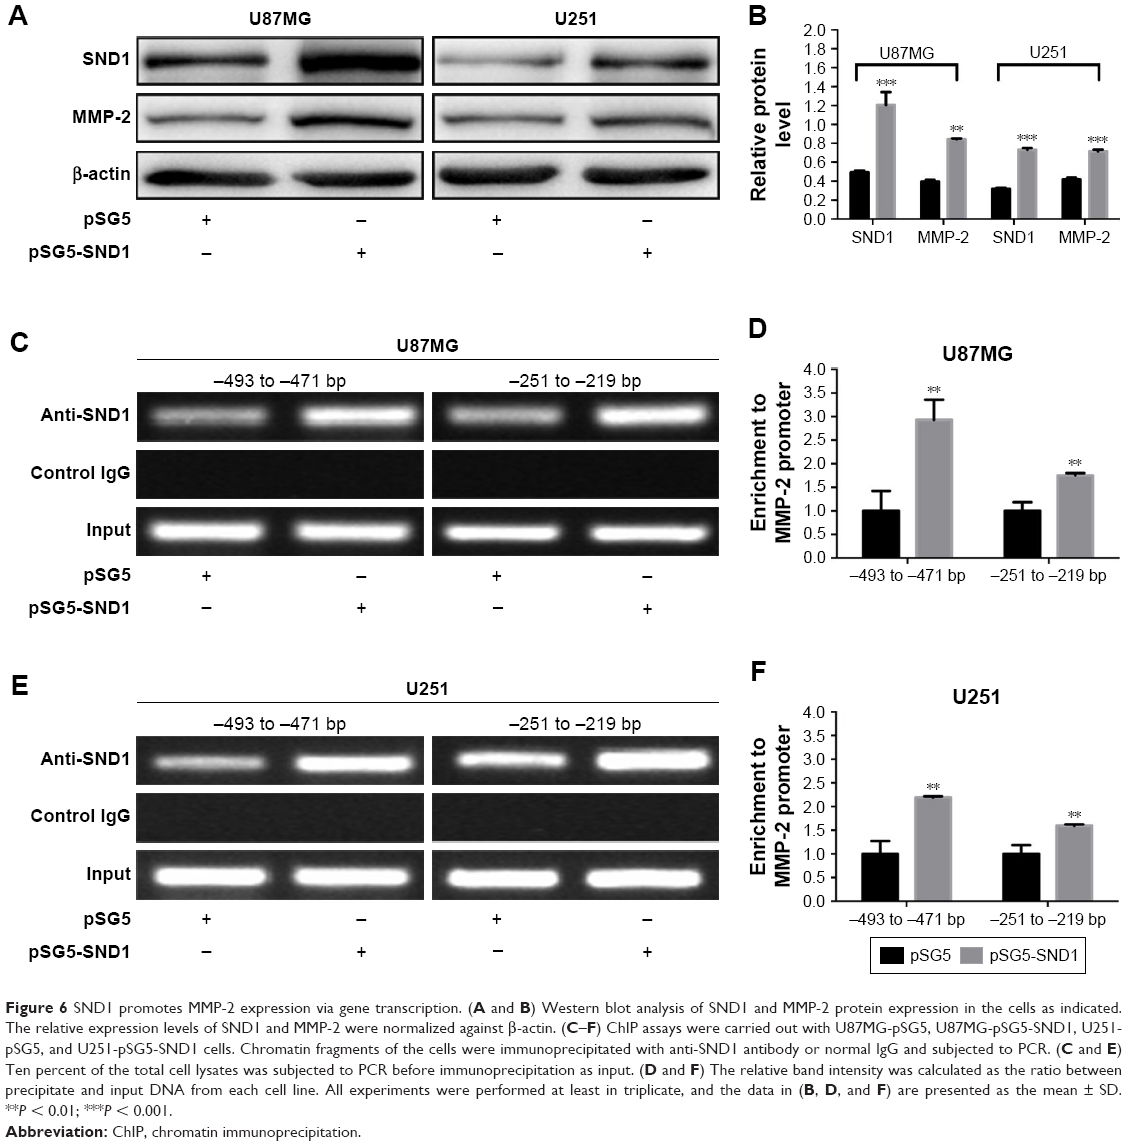 | Figure 6 SND1 promotes MMP-2 expression via gene transcription. (A and B) Western blot analysis of SND1 and MMP-2 protein expression in the cells as indicated. The relative expression levels of SND1 and MMP-2 were normalized against β-actin. (C–F) ChIP assays were carried out with U87MG-pSG5, U87MG-pSG5-SND1, U251-pSG5, and U251-pSG5-SND1 cells. Chromatin fragments of the cells were immunoprecipitated with anti-SND1 antibody or normal IgG and subjected to PCR. (C and E) Ten percent of the total cell lysates was subjected to PCR before immunoprecipitation as input. (D and F) The relative band intensity was calculated as the ratio between precipitate and input DNA from each cell line. All experiments were performed at least in triplicate, and the data in (B, D, and F) are presented as the mean ± SD. **P < 0.01; ***P < 0.001. |
SND1 reverses the tumor-suppressive effects of miR-361-5p
To further demonstrate whether SND1 downregulation mediated the tumor-suppressive effects of miR-361-5p, we transfected the U87MG and U251 cells using miR-361-5p mimics with pSG5 or pSG5-SND1, and the corresponding control group with Scr and pSG5. Western blot results showed that SND1 and MMP-2 proteins were remarkably decreased in the miR-361-5p + pSG5-cotransfected groups compared to the Scr + pSG5-cotransfected groups, and their expressions in the miR-361-5p + pSG5-SND1-cotransfected groups were risen further but still lesser than the Scr + pSG5-cotransfected group (P < 0.05–0.001; Figure 7A–C). Transwell-chamber migration and invasion assay results showed that the miR-361-5p + pSG5 groups exerted positive impact on inhibition of tumor migration and invasion. However, with the corresponding SND1 expression restored approximately to the control levels, the effects of miR-361-5p on tumor cell migration and invasion were partially compromised in the miR-361-5p + pSG5-SND1 groups (P < 0.05–0.001; Figure 7D–G). These results demonstrated that miR-361-5p inhibited the migration and invasion of U87MG and U251 cells at least partly by silencing SND1.
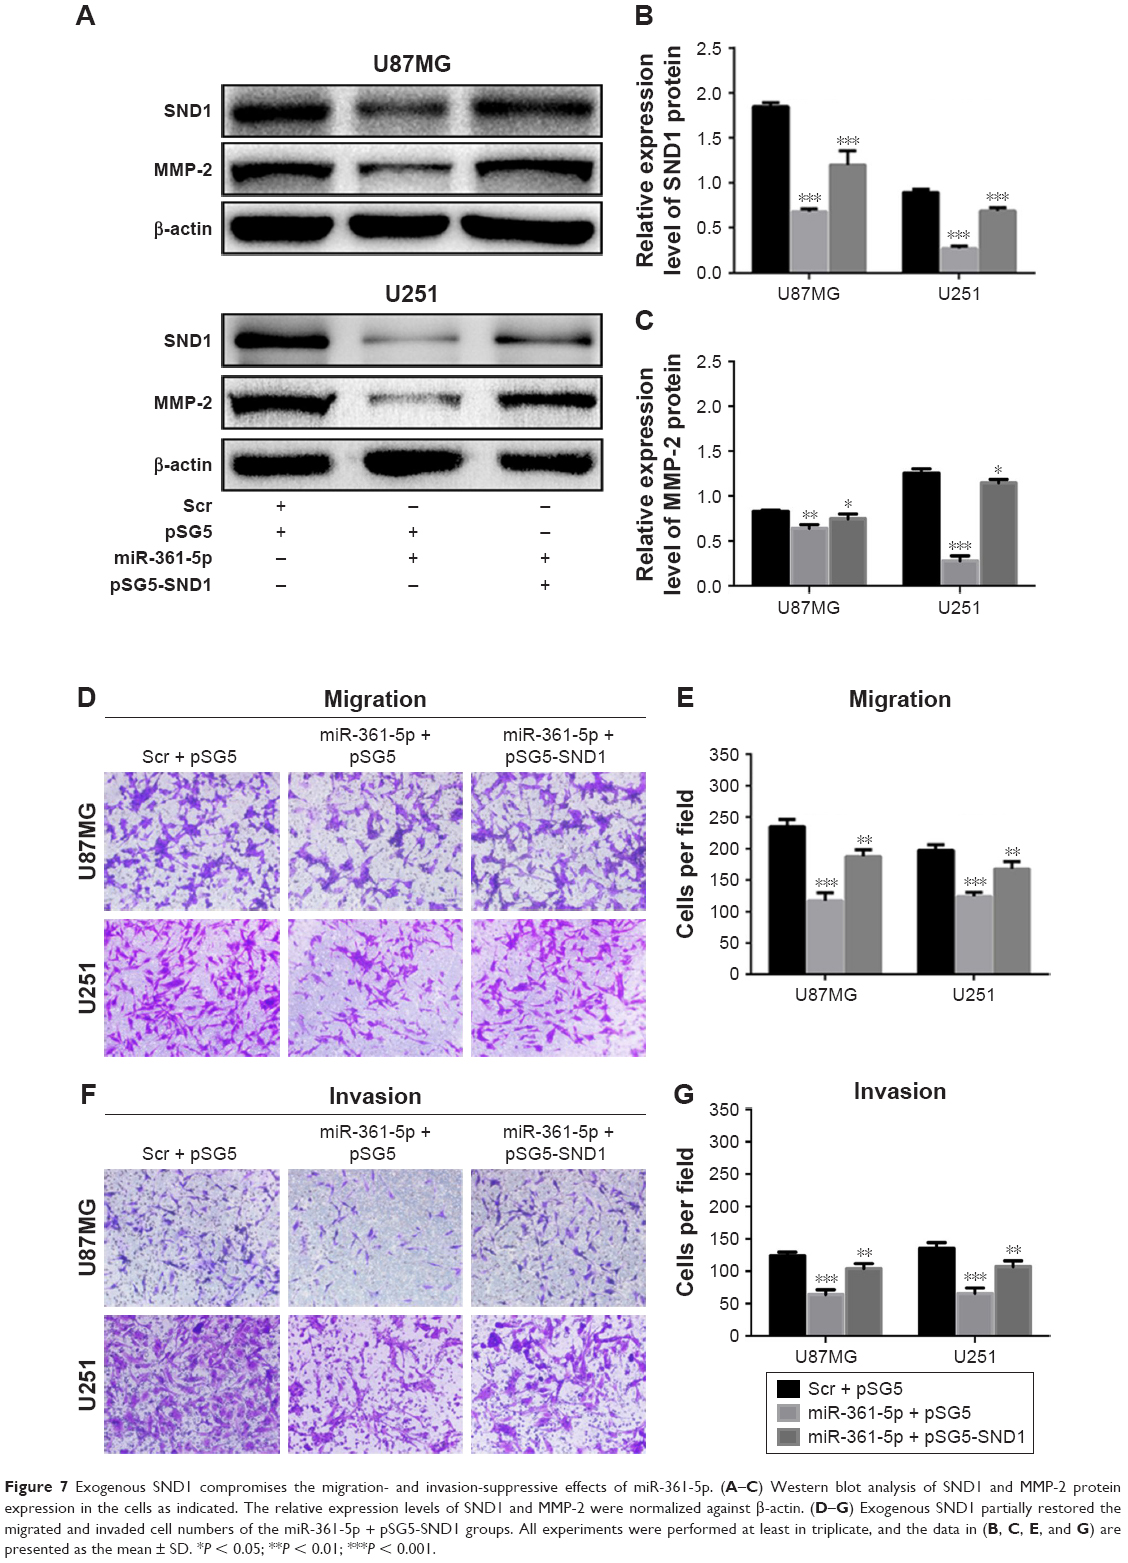 | Figure 7 Exogenous SND1 compromises the migration- and invasion-suppressive effects of miR-361-5p. (A–C) Western blot analysis of SND1 and MMP-2 protein expression in the cells as indicated. The relative expression levels of SND1 and MMP-2 were normalized against β-actin. (D–G) Exogenous SND1 partially restored the migrated and invaded cell numbers of the miR-361-5p + pSG5-SND1 groups. All experiments were performed at least in triplicate, and the data in (B, C, E, and G) are presented as the mean ± SD. *P < 0.05; **P < 0.01; ***P < 0.001. |
Discussion
Previous reports showed that miR-361-5p may function as a tumor suppressor or promoter in different tumors.6–10 Moreover, miR-361-5p downregulation contributes to EMT of glioma cells.11 However, the relevance of miR-361-5p to migration and invasion in gliomas remains unknown. In the present study, we identified miR-361-5p as a tumor suppressor that inhibits migration and invasion of cells in astrocytic gliomas. Mechanistically, we verified SND1 as a direct functional target of miR-361-5p, which facilitated our understanding of the mechanisms underlying the malignant progression of glioma. Most importantly, we found that miR-361-5p and SND1 were correlated not only with each other but also with glioma grades, and the results of ROC curve analyses highlighted the potential roles of miR-361-5p and SND1 as novel diagnostic biomarkers in human gliomas.
In our current study, we observed that the expression level of miR-361-5p in glioma tissues was significantly lower than that in the control tissues, but the expression level of SND1 protein showed an opposite tendency. We also identified miR-361-5p as a novel regulator of SND1 by using dual-luciferase reporter assays. In addition, upregulation of miR-361-5p levels was found to inhibit migration and invasion in GBM cell lines. This study is the first to identify that miR-361-5p serves as a tumor suppressor miRNA which acts by targeting SND1. Our research identified a novel regulatory effect of miR-361-5p on SND1 in mediating migration and invasion of glioma. Some studies have suggested that miR-361-5p is aberrantly expressed in diverse types of cancers, but more studies are warranted to have a more detailed understanding of the genes targeted by this miRNA. We have come to know that miR-361-5p is downregulated in prostate cancer, cutaneous squamous cell carcinoma, and lung cancer, but upregulated in cervical cancer and bladder cancer.6–10,26 For the first time, we found that miR-361-5p is significantly downregulated in glioma, and overexpression of miR-361-5p by transfecting with mimics significantly downregulates the migration and invasion of GBM cell lines.
Bioinformatic analysis predicted that SND1 is a putative target of miR-361-5p, and dual-luciferase assay verified this prediction. We also validated SND1 mRNA and protein were decreased in GBM cell lines after transfection with miR-361-5p mimics, which implies that miR-361-5p blocked SND1 expression by degradation of its mRNA. As a multifunctional protein, SND1 upregulation in various malignant tumors has been reported, such as colon cancer, hepatocellular carcinoma, prostate cancer, breast cancer, and glioma.27–29 One of the important functions that SND1 plays in biological events is transcriptional activation. Our study reported that SND1 could promote MMP-2 gene transcription, leading to enhancement of GBM cell invasion and migration. MMP-2 produced by tumor cells has been demonstrated to play a fundamental role in ECM degradation and tumor cell invasion.21 In glioma, MMP-2 expression was highest in high-grade gliomas compared with noninvasive low-grade astrocytomas and normal brains, which is the primary mediator of glioma invasion.22,23 In our present study, we also observed a synchronous decrease of SND1 protein and MMP-2 protein in GBM cells after miR-361-5p transfection, followed by inhibition of their ability of migration and invasion; however, this phenomenon was partially compromised by SND1 transfection. Hence, we concluded that miR-361-5p could cause downregulation of SND1 by targeting its mRNA 3′-UTR, thereby causing downregulation of MMP-2 because of the decreased transcriptional activity.
Taken together, our findings shed light, for the first time, on the important link between miR-361-5p and SND1 regulation in glioma. We have shown that miR-361-5p can inhibit GBM cells’ migration and invasion by targeting SND1. Downregulation of SND1 could further decrease the transcriptional activity of MMP-2. The miR-361-5p-SND1-MMP-2 axis may provide new insights into the mechanisms of glioma migration and invasion, and restoration of miR-361-5p expression may offer a new strategy for the treatment of glioma in the future.
Conclusion
The present study showed that miR-361-5p was downregulated in glioma tissues and negatively correlated with SND1 expression. Moreover, the expressions of both miR-361-5p and SND1 were associated with the degree of glioma in a grade-dependent manner. In addition, overexpression of miR-361-5p was found to have migration/invasion-inhibiting effects on human glioma cell lines by targeting SND1. Further studies are needed to explore the potential role of miR-361-5p in animal models.
Acknowledgment
This research was supported by the National Natural Science Foundation of China (No 81402050, 81502166, 81672592, 31370749, and 31670759), the China Postdoctoral Science Foundation (No 2017M622881), the Innovation Team Development Plan of Ministry of Education (IRT13085), the Program of Science and Technology of Tianjin Municipality (No 15JCYBJC49900, 15JCZDJC34600, 16JCQNJC13400, and 17JCYBJC27100), the Shenzhen Science and Technology Innovation Commission (No JCYJ20170306090714854), the Program of Tianjin Municipal Health Bureau (No 15KJ147), and the Foundation of Tianjin Medical University and General Hospital (No 2015KYZQ11, ZYYFY2014038, and ZYYFY2015032).
Disclosure
The authors report no conflicts of interest in this work.
References
Wen PY, Kesari S. Malignant gliomas in adults. N Engl J Med. 2008;359(5):492–507. | ||
Dardevet L, Rani D, Aziz TA, et al. Chlorotoxin: a helpful natural scorpion peptide to diagnose glioma and fight tumor invasion. Toxins (Basel). 2015;7(4):1079–1101. | ||
Clarke J, Butowski N, Chang S. Recent advances in therapy for glioblastoma. Arch Neurol. 2010;67(3):279–283. | ||
Carthew RW, Sontheimer EJ. Origins and mechanisms of miRNAs and siRNAs. Cell. 2009;136(4):642–655. | ||
Galasso M, Sandhu SK, Volinia S. MicroRNA expression signatures in solid malignancies. Cancer J. 2012;18(3):238–243. | ||
Liu D, Tao T, Xu B, et al. MiR-361-5p acts as a tumor suppressor in prostate cancer by targeting signal transducer and activator of transcription-6 (STAT6). Biochem Biophys Res Commun. 2014;445(1):151–156. | ||
Wu X, Xi X, Yan Q, et al. MicroRNA-361-5p facilitates cervical cancer progression through mediation of epithelial-to-mesenchymal transition. Med Oncol. 2013;30(4):751. | ||
Kanitz A, Imig J, Dziunycz PJ, et al. The expression levels of microRNA-361-5p and its target VEGFA are inversely correlated in human cutaneous squamous cell carcinoma. PLoS One. 2012;7(11):e49568. | ||
Wu R, Li F, Zhu J, et al. A functional variant at miR-132-3p, miR-212-3p, and miR-361-5p binding site in CD80 gene alters susceptibility to gastric cancer in a Chinese Han population. Med Oncol. 2014;31(8):60. | ||
Othman N, In LL, Harikrishna JA, Hasima N. Bcl-xL silencing induces alterations in hsa-miR-608 expression and subsequent cell death in A549 and SK-LU1 human lung adenocarcinoma cells. PLoS One. 2013;8(12):e81735. | ||
Zhang X, Wei C, Li J, Liu J, Qu J. MicroRNA-361-5p inhibits epithelial-to-mesenchymal transition of glioma cells through targeting Twist1. Oncol Rep. 2017;37(3):1849–1856. | ||
Tong X, Drapkin R, Yalamanchili R, Mosialos G, Kieff E. The Epstein-Barr virus nuclear protein 2 acidic domain forms a complex with a novel cellular coactivator that can interact with TFIIE. Mol Cell Biol. 1995;15(9):4735–4744. | ||
Leverson JD, Koskinen PJ, Orrico FC, et al. Pim-1 kinase and p100 cooperate to enhance c-Myb activity. Mol Cell. 1998;2(4):417–425. | ||
Valineva T, Yang J, Palovuori R, Silvennoinen O. The transcriptional co-activator protein p100 recruits histone acetyltransferase activity to STAT6 and mediates interaction between the CREB-binding protein and STAT6. J Biol Chem. 2005;280(15):14989–14996. | ||
Paukku K, Yang J, Silvennoinen O. Tudor and nuclease-like domains containing protein p100 function as coactivators for signal transducer and activator of transcription 5. Mol Endocrinol. 2003;17(9):1805–1814. | ||
Wang N, Du X, Zang L, et al. Prognostic impact of Metadherin-SND1 interaction in colon cancer. Mol Biol Rep. 2012;39(12):10497–10504. | ||
Yoo BK, Santhekadur PK, Gredler R, et al. Increased RNA-induced silencing complex (RISC) activity contributes to hepatocellular carcinoma. Hepatology. 2011;53(5):1538–1548. | ||
Blanco MA, Aleckovic M, Hua Y, et al. Identification of staphylococcal nuclease domain-containing 1 (SND1) as a Metadherin-interacting protein with metastasis-promoting functions. J Biol Chem. 2011;286(22):19982–19992. | ||
Zhao X, Duan Z, Liu X, et al. MicroRNA-127 is downregulated by Tudor-SN protein and contributes to metastasis and proliferation in breast cancer cell line MDA-MB-231. Anat Rec (Hoboken). 2013;296(12):1842–1849. | ||
Heinrich EM, Wagner J, Kruger M, et al. Regulation of miR-17-92a cluster processing by the microRNA binding protein SND1. FEBS Lett. 2013;587(15):2405–2411. | ||
Yu AE, Hewitt RE, Kleiner DE, Stetler-Stevenson WG. Molecular regulation of cellular invasion – role of gelatinase A and TIMP-2. Biochem Cell Biol. 1996;749(6):823–831. | ||
Sawaya RE, Yamamoto M, Gokaslan ZL, et al. Expression and localization of 72 kDa type IV collagenase (MMP2) in human malignant gliomas in vivo. Clin Exp Metastasis. 1996;14(1):35–42. | ||
Uhm JH, Dooley NP, Villemure JG, et al. Glioma invasion in vitro: regulation by matrix metalloprotease-2 and protein kinase C. Clin Exp Metastasis. 1996;14(5):421–433. | ||
Louis DN, Perry A, Reifenberger G, et al. The 2016 World Health Organization classification of tumors of the central nervous system: a summary. Acta Neuropathol. 2016;131(6):803–820. | ||
Yang J, Aittomaki S, Pesu M, et al. Identification of p100 as a coactivator for STAT6 that bridges STAT6 with RNA polymerase II. EMBO J. 2002;21:4950–4958. | ||
Song T, Xia W, Shao N, et al. Differential miRNA expression profiles in bladder urothelial carcinomas. Asian Pac J Cancer Prev. 2010;11(4):905–911. | ||
Kuruma H, Kamata Y, Takahashi H, et al. Staphylococcal nuclease domain-containing protein 1 as a potential tissue marker for prostate cancer. Am J Pathol. 2009;174(6):2044–2050. | ||
Yu L, Liu X, Cui L, et al. SND1 acts downstream of TGFbeta1 and upstream of Smurf1 to promote breast cancer metastasis. Cancer Res. 2015;75(7):1275–1286. | ||
Emdad L, Janjic A, Alzubi MA, et al. Suppression of miR-184 in malignant gliomas upregulates SND1 and promotes tumor aggressiveness. Neuro Oncol. 2014;17(3):419–429. |
 © 2018 The Author(s). This work is published and licensed by Dove Medical Press Limited. The full terms of this license are available at https://www.dovepress.com/terms.php and incorporate the Creative Commons Attribution - Non Commercial (unported, v3.0) License.
By accessing the work you hereby accept the Terms. Non-commercial uses of the work are permitted without any further permission from Dove Medical Press Limited, provided the work is properly attributed. For permission for commercial use of this work, please see paragraphs 4.2 and 5 of our Terms.
© 2018 The Author(s). This work is published and licensed by Dove Medical Press Limited. The full terms of this license are available at https://www.dovepress.com/terms.php and incorporate the Creative Commons Attribution - Non Commercial (unported, v3.0) License.
By accessing the work you hereby accept the Terms. Non-commercial uses of the work are permitted without any further permission from Dove Medical Press Limited, provided the work is properly attributed. For permission for commercial use of this work, please see paragraphs 4.2 and 5 of our Terms.