")
Back to Journals » OncoTargets and Therapy » Volume 12
miR-30a-3p Targets MAD2L1 and Regulates Proliferation of Gastric Cancer Cells
Authors Wang Y, Wang F, He J, Du J, Zhang H, Shi H, Chen Y, Wei Y, Xue W, Yan J , Feng Y, Gao Y, Li D , Han J, Zhang J
Received 11 July 2019
Accepted for publication 27 November 2019
Published 19 December 2019 Volume 2019:12 Pages 11313—11324
DOI https://doi.org/10.2147/OTT.S222854
Checked for plagiarism Yes
Review by Single anonymous peer review
Peer reviewer comments 4
Editor who approved publication: Dr XuYu Yang
Yu Wang,1,2,* Fenghui Wang,1,2,* Jing He,1,2,* Juan Du,1,2 Huahua Zhang,1,2 Haiyan Shi,1,2 Yani Chen,1,2 Yameng Wei,1,2 Wanjuan Xue,1,2 Jing Yan,1,2 Yun Feng,1,2 Yi Gao,1,2 Dan Li,1,2 Jiming Han,1,2 Jing Zhang1,2
1Department of Clinical Medicine, Medical College of Yan’an University, Yan’an, Shaanxi 716000, People’s Republic of China; 2Yan’an Key Laboratory of Chronic Disease Prevention and Research, Yan’an, Shaanxi 716000, People’s Republic of China
*These authors contributed equally to this work
Correspondence: Jing Zhang
Department of Clinical Medicine, Medical College of Yan’an University, No. 38, Guanghua Road, Yan’an 716000, People’s Republic of China
Tel +86-911-2650158
Email [email protected]
Purpose: This study was done to investigate the inhibition effects of miR-30a-3p on mitotic arrest deficient 2 like 1 (MAD2L1) expression and the proliferation of gastric cancer cells.
Patients and methods: Cluster analysis and the TCGA database were used to screen the key genes highly expressed in gastric cancer. Based on the LinkedOmics website, the correlation between the miR-30a-3p and the cell cycle-related target gene MAD2L1 in gastric cancer was analyzed. The mRNA and protein expression levels were detected with the quantitative real-time PCR and Western blot analysis. The cell proliferation and cell cycle were also detected and analyzed.
Results: Bioinformatics analysis showed that MAD2L1 was highly expressed in tumor tissues compared with normal tissues. Compared with normal tissues, the miR-30a-3p was significantly decreased in the gastric cancer tissues. Moreover, MAD2L1 was significantly negatively correlated with the miR-30a-3p expression. Furthermore, over-expression of miR-30a-3p decreased the expression of MAD2L1 at the protein level, which inhibited the proliferation of AGS and BGC-823 gastric cancer cells. In addition, the cell cycles of AGS and BGC-823 cells were arrested at the G0/G1 phase.
Conclusion: MAD2L1 is a pro-oncogene which is up-regulated in gastric cancer. The miR-30a-3p can down-regulate the MAD2L1 expression, inhibiting the proliferation of gastric cancer cells and affect the cell cycle.
Keywords: gastric cancer, bioinformatics analysis, MAD2L1, miR-30a-3p, cell proliferation
Introduction
Gastric cancer is one of the common tumors in the digestive system. According to the statistics of cancer data worldwide in 2018, the death cases due to gastric cancer is as high as 782,000 per year.1 Gastric cancer is a malignant tumor originating from the gastric mucosa epithelium. The disease has a very high incidence of malignant tumors in China and poses a serious threat to the health of patients. Although the medical service has been continuously improved in recent years, the five-year survival rate of gastric cancer is still less than 30%.2 Therefore, it is of great clinical importance and significance to investigate the inactivation mutation of proto-oncogenes and tumor suppressor genes involved in the development of gastric cancer.
Mitotic arrest defective protein 2 (MAD2L1) is an important component of the mitotic checkpoint complex protein, and the MAD2L1 gene is located on chromosome 4 in human beings (chromosome 6 in mice). The miR-30a-5p is a member of the miR-30 family, with the length of 22 bp, which has been reported to regulate the tumor cells proliferation, apoptosis, invasion and migration in various cancers, including the hepatocellular carcinoma,3 glioma,4 breast cancer5 and colon cancer.6 Based on the big data screening of the key gene expression in gastric cancer cells, the cycle-related target gene MAD2L1 was selected. Accordingly, we speculate that the high expression of MAD2L1 might be caused by its targeted miRNA. Moreover, bioinformatics analysis showed that miR-30a-3p could bind to the 3ʹ-UTR of MAD2L1, and its decreased expression might be responsible for the increase expression of MAD2L1. Therefore, we hypothesize that MAD2L1 may be a target gene of miR-30a-3p, and miR-30a-3p may affect the function of gastric cancer cells by regulating the expression of MAD2L1.
In this study, with the bioinformatics analysis, a variety of cell biology research techniques were performed to identify the key genes in the development of gastric cancer. Based on our findings herein, the effects of miR-30a-3p on MAD2L1 and gastric cancer cell proliferation were investigated.
Materials and Methods
Bioinformatics Analysis
The data used in this study were derived from the Cancer Genome Atlas Database (TCGA), the Gene Expression Database (GEO), the Kyoto Gene and Genomic Encyclopedia Database (KEGG), and the Gene Ontology Database (GO). Differentially expressed genes were constructed on the Broad institute genomic services platform (https://software.broadinstitute.org/morpheus/). Signal to noise ratio was used as the scoring standard. The first 100 genes were screened to generate a heat map. To assess the interrelationship between differentially expressed genes, we mapped the differentially expressed genes to STRING (version 9.0) (https://string-db.org), and only experimentally validated interactions with a combined score>0.2 were defined as significant. In addition, the PPI network was constructed using Cytoscape software to further observe the correlation between genes. The plugin Molecular Complex Detection (MCODE) was used to screen the modules of PPI network in Cytoscape. The standard settings were as follows: MCODE score > 2, and number of nodes > 2. P < 0.05 was considered statistically significant.
Cell Lines and Cell Culture
Human gastric cancer cell lines AGS and BGC-823, and the HEK-293 model cells, were provided by the Biomedical Experiment Center of Xi’an Jiaotong University (China). The use of these cell lines was approved by Ethics Committee of Yan’an University College of Medicine. The AGS and BGC-823 human gastric cancer cells were cultured in the DMEM medium (PAA Laboratories, Pasching, Australia) containing 10% fetal bovine serum (FBS) and the 1640 medium (PAA Laboratories), in a 37°C, 5%CO2 incubator. The culture medium was changed once every 2–3 d. The AGS and BGC-823 cells in the logarithmic growth phase were collected and subjected to the following experiments.
Cell Transfection
The gastric cancer cells in the logarithmic growth was digested and inoculated onto the 6-well culture plate. When 60–80% confluence was reached, the desired transfected fragments (miR-30a-3p-mimics was purchased from GenePharma, Shanghai, China) were mixed and added into the corresponding wells, for further culture for 24–48 h.
Quantitative Real-Time PCR
RNA was extracted from gastric cancer cells using Trizol. The cDNA was obtained with the reverse-transcription using the commercially available kits, according to the manufacturer’s instructions. Quantitative real-time PCR was performed with the PrimeScriptTM RT Reagent kit (Takara Bio, Japan) on the iQ5 Optical real-time PCR System machine (Bio-Rad, USA). The following primer sequences were used for amplification: RT miR-30a-3p, 5ʹ-GTCGTATCCAGTGCGTGTCGTGGAGTCGGCAATTGCACTGGATACGACgctgcaa-3ʹ; RT U6 5ʹ-CGCTTCACGAATTTGCGTGTCAT-3ʹ; miR-30a-3p, forward 5ʹ-ATCCAGTGCGTGTCGTG-3ʹ and reverse 5ʹ-TGCTCTTTCAGTCGGATGT-3ʹ; U6, forward 5ʹ-GCTTCGGCAGCACATATACTAAAAT-3ʹ and reverse 5ʹ-CGCTTCACGAATTTGCGTGTCAT-3ʹ; MAD2L1, forward 5ʹ-GTTCTTCTCATTCGGCATCAACA-3ʹ and reverse 5ʹ-GAGTCCGTATTTCTGCACTCG-3ʹ; and GAPDH, forward 5ʹ-TGAAGGTCGGAGTCAACGGATT-3ʹ and reverse 5ʹ-CCTGGAAGATGGTGATGGGATT-3ʹ. The 20-μL PCR system consisted of 10-μL 2×RealStar Green Power Mixture, 1-μL Forward-primer (10 μM), 1-μL Reverse-primer (10 μM), 2-μL cDNA and 6-μL ddH2O. The amplification conditions were as follows: 95°C for 10 min; 95°C for 15 s, 60°C for 1 min, and 72°C for 30 s, for totally 40 cycles. Relative expression levels of the target genes were calculated with the 2−ΔCt method. GAPDH was used as internal reference.
Western Blot Analysis
Cells were harvested and lysed with lysis. Total protein concentration was determined with the BCA method. The protein samples were separated with 7.5–12.5% SDS-PAGE, and electronically transferred onto the PVDF membrane. The membrane was incubated with anti-β-actin, anti-MAD2L1 primary antibody (Sanying Biological Co., Ltd., Wuhan, Hubei, China), at 4°C overnight. The membrane was then incubated with TBST-conjugated secondary antibody (Sanying Biological Co., Ltd.) at room temperature for 1 h. Color development was performed with the chemiluminescence detection method, and protein bands were imaged and analyzed with the Q550CW software (Leica, Heidelberg, Germany). β-actin was used as internal reference.
MTT Assay
Cell proliferation was assessed with the MTT kit (Sigma, St Louis, MO, USA). The cells in the logarithmic growth phase were harvested and seeded onto the 96-well plate. At 24 h, 48 h, and 72 h after seeding, respectively, 10 μL MTT was added into each well to incubate the cells for 4 h. The well was added with 150 μL DMSO, and the absorbance at 490 nm was determined on a microplate reader.
Cloning Formation Detection
The transfected cells in the logarithmic growth phase were seeded onto the 6-well plate. After 2 w of culture, the cells were fixed with 4% paraformaldehyde, and stained with crystal violet. The stained cells were then observed, photographed, and counted.
Flow Cytometry
The transfected cells in the logarithmic growth phase were inoculated onto the 6-well plate, and cultured for 1 d. Cells were fixed in 70% ethanol for 24 h, which were then treated with PI and RNase within the kit. Cell cycle distribution was detected by flow cytometry.
Dual Luciferase Reporter Assay
The HEK-293 cells were divided into the miR-30a-3p and pmirGLO empty vector, miR-30a-3p and pmirGLO-MAD2L1-WT (GenePharma), miR-30a-3p and pmirGLO-MAD2L1-MuT (GenePharma) co-transfection groups, respectively. Cells without treatment were used as control. The MAD2L1 wild-type and mutant fragments were synthesized by Genechem, Shanghai, China, as follows: wild-type MAD2L1, up 5ʹ-cTATAGACATGCATGCTGAAAAATGTTTTTATTAGTATAATGc-3ʹ and down 5ʹ-tcgagCATTATACTAATAAAAACATTTTTCAGCATGCATGTCTATAgagct-3ʹ; and mutant MAD2L1, up 5ʹ-cTATAGAgAaGCATGgTcAtAtATGTTTTTATTAGTATAATGc-3ʹ and down 5ʹ-tcgagCATTATACTAATAAAAACATaTaTgAcCATGCtTcTCTATAgagct-3ʹ. These cells were inoculated onto the 96-well plates, and cultured for 24 h. The luciferase activity was detected by the microplate reader. Renilla was used as internal reference.
Statistical Analysis
The SPSS22.0 software was used for statistical analysis. Bioinformatics analysis was performed by the R language ggstatsplot package. Experimental data were processed by the GraphPad Prism7.0 software. Comparison was conducted with the Independent t-test. P<0.05 was considered as statistically significant.
Results
Bioinformatics Analysis of Key Genes in Gastric Cancer
First, the GEO database, including 22 gastric cancer samples and 8 normal gastritis epithelial samples, was used to analyze the differentially expressed genes in gastric cancer. The results showed that there were 876 differentially expressed genes in the normal sample and the tumor sample, including 423 up-regulated genes and 453 down-regulated genes (Supplementary Figure 1A). Then, the TCGA database, including 32 gastric cancer samples and 32 normal gastritis epithelial samples, was used. As shown in Supplementary Figure 1B, there were 904 differentially expressed genes in normal samples and tumor samples, including 438 up-regulated genes and 466 down-regulated genes. The Venn diagram was drawn with Venny2.1, and the differentially expressed genes obtained from the GEO database and the TCGA database were crossed to obtain 96 differentially expressed genes, including 62 up-regulated genes (Supplementary Figure 2A) and 34 down-regulated genes (Supplementary Figure 2B). These 96 differentially expressed genes were further analyzed to construct the PPI network (Supplementary Figure 3). By cluster analysis of the PPI network map using MCODE, 6 groups of genes were obtained (Supplementary Table 1). The first group of genes with the highest scores, including KIF11, NCAPD2, TOP2A, MCM3, MCM2, KIF23, and MAD2L1, was selected as the key genes of gastric cancer to be further investigated in this study.
Bioinformatics Prediction and Validation of Interaction Between MAD2L1 and miR-30a-3p
Based on the cluster analysis, MAD2L1, a cell cycle-associated gene, ranked the first and was selected for further analysis (Figure 1A and B). TCGA data showed that, compared with the normal control group, the expression level of MAD2L1 was significantly increased in the tumors (P< 0.001) (Figure 1C), which might be caused by decreased expression of its target miRNAs. Based on the linkedomics website, the miRNAs negatively correlated with MAD2L1 expression in gastric cancer were analyzed and studied (Figure 2A and B). In combination with the targetscan analysis, miR-30a-3p was selected and considered as the regulatory miRNA targeting on MAD2L1 (Figure 2C). Therefore, bioinformatics analysis was performed to further predict and investigate the relationship between miR-30a-3p and MAD2L1. The results from the TCGA data analysis showed that, compared with the normal control group, the expression level of miR-30a-3p in the gastric cancer tissue was significantly declined (Figure 3A), and the expression level of MAD2L1 was significantly negatively correlated with miR-30a-3p (Figure 3B).
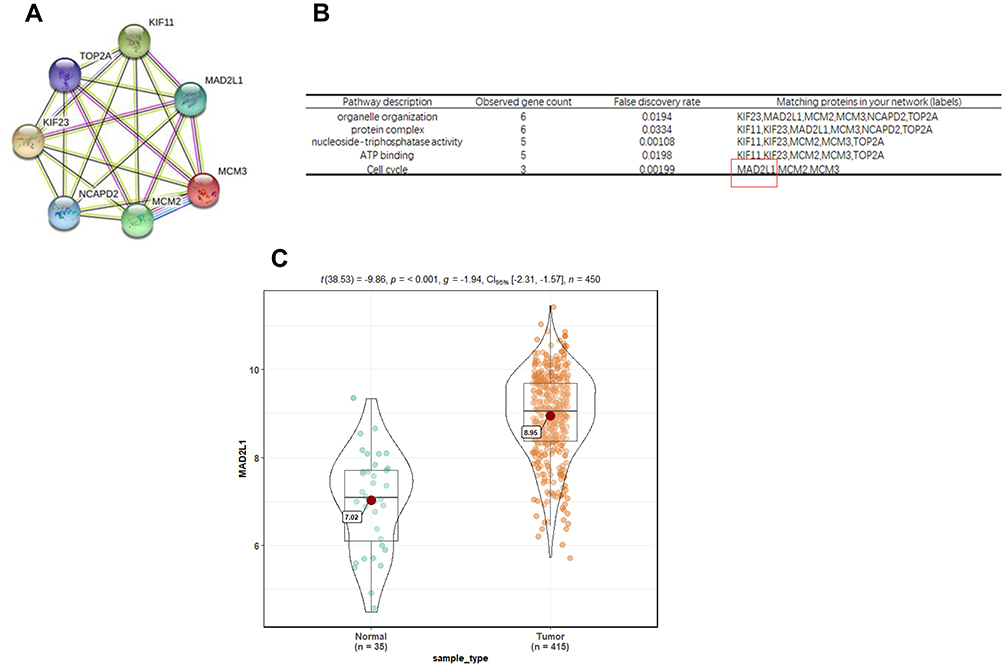 |
Figure 1 Bioinformatics prediction and screening of MAD2L1. (A and B) Cluster analysis of the cycle-related gene MAD2L1. (C) The MAD2L1 expression was signifificantly increased in tumors compared to normal tissues based on the TCGA database. |
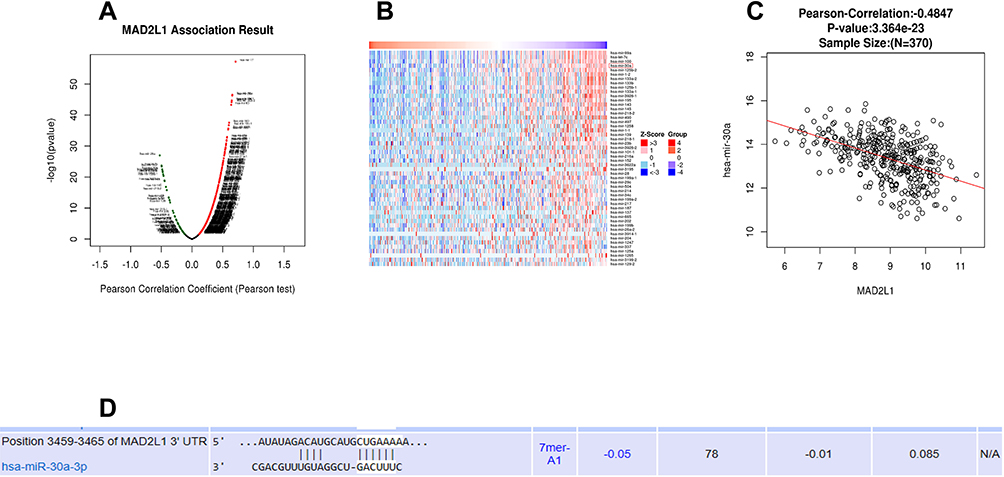 |
Figure 2 Bioinformatics prediction and screening of miR-30a-3p. (A and B) On the LinkedOmics website, miRNAs inversely associated with MAD2L1 expression in gastric cancer were analyzed. (C) Based on the targetscan analysis, miR-30a-3p was negatively correlated with MAD2L1. (D) The major site of miR-30a-3p binding to MAD2L1. |
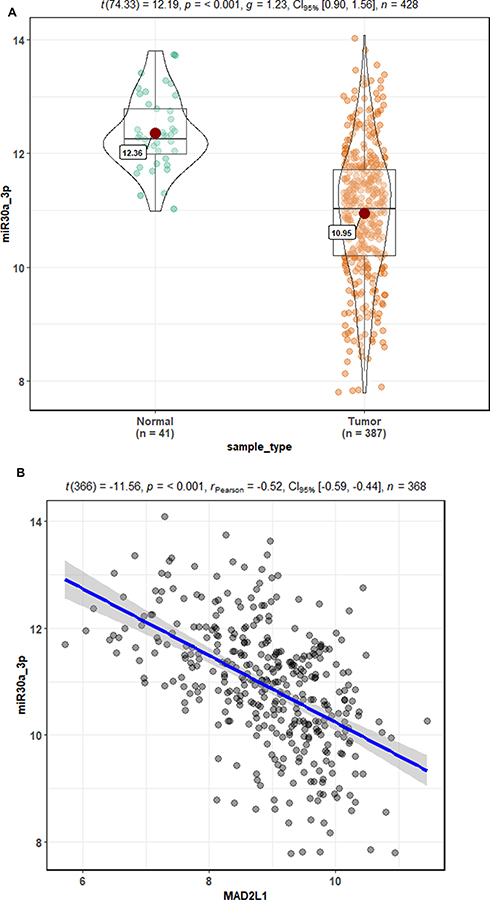 |
Figure 3 Bioinformatics prediction of relationship between miR-30a-3p and MAD2L1. (A) Based on the TCGA database, the miR-30a-3p expression was significantly decreased in gastric cancer tissues compared with normal tissues. (B) Based on the TCGA database, there was a significant negative correlation between MAD2L1 and miR-30a-3p. |
To valid the interaction between miR-30a-3p and MAD2L1, dual luciferase reporter assay was performed. Our results showed that, compared with the normal control group, the luciferase was significantly down-regulated in the wild-type MAD2L1 group (P<0.05), while no significant changes were observed in the mutant group (Figure 4). Taken together, these results suggest that, MAD2L1 is a direct target of miR-30a-3p.
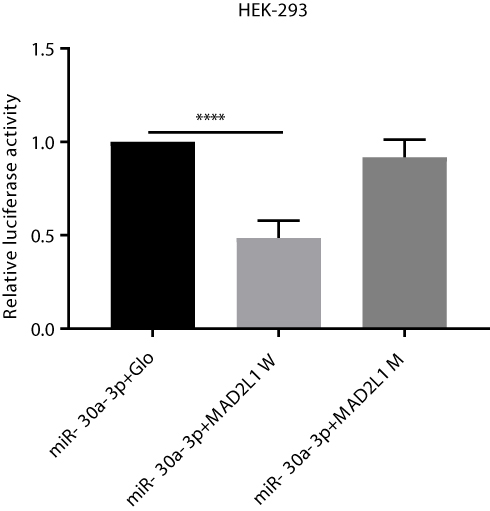 |
Figure 4 Dual luciferase reporter gene assay. HEK-293 cells were divided into the miR-30a-3p and pmirGLO empty vector (as control), miR-30a-3p and pmirGLO-MAD2L1-WT, miR-30a-3p and pmirGLO-MAD2L1-MuT co-transfection groups, respectively. These cells were inoculated onto the 96-well plates, and cultured for 24 h. The luciferase activity was detected by the microplate reader. Compared with the miR-30a-3p and pmirGLO empty vector group, the luciferase was significantly down-regulated in the wild-type MAD2L1 group, while no significant changes were observed in the mutant group. |
Effects of miR-30a-3p Over-Expression on MAD2L1 in AGS and BGC-823 Cells
To investigate the effects of miR-30a-3p on the expression of MAD2L1, the AGS and BGC-823 cells were transfected with miR-30a-3p, and the expression levels of MAD2L1 were detected. Our results from the quantitative real-time PCR indicated the significant over-expression of miR-30a-3p in the AGS and BGC-823 cells, compared with the normal control group (P<0.05) (Figure 5A and B). Moreover, our results from the Western blot analysis showed that, compared with the normal control group, the MAD2L1 protein expression levels were significantly reduced in both the AGS and BGC-823 cells over-expressed with miR-30a-3p (P<0.05) (Figure 5C and D).
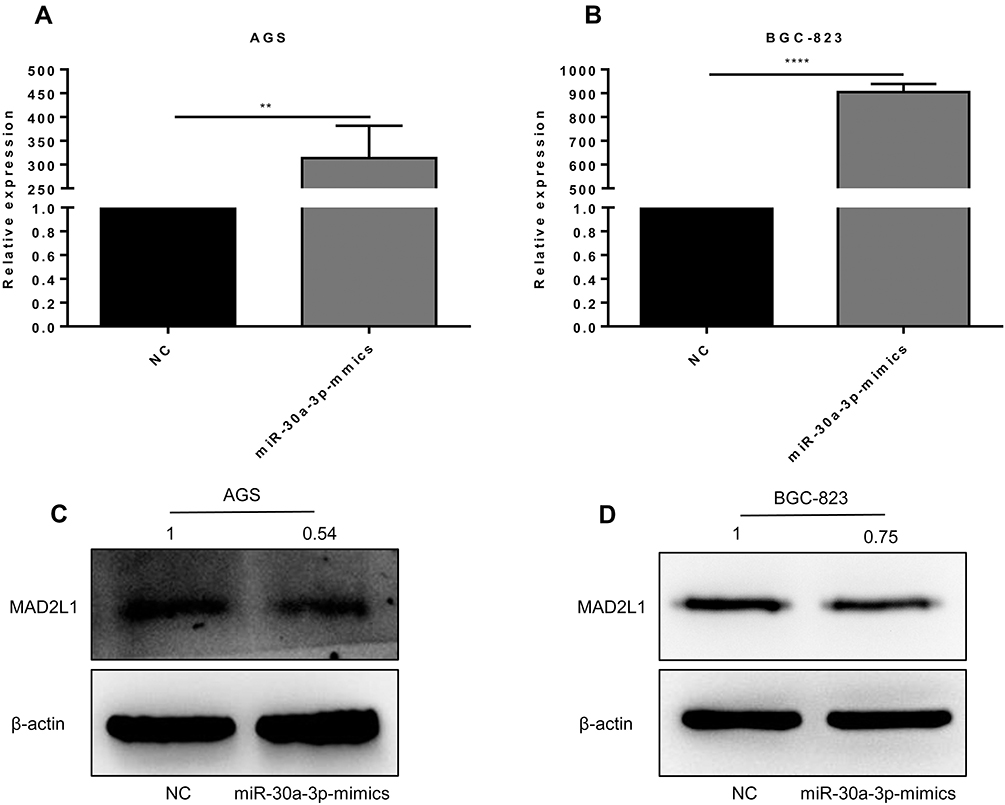 |
Figure 5 Effects of miR-30a-3p over-expression on MAD2L1 in AGS and BGC-823 cells. (A and B) The miR-30a-3p was over-expressed and detected in AGS (A) and BGC-823 (B) cells. (C and D) Expression levels of MAD2L1 in AGS (C) and BGC-823 (D) cells were detected with Western blot analysis. Compared with the control group, *P<0.05, **P<0.01. |
MAD2L1 was significantly decreased at the protein level compared with the control group after over-expression of miR-30a-3p in AGS and BGC-823 cells (Figure 5C and D, P<0.05). These results suggest that miR-30a-3p over-expression could down-regulate the MAD2L1 expression in gastric cancer cell lines.
Effects of miR-30a-3p Over-Expression on Proliferation and Cell Cycle of Gastric Cancer Cells
To investigate the effects of miR-30a-3p on the proliferation ability and cell cycle on AGS and BGC-823 cells, the MTT assay, clone formation assay, and flow cytometry were performed, respectively. Our results from the MTT and clone formation assays showed that, after the transfection of miR-30a-3p, the proliferation of AGS and BGC-823 cells was significantly declined (P<0.05) (Figure 6A–F). On the other hand, our results from the flow cytometry showed that, both the AGS and BGC-823 cells over-expressed with miR-30a-3p were arrested at the G0/G1 phase (P<0.05) (Figure 7A and B). Taken together, these results suggest that, the over-expression of miR-30a-3p would decline the proliferation and cause cell cycle arrest at the G0/G1 phase of the gastric cancer cells.
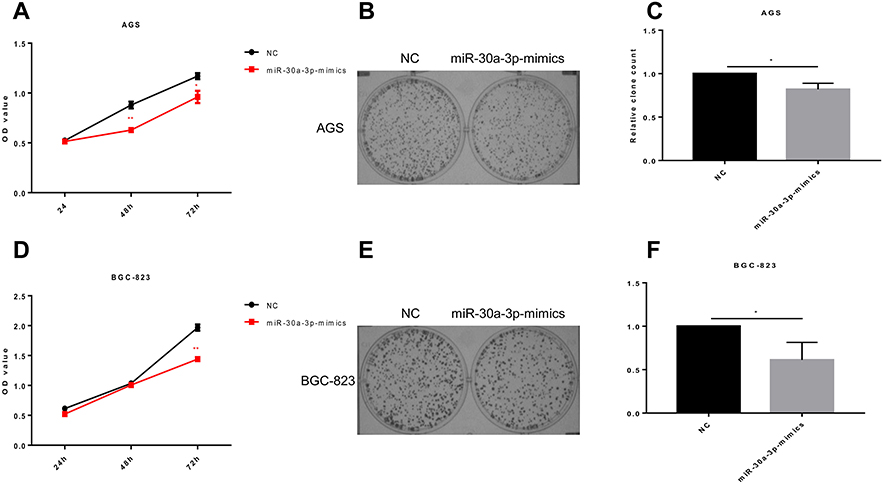 |
Figure 6 Effects of miR-30a-3p over-expression on proliferation of gastric cancer cells. (A). The miR-30a-3p was over-expressed in AGS cells, and the cell proliferation was assessed with the MTT assay. (B) Cloning formation assay of the AGS cells over-expressed with miR-30a-3p. (C) Histogram of miR-30a-3p overexpressed AGS cell cloning experiment. (D) The miR-30a-3p was over -expressed in BGC-823 cells, and the cell proliferation was assessed with the MTT assay.(E) Cloning formation assay of the BGC-823 cells over-expressed with miR-30a-3p. (F) histogram of miR-30a-3p overexpressed BGC-823 cell cloning experiment. Compared with the control group, *P<0.05, **P<0.01. |
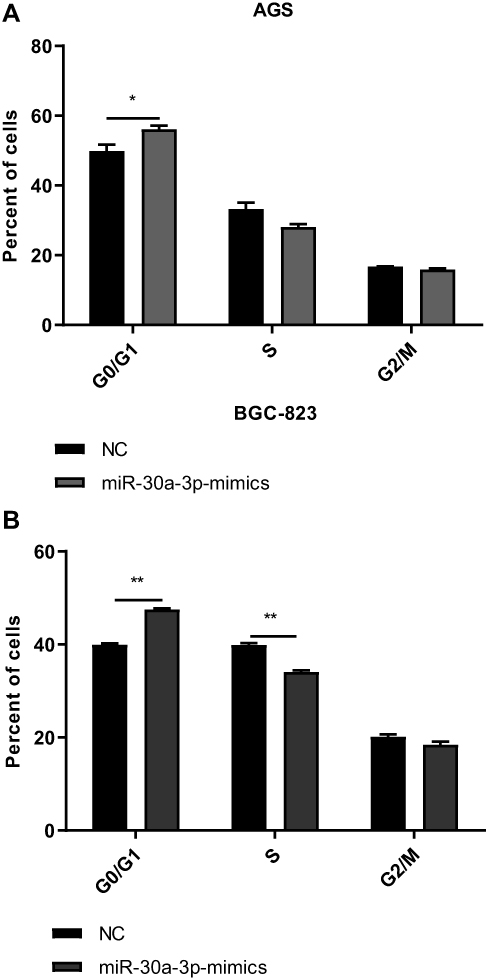 |
Figure 7 Effects of miR-30a-3p over-expression on cell cycle of gastric cancer cells. (A and B) The miR-30a-3p was over-expressed in AGS (A) and BGC-823 (B) cells, and the cell cycle was assessed. Compared with the control group, *P<0.05, **P<0.01. |
Effects of miR-30a-3p and MAD2L1 Simultaneous Over-Expression on Gastric Cancer Cells
Based on the above findings, the effects of miR-30a-3p and MAD2L1 simultaneous over-expression on the proliferation ability and cell cycle of gastric cancer cells were investigated. MTT showed that, compared with the normal control group, the proliferation abilities of both the AGS and BGC-823 cells in the miR-30a-3p-mimics+ctrl groups were significantly depressed, which were, however, enhanced in these two cell lines from the miR-30a-3p-mimics+ovMAD2L1 over-expression groups (P<0.05) (Figure 8A and B). On the other hand, our results from the cytometry showed that, compared with the normal control group, the cell proportions in the G0/G1 phase in the NC+ovMAD2L1 groups were significantly declined for both the AGS and BGC-823 cell lines, which were significantly elevated in the miR-30a-3p-mimics+ctrl groups (Figure 9A and B). However, no significant differences were observed in the G0/G1 cell proportions for the miR-30a-3p-mimics+ovMAD2L1 groups, for either of these two cell lines. Taken together, these results suggest that, MAD2L1 over-expression could encounter the effects of miR-30a-3p over-expression on the gastric cancer cells.
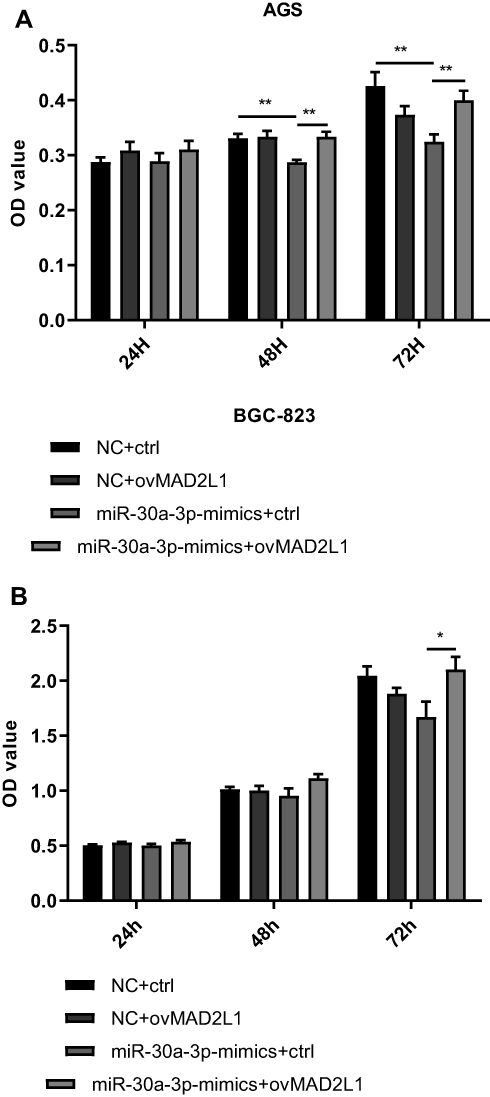 |
Figure 8 Effects of miR-30a-3p and MAD2L1 over-expression on proliferation of gastric cancer cells. (A and B) The miR-30a-3p and MAD2L1 were over-expressed in AGS (A) and BGC-823 (B) cells, and the cell proliferation was assessed with the MTT assay. Compared with the control group, *P<0.05, **P<0.01. |
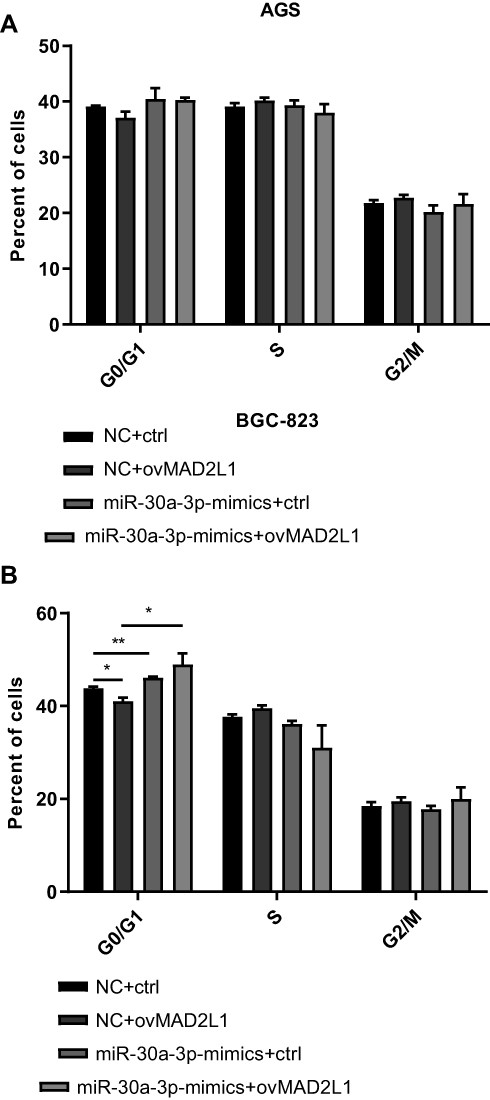 |
Figure 9 Effects of miR-30a-3p and MAD2L1 over-expression on cell cycle of gastric cancer cells. (A and B) The miR-30a-3p and MAD2L1 were over-expressed in AGS (A) and BGC-823 (B) cells, and the cell cycle was assessed. Compared with the control group, *P<0.05, **P<0.01. |
Discussion
Gastric cancer is one of the most common malignant tumors throughout the world, the mortality rate of which ranked the second place.7 Factors associated with gastric cancer development might include lacking nutrition, high salt and nitrate intake, low vitamin A and C diets, heavily smoking, food lacking refrigeration and drinking water with poor quality.8 Although the diagnosis and treatment of gastric cancer have made great progress, the disease prognosis is still poor, mainly due to the tumor cell metastasis, invasion and recurrence. Recently, studies have shown that a variety of genes and cellular pathways may be involved in the occurrence and development of gastric cancer. However, the limited knowledge of the exact molecular mechanisms underlying gastric cancer progression limits the treatment development of advanced gastric cancer. Therefore, deeper understanding the disease pathogenesis is essential for developing more effective diagnostic and therapeutic strategies of gastric cancers.
In this study, some target genes highly expressed in gastric cancer were screened based on the bioinformatics analysis, including the KIF11, NCAPD2, TOP2A, MCM3, MCM2, KIF23 and MAD2L1. KIF11 has been considered to be one of the pivotal genes with the highest connectivity. KIF11 is a conserved molecular regulator of cell growth and movement, which promotes the growth of refractory glioblastoma tumor-initiating cells and non-tumor initiating cells.9 Moreover, KIF11 could also accelerate the tumorigenesis and self-renewal of tumor-initiating cell populations.10 The localization of KIF11 in photoreceptor cells suggests the retinal ciliary disease.11 Progressive retinal degeneration of KIF11-associated retinopathy suggests that KIF11 play important roles not only in the eye development, but also in maintaining the retinal morphology and function.11 Moreover, for NCAPD2, it has been shown to be significantly associated with the risk of Parkinson’s disease (PD) in Chinese Han population and may serve as a potential genetic marker for the sporadic cases.12 The central granule proximal centrosome agglomerator affects the primary cilia formation, which is part of the DNA damage responses.13 For the gene of TOP2A, it has been reported to be involved in several molecular pathways in nasopharyngeal carcinoma, which can activate the carcinoma pathogenesis.14 Recent studies have suggested that TOP2A induces the malignant features of pancreatic cancer by activating the b-catenin signaling pathway.15 MCM3 is one of the microsomal maintenance proteins that initiate DNA replication in eukaryotes, as a part of pre-replication complex.16 It has been reported that MCM3 is mainly involved in cell proliferation and tumorigenesis.17 In addition, MCM3 may play a vital role in neuronal apoptosis.18 Studies have also shown that MCM3 mutations can impair the neuronal proliferation and memory function in Drosophila.19 Another gene, MCM2, is a cancer-proliferating biomarker that is a permissive factor initiating the DNA replication.20 MCM2 promotes the conformational changes and drives the DNA unfolding at the origin of DNA replication.21 MCM2 over-expression is associated with low survival rate of lung cancer patients, and MCM2 dysregulation can affect lung cancer cell proliferation, cell cycle and migration.22 Furthermore, KIF23 is a member of microtubule-dependent molecules transporting the organelles and chromosomes within cells during cell division.23 Moreover, KIF23 is highly expressed in a variety of human malignancies, such as the primary lung cancer24,25 and liver cancer.26 However, the biological function of KIF23 in gastric cancer remains unclear. In addition, MAD2L1 is an important component of the spindle assembly checkpoint protein, which significantly activates the protein structural regulation and leads to the susceptibility of chromophobe cells.27 In addition, MAD2L1 mutations prevent the proliferation of aneuploid cells by activating the p53 pathway, and trigger the early maturation of human primary fibroblasts.28 It has been reported that, in the early stage of mitosis, MAD1L1 can directly recruit MAD2L1 and mediate chromosome centromere separation, which is very important for the interaction between the MAD2L1 and the anaphase promoting complex regulator CDC20.29 The direct interaction of CDC20 with the MAD2L1 and MAD1L1 complexes could inhibit the complex activity in the late stage of mitosis, eventually leading to loss of adhesion of sister chromatids during the mid-to-late conversion.30,31 Current studies have shown that disrupted MAD2L1 function in the mammalian cells can affect the spindle checkpoint function, which in turn leads to cell aneuploidy or tumorigenesis. MAD2L1± cells are accompanied by chromosome instability (CIN), which ultimately leads to the formation of lung cancer in mice.32 Moreover, over-expression of MAD2L1 could also lead to chromosome instability, cellular aneuploidy and tumorigenesis,33 and the chromosomal instability is one of the major driving factors of tumorigenesis.34 At the same time, previous studies have shown that up-regulation or down-regulation of MAD2L1 expression levels might increase the probability of mitotic errors and affects the recurrence-free survival,35,36 which is consistent with our bioinformatics predictions.
MicroRNA (miRNA) is a group of small non-coding RNAs consisting of 17–26 nt that mediates the degradation of target mRNA by binding to the 3ʹ-untranslated sequence at the level of reverse transcription, thus inhibiting the expression of target genes.4,5 At present, it has been generally believed that miRNAs play important roles in regulating various biological processes, such as cell differentiation and migration.37–39 In recent years, a large number of studies have shown that the abnormal expression of miRNA is closely related to human cancer, which might be involved in and contribute to the tumor development, including the cell proliferation and migration, as the proto-oncogenes and tumor suppressor genes.40–42 Therefore, circulating miRNAs could be used as alternative biomarkers.43 Since one of the important functions of miRNA is to ensure the ideal target gene expression levels through subtle regulation of the gene expression. Therefore, miRNA may also be involved in the regulation of MAD2L1 expression level.44 Accordingly, the miRNAs negatively regulated to the expression of MAD2L1 in gastric cancer were analyzed by the bioinformatics analysis, with the targetscan analysis. The screening leads to the identification of miR-30a-3p. Moreover, it has been confirmed by the experiments that miR-30a-3p is the key miRNA regulating the expression of MAD2L1, in line with the results from the bioinformatics analysis. Based on these findings, miR-30a-3p inhibits the proliferation of gastric cancer cells by targeting on MAD2L1. After over-expression of miR-30a-3p, the MAD2L1 expression was down-regulated at the protein levels compared with the control group, while the proliferation abilities of AGS and BGC-823 cells were decreased, and cells were arrested in the G0/G1 phase. These results suggest that miR-30a-3p might have an inhibitory effect on the development of gastric cancer. Moreover, it has been shown that miR-30a-3p can exert anti-cancer effects by targeting on both COX-2 and BCL9, which significantly affects the development of gastric cancer induced by Helicobacter pylori, providing new insights to better understand the mechanism underlying the disease development.45 Similarly, miR-944,46 miR-139,47 miR-511b48 and miR-143-3p49,50 have also been shown to be the inhibiting factors of the malignant behavior of gastric cancer. It has been also shown that MAD2L1 exerts function as a cancer-promoting factor in the gastric cancer. Moreover, miR-30a-3p acts as a tumor suppressor by regulating the MAD2L1 level in the AGS and BGC-823 cells, inhibiting the growth of tumor cells and affecting abnormal mitosis (causing cell cycle arrest in the G0/G1 phase). These findings were in line with the above bioinformatics analysis. The results of rescue experiments showed that, after over-expression of miR-30a-3p together with MAD2L1, the AGS and BGC-823 cells exhibited increased proliferation abilities, with no alterations concerning the cell cycle, suggesting that the miR-30a-3p directly targets on and inhibits the expression of MAD2L1, further inhibiting the proliferation and growth of the AGS and BGC-823 cells. However, this study still has certain limitations. For example, miR-30a-3p may not be the only factor regulating the expression levels of MAD2L1. In fact, it has been reported that both miR-433-3p and miR-28-5p target on the MAD2L1 mRNAs.51
Conclusion
In conclusion, our results from the bioinformatics analysis and experiments showed that MAD2L1 was a pro-oncogene up-regulated in the pathogenesis of gastric cancer. Moreover, miR-30a-3p down-regulated the expression level of MAD2L1, inhibited the proliferation of gastric cancer cells, and affected the cell cycle. These findings have certain diagnostic value for the clinical guidance of the treatment for gastric cancer.
Abbreviation
MAD2L1, mitotic arrest deficient 2 like 1.
Data Sharing Statement
The datasets used and/or analysed during the current study are available from the corresponding author on reasonable request.
Author Contributions
All authors contributed to data analysis, drafting or revising the article, gave final approval of the version, and are accountable for all aspects of the work.
Disclosure
The authors report no conflicts of interest in this work.
References
1. Bray F, Ferlay J, Soerjomataram I, Siegel RL, Torre LA, Jemal A. Global cancer statistics 2018: GLOBOCAN estimates of incidence and mortality worldwide for 36 cancers in 185 countries. CA Cancer J Clin. 2018;68(6):394–424. doi:10.3322/caac.21492
2. Van Cutsem E, Sagaert X, Topal B, Haustermans K, Prenen H. Gastric cancer. Lancet. 2016;388(10060):2654–2664. doi:10.1016/S0140-6736(16)30354-3
3. He R, Yang L, Lin X, et al. MiR-30a-5p suppresses cell growth and enhances apoptosis of hepatocellular carcinoma cells via targeting AEG-1. Int J Clin Exp Pathol. 2015;8(12):15632–15641.
4. Jia Z, Wang K, Wang G, Zhang A, Pu P. MiR-30a-5p antisense oligonucleotide suppresses glioma cell growth by targeting SEPT7. PLoS One. 2013;8(1):e55008. doi:10.1371/journal.pone.0055008
5. Li WT, Liu CL, Zhao CL, Zhai LM, Lv SJ. Downregulation of β3 integrin by miR-30a-5p modulates cell adhesion and invasion by interrupting Erk/Ets-1 network in triple-negative breast cancer. Int J Oncol. 2016;48(3):151–159. doi:10.3892/ijo.2016.3319
6. Baraniskin A, Birkenkamp-Demtroder K, Maghnouj A, et al. MiR-30a-5p suppresses tumor growth in colon carcinoma by targeting DTL. Carcinogenesis. 2012;33(4):732–739. doi:10.1093/carcin/bgs020
7. Siegel RL, Miller KD, Jemal A. Cancer statistics, 2016. CA Cancer J Clin. 2016;66(1):7–30. doi:10.3322/caac.21332
8. Liu C, Russell RM. Nutrition and gastric cancer risk: an update. Nutr Rev. 2008;66(5):237–249. doi:10.1111/j.1753-4887.2008.00029.x
9. Valensin S, Ghiron C, Lamanna C, et al. KIF11 inhibition for glioblastoma treatment: reason to hope or a struggle with the brain? BMC Cancer. 2009;9:196. doi:10.1186/1471-2407-9-196
10. Venere M, Horbinski C, Crish JF, et al. The mitotic kinesin KIF11 is a driver of invasion, proliferation, and self-renewal in glioblastoma. Sci Transl Med. 2015;7(304):304ra143. doi:10.1126/scitranslmed.aac6762
11. Birtel J, Gliem M, Mangold E, et al. Novel insights into the phenotypical spectrum of KIF11-associated retinopathy, including a new form of retinal ciliopathy. Invest Ophthalmol Vis Sci. 2017;58(10):3950. doi:10.1167/iovs.17-21679
12. Zhang P, Liu L, Huang J, et al. Non-SMC condensin I complex, subunit D2 gene polymorphisms are associated with Parkinson’s disease: a Han Chinese study. Genome. 2014;57(5):253–257. doi:10.1139/gen-2014-0032
13. Conroy PC, Saladino C, Dantas TJ, Lalor P, Dockery P, Morrison CG. C-NAP1 and rootletin restrain DNA damage-induced centriole splitting and facilitate ciliogenesis. Cell Cycle. 2012;11(20):3769–3778. doi:10.4161/cc.21986
14. Chen F, Shen C, Wang X, et al. Identification of genes and pathways in nasopharyngeal carcinoma by bioinformatics analysis. Oncotarget. 2017;8(38):63738–63749. doi:10.18632/oncotarget.19478
15. Pei YF, Yin XM, Liu XQ. TOP2A induces malignant character of pancreatic cancer through activating beta-catenin signaling pathway. Biochim Biophys Acta Mol Basis Dis. 2018;1864(1):197–207. doi:10.1016/j.bbadis.2017.10.019
16. Whitebread LA, Dalton S. Cdc54 belongs to the Cdc46/Mcm3 family of proteins which are essential for initiation of eukaryotic DNA replication. Gene. 1995;155(1):113–117. doi:10.1016/0378-1119(94)00925-I
17. Nowinska K, Dziegiel P. The role of MCM proteins in cell proliferation and tumorigenesis. Postepy Hig Med Dosw (Online). 2010;64:627–635.
18. Ji W, Liu H, Liu C, et al. Up-regulation of MCM3 relates to neuronal apoptosis after traumatic brain injury in adult rats. Cell Mol Neurobiol. 2017;37(4):683–693. doi:10.1007/s10571-016-0404-x
19. Blumroder R, Glunz A, Dunkelberger BS, et al. Mcm3 replicative helicase mutation impairs neuroblast proliferation and memory in Drosophila. Genes Brain Behav. 2016;15(7):647–659. doi:10.1111/gbb.2016.15.issue-7
20. Tsuji T, Ficarro SB, Jiang W. Essential role of phosphorylation of MCM2 by Cdc7/Dbf4 in the initiation of DNA replication in mammalian cells. Mol Biol Cell. 2006;17(10):4459–4472. doi:10.1091/mbc.e06-03-0241
21. Evrin C, Clarke P, Zech J, et al. A double-hexameric MCM2-7 complex is loaded onto origin DNA during licensing of eukaryotic DNA replication. Proc Natl Acad Sci U. S. A. 2009;106(48):20240–20245. doi:10.1073/pnas.0911500106
22. Cheung CHY, Hsu CL, Chen KP, et al. MCM2-regulated functional networks in lung cancer by multi-dimensional proteomic approach. Sci Rep. 2017;7(1):13302. doi:10.1038/s41598-017-13440-x
23. Wang L, Wei B, Hu G, Wang L, Jin Y, Sun Z. Gene expression analyses to explore the biomarkers and therapeutic targets for gliomas. Neurol Sci. 2015;36(3):403–409. doi:10.1007/s10072-014-1985-0
24. Kato T, Lee D, Wu L, et al. Kinesin family members KIF11 and KIF23 as potential therapeutic targets in malignant pleural mesothelioma. Int J Oncol. 2016;49(2):448–456. doi:10.3892/ijo.2016.3566
25. Kato T, Wada H, Patel P, et al. Overexpression of KIF23 predicts clinical outcome in primary lung cancer patients. Lung Cancer. 2016;92:53–61. doi:10.1016/j.lungcan.2015.11.018
26. Sun X, Jin Z, Song X, et al. Evaluation of KIF23 variant 1 expression and relevance as a novel prognostic factor in patients with hepatocellular carcinoma. BMC Cancer. 2015;15:961. doi:10.1186/s12885-015-1987-1
27. Zhong R, Chen X, Chen X, et al. MAD1L1 Arg558His and MAD2L1 Leu84Met interaction with smoking increase the risk of colorectal cancer. Sci Rep. 2015;5:12202. doi:10.1038/srep12202
28. Lentini L, Barra V, Schillaci T, Di Leonardo A. MAD2 depletion triggers premature cellular senescence in human primary fibroblasts by activating a p53 pathway preventing aneuploid cells propagation. J Cell Physiol. 2012;227(9):3324–3332. doi:10.1002/jcp.24030
29. Chung E, Chen RH. Spindle checkpoint requires Mad1-bound and Mad1-free Mad2. Mol Biol Cell. 2002;13(5):1501–1511. doi:10.1091/mbc.02-01-0003
30. Pfleger CM, Salic A, Lee E, Kirschner MW. Inhibition of Cdh1-APC by the MAD2-related protein MAD2L2: a novel mechanism for regulating Cdh1. Genes Dev. 2001;15(14):1759–1764. doi:10.1101/gad.897901
31. Zhang Y, Lees E. Identification of an overlapping binding domain on Cdc20 for Mad2 and anaphase-promoting complex: model for spindle checkpoint regulation. Mol Cell Biol. 2001;21(15):5190–5199. doi:10.1128/MCB.21.15.5190-5199.2001
32. Michel L, Diaz-Rodriguez E, Narayan G, Hernando E, Murty VV, Benezra R. Complete loss of the tumor suppressor MAD2 causes premature cyclin B degradation and mitotic failure in human somatic cells. Proc Natl Acad Sci U. S. A. 2004;101(13):4459–4464. doi:10.1073/pnas.0306069101
33. Sotillo R, Hernando E, Diaz-Rodriguez E, et al. Mad2 overexpression promotes aneuploidy and tumorigenesis in mice. Cancer Cell. 2007;11(1):9–23. doi:10.1016/j.ccr.2006.10.019
34. Michor F. Chromosomal instability and human cancer. Philos Trans R Soc Lond B Biol Sci. 2005;360(1455):631–635. doi:10.1098/rstb.2004.1617
35. Dobles M, Liberal V, Scott ML, Benezra R, Sorger PK. Chromosome missegregation and apoptosis in mice lacking the mitotic checkpoint protein Mad2. Cell. 2000;101(6):635–645. doi:10.1016/S0092-8674(00)80875-2
36. Michel LS, Liberal V, Chatterjee A, et al. MAD2 haplo-insufficiency causes premature anaphase and chromosome instability in mammalian cells. Nature. 2001;409(6818):355–359. doi:10.1038/35053094
37. Bartel DP. MicroRNAs: genomics, biogenesis, mechanism, and function. Cell. 2004;116(2):281–297. doi:10.1016/S0092-8674(04)00045-5
38. Brennecke J, David RH, Alexander S, Robert BR, Stephen MC. Bantam encodes a developmentally regulated microRNA that controls cell proliferation and regulates the proapoptotic gene hid in drosophila. Cell. 2003;113(1):25–36. doi:10.1016/S0092-8674(03)00231-9
39. Lau NC, Lim LP, Weinstein EG, Bartel DP. An abundant class of tiny RNAs with probable regulatory roles in Caenorhabditis elegans. Science. 2001;294(5543):858–862. doi:10.1126/science.1065062
40. Ding W, Dang H, You H, et al. miR-200b restoration and DNA methyltransferase inhibitor block lung metastasis of mesenchymal-phenotype hepatocellular carcinoma. Oncogenesis. 2012;1:e15. doi:10.1038/oncsis.2012.15
41. Liu M, Liu J, Wang L, et al. Association of serum microRNA expression in hepatocellular carcinomas treated with transarterial chemoembolization and patient survival. PLoS One. 2014;9(10):e109347. doi:10.1371/journal.pone.0109347
42. Wu WR, Sun H, Zhang R, et al. Methylation-associated silencing of miR-200b facilitates human hepatocellular carcinoma progression by directly targeting BMI1. Oncotarget. 2016;7(14):18684–18693. doi:10.18632/oncotarget.7629
43. Wang Y, Gao Y, Shi W, et al. Profiles of differential expression of circulating microRNAs in hepatitis B virus-positive small hepatocellular carcinoma. Cancer Biomark. 2015;15(2):171–180. doi:10.3233/CBM-140451
44. Heinrich S, Geissen EM, Kamenz J, et al. Determinants of robustness in spindle assembly checkpoint signalling. Nat Cell Biol. 2013;15(11):1328–1339. doi:10.1038/ncb2864
45. Liu X, Ji Q, Zhang C, et al. miR-30a acts as a tumor suppressor by double-targeting COX-2 and BCL9 in H. pylori gastric cancer models. Sci Rep. 2017;7(1):7113. doi:10.1038/s41598-017-07193-w
46. Pan T, Chen W, Yuan X, Shen J, Qin C, Wang L. miR-944 inhibits metastasis of gastric cancer by preventing the epithelial-mesenchymal transition via MACC1/Met/AKT signaling. FEBS Open Bio. 2017;7(7):905–914. doi:10.1002/feb4.2017.7.issue-7
47. Zhang Y, Shen WL, Shi ML, et al. Involvement of aberrant miR-139/Jun feedback loop in human gastric cancer. Biochim Biophys Acta. 2015;1853(2):481–488. doi:10.1016/j.bbamcr.2014.12.002
48. Wei Z, Liu Y, Wang Y, et al. Downregulation of Foxo3 and TRIM31 by miR-551b in side population promotes cell proliferation, invasion, and drug resistance of ovarian cancer. Med Oncol. 2016;33(11):126. doi:10.1007/s12032-016-0842-9
49. Huang SJ, Zhu YF, Liu Z, Li QF, Li ZY, Fu WR. Study of miR-143 expression in stomach cancer. Oncol Lett. 2018;16(4):4367–4371. doi:10.3892/ol.2018.9173
50. Lei C, Du F, Sun L, et al. miR-143 and miR-145 inhibit gastric cancer cell migration and metastasis by suppressing MYO6. Cell Death Dis. 2017;8(10):e3101. doi:10.1038/cddis.2017.493
51. Hell MP, Thoma CR, Fankhauser N, Christinat Y, Weber TC, Krek W. miR-28-5p promotes chromosomal instability in VHL-associated cancers by inhibiting Mad2 translation. Cancer Res. 2014;74(9):2432–2443. doi:10.1158/0008-5472.CAN-13-2041
 © 2019 The Author(s). This work is published and licensed by Dove Medical Press Limited. The full terms of this license are available at https://www.dovepress.com/terms.php and incorporate the Creative Commons Attribution - Non Commercial (unported, v3.0) License.
By accessing the work you hereby accept the Terms. Non-commercial uses of the work are permitted without any further permission from Dove Medical Press Limited, provided the work is properly attributed. For permission for commercial use of this work, please see paragraphs 4.2 and 5 of our Terms.
© 2019 The Author(s). This work is published and licensed by Dove Medical Press Limited. The full terms of this license are available at https://www.dovepress.com/terms.php and incorporate the Creative Commons Attribution - Non Commercial (unported, v3.0) License.
By accessing the work you hereby accept the Terms. Non-commercial uses of the work are permitted without any further permission from Dove Medical Press Limited, provided the work is properly attributed. For permission for commercial use of this work, please see paragraphs 4.2 and 5 of our Terms.