")
Back to Journals » Journal of Hepatocellular Carcinoma » Volume 7
miR-3 Encoded by Hepatitis B Virus Downregulates PTEN Protein Expression and Promotes Cell Proliferation
Authors Tang J, Xiao XQ, Jiang Y, Tian Y, Peng Z, Yang M, Xu Z , Gong G
Received 14 July 2020
Accepted for publication 15 October 2020
Published 29 October 2020 Volume 2020:7 Pages 257—269
DOI https://doi.org/10.2147/JHC.S271091
Checked for plagiarism Yes
Review by Single anonymous peer review
Peer reviewer comments 4
Editor who approved publication: Dr Ahmed Kaseb
Jian Tang,1 Xinqiang Xiao,1 Yongfang Jiang,1 Yi Tian,1 Zhongtian Peng,2 Meichan Yang,1 Zhenyu Xu,1 Guozhong Gong1
1The Department of Infectious Disease, The Second Xiangya Hospital of Central South University, Changsha, People’s Republic of China; 2The Department of Infectious Disease, The First Affiliated Hospital of South China University, Henyang, People’s Republic of China
Correspondence: Guozhong Gong
The Department of Infectious Disease, The Second Xiangya Hospital of Central South University, Changsha, People’s Republic of China
Tel +86-731-85292105
Fax +86-731-85292173
Email [email protected]
Purpose: Chronic hepatitis B virus (HBV) infection is a key determinant of hepatocellular carcinoma (HCC). However, the mechanism by which HBV contributes to the development of HCC remains to be further explored. HBV-encoded miR-3 (HBV-miR-3) is a newly discovered microRNA that can affect the replication of HBV, but its influence on host genes is unclear. The tumor suppressor phosphatase and tensin homolog (PTEN) is expressed at low levels in most cancer cells. How HBV-miR-3 acts on PTEN to induce tumorigenesis has not been clarified.
Materials and Methods: PTEN protein expression was evaluated in HBV-miR-3-transfected cells and HBV-related liver cancer and paracancerous tissues. A luciferase reporter assay was employed to identify the HBV-miR-3 binding site on the 3ʹ-untranslated region (3ʹ-UTR) of PTEN. Cell apoptosis was assessed by flow cytometry. Cell proliferation was evaluated by colony formation assays. Transwell assays were used to detect cancer cell invasion.
Results: HBV-miR-3 was identified only in HBV-replicating HCC cells and HBV-infected patients. HBV-miR-3 expression in liver cancer tissues was higher than that in paracancerous tissues, and the corresponding PTEN expression was significantly decreased. Wild-type HBV-miR-3 bound to the 3ʹ-UTR of PTEN and downregulated its protein expression in a dose-dependent manner. Moreover, the inhibition of HBV-miR-3 rescued PTEN protein expression. Furthermore, HBV-miR-3 reduced liver cancer cell apoptosis, enhanced cell invasion, and promoted cell proliferation.
Conclusion: HBV-miR-3 binds to the 3ʹ-UTR of PTEN mRNA and downregulates PTEN protein expression, thereby reducing cell apoptosis and enhancing cell invasion and proliferation. These results indicate that HBV-miR-3 contributes to the development of HBV-related HCC and may be a therapeutic target for this cancer.
Keywords: apoptosis, hepatitis B virus, hepatocellular carcinoma, microRNA, PTEN
Introduction
Liver cancer is the sixth most commonly diagnosed cancer and was the fourth leading cause of cancer-related deaths worldwide in 2018.1 In 2018, approximately 841,000 new liver cancer cases were diagnosed, and as many as 782,000 deaths were attributed to liver cancer.2 Although the incidence and mortality rates of cancer have been declining overall, the number of new liver cancer cases and liver cancer-associated deaths continue to increase.3 Hepatocellular carcinoma (HCC) is the most common type of liver cancer and occurs frequently in patients with chronic liver diseases, such as chronic hepatitis B (CHB) and chronic hepatitis C (CHC), and also due to aflatoxin-contaminated foodstuffs, heavy alcohol intake, obesity, smoking, and type 2 diabetes.2 In high-risk areas, such as China and East Africa, the key determinant for HCC is chronic infection with the hepatitis B virus (HBV), while China alone accounts for half of all global HCC cases.2 The association between HBV infection and HCC has been well described; however, the mechanism by which HBV contributes to the development of HCC remains unclear.
MicroRNAs (miRNAs) are endogenous RNAs 22 nt in size that play important regulatory roles in a variety of cellular processes in animals and plants by targeting mRNAs for cleavage or translational repression.4 Across the animal kingdom, thousands of miRNAs are present, most of which are systemically conserved and are involved in cell death, apoptosis, proliferation, and other processes.5
Similar to their host cells, many DNA and RNA viruses encode miRNAs, which are believed to downregulate the protein expression of viral or host cells.6 The virus-encoded miRNA can evade host immune attack by affecting the host cell’s immune system. For example, human cytomegalovirus (HCMV)-encoded miR-ul112 can downregulate MICB,7 IL-32,8 and type I interferon9 in host cells and thus, escape the attack of host lymphocytes. For many oncogenic viruses, miRNAs contribute significantly to virally induced gene expression programs that are critical for host cell growth and survival.6 For example, Kaposi’s sarcoma-associated herpesvirus (KSHV), which encodes miR-K1, derepresses p21 expression and enhances cell cycle arrest following the activation of p53.10 HBV encoded HBV-miR-2, promotes oncogenic activity by downregulating tripartite motif containing 35 (TRIM35) expression and upregulating Ras-related nuclear protein (RAN) expression in liver cancer cells, likely providing insight into tumorigenesis in HBV-related liver cancer.11 Other miRNAs play important regulatory roles in virus replication. For example, the HBV genome encodes a miRNA, HBV-miR-3, which controls viral replication by suppressing HBV transcript production (HBsAg and HBeAg) resulting in the suppressing of replication of HBV.12 Further, HBV-miR-3 activates the JAK/STAT signaling pathway by downregulating SOCS5 in hepatocytes, thereby enhancing the IFN-induced anti-HBV effects.13
Phosphatase and tensin homolog (PTEN), encoded in humans by the PTEN gene (10q23.31), is a phosphatase that was first identified as a tumor suppressor gene in 1997.14 Mutations and deletions in PTEN and the dysregulation of PTEN expression have been implicated in gliomas, prostate cancer, endometrial cancer, and HCC.14,15 Furthermore, low PTEN expression is associated with a large tumor size, tumor microsatellite formation, and the short overall survival of HCC patients.15 Tumor suppression by PTEN relies on its phosphatase activity and subsequent antagonism of the PI3K/AKT pathway.16 Several transcriptional factors have been reported to control the transcription of PTEN, including the tumor suppressors p5317 and TGF-β.18 Many miRNAs, including miR-21, miR-130, and miR-301a, have also been reported to regulate PTEN expression.19 More interesting is PTEN can also be regulated by virus-encoded miRNA. For example Epstein-Barr viral (EBV) encoded EBV-miR-BART7-3p has been shown to enhance the migration/invasion and cancer metastasis of nasal pharyngeal cancer cells by targeting PTEN.20 A recent report showed that HBV-encoded X antigen (HBxAg) can downregulate PTEN transcript levels by stimulating miR-181a expression.21 There is also a study indicating that HBV infection exacerbates PTEN defects in HCC through the upregulation of miR-181a/362/382/19a.22 In this study, we determined that HBV-miR-3 also downregulates PTEN expression, and thereby inhibits apoptosis and increases HCC invasion. It may be a new element involved in HBV-induced carcinoma.
Materials and Methods
Human Serum from Healthy Controls and Patients with HCV, EBV, HSV, and HBV Infections
Serum samples from 40 healthy controls, 20 patients with CHC infection, 10 patients with EBV infection, 10 patients with HCMV infection, 10 patients with HSV infection,and 20 patients with CHB infection were obtained from the Department of Infectious Disease of The Second Xiangya Hospital. Ethics approval for the work was granted by the Ethics Committee of The Second Xiangya Hospital. The demographic and clinical characteristics of the enrolled patients and healthy subjects are shown in Supplement Table S1.
Human Hepatoma Tissue Specimens from Patients with HBV Infection
Twenty-three pairs of HBV-related liver cancer tissues and paracancerous tissues were obtained from the Liver Surgery Department of The Second Xiangya Hospital. Ethics approval for the work was granted by the Ethics Committee of The Second Xiangya Hospital. These tissues were collected following surgical resection and stored immediately at −80°C until RNA and protein extraction could be performed. The demographic and clinical characteristics of the enrolled patients are shown in Table 1.
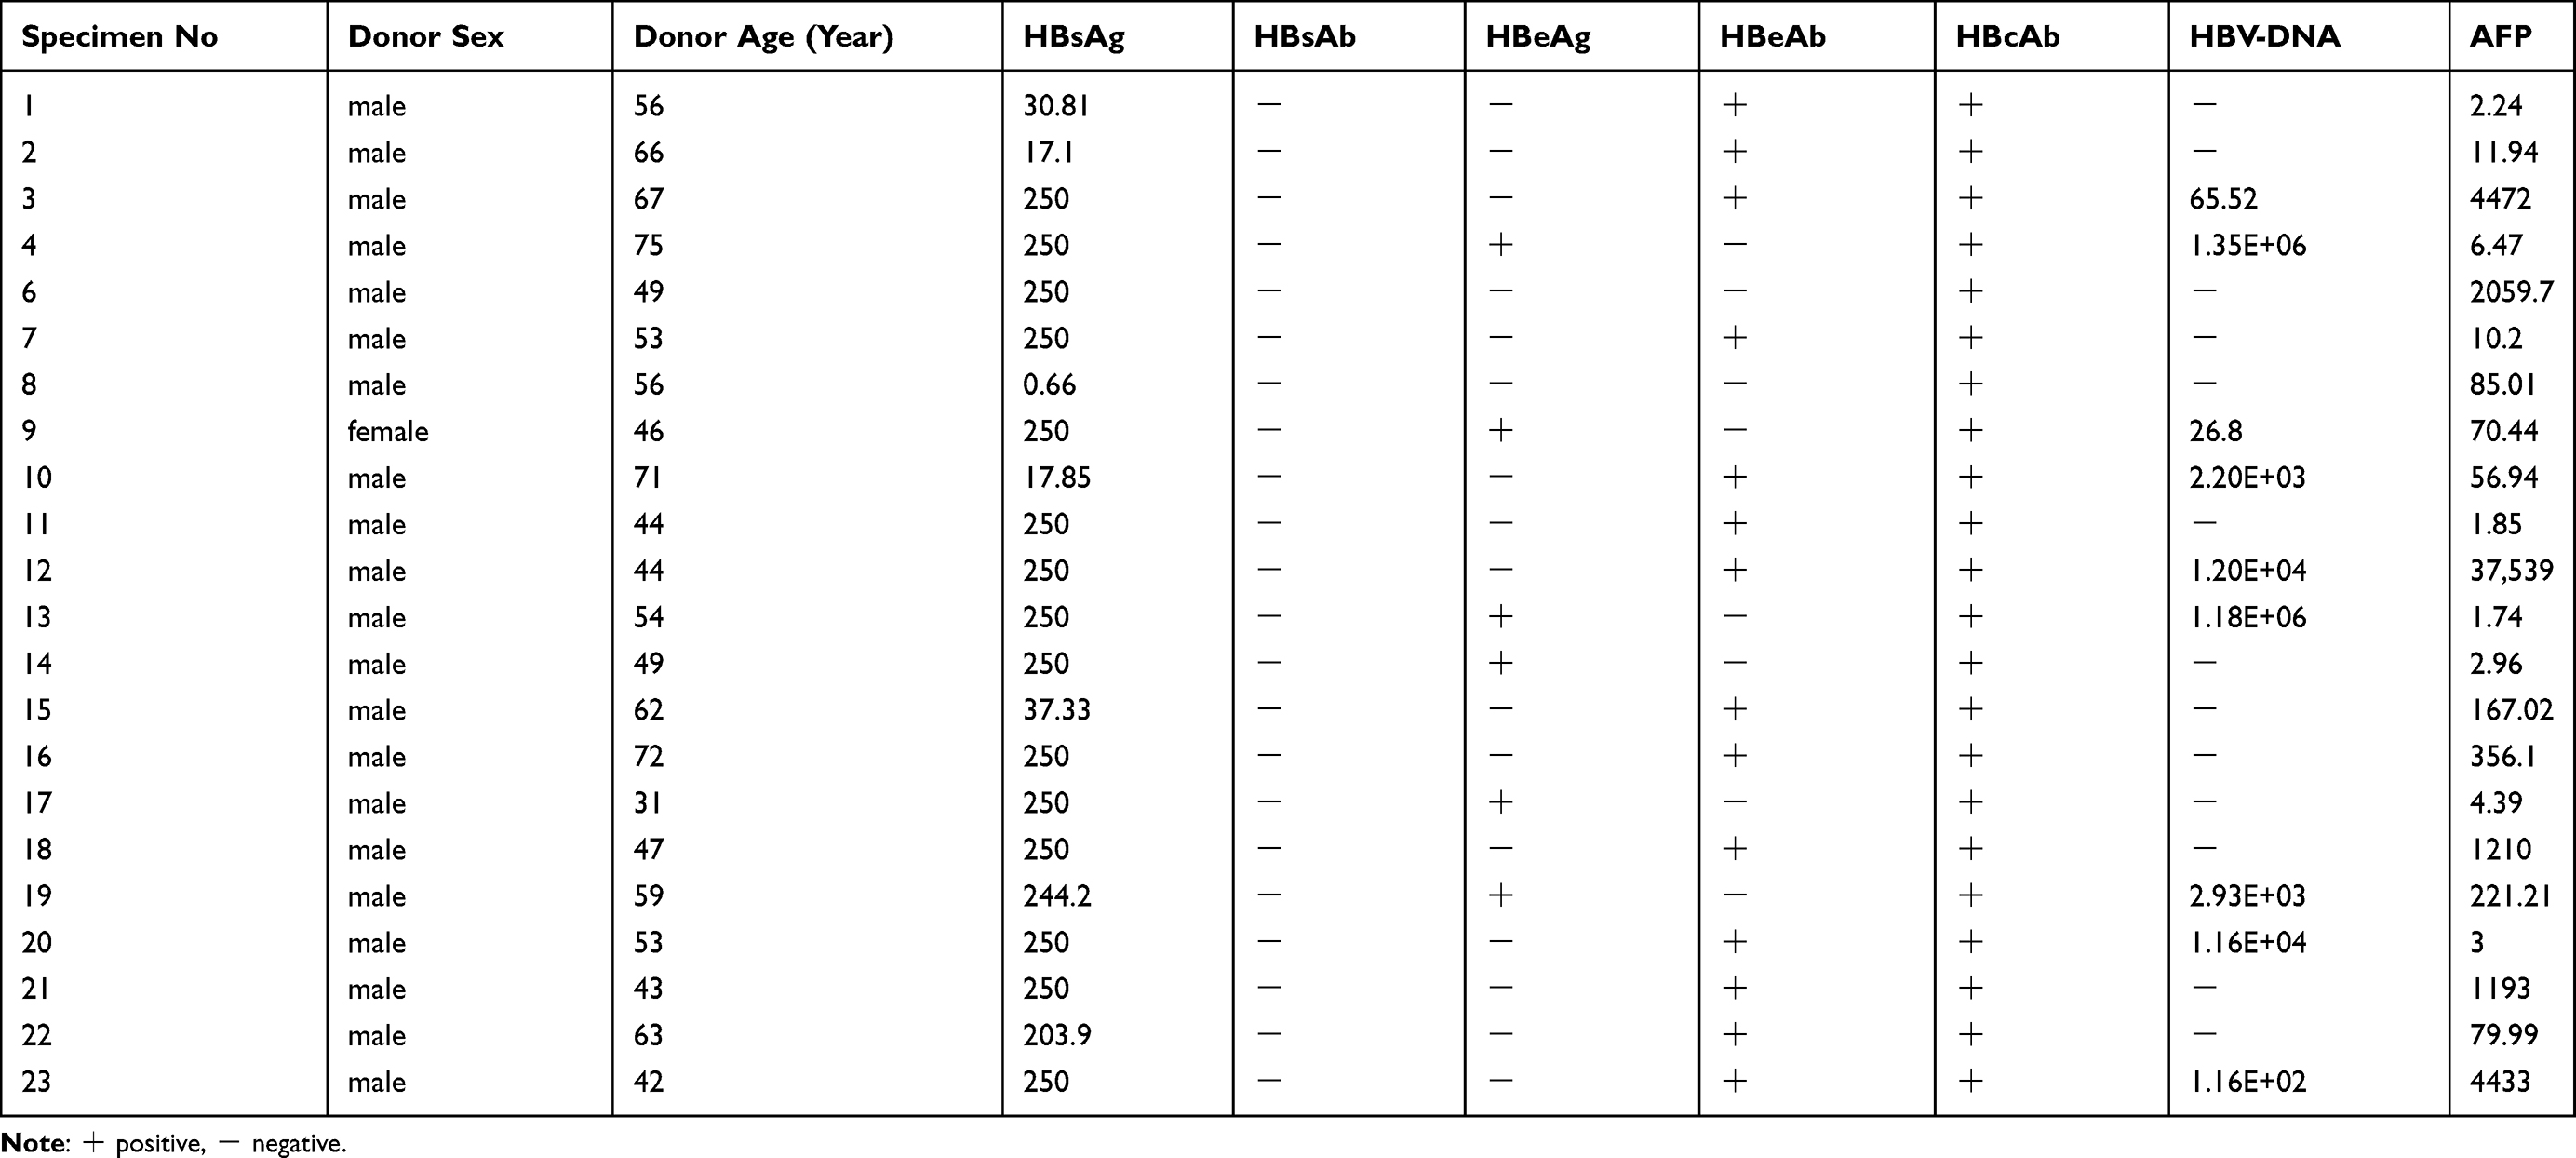 |
Table 1 Details of Hepatoma Tumor Specimens |
Cell Cultures and Transfections
The human hepatoma cell lines HepG2, Huh7, and HepG2.2.15 were purchased from the Cell Bank of the Chinese Academy of Sciences (Shanghai, China). HepAD38 was provided by Professor Zhi Li, College of Life Sciences, Shaanxi Normal University.Ethics approval for the work was granted by the Ethics Committee of The Second Xiangya Hospital.Cells were maintained in Dulbecco’s modified Eagle’s medium (DMEM, HyClone, Shanghai, China) supplemented with 10% fetal bovine serum (FBS, Gibco, New York, USA) containing 100 U/mL penicillin and streptomycin (Cat. No. ST488, Beyotime, Beijing, China) at 37°C in a humidified atmosphere with 5% CO2. Cells were plated into 6-well plates at a density of 1×10⁶ cells/well. After 24 hours, a concentration gradient of the HBV-miR-3 agomir or of the negative control (NC) RNA (artificially synthesized by GenePharma, Shanghai, China) was transfected into HepG2 cells and into HepAD38 cells. Transfection was performed using GP-siRNA-Mate Plus (GenePharma, Shanghai, China) according to the manufacturer’s instructions. The growth medium was changed after 8 hours. Transfected cells were harvested at 48 hours, and total cellular RNA and protein were isolated for RT-qPCR and Western blot analyses. All transfections were performed in triplicate. The blank group refers to cells that were not transfected with any RNA.
Real-Time PCR
Total RNA was isolated using TRIzol reagent (Invitrogen, Carlsbad, CA, USA). miRNA was extracted and purified with miRcute (Cat. No. DP501, Qiagen, Beijing, China) according to the manufacturer’s instructions and then cDNA was synthesized using a Thermo Scientific First Strand cDNA Synthesis Kit (Cat. No. K1612, Thermo Scientific, California, USA). For the quantitation of miRNA expression levels, stem-loop RT-PCR was performed, and cDNA was synthesized using specific stem-loop miRNA-specific primers (synthesized by Tsingke Biological Technology, Beijing, China). U6 snRNA or cel-39 (Tsingke Biological Technology, Beijing, China) was used as an internal control to quantitate the expression levels of miRNAs. Quantitative polymerase chain reaction (Q-PCR) was performed using miRNA-sequence specific forward primers and a common stem-loop reverse universal primer for all miRNAs. The relative content of HBV-miR-3 in cells and tissues is denoted by the ∆CT value of U6. HBV-miR-3 was synthesized artificially (GenePharma, Shanghai, China), PCR was performed at different concentrations, and the standard curve was drawn. The content of HBV-miR-3 in the serum was calculated using the standard curve. Sequences of the primers used in this study are detailed in Table 2.
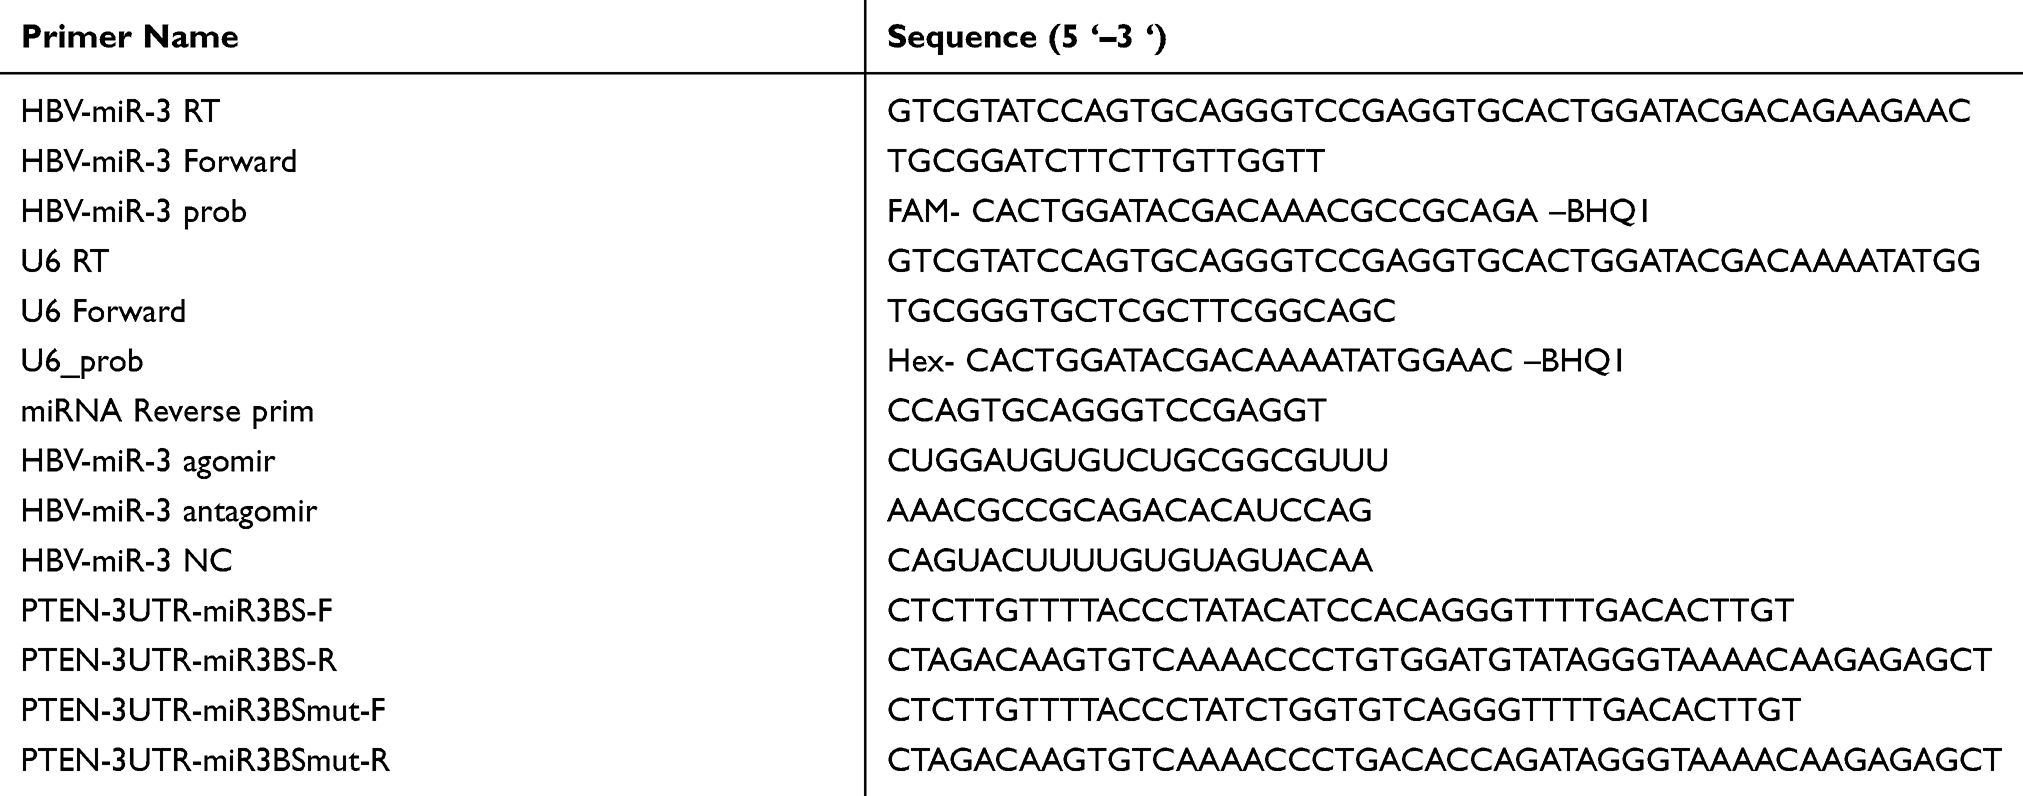 |
Table 2 Primers Used for Plasmid Construction and for RT-qPCR |
Western Blot Analysis
Total protein was extracted from transfected cells and tissues using RIPA lysis buffer (Cat. No. P0013C, Beyotime, Beijing, China) according to the manufacturer’s instructions. For Western blots, equal amounts of protein were separated on 12% SDS polyacrylamide gels and transferred to nitrocellulose membranes (Cat. No. FFN02, Beyotime, Beijing, China). After proteins were transferred, the membrane was blocked with 5% nonfat milk for 2 hours and then incubated with a PTEN antibody (1:2000, Cat. No. ab32199, abcam, San Francisco, USA), a β-actin antibody (1:5000, Cat. No, ab16039, abcam, San Francisco, USA) and an HRP-conjugated GAPDH antibody (1:5000, Cat. No. HRP-60,004, Proteintech, Chicago, USA) overnight. After washing with Phosphate Buffered Saline with 0.05% TWEEN (PBST), membranes were incubated with a goat anti-rabbit HRP-conjugated secondary antibody (Cat. No. sc-2005, Santa Cruz Biotechnology, Dallas, USA) and visualized using enhanced chemiluminescence (Beyo ECL Star, Cat. No. P1008AS, Beyotime, Beijing, China). The expression levels of proteins were semiquantitatively analyzed with ImageJ v1.8.0 (National Institutes of Health). The GAPDH or β-actin signal was used as a loading control.
Luciferase Reporter Assay
To perform the target gene assays, a wild-type (WT) fragment of the 3ʹ-untranslated region (3ʹ-UTR) of PTEN containing the predicted HBV-miR-3 binding sequence was inserted into the pmirGLO Dual-luciferase miRNA Target Expression Vector (Promega, Madison, Wisconsin, USA), and a mutant (MUT) fragment of the 3ʹ-UTR of PTEN was also cloned into the vector to generate a PTEN-MUT construct containing a mutated binding site. HepG2 cells at 60% confluence were co-transfected with PTEN-WT or PTEN-MUT and the HBV-miR-3 agomir or NC using LipofectamineTM 2000 Transfection Reagent (Cat. No. 11,668–019, Invitrogen, Carlsbad, CA, USA). After 48 hours, luciferase activity was measured using the luciferase assay (Cat. No.N1610,Promega, Madison, Wisconsin, USA).
Flow Cytometry Analysis
Flow cytometry was used to quantitate the fraction of apoptotic cells. Cells were harvested 48 hours after transfection, and apoptosis was quantified using an Annexin V-FITC/PI Apoptosis Detection Kit (Cat. No. 401,003, Best-bio, Beijing, China) according to the manufacturer’s instructions. Assays were performed in triplicate.
Colony Formation Assay
At 8 hours post-transfection, HepG2, and HepAD38 cells were seeded into 6-well plates at densities of 2000 and 400 cells/well. After 14 days, the colonies were fixed with 4% paraformaldehyde for 15 min and stained with Giemsa dye (Beyotime, Beijing, China). After washing with water three times, each well was observed and photographed.
Transwell Invasion Assay
Transwell membranes (Corning, New York, USA) coated with serum-free medium were used to assay cell invasion. At 8 hours post-transfection, cells were cultured in 100 µL serum-free medium, cell density was adjusted to 1×10⁶ cells/mL, cells were reseeded into the upper chamber, and 500 µL of medium supplemented with 20% FBS was added to the lower chamber as a chemoattractant. After being cultured at 37°C in 5% CO2 for 24 hours, the cells on the upper layer of the filter membrane were wiped with cotton swabs to collect the invasive cells. The invasive cells were fixed with 4% paraformaldehyde for 15 min, stained with Giemsa dye (Beyotime, Beijing, China) for 15 min, and counted from five randomly selected fields at 100× magnification.
Statistical Analysis
Data were analyzed using the SPSS 16.0 (IBM Corporation,Newyork,USA). Quantitative variables are expressed as the mean±SD. Differences between groups were assessed using the Student’s t-test. PTEN and miR-3 levels in cancer and paracancerous tissues were compared using paired t-tests. The dose-response relationship between HBV-miR-3 levels and PTEN were evaluated using correlation analysis. Differences in measurement data was compared by single factor analysis of variance. The results were considered statistically significant at p-values <0.05.
Results
HBV-miR-3 Was Detected Specifically in Patients with HBV Infection and HBV-Integrated Cells
We examined HepG2, Huh7, HepAD38, and HepG2.2.15 cells and found that HBV-miR-3 was expressed only in HBV-integrated HepAD38 and HepG2.2.15 cells (Figure 1A), which was consistent with the literature.12 In human serum, HBV-miR-3 was present only in CHB patients, while HBV-miR-3 was not detected in the serum of healthy controls or patients infected with HCV, EBV, CMV and HSV (Figure 1B).
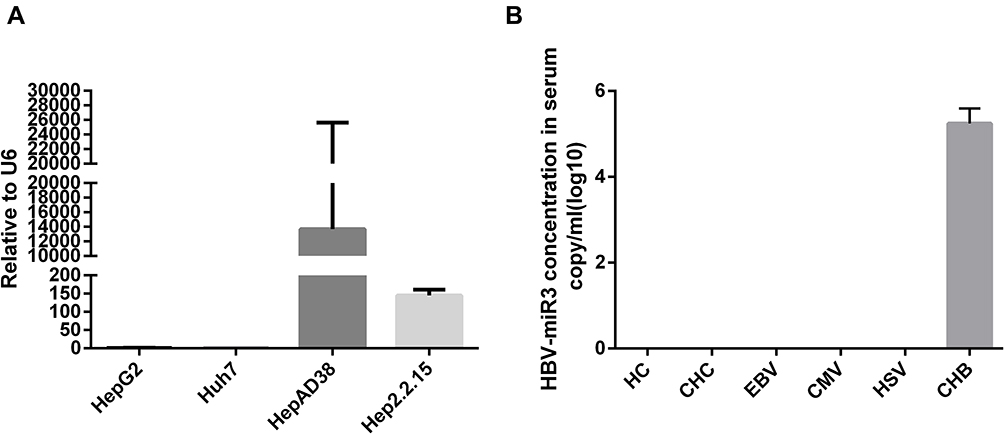 |
Figure 1 HBV-miR-3 is specifically associated with HBV infection. (A) HBV-miR-3 levels in HepG2, Huh7, HepAD38 and HepG2.2.15 cells. (B) HBV-miR-3 levels in healthy controls (HCs), and in patients with chronic hepatitis C (CHC) infection, Epstein-Barr virus (EBV) infection, human cytomegalovirus (HCMV) infection, herpes simplex virus (HSV) infection, and with chronic hepatitis B (CHB) infection. |
HBV-miR-3 Was Highly Expressed in HBV-Related Liver Cancer Tissues
PTEN acts as a tumor suppressor and the loss of PTEN function has been shown to result in the development of breast cancer, prostate cancer,14 and HCC.15 In this study, PTEN levels were significantly lower in liver cancer tissues in 17 of the 23 patients (73.9%) compared with paracancerous tissues (Figure 2A and B),and the difference is significant (Figure 2C). To examine the role of HBV-miR-3 in HBV-related HCC, we detected the expression of HBV-miR-3 in HBV-related liver cancer and paracancerous tissues. We found that the expression of HBV-miR-3 in liver cancer tissues was significantly higher than that in paracancerous tissues (Figure 2D). Interestingly, the relative content of HBV-miR-3 in cancer and paracancerous tissues was negatively correlated with PTEN expression (Figure 2E). This result suggested that HBV-miR-3 may play a role in the occurrence of tumors by downregulating the expression of PTEN. The effects of HBV-miR-3 on PTEN expression in different hepatocyte cell lines were also investigated. PTEN protein levels in HepAD38 cells (derived from HepG2 cells), which express HBV-miR-3, was significantly lower than that in HepG2 cells, which do not contain HBV-miR-3 (Figure 2F and G).
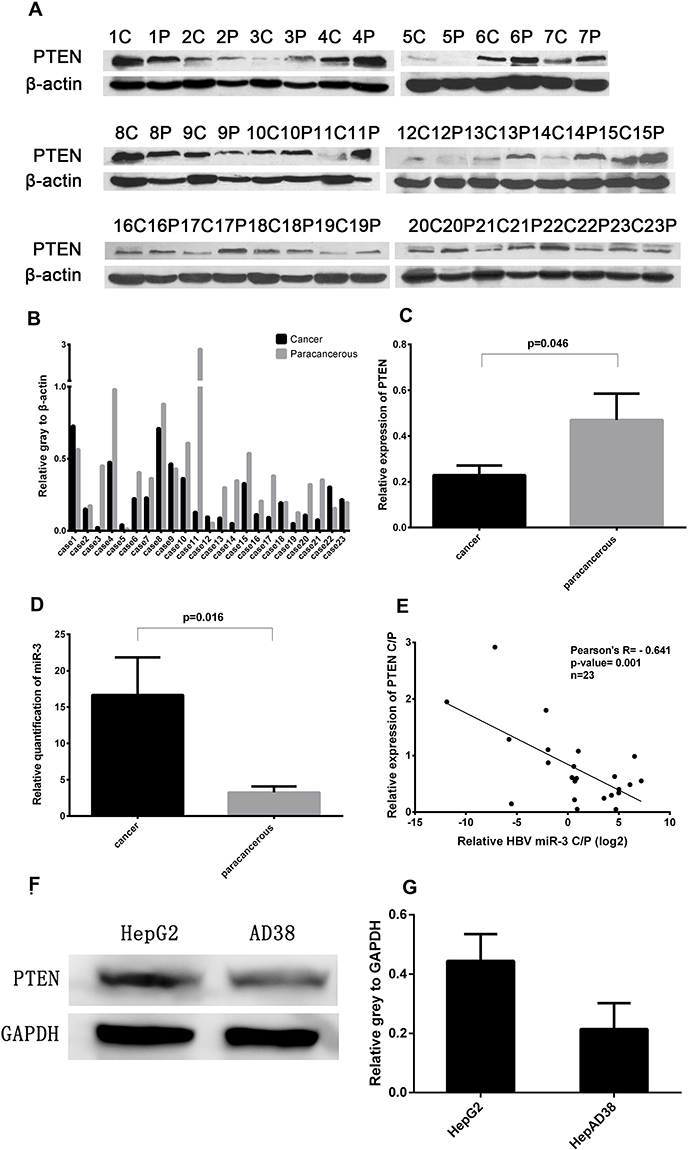 |
Figure 2 Negative correlation between PTEN protein expression and HBV-miR-3 levels in cancer and paracancerous tissues. (A) PTEN protein expression in liver cancer tissues (C), paracancerous tissues (P). (B and C) Ratio of PTEN protein expression to β-actin. (D) HBV-miR-3 levels in liver cancer and paracancerous tissues. (E) Pearson’s analysis of HBV-miR-3 and PTEN. (F and G) PTEN protein expression in HepG2 and HepAD38 cells. |
HBV-miR-3 Targeted the 3ʹ-UTR of PTEN
To determine how HBV-miR-3 regulates PTEN expression, we first performed a computational search for potential HBV-miR-3 binding sites in the 3ʹ-UTR of PTEN mRNA using miRDB (http://mirdb.org/cgi-bin/custom_predict/customDetail.cgi). One miRNA recognition element (MRE) was found when the predictions were compared across distant species (Figure 3A). A dual-luciferase reporter assay was used to determine whether HBV-miR-3 directly targets the 3ʹ-UTR of PTEN. To control for specificity in this assay, 7 nt mutations were introduced into the seed region at the 3ʹ-UTR of PTEN (Figure 3A). HepG2 cells were then cotransfected with the HBV-miR-3 agomir or the NC together with luciferase reporter plasmids carrying the PTEN-WT or PTEN-MUT 3ʹ-UTR segment. The luciferase activity of the WT fragment of the 3ʹ-UTR of PTEN was downregulated in the presence of the HBV-miR-3 agomir (46.44%±0.04, Figure 3B). However, the luciferase activity of the MUT fragment of the 3ʹ-UTR of PTEN did not change markedly in the presence of the HBV-miR-3 agomir (89.93%±0.07, Figure 3B). These data indicated that the predicted MRE is critical for the direct and specific binding of HBV-miR-3 to PTEN mRNA.
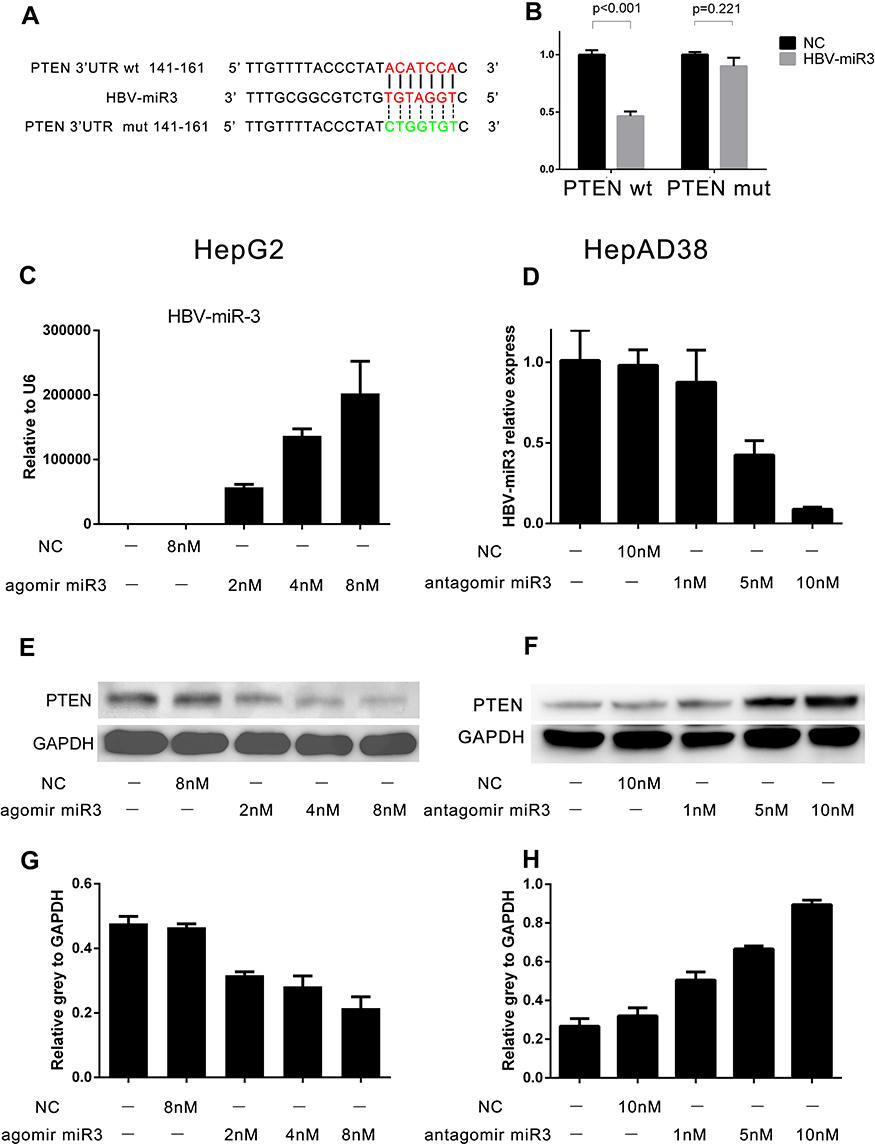 |
Figure 3 HBV-miR-3 downregulates PTEN protein expression. (A) Wild-type and mutant fragments of the 3ʹ-UTR of PTEN. (B) Luciferase activity of cells transfected with HBV-miR-3 and the wild-type or mutant fragment of the 3ʹ-UTR of PTEN. (C, E, and G) HBV-miR-3 inhibits PTEN protein expression in HepG2 cells in a dose-dependent manner. (D, F, and H) The antagomir of HBV-miR-3 upregulates PTEN protein expression in HepAD38 cells in a dose-dependent manner. |
HBV-miR-3 Downregulated PTEN Protein Expression, and the Inhibition of HBV-miR-3 Rescued PTEN Expression
To investigate the role of HBV-miR-3 in regulating PTEN protein expression, we transfected HepG2 cells with different doses of the HBV-miR-3 agomir. As the level of HBV-miR-3 increased (Figure 3C), PTEN protein expression decreased in a dose-dependent manner in HepG2 cells (Figure 3E). The gray value relative to GAPDH changed in a concentration-dependent manner (blank 0.4774±0.0368, NC 0.4652±0.0187, 2 µM HBV-miR-3 agomir 0.3169±0.0178, 4 µM HBV-miR-3 agomir 0.2820±0.0559, 8 µM HBV-miR-3 agomir 0.2146±0.0601) (Figure 3G). The decrease in PTEN expression was inversely correlated with HBV-miR3 expression (Supplement Figure S1 A). To determine whether the expression of PTEN could be rescued by inhibiting HBV-miR-3, the HBV-miR-3 antagomir was transfected into HepAD38 cells at different doses, and antagonism efficiency was confirmed by analyzing HBV-miR-3 levels (blank 1.011±0.1868, NC 0.9803±0.0960, 1 µM HBV-miR-3 antagomir 0.8756±0.1990, 5 µM HBV-miR-3 antagomir 0.4245±0.0887, 10 µM HBV-miR-3 antagomir 0.0886±0.0130) (Figure 3D). Moreover, PTEN protein levels gradually increased (Figure 3F), and the gray value relative to GAPDH changed in a concentration-dependent manner (blank 0.2669±0.0395, NC 0.3206±0.0413, 1 µM HBV-miR-3 antagomir 0.5056±0.0412, 5 µM HBV-miR-3 antagomir 0.6663±0.0145, 10 µM HBV-miR-3 antagomir 0.8949±0.0230) (Figure 3H). The increase in PTEN expression was inversely correlated with the level of HBV-miR3 expression (Supplement Figure S1 B). These data indicate that inhibiting HBV-miR-3 could rescue PTEN expression.
HBV-miR-3 Inhibited Hepatocyte Apoptosis and Promoted Cell Proliferation
Gain- and loss-of-function experiments were conducted to evaluate the effects of HBV-miR-3 on HCC apoptosis. In these experiments, HepG2 cells were transfected with the NC and HBV-miR-3 agomir. Flow cytometry analysis showed that the rate of apoptosis in HepG2 cells decreased significantly compared to the control group (blank group: 5.45±0.05%; NC group: 5.45±0.25%; HBV-miR-3 agomir group: 3.15±0.086%) (Figure 4A, E and I; Supplement Figure S1 C). Conversely, when the HBV-miR-3 antagomir was transfected into HepAD38 cells, the rate of apoptosis increased significantly compared to the control group (blank group: 3.15±0.05%; NC group: 3.40±0.10%; HBV-miR-3 antagomir group: 5.09±0.04%) (Figure 4C, G and K; Supplement Figure S1 D). These data suggested that HBV-miR-3 inhibits cell apoptosis while downregulating PTEN protein expression.
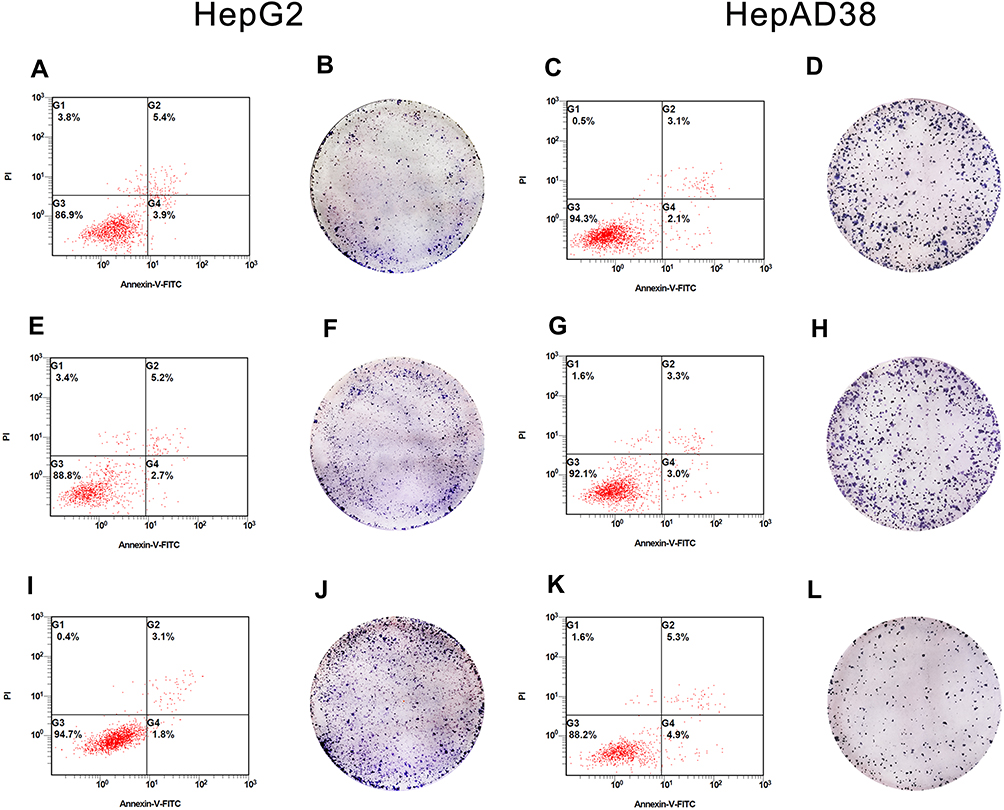 |
Figure 4 Effects of HBV-miR-3 on apoptosis and colony formation. (A, E, and I) HBV-miR-3 inhibits apoptosis in HepG2 cells. (B, F, and J) HBV-miR-3 promotes colony formation in HepG2 cells. (C, G, and K) The antagomir of HBV-miR-3 promotes apoptosis in HepAD38 cells. (D, H, and L) The antagomir of HBV-miR-3 inhibits colony formation in HepAD38 cells. |
The effects of HBV-miR-3 on cell proliferation were observed by colony formation assays. The colony formation rate in HBV-miR-3-transfected HepG2 cells was significantly higher than that of NC-transfected HepG2 cells and blank cells (Figure 4B, F and J; Supplement Figure S1 E). In contrast, the HBV-miR-3 antagomir significantly suppressed the colony formation rate in HepAD38 cells compared to control cells (Figure 4D, H and L; Supplement Figure S1 F).
HBV-miR-3 Promoted Liver Cancer Cell Migration
Transwell migration assays were performed to verify the effects of HBV-miR-3 on the invasion of liver cancer cells. When HBV-miR-3 was transfected into HepG2 cells, the invasive ability increased significantly compared to control cells not exposed to the agomir (180.6±16.57, 71.6±6.27, and 73.6±3.78 cells/field for the HBV-miR-3 agomir, NC, and blank, respectively) (Figure 5A, C and E; Supplement Figure S1 G) Similarly, downregulating HBV-miR-3 significantly reduced the invasive ability of HepAD38 cells (44.6±3.3, 98.6±4.2, and 96±5.0 cells/field for the HBV-miR-3 antagomir, NC, and blank, respectively) (Figure 5B, D and F; Supplement Figure S1 H).
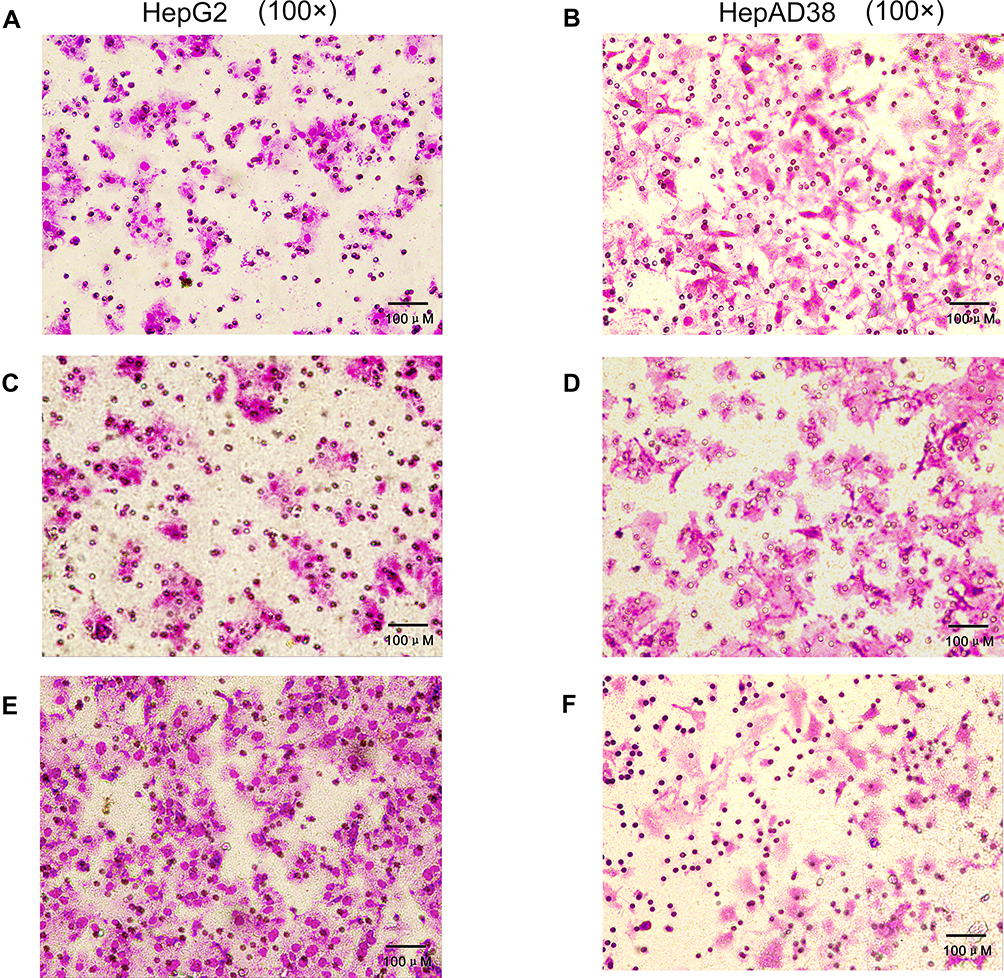 |
Figure 5 HBV-miR-3 promotes liver cancer cell migration. (A) HepG2 cells blank group. (C) HepG2 cells transfected with the NC. (E) HepG2 cells transfected with the HBV-miR-3 agomir. (B) HepAD38 cells blank group. (D) HepAD38 cells transfected with the NC. (F) HepAD38 cells transfected with the HBV-miR-3 antagomir. |
Discussion
HBV is a global public health concern, causing approximately 240 million chronic infections.23 As much as 40% of men and 15% of women with perinatally acquired HBV infection will die of liver cirrhosis or HCC.24 Despite significant advances in cancer treatment, the number of annual deaths from liver cancer has risen significantly in the last decade.25 Chronic HBV infection is also significantly associated with early onset, cirrhosis, high α-fetoprotein levels, microvascular invasion, and low platelet-to-lymphocyte ratios in HCC.26 While there have been no meaningful improvements in HCC treatment, evidence that miRNAs are associated with the occurrence and development of liver cancer has been accumulating over the past decades.27 Many oncogenic viruses encode miRNAs that contribute to the virally induced gene expression program of host cell growth and survival.6 For example, KSHV miR-K12-1 downregulates p21, an inhibitor of cell cycle progression, to promote virally induced oncogenesis in the host10 Epstein-Barr virus encodes the miRNA BART5-3p, which inhibits the expression of p53 (a classic tumor suppressor), accelerating cell cycle progression and inhibiting cell apoptosis.28 Recently, another HBV-encoded miRNA, HBV-miR-2, promotes oncogenic activity by downregulating TRIM35 expression and upregulating RAN expression in liver cancer cells.11
PTEN blocks phosphatidylinositol 3 kinase (PI3K) signaling by inhibiting PIP3-dependent processes, such as membrane recruitment and the activation of AKT, thereby inhibiting cell survival, growth, and proliferation. The COSMIC cancer database currently lists more than 2700 mutations in PTEN from 28 different tumor types; similarly, the cBioPortal of The Cancer Genome Atlas lists 1120 PTEN mutations in 27 tumor types.29 Loss of the PTEN gatekeeper function is a pivotal part of promoting carcinogenesis. Previous studies have shown that PTEN is downregulated in cells expressing HBV,21,22 which could partly explain the mechanism by which HBV causes liver cancer.
In this study, we determined that HBV-miR-3 is expressed only in cell lines in which HBV is replicated and that HBV-miR-3 is expressed specifically in the serum of patients with HBV infection. We also identified differences in the expression of HBV-miR-3 in liver cancer tissues and in paracancerous tissues. These results suggest that HBV-miR-3 is involved in the mechanism by which HCC is induced by HBV. The differential expression of PTEN was also observed in these tissues, and the negative correlation between HBV-miR-3 and PTEN expression was further suggested.
To clarify the underlying relationship between HBV-miR-3 and PTEN, we identified the MRE at which HBV-miR-3 acts on the 3ʹ-UTR of PTEN using a dual-luciferase reporter assay. Western blot analysis confirmed the regulatory effect of HBV-miR-3 on the PTEN protein. HBV-miR-3 suppression in HBV-positive cells yielded the same results.
As expected, HBV-miR-3 reduced the rate of cell apoptosis, and increased proliferation suggesting that HBV-miR-3 may function as an oncogene. PTEN has been confirmed to reduce the expression of Snail by reducing the expression of AKT, thereby controlling invasiveness in non-small cell lung cancer.30 Our transwell migration assay indicated that HBV-miR-3 promotes HCC migration, which is consistent with clinical data.26 In HBV-positive cells, inhibiting HBV-miR-3 can upregulate the expression of PTEN. Furthermore, it increases cell apoptosis, inhibits the rate of colony formation, and decreases cell invasion. These results suggest that HBV-miR-3 may be a potential target for treating HBV-associated HCC. An in-depth investigation into the procarcinogenic role of HBV-miRNAs will expand our knowledge of the biological processes associated with virus-driven tumors and contribute to the development of therapeutic strategies for the treatment of HBV-associated HCC. HBV-miR-3 may potentially act at multiple sites and regulate the expression of other proteins in cells besides PTEN, an area which call for further study.
Conclusion
Our study shows that HBV-miR-3 is expressed only in cell lines in which HBV is replicated and in the serum of patients with HBV infection. Interestingly, HBV-miR-3 can regulate host gene expression. HBV-miR-3 downregulates PTEN expression by inhibiting the translation. The downregulation of PTEN might increase cell proliferation, reduce cell apoptosis, promote cell migration, and result in HCC development (Supplement Figure S2).
Abbreviations
HBV, hepatitis B virus; HCC, hepatocellular carcinoma; HBV-miR-2, hepatitis B virus-encoded microRNA 2; HBV-miR-3, hepatitis B virus-encoded microRNA 3; PTEN, phosphatase and tensin homolog, 3ʹ-UTR, 3ʹ-untranslated region; CHB, choric hepatitis B; CHC, chronic hepatitis C; miRNA, microRNA; HCMV, human cytomegalovirus; MICB, major histocompatibility complex class I-related chain B; KSHV, Kaposi’s sarcoma-associated herpesvirus; NC, negative control; MRE, miRNA recognition element; PI3K, phosphatidylinositol 3 kinase; HC, healthy control; HCV, hepatitis C virus; EBV, Epstein-Barr virus; HSV, herpes simplex virus; TRIM35, tripartite motif containing 35; RAN, Ras-related nuclear protein; SOCS5, suppressor of cytokine signaling 5.
Statement of Ethics
Peripheral blood and liver tissues were obtained from patients at The Second Xiangya Hospital. Written informed consent was obtained from all patients. This research complies with the guidelines for human studies and was conducted ethically in accordance with the Declaration of Helsinki (World Medical Association). Ethics approval for the work was granted by the Ethics Committee of The Second Xiangya Hospital (No. 2019-195).
Acknowledgment
We thank Professor Zhi Li, College of Life Sciences, Shaanxi Normal University for his gift of HepAD38 cell.
Author Contributions
All authors made a significant contribution to the work reported, specifically in the conception, study design, and execution; acquisition of data, analysis and interpretation, or in all these areas; took part in drafting, revising or critically reviewing the article. All authors gave final approval of the version to be published, agreed on the journal to which the article has been submitted; and agreed to be accountable for all aspects of the work.
Funding
This study was supported by the National Science and Technology Major Project (Grant Nos. 2017ZX10203201001-002, 2017ZX10202201-001-008, 2017ZX10202201-004-008, and 2017ZX10202201-003-008), the Scientific Research Fund Project of the Hunan Provincial Health Commission (Grant No. B2017053), the Natural Science Foundation of Hunan Province (Grant No. 2020JJ8098), and the National Natural Science Foundation of China (Grant No. 81974079).
Disclosure
The authors have no conflicts of interest to declare.
References
1. Siegel RL, Miller KD, Jemal A. Cancer statistics, 2018. CA Cancer J Clin. 2018;68(1):7–30. doi:10.3322/caac.21442
2. Bray F, Ferlay J, Soerjomataram I, Siegel RL, Torre LA, Jemal A. Global cancer statistics 2018: GLOBOCAN estimates of incidence and mortality worldwide for 36 cancers in 185 countries. CA Cancer J Clin. 2018;68(6):394–424. doi:10.3322/caac.21492
3. Ryerson AB, Eheman CR, Altekruse SF, et al. Annual report to the nation on the status of cancer, 1975–2012, featuring the increasing incidence of liver cancer. Cancer. 2016;122(9):1312–1337. doi:10.1002/cncr.29936
4. Bartel DP. MicroRNAs: genomics, biogenesis, mechanism, and function. Cell. 2004;116(2):281–297. doi:10.1016/S0092-8674(04)00045-5
5. Ambros V. The functions of animal microRNAs. Nature. 2004;431(7006):350–355. doi:10.1038/nature02871
6. Tycowski KT, Guo YE, Lee N, et al. Viral noncoding RNAs: more surprises. Genes Dev. 2015;29(6):567–584. doi:10.1101/gad.259077.115
7. Stern-Ginossar N, Elefant N, Zimmermann A, et al. Host immune system gene targeting by a viral miRNA. Science. 2007;317(5836):376–381. doi:10.1126/science.1140956
8. Huang Y, Qi Y, Ma Y, et al. The expression of interleukin-32 is activated by human cytomegalovirus infection and down regulated by hcmv-miR-UL112-1. Virol J. 2013;10:51. doi:10.1186/1743-422X-10-51
9. Huang Y, Chen D, He J, et al. Hcmv-miR-UL112 attenuates NK cell activity by inhibition type I interferon secretion. Immunol Lett. 2015;163(2):151–156. doi:10.1016/j.imlet.2014.12.003
10. Gottwein E, Cullen BR. A human herpesvirus microRNA inhibits p21 expression and attenuates p21-mediated cell cycle arrest. J Virol. 2010;84(10):5229–5237. doi:10.1128/JVI.00202-10
11. Yao L, Zhou Y, Sui Z, et al. HBV-encoded miR-2 functions as an oncogene by downregulating TRIM35 but upregulating RAN in liver cancer cells. EBioMedicine. 2019;48:117–129.
12. Yang X, Li H, Sun H, et al. Hepatitis B virus-encoded microRNA controls viral replication. J Virol. 2017;91(10). doi:10.1128/JVI.01919-16.
13. Zhao X, Sun L, Mu T, et al. An HBV-encoded miRNA activates innate immunity to restrict HBV replication. J Mol Cell Biol. 2020;12(4):263–276. doi:10.1093/jmcb/mjz104
14. Li J, Yen C, Liaw D, et al. PTEN, a putative protein tyrosine phosphatase gene mutated in human brain, breast, and prostate cancer. Science. 1997;275(5308):1943–1947. doi:10.1126/science.275.5308.1943
15. Sze KM, Wong KL, Chu GK, Lee JM, Yau TO, Ng IO. Loss of phosphatase and tensin homolog enhances cell invasion and migration through AKT/Sp-1 transcription factor/matrix metalloproteinase 2 activation in hepatocellular carcinoma and has clinicopathologic significance. Hepatology. 2011;53(5):1558–1569. doi:10.1002/hep.24232
16. Di Cristofano A, Pandolfi PP. The multiple roles of PTEN in tumor suppression. Cell. 2000;100(4):387–390.
17. Stambolic V, MacPherson D, Sas D, et al. Regulation of PTEN transcription by p53. Mol Cell. 2001;8(2):317–325. doi:10.1016/S1097-2765(01)00323-9
18. Li DM, Sun H. TEP1, encoded by a candidate tumor suppressor locus, is a novel protein tyrosine phosphatase regulated by transforming growth factor beta. Cancer Res. 1997;57(11):2124–2129.
19. Li W, Zhang T, Guo L, Huang L. Regulation of PTEN expression by noncoding RNAs. J Exp Clin Cancer Res. 2018;37(1):223. doi:10.1186/s13046-018-0898-9
20. Cai LM, Lyu XM, Luo WR, et al. EBV-miR-BART7-3p promotes the EMT and metastasis of nasopharyngeal carcinoma cells by suppressing the tumor suppressor PTEN. Oncogene. 2015;34(17):2156–2166. doi:10.1038/onc.2014.341
21. Tian Y, Xiao X, Gong X, et al. HBx promotes cell proliferation by disturbing the cross-talk between miR-181a and PTEN. Sci Rep. 2017;7:40089. doi:10.1038/srep40089
22. Ma S, Qin K, Ouyang H, Zhu H, Lei P, Shen G. HBV infection exacerbates PTEN defects in hepatocellular carcinoma through upregulation of miR-181a/382/362/19a. Am J Transl Res. 2020;12(7):3780–3791.
23. Schweitzer A, Horn J, Mikolajczyk RT, Krause G, Ott JJ. Estimations of worldwide prevalence of chronic hepatitis B virus infection: a systematic review of data published between 1965 and 2013. Lancet. 2015;386(10003):1546–1555. doi:10.1016/S0140-6736(15)61412-X
24. Trépo C, Chan HL, Lok A. Hepatitis B virus infection. Lancet. 2014;384(9959):2053–2063. doi:10.1016/S0140-6736(14)60220-8
25. Fitzmaurice C, Akinyemiju TF, Al Lami FH, et al. Global, regional, and national cancer incidence, mortality, years of life lost, years lived with disability, and disability-adjusted life-years for 29 cancer groups, 1990 to 2016: a systematic analysis for the global burden of disease study. JAMA Oncol. 2018.
26. Yang F, Ma L, Yang Y, et al. Contribution of Hepatitis B virus infection to the aggressiveness of primary liver cancer: a clinical epidemiological study in Eastern China. Front Oncol. 2019;9:370. doi:10.3389/fonc.2019.00370
27. Varnholt H. The role of microRNAs in primary liver cancer. Ann Hepatol. 2008;7(2):104–113. doi:10.1016/S1665-2681(19)31864-2
28. Zheng X, Wang J, Wei L, et al. Epstein-Barr virus microRNA miR-BART5-3p inhibits p53 expression. J Virol. 2018;92(23). doi:10.1128/JVI.01022-18.
29. Hopkins BD, Hodakoski C, Barrows D, Mense SM, Parsons RE. PTEN function: the long and the short of it. Trends Biochem Sci. 2014;39(4):183–190. doi:10.1016/j.tibs.2014.02.006
30. Perumal E, So Youn K, Sun S, et al. PTEN inactivation induces epithelial-mesenchymal transition and metastasis by intranuclear translocation of β-catenin and snail/slug in non-small cell lung carcinoma cells. Lung Cancer. 2019;130:25–34. doi:10.1016/j.lungcan.2019.01.013
 © 2020 The Author(s). This work is published and licensed by Dove Medical Press Limited. The full terms of this license are available at https://www.dovepress.com/terms.php and incorporate the Creative Commons Attribution - Non Commercial (unported, v3.0) License.
By accessing the work you hereby accept the Terms. Non-commercial uses of the work are permitted without any further permission from Dove Medical Press Limited, provided the work is properly attributed. For permission for commercial use of this work, please see paragraphs 4.2 and 5 of our Terms.
© 2020 The Author(s). This work is published and licensed by Dove Medical Press Limited. The full terms of this license are available at https://www.dovepress.com/terms.php and incorporate the Creative Commons Attribution - Non Commercial (unported, v3.0) License.
By accessing the work you hereby accept the Terms. Non-commercial uses of the work are permitted without any further permission from Dove Medical Press Limited, provided the work is properly attributed. For permission for commercial use of this work, please see paragraphs 4.2 and 5 of our Terms.