")
Back to Journals » OncoTargets and Therapy » Volume 10
miR-203 as a novel biomarker for the diagnosis and prognosis of colorectal cancer: a systematic review and meta-analysis
Authors Ye H, Hao H, Wang J, Chen R, Huang Z
Received 8 February 2017
Accepted for publication 22 May 2017
Published 21 July 2017 Volume 2017:10 Pages 3685—3696
DOI https://doi.org/10.2147/OTT.S134252
Checked for plagiarism Yes
Review by Single anonymous peer review
Peer reviewer comments 2
Editor who approved publication: Prof. Dr. Geoffrey Pietersz
Huajun Ye,1,* Haibin Hao,2,* Jincheng Wang,3 Renpin Chen,1 Zhiming Huang1
1Department of Gastroenterology, The First Affiliated Hospital of Wenzhou Medical University, Zhejiang, 2Department of General Surgery, Medical College of Nanchang University, Nanchang, 3Department of Medical Imaging, The First Affiliated Hospital of Wenzhou Medical University, Zhejiang, People’s Republic of China
*These authors contributed equally to this work
Abstract: We sought to systematically evaluate the diagnostic and prognostic value of miR-203 in patients with colorectal cancer. To explore the diagnostic performance of miR-203, eligible studies were identified from biomedical databases. Based on these results, 11 studies were pooled and included in this meta-analysis. The pooled sensitivity, specificity, and diagnostic odds ratios of miR-203 were 0.83 (95% confidence interval, CI: 0.78–0.86), 0.80 (95% CI: 0.77–0.83), and 19.27 (95% CI: 7.23–51.36) for the diagnosis of colorectal cancer. The area under the curve for miR-203 for diagnosing colorectal cancer was 0.89. Patients with higher expression of tissue miR-203 had poor overall survival (pooled hazard ratio: 1.63; 95% CI: 1.03–2.57, P=0.04), but serum miR-203 was not predictive (pooled hazard ratio: 1.59; 95% CI: 0.31–8.12, P=0.58). The miR-203 values of tissue and serum merged together may perhaps predict superior overall survival (pooled hazard ratio: 1.62; 95% CI: 0.93–2.82), but the effect was not significant (P=0.09).
Keywords: colorectal cancer, CRC, diagnosis, miR-203, prognosis
Introduction
Colorectal cancer (CRC) is one of the most common cancers and a leading cause of death worldwide.1 Currently, surgery is the primary treatment, while supplementary treatments include chemotherapy and molecularly targeted therapy.1,2 Most diagnoses of CRC occur at an advanced stage of the disease, leading to a poor prognosis and low rate of cure.3 microRNAs (miRNAs) are 21-25nt single-stranded, non-coding RNAs, that are highly conserved in evolution. They decrease target gene expression by inhibiting mRNA translation or inducing degradation of the mRNA.4 Calin et al5 published the first study linking miRNAs to cancer, and these agents now have been proven to be closely related to the occurrence and development of tumors. Recent studies have reported altered expression of many miRNAs in CRC tissues, including miR-135b, miR-133, miR-21, miR-203, and miR-106a.6–8
Currently, the biological function of miR-203 in colorectal cancer is controversial and contradictory. Both Lin et al9 and Yantiss et al10 found that the miR-203 level in cancerous tissues was significantly higher than that in adjacent normal tissues, and the prognosis was poor if high levels of miR-203 were present. In contrast, Chiang et al11 reported opposite results in 212 clinical specimens of colorectal cancers; they found that the miR-203 level in cancer tissue was lower than in the adjacent areas and 5-year survival rate of patients with lower miR-203 was worse. Thus, the mechanisms of miRNAs in cancer are not clear, and there is a need for further research on the role of miR-203 in colorectal cancer. The present study was designed to comprehensively explore the utility of miR-203 in colorectal cancer patients.
Materials and methods
Meta-analysis
This meta-analysis was designed, conducted, and reported according to the PRISMA statement.12 The analytic process was carried out in accordance with the Cochrane Handbook for Systematic Reviews of Intervention.13 The review has been registered in an international registry of systematic reviews PROSPERO (CRD42013005119).
Literature search and study selection
A comprehensive literature search was conducted in PUBMED, EMBASE, and OVID to identify eligible studies up to October 2016. The following keywords were used in the searches: (“colorectal” OR “colon” OR “rectal”) AND (“cancer” OR “tumor” OR “carcinoma” OR “adenocarcinoma”) AND (“microRNA” OR “microrna” OR “miR” OR “microRNA-203” OR “miR-203”). References to relevant articles and reviews were also scanned to include possible missed articles. Titles and abstracts were first scanned, and then the full papers of potential eligible studies were reviewed. Meeting abstracts were excluded because of the limited data. Articles as full papers in English were evaluated for eligibility. The retrieved studies were carefully examined to exclude potential duplicates or overlapping data.
Articles were included if they met all the following criteria: 1) the study evaluated the diagnostic or prognostic value of serum or tissue miR-203 level in CRC patients. 2) for diagnostic studies, histologic assessment was applied as reference standard for CRC; and 3) for studies that analyzed the diagnostic value of miR-203, the absolute number of true-positive (TP), false-positive (FP), true-negative (TN), and false-negative (FN) were reported or could be calculated; for prognostic studies, the hazard ratio (HR) or risk ratio values with 95% CI were provided or could be calculated.
Data extraction
Three reviewers independently collected data using standardized forms, and discrepancies were resolved by a fourth investigator. The following information from each study was extracted: first author, year of publication, origin of the study population, patient characteristics (age, sex, cancer type, and stage), source of the samples, number of participants, miR-203 assay method, follow-up time, and the variables adjusted for in the analysis. For diagnostic studies, the numbers of TP, FP, TN, and FN results were extracted. For prognostic studies, HR estimates with 95% CI for overall survival (OS) were extracted. If the HRs and their 95% CIs were not provided, the numbers of deaths or recurrences and total samples in each study were extracted to calculate these numbers.
Quality assessment
The quality of each diagnostic study was assessed independently by three investigators according to the Quality Assessment of Diagnostic Accuracy Studies 2 (QUADAS-2).14 The QUADAS-2 is recognized as an improved, redesigned tool which comprises four key domains (patient selection, index test, reference standard, and flow and timing) supported by signaling questions to aid judgment on risk of bias, rating risk of bias and concerns about applicability as “high,” “unclear,” and “low,” and handling studies in which the reference standard consists of follow-up. For prognostic studies, the Newcastle–Ottawa scale (NOS) was applied to assess the risk of bias and the criteria for reporting observational studies to complete the methodological evaluation.15 These scales were used to allocate a maximum of nine stars for quality of selection, comparability, exposure, and outcome of study participants. Studies with six or more stars are rated as high quality.
Statistical analysis
All statistical analyses were performed using Meta-DiSc 1.4 (XI Cochrane Colloquium, Barcelona, Spain), Review Manager 5.2 (The Nordic Cochrane Center, Rigshospitalet, Denmark), or STATA 12.0 (Stata Corporation, College Station, TX, USA) software. All accuracy data from each study (TP, FP, TN, and FN) were extracted to obtain pooled sensitivity, specificity, positive likelihood ratio (PLR), negative likelihood ratio (NLR), positive predicted value, negative predicted value, diagnostic odds ratio (DOR), and their 95% CI. Simultaneously, we generated summary receiver operator characteristic (SROC) curves and calculated the area under the curve (AUC).16 The sensitivity, specificity, positive and negative predicted value, and DOR of miR-203 were presented as forest plots. Moreover, the heterogeneity between the studies caused by threshold effect was quantified using Spearman correlation analysis.17 The nonthreshold effect was assessed by the Cochran-Q method and the test of inconsistency index (I2), and a low P-value (<0.1) and high I2 value (>50%) suggest presence of heterogeneity caused by nonthreshold effect. If the P<0.1 and I2>50%, the random effect model was used, If P>0.1 and I2<50%, the fixed-effect model was used.18 If the nonthreshold effect existed, meta-regression would be used to identify the sources. Fagan’s nomogram and the likelihood matrix for a diagnostic test were done using Stata 12.0.19 The Deeks’ funnel plot method was applied for publication bias test.20
HR was adopted for prognostic evaluation in the current meta-analysis because all of the included studies used HR to measure the prognostic performance of miR-203. Study-specific HR estimates were pooled using a fixed effects model if there was no significant heterogeneity. Otherwise, a random effects model was applied. The extent of heterogeneity across studies was evaluated using χ2 and I2 tests; P<0.10 and/or I2>50% indicates significant heterogeneity.21 Begg22 funnel plots and Egger linear regression tests were used to assess publication bias.23 miR-203 expression values were divided with the highest tertile classified as high and the lower two tertiles defined as low. Publication bias and sensitivity analyses24 were conducted using Stata 12.0 software. A P-value <0.05 was considered statistically significant.
Results
Study selection and characteristics
After initial searches of PUBMED, EMBASE, and OVID, 76 articles were retrieved. A total of 11 articles8,25–34 were identified as eligible studies. The selection process is shown in Figure 1A, and the characteristics of the relevant studies are presented in Tables 1 and 2. Among the included articles, seven reported the prognostic value of miR-203, whereas five examined diagnostic value of miR-203 (one article reported both prognostic and diagnostic value).
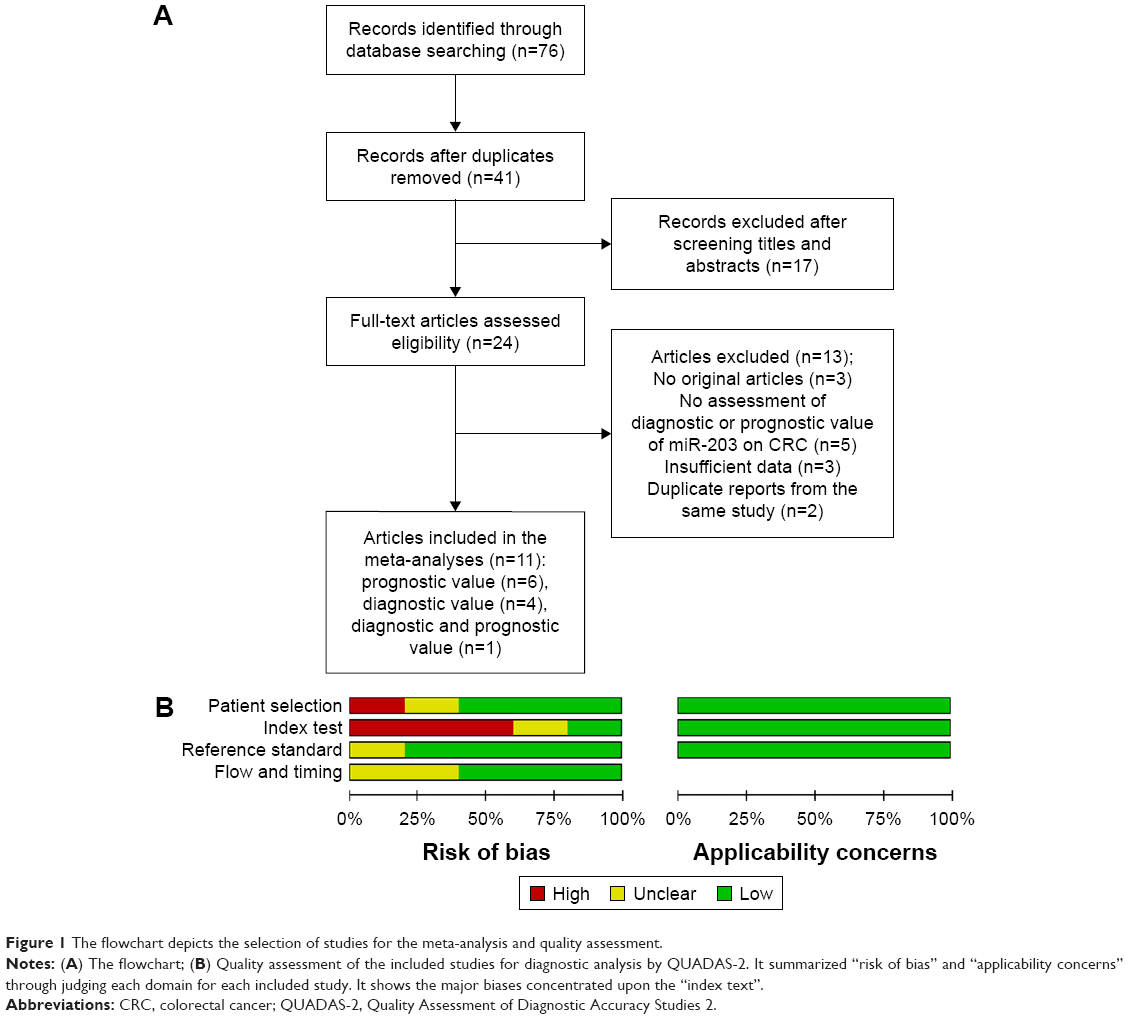 | Figure 1 The flowchart depicts the selection of studies for the meta-analysis and quality assessment. |
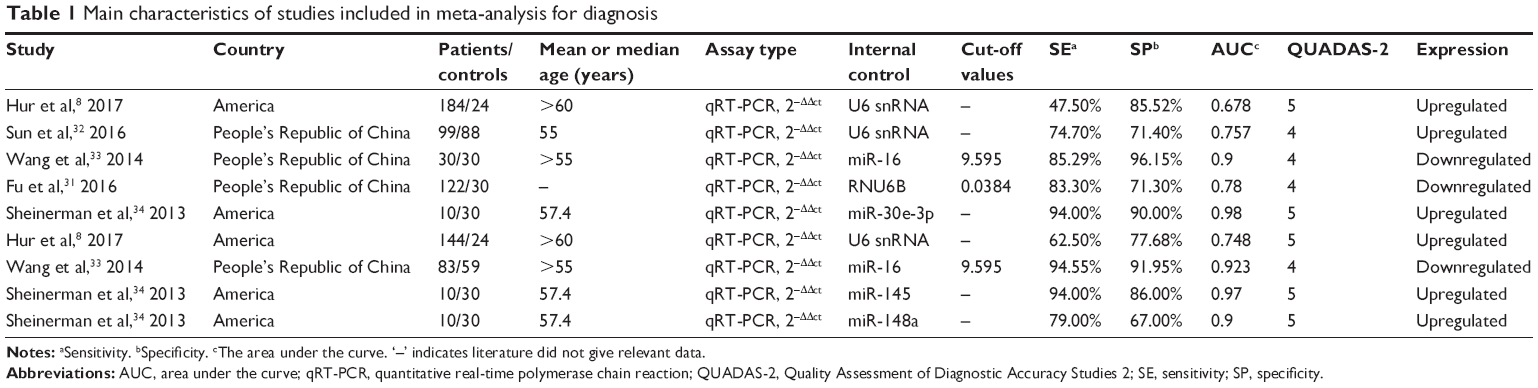 | Table 1 Main characteristics of studies included in meta-analysis for diagnosis |
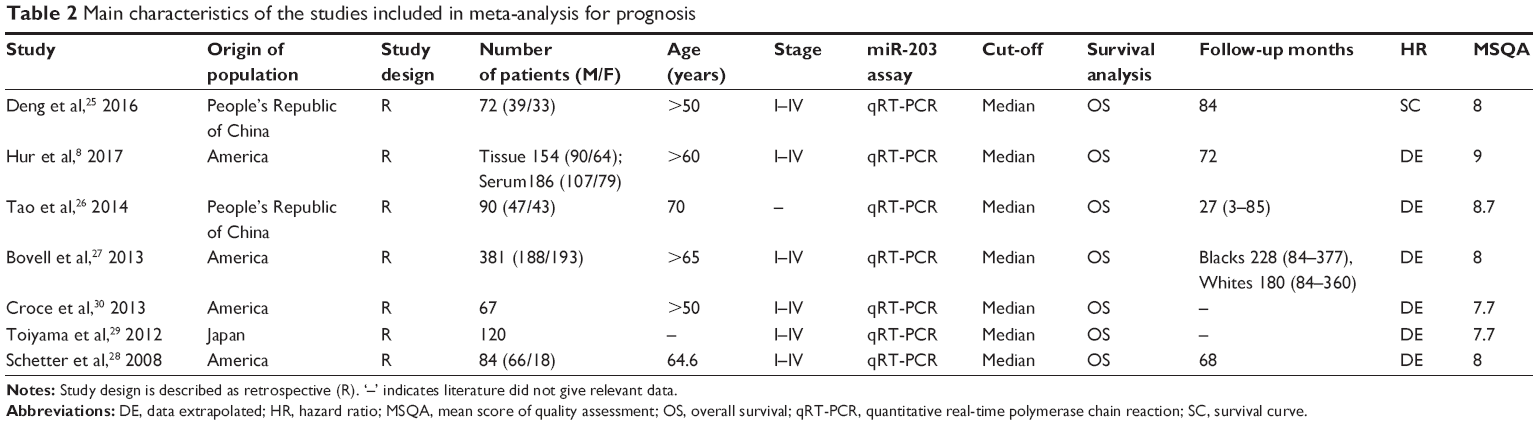 | Table 2 Main characteristics of the studies included in meta-analysis for prognosis |
Diagnostic value of miR-203 for CRC
Nine independent research data from five studies with 672 total CRC patients and 261 healthy people assessed the diagnostic value of miR-203 level for CRC, from serum specimen samples. All studies used quantitative real-time polymerase chain reaction (qRT-PCR) to measure the expression of miR-203. The quality assessments are shown in Figure 1B. Since data in three independent studies from Sheinerman et al34 were derived from the same patient, we first combined them (Figure 2A). In order to assess the heterogeneity of miR-203 among the eligible studies, we first calculated the correlation coefficient and P-value between the logit of sensitivity and logit of 1-specificity using Spearman test to exclude the threshold effect. The resulting Spearman correlation coefficient was −0.357 and the P-value was 0.432, indicating that there was no heterogeneity from threshold effect. Because of potential heterogeneity caused by nonthreshold effect among these studies, the random effect model was used to estimate overall performance of miR-203. For miR-203, the sensitivity, specificity, PLR, NLR, and DOR of included studies were evaluated by forest plots. The pooled sensitivity and specificity were 0.83 (95% CI: 0.78–0.86) and 0.80 (95% CI: 0.77–0.83), respectively (Figure 2B and C). PLR and NLR were 4.05 (95% CI: 2.60–6.29) and 0.24 (95% CI: 0.14–0.44) (Figure 2D and E). The summary DOR (Figure 2F) and the area under SROC (Figure 3) were 19.27 (95% CI: 7.23–51.36) and 0.89 (95% CI: 0.85–0.91), indicating miR-203 has a relatively high diagnostic performance in CRC.
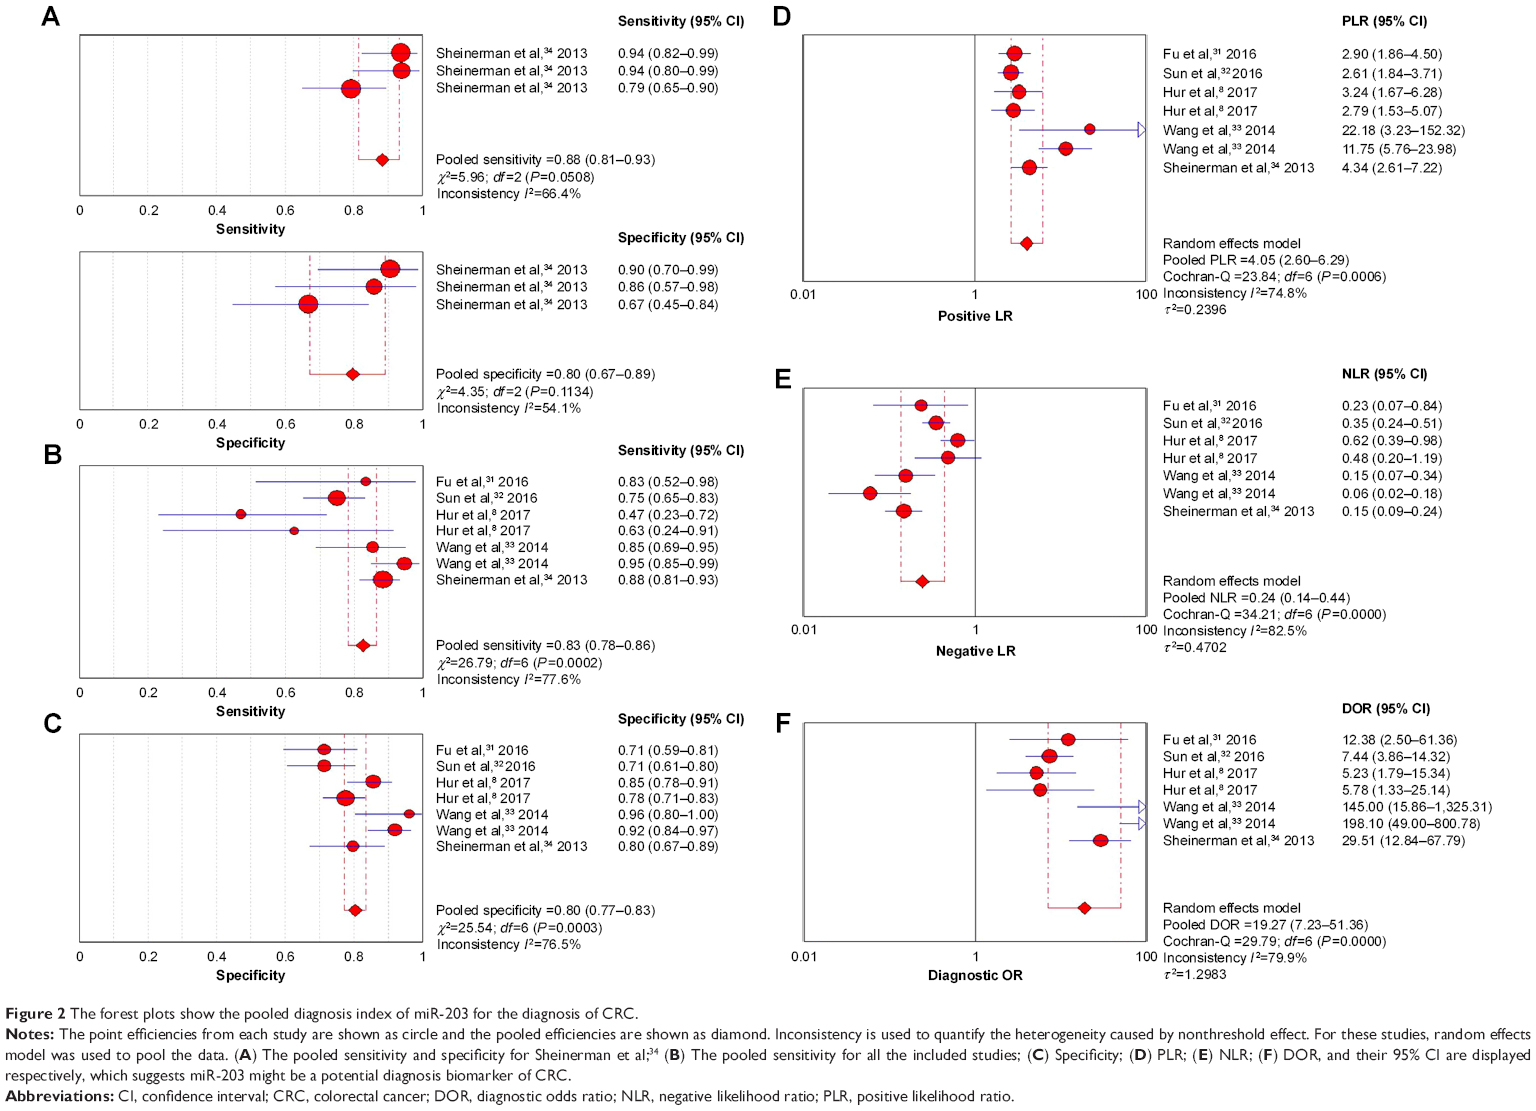 | Figure 2 The forest plots show the pooled diagnosis index of miR-203 for the diagnosis of CRC. |
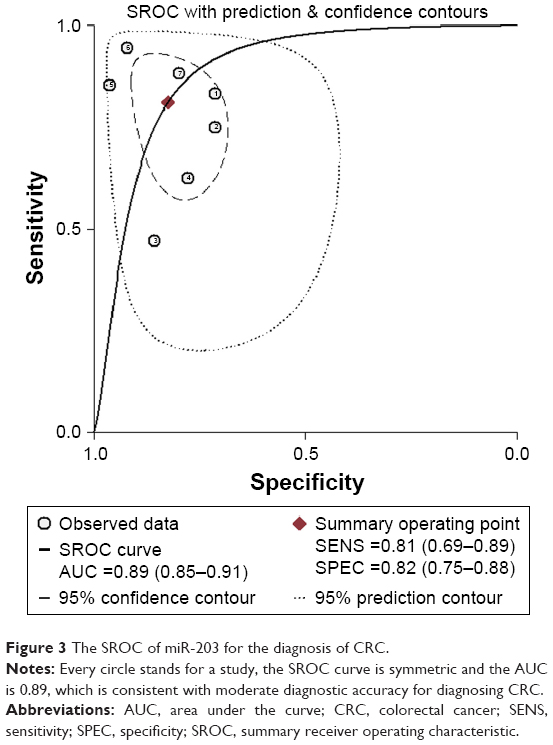 | Figure 3 The SROC of miR-203 for the diagnosis of CRC. |
The prognostic meta-analyses
A total of seven independent studies were included in the prognostic analyses (Table 2). All were published in English and conducted in China (n=2), Japan (n=1), or the United States (n=4). Each study assessed 67–381 patients with CRC. The types of specimen included solid tissue (n=6) and serum (n=3) (Table 3). All studies used qRT-PCR to measure miR-203 expression. The quality assessments are shown in Table 2. Six studies with 848 total patients assessed the relationship between tissue miR-203 expression and CRC OS. The pooled HR was 1.63 (95% CI: 1.03 to 2.57) for six studies from tissue, indicating that higher tissue miR-203 expression levels predicate poorer OS (P=0.04) (Figure 4B). Significant heterogeneity across studies was observed (I2=62%, P=0.02; Figure 4B). Three studies comprising 378 patients evaluated CRC OS for serum miR-203. We found a nonsignificant association between serum miR-203 expression level and OS (pooled HR, 1.59; 95% CI: 0.31 to 8.12, P=0.58; Figure 4C). There was significant heterogeneity in the analysis for serum miR-203 (I2=94%, P<0.05; Figure 4C). In addition, nine studies data explored the performance of tissue and serum miR-203 levels in the prognosis of colorectal cancer. The pooled HR of nine studies for OS was 1.62 (95% CI: 0.93 to 2.82), which demonstrated the combined analysis of both tissue and serum miR-203 may have no effect on OS (P=0.09; Figure 4A).
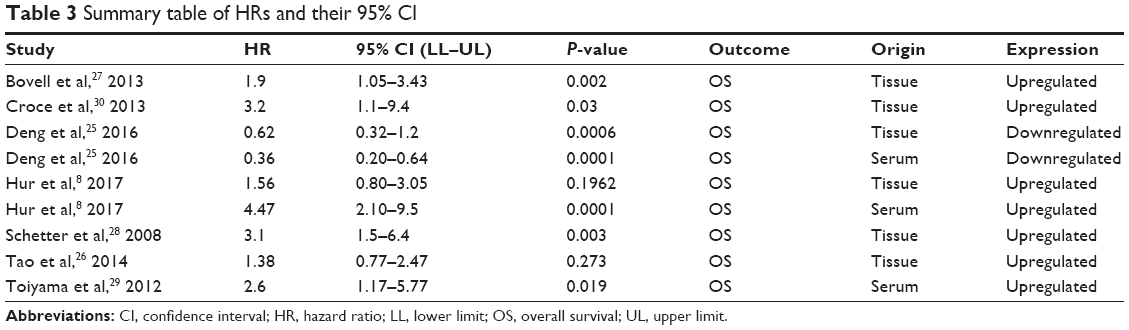 | Table 3 Summary table of HRs and their 95% CI |
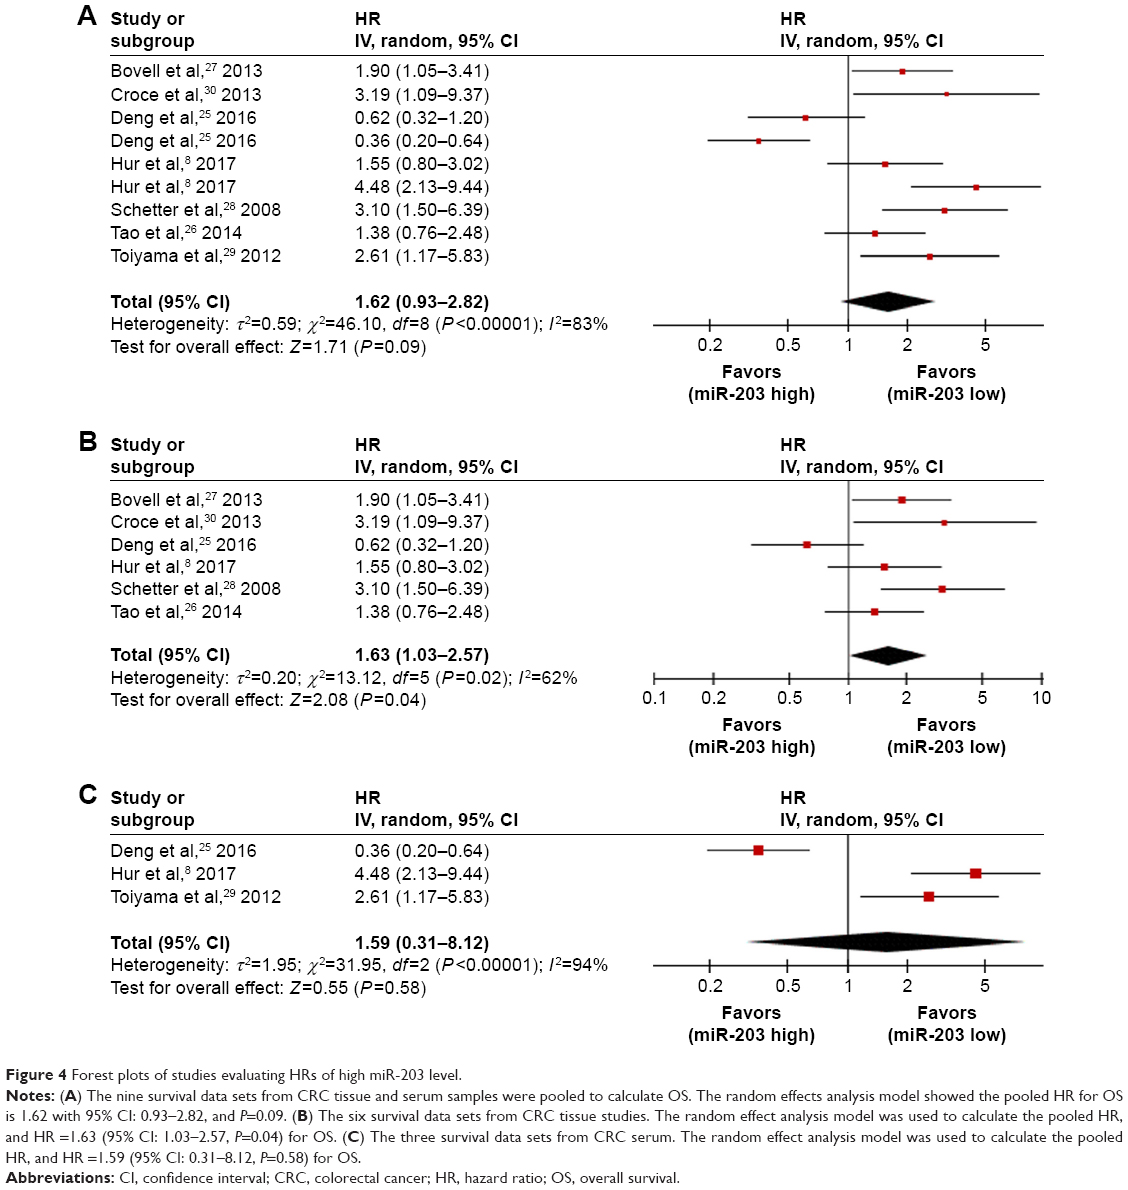 | Figure 4 Forest plots of studies evaluating HRs of high miR-203 level. |
Diagnostic test and prognostic sensitivity analysis
The Fagan’s nomogram describes how to use diagnostic findings from the miR-203 assay to calculate posttest cancer probability (Figure S1A), and the overall distribution of diagnostic studies is summarized in the likelihood matrix in Figure S1B. For OS, Metainf46 was used to investigate the influence of each study on the overall meta-analysis summary estimate, and Figure S2 shows that the results of the meta-analysis did not change after the removal of any one paper.
Publication bias
Funnel plot tests of the diagnostic and prognostic meta-analyses indicated no significant publication bias in this study (Figure 5). The Deeks funnel plot test (Figure 5A) for diagnostic value gave a P-value of 0.80. Egger (Figure 5B) and Begg (Figure S3A) tests for prognostic value of the combined analysis, which had both tissue and serum miR-203, provided P-values of 0.113 and 0.048, respectively. Moreover, for prognostic value of serum miR-203, P-values of Egger (Figure 5C) and Begg (Figure S3B) tests were 0.417 and 0.260. However, because of the limited number of included studies, publication bias cannot absolutely be ruled out.
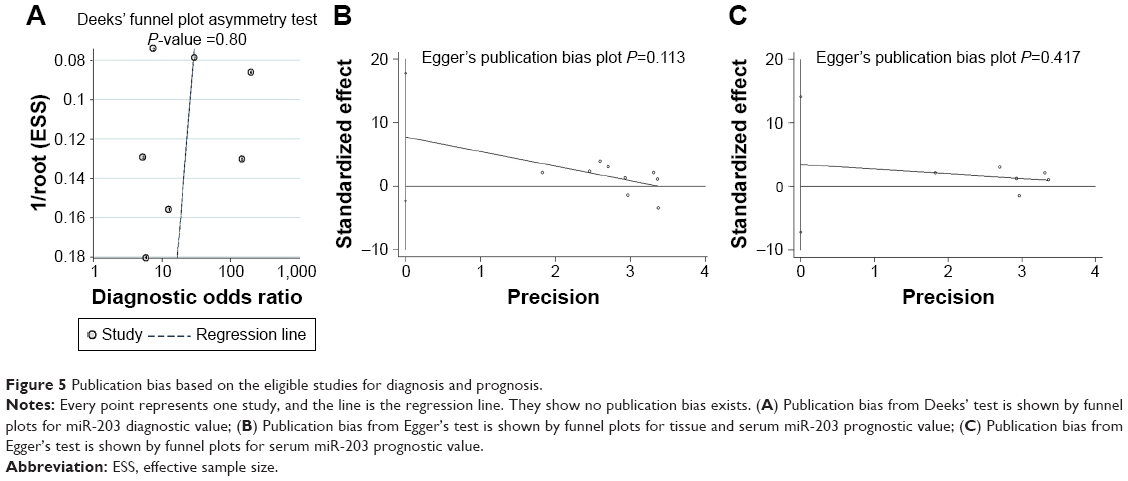 | Figure 5 Publication bias based on the eligible studies for diagnosis and prognosis. |
Discussion
Although significant progress has been achieved in the diagnosis and prognosis of CRC over the years, development of better biomarkers is still necessary for early detection and for predicting patient outcomes.35 The application of miRNAs as biomarkers for cancer diagnosis and prognosis has gained much attention in recent years.36,37 miR-203 is one of the most studied miRNAs to be a potential biomarker for diagnosis and prognosis of CRC. To examine the reported diagnostic and prognostic accuracies, we performed this systematic review on 11 diagnostic or prognostic studies.
miRNAs demonstrate the same change in expression in plasma, serum, feces, and tumor tissues of patients with various types of cancer.38,39 Studies in human cancer cell lines showed that miR-203 could target tumor suppressor genes, such as CDK6,40 AKT2,41 Survivin,42 and ZNF217.43 Therefore, miR-203 may be involved in the critical steps in carcinogenesis and progression of human cancer by promoting tumor growth, proliferation, antiapoptotic mechanisms, and migration. Moreover, Li et al44 reported that miR-203 inhibits TYMS to improve colorectal cancer sensitivity to chemotherapy, but Zhou et al45 showed that miR-203 can inhibit ATM kinase to reduce the sensitivity of colorectal cancer cells to chemotherapeutic drugs. These findings suggest a vital role for altered miR-203 expression in tumorigenesis.
In the present meta-analysis, miR-203 had a pooled sensitivity of 0.83, specificity of 0.80, and AUC of 0.89, suggesting that measuring miR-203 level is a promising noninvasive method for CRC diagnosis. DOR combines the strengths of both sensitivity and specificity and was reported to be a useful indicator for evaluation of the diagnostic method. The DOR value of miR-203 was 19.27, indicating a moderate diagnostic accuracy. However, the positive LR (4.05) and negative LR (0.24) suggest that miR-203 may not be adequate to distinguish patients with CRC. We found significant heterogeneity in sensitivity, and different cutoff values of miR-203 expression across studies may be one source of heterogeneity. Measuring serum miR-203 might also be a useful screening method for advanced colorectal adenomas. Serum miR-203 was also developed as a noninvasive diagnostic biomarker for CRC. On the other hand, the meta-analyses indicated that tissue miR-203 expression was a promising biomarker to predict OS in patients with CRC. Compared with patients with low miR-203 expression from tissue, patients with an increased level of miR-203 expression had a 1.63-fold higher risk of poor OS. Our results showed that miR-203 was useful to predict OS only in male participants, suggesting that sex may modify the observed effect. There was significant heterogeneity in the meta-analyses of the data for OS. Although sensitivity and subgroup analyses were applied, the heterogeneity might result from the different evaluating methods for miR-203. And, although studies have indicated that higher tissue miR-203 levels are associated with poorer OS for CRC, two kinds of samples are used for assessing miR-203 expression, from tissues and serum. To draw convincing conclusions on the value of miR-203 for the diagnosis and prognosis of CRC, an appropriate and unified method should be established and applied.
This systematic review had several important strengths. We conducted a relatively thorough systematic search and applied a comprehensive analytic approach to evaluate the diagnostic and prognostic value of miR-203 in patients with CRC. There was considerable heterogeneity for both the diagnostic and prognostic meta-analyses. Meta-regression and subgroup analyses were applied, but the results could not fully explain the observed heterogeneity. Taken together, we conclude that serum miR-203 level is a useful biomarker for CRC detection, and tissue miR-203 is a promising marker for CRC prognosis.
Acknowledgments
We thank the Charlesworth Author Service’s language editing service for editing the manuscript.
Disclosure
The authors report no conflicts of interest in this work.
References
Brody H. Colorectal cancer. Nature. 2015;521(7551):S1. | ||
Peters U, Bien S, Zubair N. Genetic architecture of colorectal cancer. Gut. 2015;64(10):1623–1636. | ||
Arnold M, Sierra MS, Laversanne M, Soerjomataram I, Jemal A, Bray F. Global patterns and trends in colorectal cancer incidence and mortality. Gut. 2017;66(4):683–691. | ||
Lee RC, Ambros V. An extensive class of small RNAs in Caenorhabditis elegans. Science. 2001;294(5543):862–864. | ||
Calin GA, Dumitru CD, Shimizu M, et al. Frequent deletions and down-regulation of micro-RNA genes miR15 and miR16 at 13q14 in chronic lymphocytic leukemia. Proc Natl Acad Sci U S A. 2002;99(24):15524–15529. | ||
Ristau J, Staffa J, Schrotz-King P, et al. Suitability of circulating miRNAs as potential prognostic markers in colorectal cancer. Cancer Epidemiol Biomarkers Prev. 2014;23(12):2632–2637. | ||
Schee K, Boye K, Abrahamsen TW, Fodstad O, Flatmark K. Clinical relevance of microRNA miR-21, miR-31, miR-92a, miR-101, miR-106a and miR-145 in colorectal cancer. BMC Cancer. 2012;12:505. | ||
Hur K, Toiyama Y, Okugawa Y, et al. Circulating microRNA-203 predicts prognosis and metastasis in human colorectal cancer. Gut. 2017;66(4):654–665. | ||
Lin J, Chuang CC, Li Z. Potential roles of microRNAs and ROS in colorectal cancer: diagnostic biomarkers and therapeutic targets. Oncotarget. 2017;8:17328–17346. | ||
Yantiss RK, Goodarzi M, Zhou XK, et al. Clinical, pathologic, and molecular features of early-onset colorectal carcinoma. Am J Surg Pathol. 2009;33(4):572–582. | ||
Chiang Y, Song Y, Wang Z, et al. Aberrant expression of miR-203 and its clinical significance in gastric and colorectal cancers. J Gastrointest Surg. 2011;15(1):63–70. | ||
Moher D, Liberati A, Tetzlaff J, Altman DG. Preferred reporting items for systematic reviews and meta-analyses: the PRISMA statement. Int J Surg. 2010;8(5):336–341. | ||
Higgins J, Green S. Cochrane handbook for systematic reviews of interventions (version 5.1.0). Available from: http://training.cochrane.org/handbook/. Accessed March 31, 2013. | ||
Whiting PF, Rutjes AW, Westwood ME, et al. QUADAS-2: a revised tool for the quality assessment of diagnostic accuracy studies. Ann Intern Med. 2011;155(8):529–536. | ||
Stang A. Critical evaluation of the Newcastle-Ottawa scale for the assessment of the quality of nonrandomized studies in meta-analyses. Eur J Epidemiol. 2010;25(9):603–605. | ||
Chu H, Guo H. A unification of models for meta-analysis of diagnostic accuracy studies. Biostatistics. 2009;10(1):201–203. | ||
Higgins JP, Thompson SG. Quantifying heterogeneity in a meta-analysis. Stat Med. 2002;21(11):1539–1558. | ||
Hao H, Chen L, Huang D, Ge J, Qiu Y, Hao L. Meta-analysis of alkaline phosphatase and prognosis for osteosarcoma. Eur J Cancer Care (Engl). Epub 2016 Jun 28. | ||
Aznar-Oroval E, Mancheno-Alvaro A, Garcia-Lozano T, Sanchez-Yepes M. [Likelihood ratio and Fagan’s nomogram: 2 basic tools for the rational use of clinical laboratory tests]. Rev Calid Asist. 2013;28(6):390–391. | ||
Deeks JJ, Macaskill P, Irwig L. The performance of tests of publication bias and other sample size effects in systematic reviews of diagnostic test accuracy was assessed. J Clin Epidemiol. 2005;58(9):882–893. | ||
DerSimonian R, Laird N. Meta-analysis in clinical trials revisited. Contemp Clin Trials. 2015;45(Pt A):139–145. | ||
Begg CB, Berlin JA. Publication bias: a problem in interpreting medical data. J Royal Stat Soc. 1988;151(3):419–463. | ||
Egger M, Davey SG, Schneider M, Minder C. Bias in meta-analysis detected by a simple, graphical test. BMJ. 1997;315(7109):629–634. | ||
Steichen T, Steichen T. METANINF: Stata module to evaluate influence of a single study in meta-analysis estimation. Statistical Software Components. 2001. | ||
Deng B, Wang B, Fang J, et al. MiRNA-203 suppresses cell proliferation, migration and invasion in colorectal cancer via targeting of EIF5A2. Sci Rep. 2016;6:28301. | ||
Tao K, Yang J, Guo Z, et al. Prognostic value of miR-221-3p, miR-342-3p and miR-491-5p expression in colon cancer. Am J Transl Res. 2014;6(4):391–401. | ||
Bovell LC, Shanmugam C, Putcha BD, et al. The prognostic value of microRNAs varies with patient race/ethnicity and stage of colorectal cancer. Clin Cancer Res. 2013;19(14):3955–3965. | ||
Schetter AJ, Leung SY, Sohn JJ, et al. MicroRNA expression profiles associated with prognosis and therapeutic outcome in colon adenocarcinoma. JAMA. 2008;299(4):425–436. | ||
Toiyama Y, Hur K, Takahashi M, et al. Serum MIR-200c and mir-203 are novel prognostic and metastasis-predictive biomarkers in patients with colorectal cancer (CRC). Gastroenterology. 2012;142(5):S533. | ||
Croce C, Schetter A, Harris C. Mir-106a for diagnosing poor survival prognosis colon adenocarcinoma EP2436782A1. 2013. Available from: http://www.google.gm/patents/EP2436782B8. Accessed February 8, 2017. | ||
Fu Q, Zhang J, Xu X, Qian F, Feng K, Ma J. miR-203 is a predictive biomarker for colorectal cancer and its expression is associated with BIRC5. Tumor Biol. Epub 2016, Oct 6. | ||
Sun Y, Liu Y, Cogdell D, et al. Examining plasma microRNA markers for colorectal cancer at different stages. Oncotarget. 2016;7(10):11434–11449. | ||
Wang J, Huang SK, Zhao M, et al. Identification of a circulating microRNA signature for colorectal cancer detection. Plos One. 2014;9(4):e87451. | ||
Sheinerman KS, Tsivinsky VG, Umansky SR. Analysis of organ-enriched microRNAs in plasma as an approach to development of Universal Screening Test: feasibility study. J Transl Med. 2013;11(1):1146–1158. | ||
Yu J, Feng Q, Wong SH, et al. Metagenomic analysis of faecal microbiome as a tool towards targeted non-invasive biomarkers for colorectal cancer. Gut. 2017;66(1):70–78. | ||
Ma Y, Zhang P, Yang J, Liu Z, Yang Z, Qin H. Candidate microRNA biomarkers in human colorectal cancer: systematic review profiling studies and experimental validation. Int J Cancer. 2012;130(9):2077–2087. | ||
Baranwal S, Alahari SK. miRNA control of tumor cell invasion and metastasis. Int J Cancer. 2010;126(6):1283–1290. | ||
Koga Y, Yamazaki N, Matsumura Y. [Fecal biomarker for colorectal cancer diagnosis]. Rinsho Byori. 2015;63(3):361–368. | ||
Aravalli RN, Steer CJ. Circulating microRNAs: novel biomarkers for early detection of colorectal cancer. Transl Res. 2015;166(3):219–224. | ||
Furuta M, Kozaki K, Tanaka S, Arii S, Imoto I, Inazawa J. miR-124 and miR-203 are epigenetically silenced tumor-suppressive microRNAs in hepatocellular carcinoma. Carcinogenesis. 2010;31(5):766–776. | ||
Li J, Chen Y, Zhao J, Kong F, Zhang Y. miR-203 reverses chemoresistance in p53-mutated colon cancer cells through downregulation of Akt2 expression. Cancer Lett. 2011;304(1):52–59. | ||
Wei W, Wanjun L, Hui S, Dongyue C, Xinjun Y, Jisheng Z. miR-203 inhibits proliferation of HCC cells by targeting survivin. Cell Biochem Funct. 2013;31(1):82–85. | ||
Li Z, Du L, Dong Z, et al. MiR-203 suppresses ZNF217 upregulation in colorectal cancer and its oncogenicity. Plos One. 2015;10(1):e0116170. | ||
Li T, Gao F, Zhang X. miR-203 enhances chemosensitivity to 5-fluorouracil by targeting thymidylate synthase in colorectal cancer. Oncol Rep. 2015;33(2):607–614. | ||
Zhou Y, Wan G, Spizzo R, et al. miR-203 induces oxaliplatin resistance in colorectal cancer cells by negatively regulating ATM kinase. Mol Oncol. 2014;8(1):83–92. | ||
Hao H, Liu L, Zhang D, et al. Diagnostic and prognostic value of miR-106a in colorectal cancer. Oncotarget. 2017;8(3):5038–5047. |
Supplementary materials
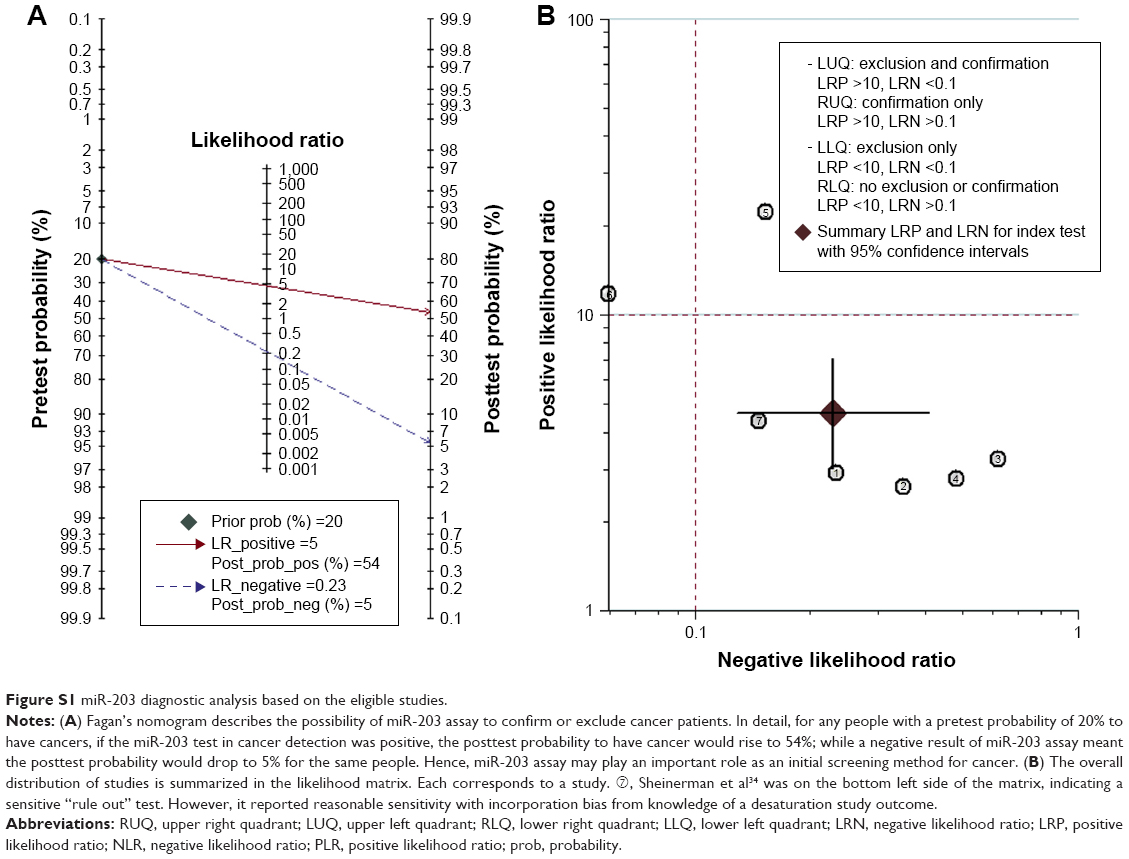 | Figure S1 miR-203 diagnostic analysis based on the eligible studies. |
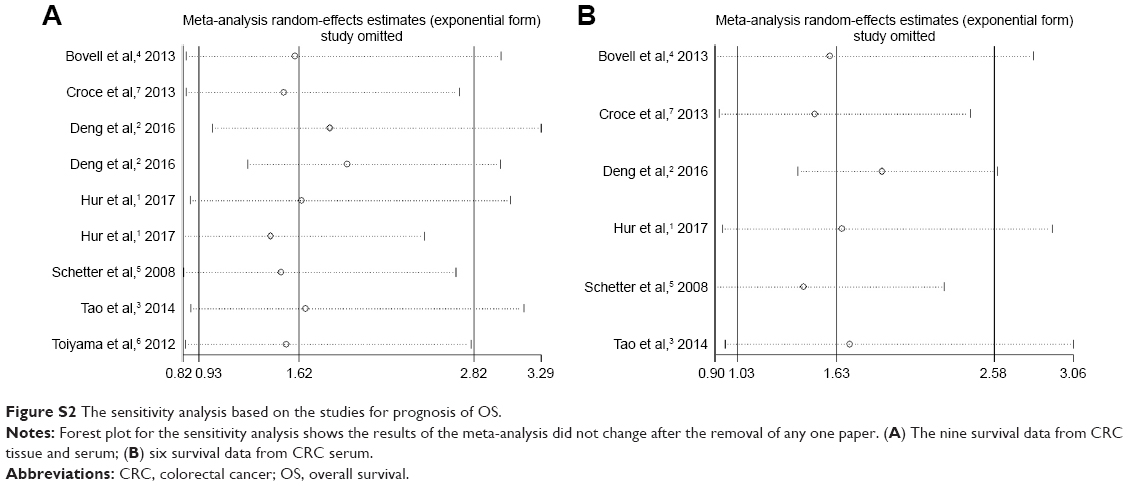 | Figure S2 The sensitivity analysis based on the studies for prognosis of OS. |
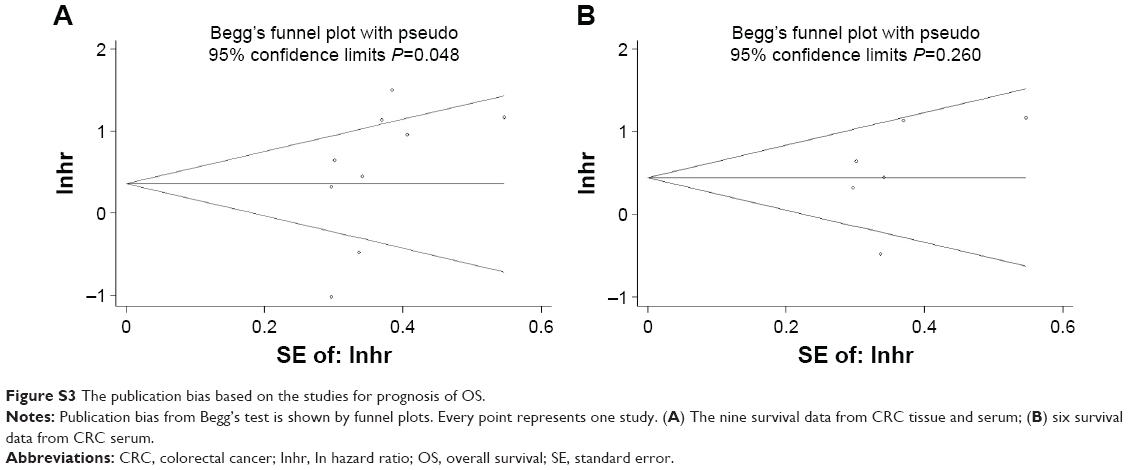 | Figure S3 The publication bias based on the studies for prognosis of OS. |
References
Hur K, Toiyama Y, Okugawa Y, et al. Circulating microRNA-203 predicts prognosis and metastasis in human colorectal cancer. Gut. 2017;66(4):654–665. | ||
Deng B, Wang B, Fang J, et al. MiRNA-203 suppresses cell proliferation, migration and invasion in colorectal cancer via targeting of EIF5A2. Sci Rep. 2016;6:28301. | ||
Tao K, Yang J, Guo Z, et al. Prognostic value of miR-221-3p, miR-342-3p and miR-491-5p expression in colon cancer. Am J Transl Res. 2014;6(4):391–401. | ||
Bovell LC, Shanmugam C, Putcha BD, et al. The prognostic value of microRNAs varies with patient race/ethnicity and stage of colorectal cancer. Clin Cancer Res. 2013;19(14):3955–3965. | ||
Schetter AJ, Leung SY, Sohn JJ, et al. MicroRNA expression profiles associated with prognosis and therapeutic outcome in colon adenocarcinoma. JAMA. 2008;299(4):425–436. | ||
Toiyama Y, Hur K, Takahashi M, et al. Serum MIR-200c and mir-203 are novel prognostic and metastasis-predictive biomarkers in patients with colorectal cancer (CRC). Gastroenterology. 2012;142(5):S533. | ||
Croce C, Schetter A, Harris C. Mir-106a for diagnosing poor survival prognosis colon adenocarcinoma EP2436782A1. 2013. Available from: http://www.google.gm/patents/EP2436782B8. Accessed February 8, 2017. |
 © 2017 The Author(s). This work is published and licensed by Dove Medical Press Limited. The full terms of this license are available at https://www.dovepress.com/terms.php and incorporate the Creative Commons Attribution - Non Commercial (unported, v3.0) License.
By accessing the work you hereby accept the Terms. Non-commercial uses of the work are permitted without any further permission from Dove Medical Press Limited, provided the work is properly attributed. For permission for commercial use of this work, please see paragraphs 4.2 and 5 of our Terms.
© 2017 The Author(s). This work is published and licensed by Dove Medical Press Limited. The full terms of this license are available at https://www.dovepress.com/terms.php and incorporate the Creative Commons Attribution - Non Commercial (unported, v3.0) License.
By accessing the work you hereby accept the Terms. Non-commercial uses of the work are permitted without any further permission from Dove Medical Press Limited, provided the work is properly attributed. For permission for commercial use of this work, please see paragraphs 4.2 and 5 of our Terms.