")
Back to Journals » OncoTargets and Therapy » Volume 14
MiR-153-3p Suppresses Cell Proliferation, Invasion and Glycolysis of Thyroid Cancer Through Inhibiting E3F3 Expression
Received 15 June 2020
Accepted for publication 11 November 2020
Published 18 January 2021 Volume 2021:14 Pages 519—529
DOI https://doi.org/10.2147/OTT.S267887
Checked for plagiarism Yes
Review by Single anonymous peer review
Peer reviewer comments 2
Editor who approved publication: Dr Federico Perche
Xianzhao Deng, Bomin Guo, Youben Fan
Department of General Surgery, Shanghai Jiao Tong University Affiliated Sixth People’s Hospital, Shanghai 200233, People’s Republic of China
Correspondence: Youben Fan
Department of General Surgery, Shanghai Jiao Tong University Affiliated Sixth People’s Hospital, 600 Yishan Road, Shanghai 200233, People’s Republic of China
Tel +86-21-24058410
Email [email protected]
Purpose: The aim was to research the role of miR-153-3p and E2F3 in the development of thyroid tumors.
Methods: A total of 91 thyroid cancer patients were involved. The role of miR-153-3p in THCA cell lines and Nthy-ori3-1 cell line was researched. qPCR was used to detect miR-153-3p and E2F3 expression. MiR-153-3p mimic, inhibitor, siE2F3 or corresponding controls were transfected in cells. CCK8 was used to verify the proliferation. Cell cycle and apoptosis was detected by flow cytometry. Transwell assay was applied for migration and invasion, and glycolysis was monitored. The binding of miR-153-3p and E2F3 was predicted by targetscan database, and verified by luciferase reporter and RNA-pull down assay. Western blot was used to detect E2F3 expression. Rescue assay was undertaken to verify the effect of siE2F3 on miR-153-3p inhibitor. Moreover, the effect of miR-153-3p mimic on tumor volume and weight was measured. IHC assay was processed to E2F3 and Ki67 expression, and TUNEL assay was used for apoptosis.
Results: MiR-153-3p expressed lower in thyroid tumors and cells. The level of miR-153-3p was negatively related with TNM stage. MiR-153-3p inhibited cell proliferation, invasion migration, and induced cycle arrest and apoptosis. Moreover, it negatively regulated E2F3. siE2F3 rescued effects of miR-153-3p inhibitor in all above biological processes in thyroid cancer cells. MiR-153-3p inhibited tumor growth. Moreover, it inhibited E2F3 and Ki67 expression, and also increased apoptosis in vivo.
Conclusion: MiR-153-3p suppresses cell proliferation, invasion and glycolysis of thyroid cancer through inhibiting E3F3 expression, which may be a biomarker for thyroid cancer diagnose.
Keywords: thyroid cancer, MiR-153-3p, E3F3, proliferation, invasion, glycolysis
Introduction
Worldwide, thyroid cancer is the most common malignant tumor of the endocrine system.1 The incidence of thyroid cancer in China is about 1.5/100,000, which shown a younger and rising trend in recent years.2 The etiology of thyroid nodules is complex, and their occurrence is closely related to genetics and certain environmental factors, such as abnormal iodine intake, infection, immune dysfunction, stress, and radiation exposure.3 Thyroid nodules larger than 1 cm in diameter can be diagnosed by palpation, while those less than 1 cm are often determined by ultrasound examination.4 Undeniably, for patients who are difficult to diagnose with ultrasound, molecular marker-assisted detection can further improve the accuracy of a thyroid cancer diagnosis.5
In previous studies, miRNA has been confirmed to play an important role in the occurrence and development of tumors, which is abnormally expressed in a variety of tumors, such as breast cancer,6 colon cancer,7 lung cancer,8 and pancreatic cancer.9 Similarly, miRNA is abnormally expressed in different pathological types of thyroid cancer.10 Among them, about 32% of known miRNAs are overexpressed, and about 38% of known miRNAs are lower expressed in thyroid cancer tissues.11 For instance, Pallante et al,12 analyzed the miRNA expression profiles of 30 PTC and 10 normal tissues using gene chip method and screened 5 up-regulated miRNAs in PTC tissues. Among them, miR-221, miR-222, and miR-181b are abundantly expressed in PTC tissues, but almost undetectable in healthy tissues.13 In addition, Keugten et al,14 used a group of miRNAs (miR-222, miR-382, miR-197, miR-21) to diagnose uncertain thyroid cancer tissue samples and found that the sensitivity, specificity and accuracy rate of malignant diagnosis was 100%, 88%, and 90%. Therefore, the characteristics of miRNA expression characteristics can be used as a basis for the diagnosis and treatment of thyroid cancer.
MiR-153-3p has been confirmed to play an important role in the occurrence and development of a variety of cancers, which is also considered to be a tumor suppressor gene.15 However, the regulated genes and detail molecular mechanisms related to thyroid tumors are yet to be discovered. Therefore, the aim of this study is to investigate the role of miR-153-3p and E2F3 in the development of thyroid tumors. Interestingly, the data in the TCGA database shows that miR-153-3p is significantly lower expressed in thyroid tumors, and its target gene E2F3 is highly expressed.
Materials and Methods
Tissues Collection of Thyroid Patients
A total of 91 thyroid cancer patients r who underwent radical surgery in our hospital from May 2018 to May 2019 were included. The inclusion criteria were as follows: 1) all patients were diagnosed with thyroid cancer by surgical pathological examination; 2) The patient underwent radical surgery; 3) The patient did not receive any anti-tumor treatment before admission; and 4) The clinical medical records were complete. The THCA clinical pathology was recorded, including ages, gender, TNM stage, histological type and tumor size. Thyroid cancer tissues and adjacent tissues of the patients were taken during the surgery and immediately frozen in −80°C refrigerator. Most of the informed consent forms were signed by the patients themselves. For individual patients who were not able to sign, the family members signed the documents on their behalf of the patient, who were authorized by the patients. The study was approved by the ethics committee of Shanghai Jiao Tong University Affiliated Sixth People’s Hospital (IRB number: 20,170,621). The present study was conducted in accordance with the Declaration of Helsinki.
Cell Culture and Transfection
THCA cell lines (TPC1, BCPAP, SW579, 8505C) and normal cell lines (Nthy-ori3-1) were purchased from the Institute of Cell and Bio-Biochemistry, Shanghai Academy of Life Sciences. The above cells were cultured in DMEM medium containing 10% fetal bovine serum (FBS). Cells were cultured in a cell incubator with saturated humidity and 5% CO2 at 37 °C until the cells were confluent to about 80%, and then passaged. Cells in logarithmic growth phase were digested with trypsin and inoculated into 48-well plates. When the cells grow to a density of 50%, the cells were transfected with lipofectamine™ 2000 according to the instructions. The experiments were divided into miR-NC and miR-153-3p mimic groups. MiR-NC and miR-153-3p mimic were designed and synthesized by Shanghai Jima Pharmaceutical Technology Co., Ltd. Besides, miR-153-3p inhibitor and siE2F3 was also designed, synthesized and transfected as above steps.
RNA Extraction and qPCR Assay
Total RNA was extracted from the cell line and tissue by TRIzol reagent, and the NanoDrop1000 spectrophotometer (Thermo Scientific, USA) was used to determine the RNA concentration. qPCR was performed using the SYBR premix EX TaqTM (Takara Corporation, Dalian, China) in the 7900HT fluorescent quantitative PCR system (Applied Biosystems, USA). U6 and β-actin was used as internal reference. Three parallel samples for each sample was set to be tested. The relative expression of miR-153-3p and E2F3 was quantitatively calculated by the 2−ΔΔCt method.
Cell Proliferation Experiment
According to the reagent instructions, CCK8 method was used to measure proliferation of cells in different groups. After digesting the cells in logarithmic phase, the cells in different groups were inoculated into 96-well plates at the number of 2 × 10³ cells/well. The volume of culture medium in each well was 100 μL. After 24 hours of incubation, 10 μL of CCK8 solution was added to each well. After culturing for 1 h, the absorbance value of each well was measured with a microplate reader at a wavelength of 450 nm. The experiment was repeated 3 times and the average value was taken. The proliferation curve was drawn with time as the abscissa and absorbance as the ordinate.
Flow Cytometry Assay
The cells in different group were digested into a single cell suspension, and the cell concentration was adjusted to 5 × 10⁵ cells/mL. Total 1 mL of cells were taken out, centrifuged at 1000 r/min for 10 min at 4 °C, and the supernatant was discarded. Then, 1 mL of cold PBS was added to the cell sample, gently shaken, centrifuged at 1000 r/min for 10 min at 4 °C, and the supernatant was discarded. The cells were resuspended in 200 μL of binding buffer, 10 μL of Annexin V-FITC and 5 μL of PI were added, mixed gently, and reacted at room temperature for 15 min in the dark. Flow cytometry was performed within 1 hour after reaction. The experiment was repeated 3 times and the average value was taken to calculate the cell cycle and apoptosis rate.
Transwell Assay
The transfected cells are digested with trypsin and repeatedly pipetted into suspension. After washing by PBS solution 3 times, the cells were resuspended in serum-free medium, and the cell concentration was adjusted to 1× 10⁵ cells/mL. One hundred μL of cell suspension was inoculated into transwell chamber. The upper chamber of the invasion experiment was with Matrigel. Five hundred μL of 10% FBS medium was added to the lower chamber, and incubated at 37 °C for 12 h. Cells that did not pass through the membrane were gently wiped with a cotton swab, and the membrane was fixed with 95% ethanol solution for 15 minutes. The cells were stained with 0.1% crystal violet for 10 minutes, washed with PBS solution 3 times, and then air-dried. Six fields of view were randomly selected under an inverted microscope, and the number of invasion and migration cells was counted and photographed.
Glycolysis Assay
Before the cell culture, the glucose concentration in the cell culture solution was measured according to the instructions. The result is expressed in units of mmol/L, which is converted to the initial glucose content A (mmol). After inoculating the cells of different groups into a 6-well plate, 3 parallel wells were set up. Glucose detection kit and lactic acid detection kit were purchased from Beijing Legian Biotechnology Co., Ltd. After the cells adhered, they were continuously cultured for 48 hours, and then the glucose content (A1) was measured again according to the instructions. Glucose uptake was calculated by A and A1 value. The detection of lactate production was carried out using the kit, and the final lactate level was also expressed with units of mmol/L.
Luciferase Reporter Experiment
The 3ʹ- untranslated region fragment of wild-type E2F3 was designed. Sequence design and synthesis was completed by Gema Biotech Co., Ltd., and plasmid construction was carried out. PCR amplification conditions were as follows: 50 μL of reaction system, preheating at 95 °C for 4 min, denaturation at 95 °C for 30 s, annealing at 55 °C for 30 s, extension at 72 °C for 90 s, 5 cycles; denaturation at 95 °C for 30 s, 60 °C Annealing for 30 s, extension at 72 °C for 90 s, 25 cycles; extension at 72 °C for 10 min, and storage at 4 °C. The recovered product and carrier were digested, and T4 DNA ligase was linearized and ligated to the CD163 3 ‘UTR fragment. The ligation product was transformed into competent E. coli DH5-α to screen positive clones. After transfection of miRNA-153-3p mimic, lysis buffer was added and shake vigorously for 15 min. After centrifugation at 10,000 r/min for 1 min, 20 μL of the supernatant was added to a 96-well plate, and the luciferase activity was detected using a multifunctional microplate reader.
RNA Pull Down Assay
To determine the possible interaction between miRNA-153-3p and E2F2, RNA pull down assay was processed. Briefly, the RNA was labeled with biotin based on the Pierce RNA 3ʹ end desthiobiotinylation kit. Total 300 μL phenol chloroform was used to extract successfully labeled RNA, and the supernatant was obtained by centrifugal. After RNA extraction, cell lysis and magnetic bead pretreatment were processed. Then, RNA and bead was combined. Cell lysate and pretreatment beads were incubated with cell lysate to form a miRNA-153-3p/E2F2 complex. After elution of the complex, pull-down product was detected by qPCR.
Western Blot Assay
Lysate was added to extract the total protein of the cell, and 30 μg of total protein per well was loaded. The total protein was electrophoresed in concentrated gel for 40 min and separated by gel electrophoresis for 2 h. The separated protein was transferred to the membrane by conventional wet method and sealed with 5% skimmed milk powder for 2 hours. Then, E2F3 primary antibody (1: 200) and secondary antibody goat anti-rabbit 1: 1000 were successively added and incubated. ECL solution was added, the protein was exposed by gel imaging system, and protein bands were quantified by Quantity One 1-D analysis software. The relative expression of the E2F3 protein was calculated by E2F3 protein and β-actin value.
Tumor Formation in Nude Mice
Animal experiments in this study were approved by the Animal Ethics Committee of Shanghai Jiao Tong University Affiliated Sixth People’s Hospital, which were performed in accordance with relevant guidelines and regulations of the Animal Care and Use Committees at the Shanghai Jiao Tong University Affiliated Sixth People’s Hospital, and a signed document issued by the Animal Care and Use Committees that granted approval was obtained. A total of 12 female nude mice (SPF grade) of BALB/c with a body mass of 15–20 g, 5-weeks-old, were purchased from the Experimental Animal Center of Xiangya Medical College of Central South. The living conditions of nude mice were as follows. The temperature of the animal room was 23 to 25 °C, and the humidity was 40% to 60%. Nude mice were randomly divided into 2 groups (TCP1-miR-NC group and TCP1-miR-153-3p mimic group). The cells in the logarithmic growth phase of each group were taken. After trypsin digestion, the cells were washed twice with PBS solution to make a single cell suspension, and the cell concentration was adjusted to 1 × 10⁷/mL. Transfectants were injected intratumorally every two days. The tumor size of nude mice in each group was measured every 5 days after tumor formation, and the maximum long diameter (L) and maximum transverse diameter (S) of the tumor were measured with vernier calipers. After 30 days, the nude mice were sacrificed, tumors were taken to observe and tumor weight was measured.
IHC Assay for Expression of Ki67 and E2F3
The tissue specimens were fixed in 10% neutral formalin solution for 6 to 12 hours, and were sliced continuously (thickness of 4 μm) after dehydration, transparent, and paraffin embedding. All antibodies (Ki67 and E2F3) immunohistochemical staining kits and other reagents were purchased from Shanghai Changdao Antibody Diagnostic Reagent Co., Ltd., and the experiments were performed in strict accordance with the instructions.
TUNEL for Apoptosis
The cell apoptosis was detected by the terminal deoxynucleotidyl transferase-mediated dUTP-biotin nick end labeling assay (TUNEL), and the operating steps were carried out according to the manufacturer’s instructions. The stained tissue cells were labeled with 4 ’, 6-diamidino-2-phenylindole (DAPI), and the proportion of TUNEL-labeled positive cells was observed under a fluorescent microscope.
Statistical Analysis
Graphpad 6.0 statistical software was used for statistical analysis. The measurement data was expressed as mean ± standard deviation ( ). The Student't t-test was used to determine the difference between the two groups. Kaplan-Meier curve was used to describe the relationship between survival rate and survival time of thyroid tumors patients. Pearson correlation coefficient was used to detect correlation between miR-153-3p and E2F3. P <0.05 was considered statistically significant.
Results
MiR-153-3p Expressed Lower in Thyroid Tumors and Cells
According to the TCGA database, the expression of miR-153-3p was detected, and miR-153-3p expressed lower in thyroid tumors (P = 9.4e-12, Figure 1A). Then, qPCR was processed to detect the expression of miR-153-3p in thyroid tumors. As the results, miR-153-3p expressed lower in thyroid tumors (Figure 1B). Moreover, miR-153-3p expression was closely related with TNM stage of patients. Thyroid tumor patients in higher stage were always with lower miR-153-3p expression (Figure 1C and Table 1). Similarly, patients with the maximum diameter of tumor larger than 2 cm were also with lower miR-153-3p level (Table 1). MiR-153-3p levels were also detected in THCA cell lines (TPC1, BCPAP, SW579, 8505C) and normal cell lines (Nthy-ori3-1 cell). Among of these cell lines, miR-153-3p levels in TPC1 and BCPAP cell lines was lowest (Figure 1D). Thereby, TPC1 and BCPAP cell lines were chose for following experiments.
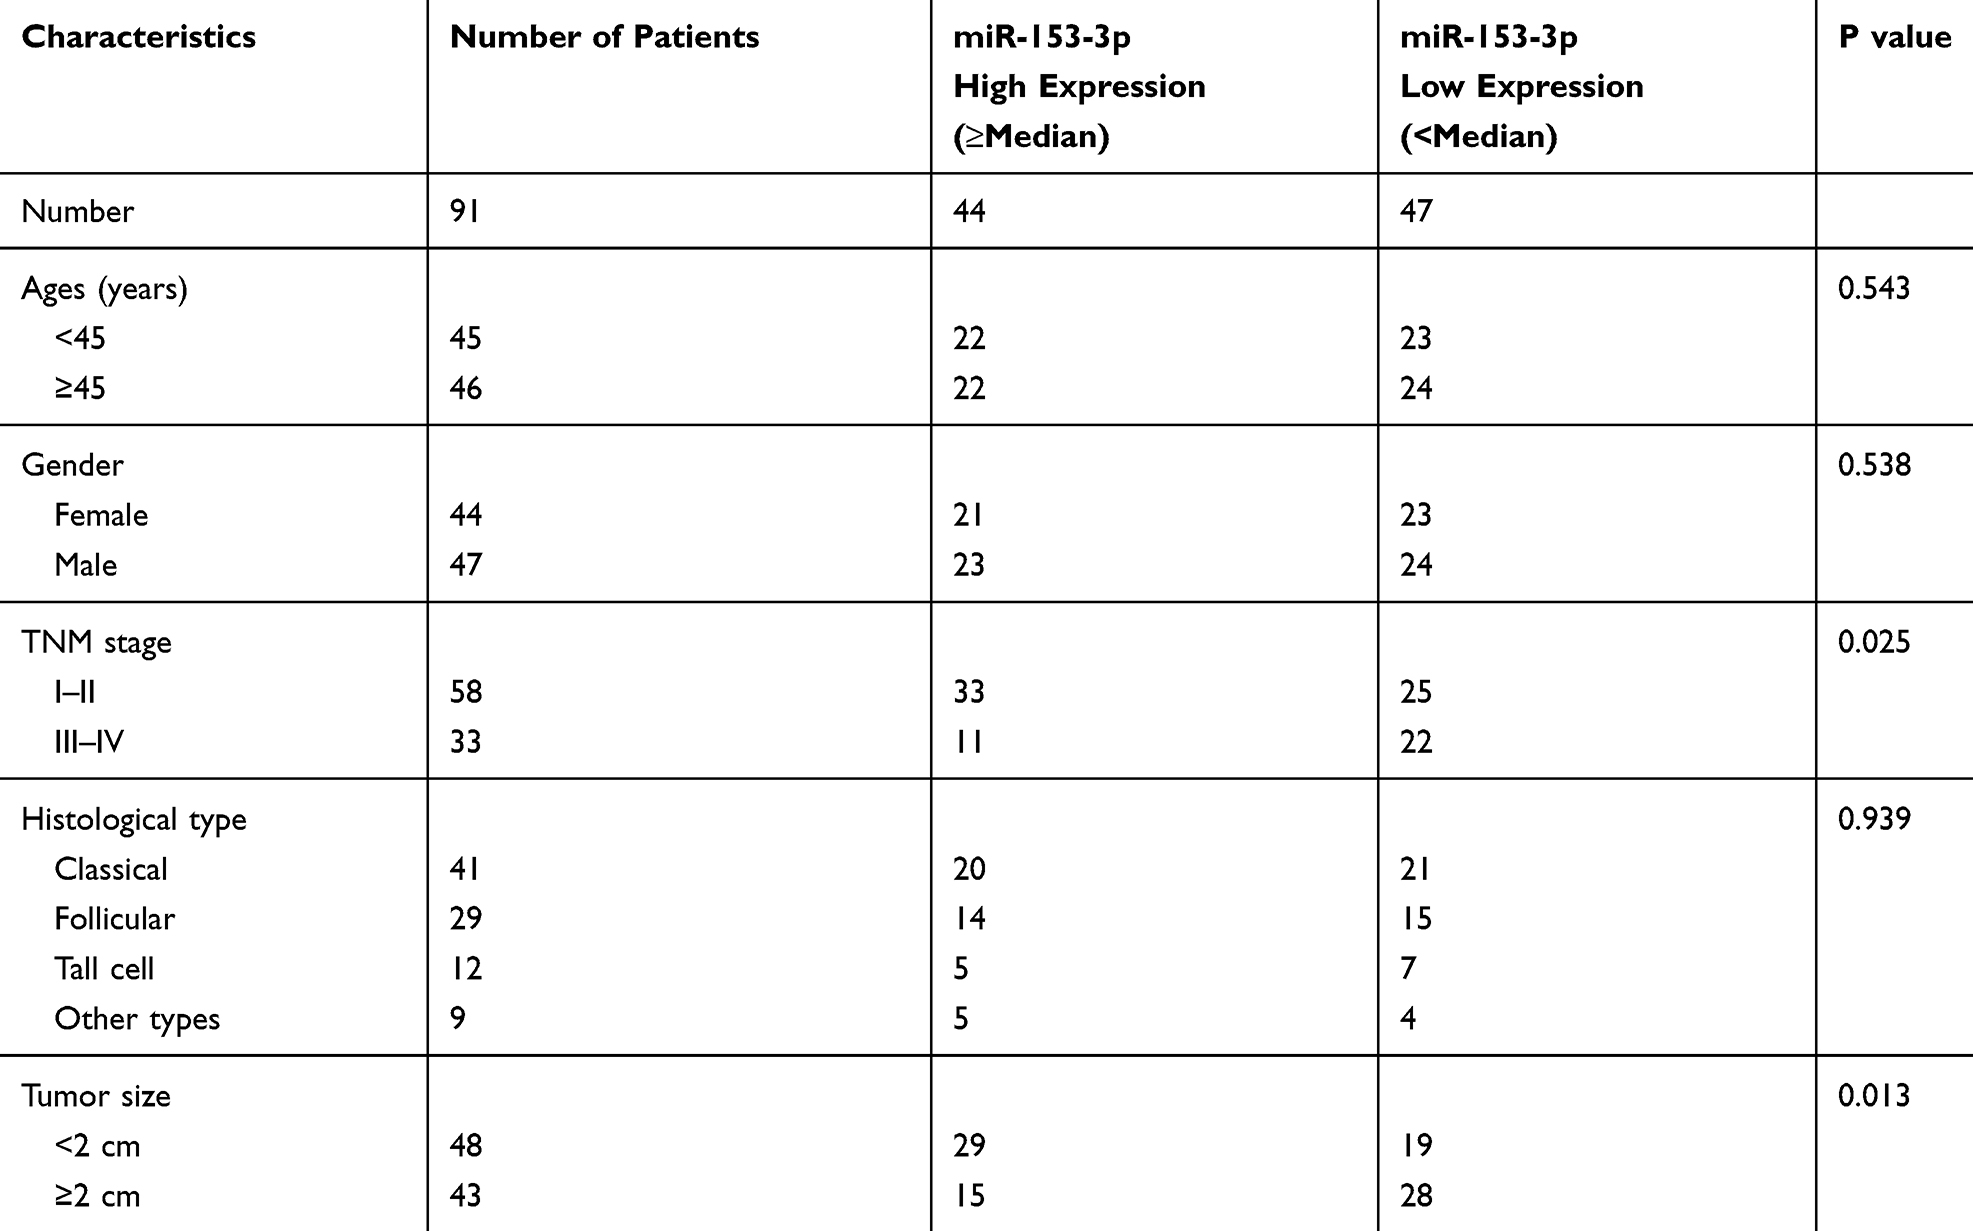 |
Table 1 The Correlation Between miR-153-3p Expression and THCA Clinical Pathology |
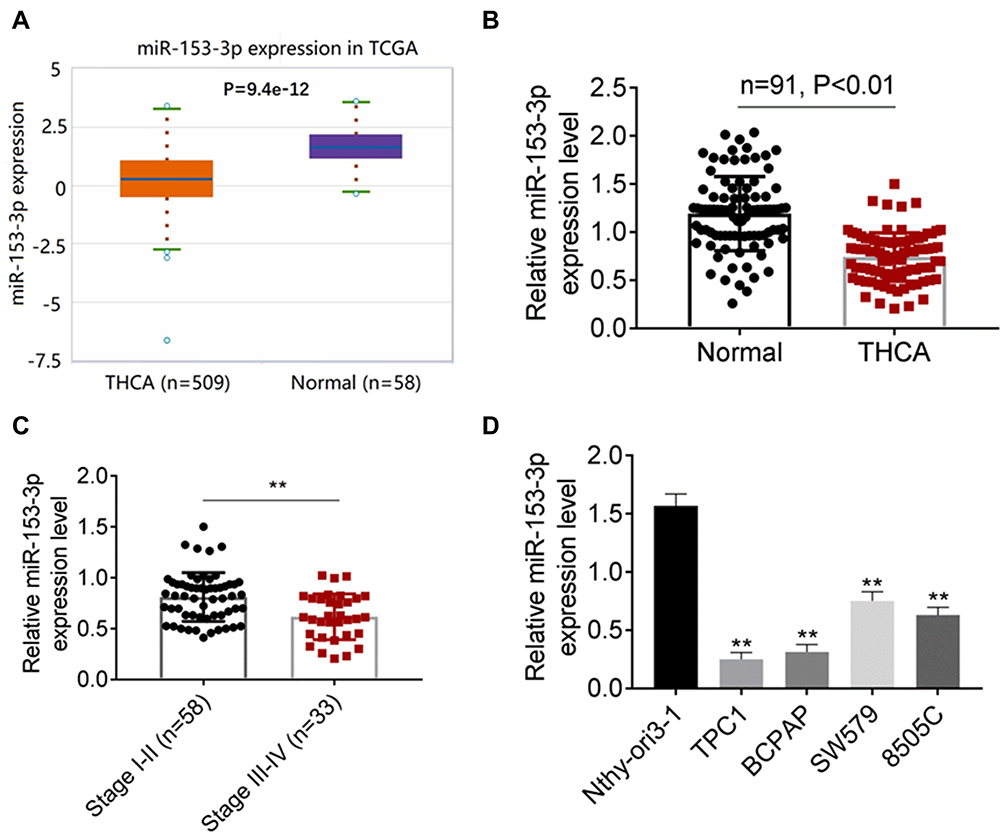 |
Figure 1 MiR-153-3p expressed lower in thyroid tumors and cells (A) The expression of miR-153-3p was detected based on TCGA database. (B). A total of 91 pairs of clinical cases were collected, and the expression of miR-153-3p was detected by QPCRQPCR. (C). qRT-PCR was processed to detect the expression of miR-153-3p in different TNM stages. I–II (n = 58), III–IV (33). (D). RT-PCR was used to detect the expression of miR-153-3p in THCA cell lines (TPC1, BCPAP, SW579, 8505C) and normal cell lines (Nthy-ori3-1 cell). **P < 0.01. |
MiR-153-3p Inhibits Development of Thyroid Tumor Cells
TPC-1 cells and BCPAP cells were transfected with miR-NC and miR-153-3p mimic. qPCR was used to detect transfection efficiency. As shown in Figure 2A, miR-153-3p mimic could increase the expression of miR-153-3p in both cell lines, which indicating that the transfection was successful. Then, CCK8 assay was undertaken to detect cell proliferation. After transfection for 72h, miR-153-3p mimic significantly decreased the proliferation of TPC-1 and BCPAP cells (Figure 2B). FCM assay was processed to detect apoptosis after transfection. Cycle arrest and apoptosis was induced in miR-153-3p mimic group (Figure 2C). Similar results were also obtained by transwell assay. Both migration and invasion was inhibited significantly after miR-153-3p was up-regulated (Figure 2D). Interestingly, glucose uptake and lactate production was lower in miR-153-3p mimic group than that in control, so glycolysis progress was also inhibited (Figure 2E). Thereby, miR-153-3p inhibits cell proliferation, invasion migration and glycolysis, and induces cycle arrest and apoptosis.
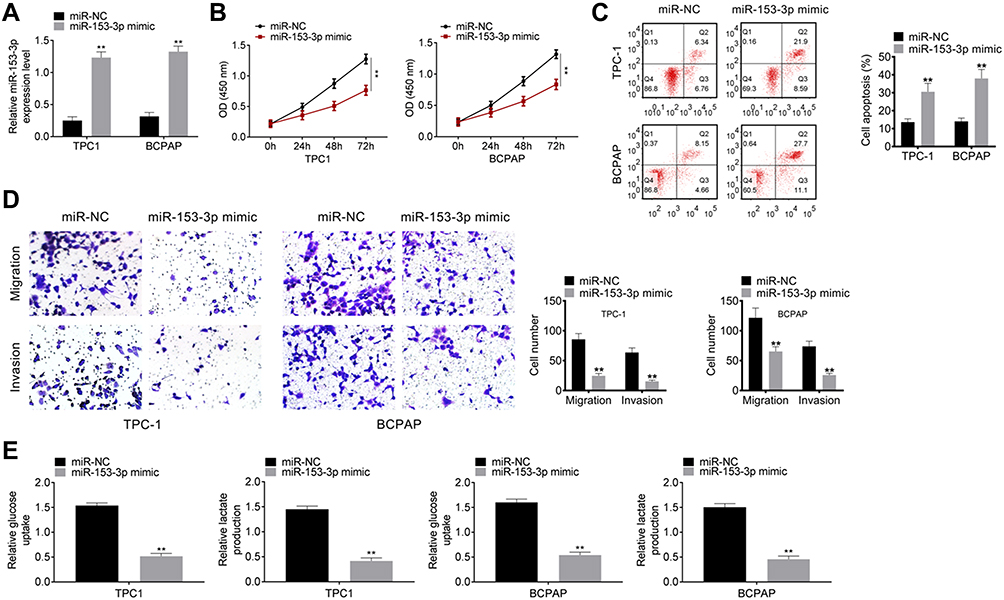 |
Figure 2 MiR-153-3p inhibits development of thyroid tumor cells (A) TPC-1 cells and BCPAP cells were transfected with miR-NC and miR-153-3p mimic. qPCR was processed to detect transfection efficiency. (B). After transfection, cell proliferation was detected by CCK8 assay. (C). Cell cycle and apoptosis were detected by FCM assay. (D). Transwell assay detected cell migration and invasion. (E). Glycolysis assay. **P < 0.01. |
miR-153-3p Targeted E2F3
Based on the targetscan database (http://www.targetscan.org/cgi-bin/targetscan/vert_71/view_gene.cgi?rs=ENST00000346618.3andtaxid=9606andmembers=miR-153-3pandshowcnc=0andshownc=0andsubset=1), there were binding site between miR-153-3p and E2F2, and the binding site was shown in Figure 3A. Luciferase reporter assay was undertaken to verify the binding site. In E2F3-WT group, the relative luciferase activity was significantly lower after miR-153-3p mimic transfection. However, there was no significant difference in E2F3-Mut group (Figure 3B). Moreover, RNA pull down experiments also verified the combination of miR-153-3p and E2F3 (Figure 3C). WB was processed to detected E2F3 expression in TPC-1 cells and BCPAP cells after miR-153 mimic and control transfection. After miR-153-3p mimic transfection, the expression of E2F3 was significantly down-regulated (Figure 3D). Based on the TCGA database, E2F3 expressed higher in THCA patients than that in normal (Figure 3E). E2F3 expression in THCA clinical samples was also detected by qPCR, and similar results were also obtained as Figure 3E (Figure 3F). Furthermore, miR-153-3p and E2F3 expression were with negative correlation (Figure 3G). Based on above evidences, miR-153-3p negatively targeted E2F3.
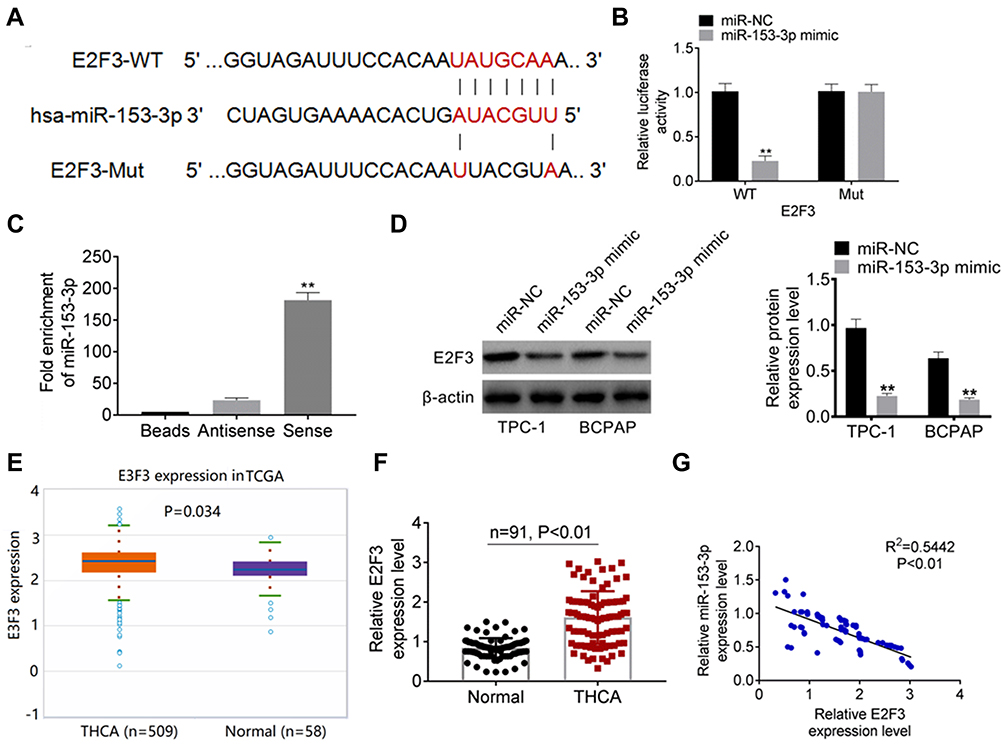 |
Figure 3 miR-153-3p targeted E2F3 (A) The binding site of miR-153-3p and E2F2 based on the database of targetscan. (B). Luciferase reporter assay for verifying the binding site. (C). The binding site was confirmed by RNA pull down assay. (D). WB detection for E2F3 expression in TPC-1 cells and BCPAP cells after miR-153-5p mimic and control transfection. (E). E2F3 expression in TCGA database. (F). E2F3 expression in THCA clinical samples was also detected by qPCR. (G). Correlation analysis of miR-153-3p and E2F2. **P < 0.01. |
SiE2F3 Decreased the E2F3 Level in Both TPC-1 and BCPAP Cell Lines
Rescue assay was processed to verify the role of E2F3 and miR-153-3p in thyroid cancer development. After miR-153-3p inhibitor transfection, E2F3 was significantly increased, while siE2F3 decreased the E2F3 level in both TPC-1 and BCPAP cell lines (Figure 4A and B). Thereby, the transfection was successful. Moreover, miR-153-3p inhibitor increased cell proliferation, invasion and migration, and inhibited cycle arrest and apoptosis (Figure 4C–E). Besides, it also accelerated glucose uptake and lactate production in thyroid cancer cells (Figure 4F). It is worth noting that siE2F3 decreased cell proliferation, invasion and migration, and improved cycle arrest and apoptosis in thyroid cancer cells.
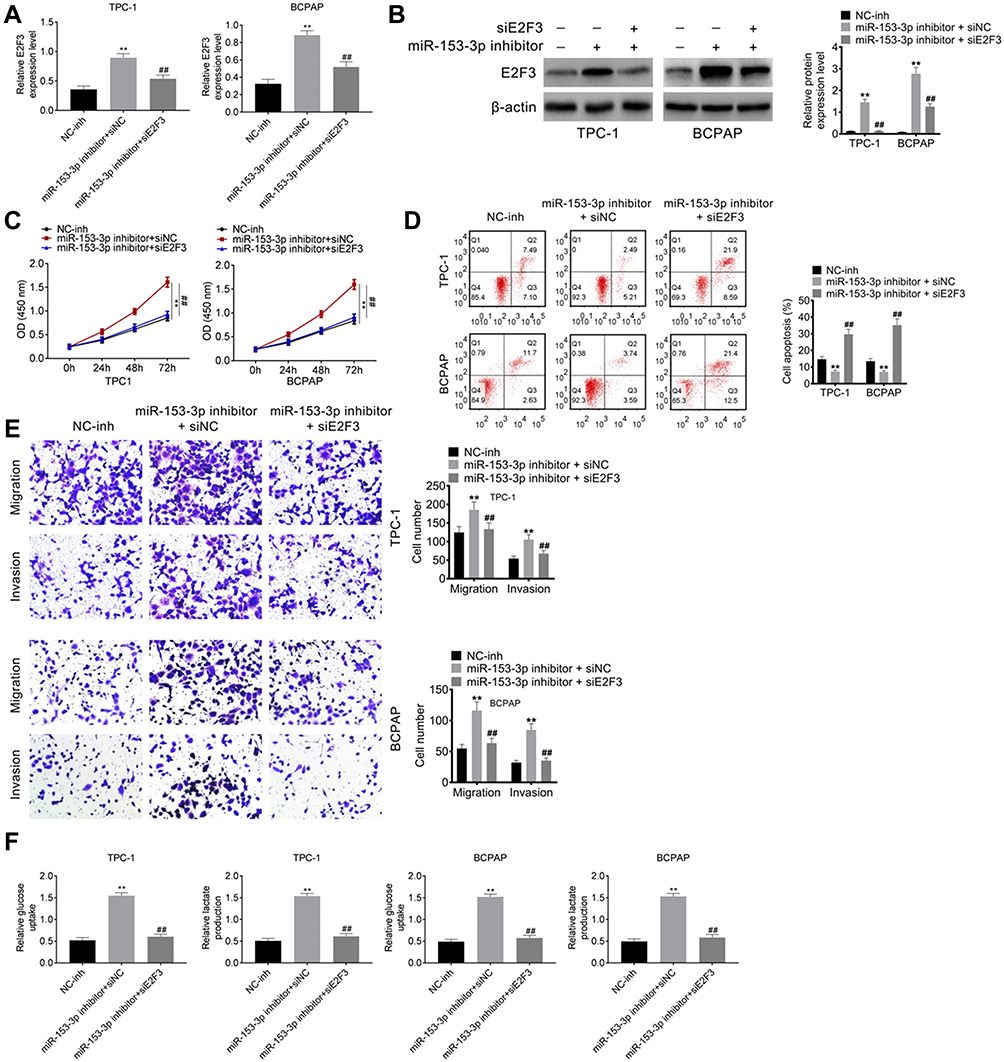 |
Figure 4 SiE2F3 should decrease the E2F3 level in both TPC-1 and BCPAP cell lines (A) qPCR detection for E2F3 expression after miR-153-5p inhibitor and siE2F3 transfection. (B). Western blot assay for E2F3 expression after transfection. (C). CCK8 assay for proliferation. (D). Cell cycle and apoptosis detected by flow cytometry. (E). Transwell assay for migration and invasion. (F). Glucose uptake and lactate production after transfection. Compared with NC-inh group, **P < 0.01; Compared with miR-163-3p inhibitor+siNC group, ##P < 0.01. |
MiR-153-3p Inhibited Tumor Development in vivo
After miR-153-3p mimic transfection, the expressions of miR-153-3p was increased and E2F3 was down-regulated, which indicated that the transfection was successful and miR-153-3p up-regulated E2F3 expression (Figure 5A). Importantly, miR-153-3p decreased tumor volume and weight (Figure 5B and C). Moreover, IHC assay was used for detecting Ki67 and E2F3 expression, and TUNEL assay was processed for apoptosis after transfection. As the results, miR-153-3p inhibited E2F3 and Ki67 expression, and also increased apoptosis in vivo (Figure 5D). Above all, miR-153-3p inhibited tumor development in vivo.
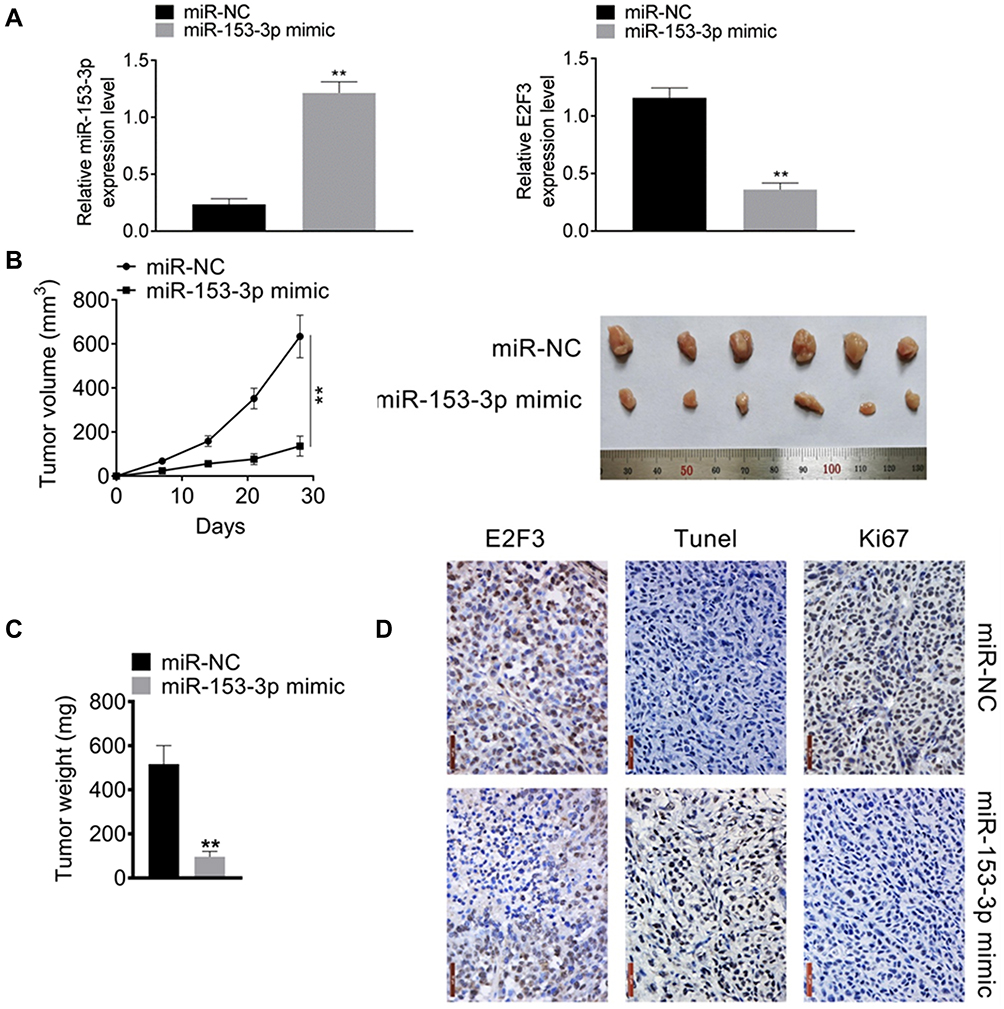 |
Figure 5 MiR-153-3p promoted tumor development in vivo (A) The expressions of miR-153-3p and E2F3 after miR-153-3p mimic transfection. (B). The effect of miR-153-3p mimic on tumor volume. (C). The effect of miR-153-3p mimic on tumor weight. (D). IHC assay for detecting of Ki67 and E2F3 expression, and TUNEL assay for apoptosis after transfection. **P < 0.01. |
Discussion
Fine needle aspiration cytology biopsy is the gold standard for preoperative diagnosis of thyroid tumors.16 However, there are still 20% to 30% patients who are undetermined. So far, there are no ideal biomarkers for the diagnosis of thyroid cancer, so it is of great clinical significance to research the effective biomarker for diagnosis and treatment of thyroid cancer. In this study, in order to investigate the role of miR-153-3p and E2F3 in the development of thyroid tumors, the molecular mechanism of miR-153-3p in cell proliferation, invasion and glycolysis of thyroid cancer was explored. As the results, miR-153-3p is lower expressed in thyroid tumors and cells. The level of miR-153-3p is negatively related with TNM stage of thyroid patient. MiR-153-3p inhibits cell proliferation, invasion migration, and induces cycle arrest and apoptosis.
MiR-153-3p has been regarded as a tumor suppressor gene in various cancers, such as cervical cancer,17 esophageal squamous cell carcinoma,18 malignant melanoma19 and breast cancer.20 In above cancers, miR-153-3p was confirmed to improve cancer progression by accelerating tumor growth, cell migration and invasion. In few studies, the role of miR-153-3p in thyroid cancer has been researched. Papillary thyroid cancer accounts for about 85% of thyroid cancer, which is the most common and the least malignant. Cui et al,21 referred that decreased miR-153-3p would effect ZNRF2 expression, and accelerate development of PTC. In addition, miR-153-3p was a critical miRNA in S6K signaling pathway, which played a suppressor role tumor genesis of medullary thyroid.22 It was worth noting that S6k had important contributions to the development of thyroid lesions and even developed to follicular carcinoma.23 Similar results were also obtained in this study. MiR-153-3p inhibited cell proliferation, invasion migration and glycolysis, and induces cycle arrest and apoptosis in this study. Thereby, miR-153-3p was a critical tumor suppressor gene in thyroid cancer.
Moreover, miR-153-3p suppressed tumor development, inhibits E2F3 and Ki67 expression, and also increases apoptosis of thyroid cancer cells in vivo in this study. As a member of the E2F family, E2F3 was involved in cell proliferation and regulation. Moreover, E2F3 could form a dimer with cyclin D1 and participate in the regulation of the cell cycle, which is related to a variety of oncogenic and tumor suppressor genes.24 In 2020, Zhao et al,25 referred that the peripheral blood E2F3 could be regarded as a potential diagnostic biomarker for PTC. Vormbrock et al,26 also confirmed that the absence of E2F3 promoted the development of medullary thyroid carcinomas (MTCs). Besides, circPRMT5 could regulate E2F3 expression, and then improve invasion and proliferation of PRC.27 Above evidences were consistent with our results, siE2F3 could rescue effects of miR-153-3p inhibitor in thyroid cancer development. Besides, Ki67 is one of the most widely studied indicators of cell proliferation, which is involved in the occurrence and development of tumors.28 The expression of Ki67 increased in MTCs, which was closely related to the metastasis, recurrence, and prognosis of patients.29 Furthermore, Ki67 and smac were negatively correlated in thyroid cancer, which might have a synergistic role in the development of this disease.30 For these reasons, we concluded that miR-153-3p suppresses cell proliferation, invasion and glycolysis of thyroid cancer through inhibiting E2F3 and Ki67 expression.
Importantly, miR-153-3p suppressed glycolysis of thyroid cancer in this study. As previous studies reported, abnormal glucose metabolism was closely related to the pathogenesis of tumors, which is also an important feature of tumor cells.31 A high level of glycolysis produces a large amount of lactic acid, which can cause decreased pH value in the microenvironment of tumor cells, thereby improving the proliferation ability of tumor cells.32 After miR-153-3p mimic transfection, cell proliferation, invasion and glycolysis of thyroid cancer was suppressed in this study. Therefore, miR-153-3p mimic could reduce the ability of thyroid cells to produce and transport lactic acid, that is, inhibit the tumor’s glycolysis ability and interfere with malignant behavior.
In conclusion, miR-153-3p suppresses cell proliferation, invasion and glycolysis of thyroid cancer through inhibiting E3F3 expression, which might be a novel biomarker for thyroid cancer diagnose.
Disclosure
The authors report no conflicts of interest for this work.
References
1. Marina N, Nikiforova YEN. Molecular genetics of thyroid cancer: implications for diagnosis, treatment and prognosis. Expert Rev Mol Diagn. 2008;8(1):83–95. doi:10.1586/14737159.8.1.83
2. Hussain F, Iqbal S, Mehmood A, Bazarbashi S, Elhassan T. Incidence of thyroid cancer in the Kingdom of Saudi Arabia, 2000–2010. Hematol Oncol Stem Cell Ther. 2013;6(2):58–64. doi:10.1016/j.hemonc.2013.05.004
3. Zimmermann MB, Galetti V. Iodine intake as a risk factor for thyroid cancer: a comprehensive review of animal and human studies. Thyroid Res. 2015;8(1):8. doi:10.1186/s13044-015-0020-8
4. Brozzi F, Rago T, Bencivelli W. Salivary glands ultrasound examination after radioiodine-131 treatment for differentiated thyroid cancer. J Endocrinol Invest. 2013;36(3):153–156.
5. Teama SH, Agwa SHA, Fawzy A, Sayed MM, Ibrahim WA, Eid YM. Molecular detection of circulating thyroid specific transcripts (TSHR/Tg-mRNAs) in thyroid cancer patients: their diagnostic significance. Egyptian J Med Human Gene. 2011;12:201–209. doi:10.1016/j.ejmhg.2011.08.002
6. Wang Y, Yu Y, Tsuyada A, et al. Transforming growth factor-Î2 regulates the sphere-initiating stem cell-like feature in breast cancer through miRNA-181 and ATM. Oncogene. 2011;30(12):1470–1480. doi:10.1038/onc.2010.531
7. Oberg AL, French AJ, Sarver AL, et al. miRNA expression in colon polyps provides evidence for a multihit model of colon cancer. PLoS One. 2011;6(6):e20465. doi:10.1371/journal.pone.0020465
8. Zhibin H, Jiaping C, Xiaoyi Z. Genetic variants of miRNA sequences and non–small cell lung cancer survival. J Clin Invest. 2008.
9. Mittal A, Chitkara D, Behrman SW. Efficacy of gemcitabine conjugated and miRNA-205 complexed micelles for treatment of advanced pancreatic cancer. Biomaterials. 2014;35(25):7077–7087. doi:10.1016/j.biomaterials.2014.04.053
10. Lodewijk L. The value of miRNA in diagnosing thyroid cancer: A systematic review. Cancer Biomarkers. 2012;11(6):229–238. doi:10.3233/CBM-2012-0273
11. Tomasz S, Danuta G. Differences in miRNA and mRNA profile of papillary thyroid cancer variants. Int J Endocrinol. 2016;2016:
12. Pallante P, Federico A, Berlingieri MT, et al. Loss of the CBX7 gene expression correlates with a highly malignant phenotype in thyroid cancer. Cancer Res. 2008;68(16):6770–6778. doi:10.1158/0008-5472.CAN-08-0695
13. Mardente S, Mari E, Consorti F. HMGB1 induces the overexpression of miR-222 and miR-221 and increases growth and motility in papillary thyroid cancer cells. Oncol Rep. 2012;28(6):2285–2289. doi:10.3892/or.2012.2058
14. Keutgen XM, Filicori F, Crowley MJ, et al. A panel of four miRNAs accurately differentiates malignant from benign indeterminate thyroid lesions on fine needle aspiration. Clinical Cancer Research. 2011;213(3):S28–S29.
15. Wu Z, He B, He J. Upregulation of miR-153 promotes cell proliferation via downregulation of the PTEN tumor suppressor gene in human prostate cancer. Prostate. 2013;73(6):596–604. doi:10.1002/pros.22600
16. Varhaug JE, Segadal E, Heimann P. The utility of fine needle aspiration biopsy cytology in the management of thyroid tumors. World J Surg. 1981;5(4):573–577. doi:10.1007/BF01655012
17. Li L, Lai X, Yuan C, et al. Aberrant expression of miR153 is associated with the poor prognosis of cervical cancer. Oncol Lett. 2018;15:
18. Donglei L, Min G. LINC00152 facilitates tumorigenesis in esophageal squamous cell carcinoma via miR-153-3p/FYN axis. Biomedicine Pharmacotherapy. 2019.
19. Luan W, Shi Y, Zhou Z, Xia Y. circRNA_0084043 promote malignant melanoma progression via miR-153-3p/Snail axis. Biochem Biophys Res Commun. 2018;502(1):22–29. doi:10.1016/j.bbrc.2018.05.114
20. Leinan Q, Weixin J, Duan G. LncRNA cancer susceptibility candidate 15 accelerates the breast cancer cells progression via miR-153-3p/KLF5 positive feedback loop. Biochem Biophys Res Commun. 2018.
21. Zhenghui C, Zhiyan L, Zimei L, Liuhong S. Long non-coding RNA TTN-AS1 facilitates tumorigenesis of papillary thyroid cancer through modulating the miR-153-3p/ZNRF2 axis. J Gene Medicine. 2019.
22. Joo LJS, Weiss J, Gill AJ, Clifton-Bligh R. Abstract 501: A RET-related microRNA, miR-153-3p, acts as a tumor suppressor in medullary thyroid carcinoma (MTC) via S6K signaling. Cancer Res. 2018;78(13 Supplement):501.
23. Arciuch VGA. Abstract 2326: S6K activation is essential for the development of follicular thyroid cancer. Cancer Res. 2013;73(8 Supplement):2326.
24. Wei H, Feng Y, Liang J, et al. Abstract 10616: mir-128 targets E2f3 to regulate cardiomyocyte cell cycle re-entry. Circulation. 2013;22:A10616.
25. Zhao Y, Zhao Z, Wu F, Wang D. Evaluation of peripheral blood E2F3 mRNA as a potential diagnostic biomarker in human papillary thyroid cancer. ResearchGate.2020. doi:10.21203/rs.3.rs-58122/v1
26. Vormbrock K, Schreiber C, Loddenkemper C. Abstract C36: using the Rb/E2f3 mutant mouse model to reveal markers for the progression to metastasis. Cancer Res. 2009;69(23 Supplement):C36–C36.
27. Xue C, Cheng Y, Wu J, Ke K. Circular RNA CircPRMT5 accelerates proliferation and invasion of papillary thyroid cancer through regulation of miR-30c/E2F3 Axis. Cancer Manag Res. 2020;12:3285–3291. doi:10.2147/CMAR.S249237
28. Singh S, Choudhury M. Diagnostic utility of ki67 and p53 immunostaining on solitary thyroid nodule - A cytohistological and radionuclide scintigraphic study. Indian J Pathol Microbiol. 2011;54:472. doi:10.4103/0377-4929.85077
29. Tisell LE, Oden A, Muth A, Altiparmak G, M?Lne J, Ahlman H. The Ki67 index a prognostic marker in medullary thyroid carcinoma. Br J Cancer. 2003;89(11):2093–2097. doi:10.1038/sj.bjc.6601453
30. Deng WK. Expression of smac and ki67 in thyroid carcinoma and its clinical significance. Cancer Res Prevention Treatment. 2008.
31. Rashtak S, Demars CJ, Lomberk GA, Stein R, Urrutia RA. M1747 Knockout of KLF11, a tumor suppressor for pancreatic cancer, displays an abnormal glucose metabolism. Gastroenterology. 2009;136(5):A–423. doi:10.1016/S0016-5085(09)61947-8
32. Li Y, Xu Q, Yang W, Wu T, Lu X. Oleanolic acid reduces aerobic glycolysis-associated proliferation by inhibiting yes-associated protein in gastric cancer cells. Gene. 2019;712:143956. doi:10.1016/j.gene.2019.143956
 © 2021 The Author(s). This work is published and licensed by Dove Medical Press Limited. The full terms of this license are available at https://www.dovepress.com/terms.php and incorporate the Creative Commons Attribution - Non Commercial (unported, v3.0) License.
By accessing the work you hereby accept the Terms. Non-commercial uses of the work are permitted without any further permission from Dove Medical Press Limited, provided the work is properly attributed. For permission for commercial use of this work, please see paragraphs 4.2 and 5 of our Terms.
© 2021 The Author(s). This work is published and licensed by Dove Medical Press Limited. The full terms of this license are available at https://www.dovepress.com/terms.php and incorporate the Creative Commons Attribution - Non Commercial (unported, v3.0) License.
By accessing the work you hereby accept the Terms. Non-commercial uses of the work are permitted without any further permission from Dove Medical Press Limited, provided the work is properly attributed. For permission for commercial use of this work, please see paragraphs 4.2 and 5 of our Terms.