")
Back to Journals » OncoTargets and Therapy » Volume 13
miR-145 Inhibits Th9 Cell Differentiation by Suppressing Activation of the PI3K/Akt/mTOR/p70S6K/HIF-1α Pathway in Malignant Ascites from Liver Cancer
Authors Huang YY , Jiang HX, Shi QY, Qiu X, Wei X, Zhang XL, Qin SY
Received 9 January 2020
Accepted for publication 10 April 2020
Published 5 May 2020 Volume 2020:13 Pages 3789—3800
DOI https://doi.org/10.2147/OTT.S245346
Checked for plagiarism Yes
Review by Single anonymous peer review
Peer reviewer comments 3
Editor who approved publication: Dr Sanjeev K. Srivastava
You-Yi Huang, Hai-Xing Jiang, Qiu-Yue Shi, Xin Qiu, Xi Wei, Xiang-Lian Zhang, Shan-Yu Qin
Department of Gastroenterology, The First Affiliated Hospital of Guangxi Medical University, Nanning, Guangxi 530021, People’s Republic of China
Correspondence: Shan-Yu Qin
Department of Gastroenterology, The First Affiliated Hospital of Guangxi Medical University, Nanning 530021, People’s Republic of China
Tel +86 13977110511
Email [email protected]
Purpose: Our previous experiments confirmed that T helper type 9 (Th9) cells were involved in the occurrence and development of malignant ascites caused by liver cancer. The current study investigated the mechanism underlying microRNA (miR-145)-mediated inhibition of Th9 cells in an malignant ascites model with liver cancer.
Materials and Methods: CD4+ T cells were induced to differentiate Th9 cells after transfection with miR-145 mimics or negative control. A malignant ascites mouse model was transfected with miR-145agomir or negative control. Th9 cells were detected by flow cytometry. Enzyme-linked immunosorbent assay was applied to detect the interleukin 9 (IL-9) cytokine and hypoxia-inducible factor 1 alpha (HIF-1α). RT-PCR was used to detect the expression of miR-145 and phosphatidylinositol-3-kinase/Akt/mammalian target of rapamycin/p70 ribosomal protein S6 kinase/HIF-1α (PI3K/Akt/mTOR/p70S6K/HIF-1α) mRNA. Western blotting and immunofluorescence were performed to detect the expression of PI3K/Akt/mTOR/p70S6K/HIF-1α-related proteins.
Results: In vitro experiments showed that miR-145 inhibited Th9 cell polarization, HIF-1α expression, and PI3K/Akt/mTOR/p70S6K pathway activation. In the malignant ascites mouse model, miR-145 also demonstrated inhibitory effects on Th9 cell differentiation through the PI3K/Akt/mTOR/p70S6K/HIF-1α pathway.
Conclusion: miR-145 may inhibit Th9 cell differentiation through the PI3K/Akt/mTOR/p70S6K/HIF-1α pathway. These findings suggest a novel therapeutic target for malignant ascites from liver cancer.
Keywords: miR-145, Th9 cells, PI3K/Akt, HIF-1α, hepatoma malignant ascites
Introduction
As reported by the study of Global Burden of Disease on primary liver cancer, liver cancer was the sixth most common cancer worldwide and the fourth most common cause of cancer-related death in 2015.1 Most patients with liver cancer produce a large amount of ascites in the later stage, which seriously affects their quality of life. At present, the quality of life of patients with liver cancer ascites is improved mainly through traditional Chinese medicine, but the effects differ visibly across individuals.2,3 Thus, it is important to seek other effective treatments. In recent years, research on targeted drugs based on microRNAs has made great progress. MicroRNAs (miRNAs) are a class of small non-coding, single-stranded RNAs that play an important role in many cellular processes such as tumorigenesis and immune defense.4,5 Aberrant expression of miRNAs has been reported in several human cancers, including liver, colon, and pancreatic cancers.6–8 MiR-145 is commonly downregulated in a variety of malignancies and regulates the development and function of helper T cells.9–11 Our previous experiments confirmed that there was a significant negative correlation between the expression of miR-145 and the number of T helper type 9 (Th9) cells in liver cancer malignant ascites (MA) (Supplementary Figure 1, r=−0.405, P=0.011).12 These data suggested that miR-145 could interact with Th9 cells to promote their biological effects in MA, but the underlying mechanism remains unclear.
The phosphatidylinositol-3-kinase/Akt/mammalian target of the rapamycin (PI3K/Akt/mTOR) signaling pathway plays an important role in regulating cell proliferation, invasion, metastasis, cell cycle, apoptosis, and various metabolic functions, as well as in cancer progression.13,14 Activation of the PI3K/Akt/mTOR/p70 ribosomal protein S6 kinase (p70S6K) signaling pathway in malignant pleural effusion is closely related to the epithelial-mesenchymal transition (EMT) and cancer stem cells (CSCs). LY294006 (PI3K inhibitor) could significantly inhibit elevation in the EMT and CSCs.15 Dual-luciferase reporter gene assays showed that miR-145 mimics significantly downregulated Akt3 activity in rats.16 Elevated expression of miR-145 in laryngeal squamous cell carcinoma may enhance the inhibitory effect on the PI3K/Akt/mTOR signaling pathway, and inhibit the proliferation, migration, and invasion of cancer cells, as well as induce apoptosis.17
Hypoxia-inducible factor 1 alpha (HIF-1α) is a downstream regulator of mTORC1/p70S6K. Overexpression of miR-145 downregulated the expression of HIF-1α by targeting p70S6K1, thus inhibiting the growth and angiogenesis of colon cancer cells.18 mTOR/HIF-1α-dependent glycolytic activity was a necessary condition for Th9 cell differentiation. HIF-1α deficiency inhibited interleukin 9 (IL-9) mRNA synthesis, IL-9 secretion, and Th9 differentiation. Chromatin immunoprecipitation coupled with quantitative PCR further confirmed that HIF-1 α could directly target the IL-9 promoter region and control the production of IL-9.19 However, whether miR-145 has an impact on the expression of Th9 cells in MA remains unknown.
Therefore, we conducted this study to verify whether miR-145 acts on Th9 cell differentiation in MA through the PI3K/Akt/mTOR/p70S6K/HIF-1α pathway.
Materials and Methods
Animal
Male C57BL/6 mice at 4 to 6 weeks old were purchased from the Experimental Animal Center of Guangxi Medical University (Guangxi, China). All mice were specific pathogen-free grade animals fed in a barrier environment (Animal License No. SYXK Gui 2014–0002). All procedures for handling the animals were approved by the Animal Experiments Ethics Committee of Guangxi Medical University and were in compliance with the “Guiding Opinions on Treating Experimental Animals” issued by the Ministry of Science and Technology of the People’s Republic of China and the National Standard GB/T35892-2018 “Guidelines for the Ethical Review of Experimental Animal Welfare”.
CD4+T Cell Isolation, Transfection, and Induction
Healthy C57BL/6 mice were sacrificed by cervical dislocation. CD4+ T cells were obtained from the spleen using the EasySep™ Mouse Naïve CD4+ T Cell Isolation Kit (Stemcell Technologies, Cambridge, MA, USA) and cultured in Roswell Park Memorial Institute (RPMI) 1640 media containing 10% fetal bovine serum (FBS). MiR-145 mimics or negative control (NC) (Bioneer, Daejeon, Korea) were transfected into the CD4+T cells. Subsequently, TGF-β (R&D Systems, Minneapolis, MN, USA) and IL-4 (R&D Systems) were used to induce CD4 + T cells to polarize into Th9 cells.
Construction of an MA Mouse Model and Transfection with miR-145
Ten mice were randomly divided into the miR-145agomir group and negative control group. Each mouse was intraperitoneally injected with 0.5 mL liver cancer H22 cells at a density of 1×10⁷cells/mL. After 24 hours, mice were intravenously injected with Entranster TM-in vivo (Engreen Biosystem Ltd., Beijing, China) and mmu-miR-145-5pagomir or negative control oligonucleotides (GenePharma, Suzhou, China), at 3 mg/kg, once every 3 days for a total of five times (days 2, 5, 8, 11, and 14). The injection volume was 0.3 mL. The mmu-miR-145-5pagomir sequence was as follows: forward, 5′−GUCCAGUUUUCCCAGGAAUCCCU−3′; reverse, 5 ′−GGAUUCCUGGGAAAACUGGACUU−3′. On day 15, the mice were sacrificed and the spleen tissue was isolated.
HE Staining of Liver Cancer Ascites Smear
A liver cancer ascites model was constructed over two weeks, and 1 mL liver cancer ascites was extracted under aseptic conditions and centrifuged at 2000 r/min for 5 min. Then 0.5 mL supernatant was removed, resuspended, dropped on a glass slide, and evenly spread on the cells. The sample was fixed with 95% absolute ethanol overnight, stained with hematoxylin for 1 min, differentiated with hydrochloric acid and alcohol, stained with eosin for 90 s, dehydrated, fixed with hydrochloric acid, dried, and sealed with neutral gum.
RNA Isolation and RT-PCR Analysis
MiRNA was extracted by the miRNeasy Micro Kit (Qiagen, Hilden, Germany), RNA samples were reverse transcribed into cDNA with the miRcute Enhanced miRNA cDNA First Strand Synthesis Kit (Tiangen Biotech, Beijing, China), and quantitative PCR (qPCR) was performed using the miRcute Enhanced miRNA Fluorescence Quantification Kit (SYBR Green; Tiangen) according to the manufacturer’s instructions. Total RNA from cells and spleen tissue samples were isolated with Trizol reagent (Invitrogen, Beijing, China). RNA samples were reverse transcribed into cDNA by the Transcriptor First Strand cDNA Synthesis Kit (Roche, Basel, Switzerland), and qPCR was performed using FastStart Universal SYBR Green Master (ROX) (Roche) according to the manufacturer’s instructions. The primer sequences used for amplification are shown in Table 1. The expression levels of miR-145 were normalized to the U6 endogenous control, and the expression levels of PI3K/Akt/mTOR/p70S6K/HIF-1α mRNA were normalized to the GAPDH exogenous control, which were all measured using the 2−∆∆Ct method.
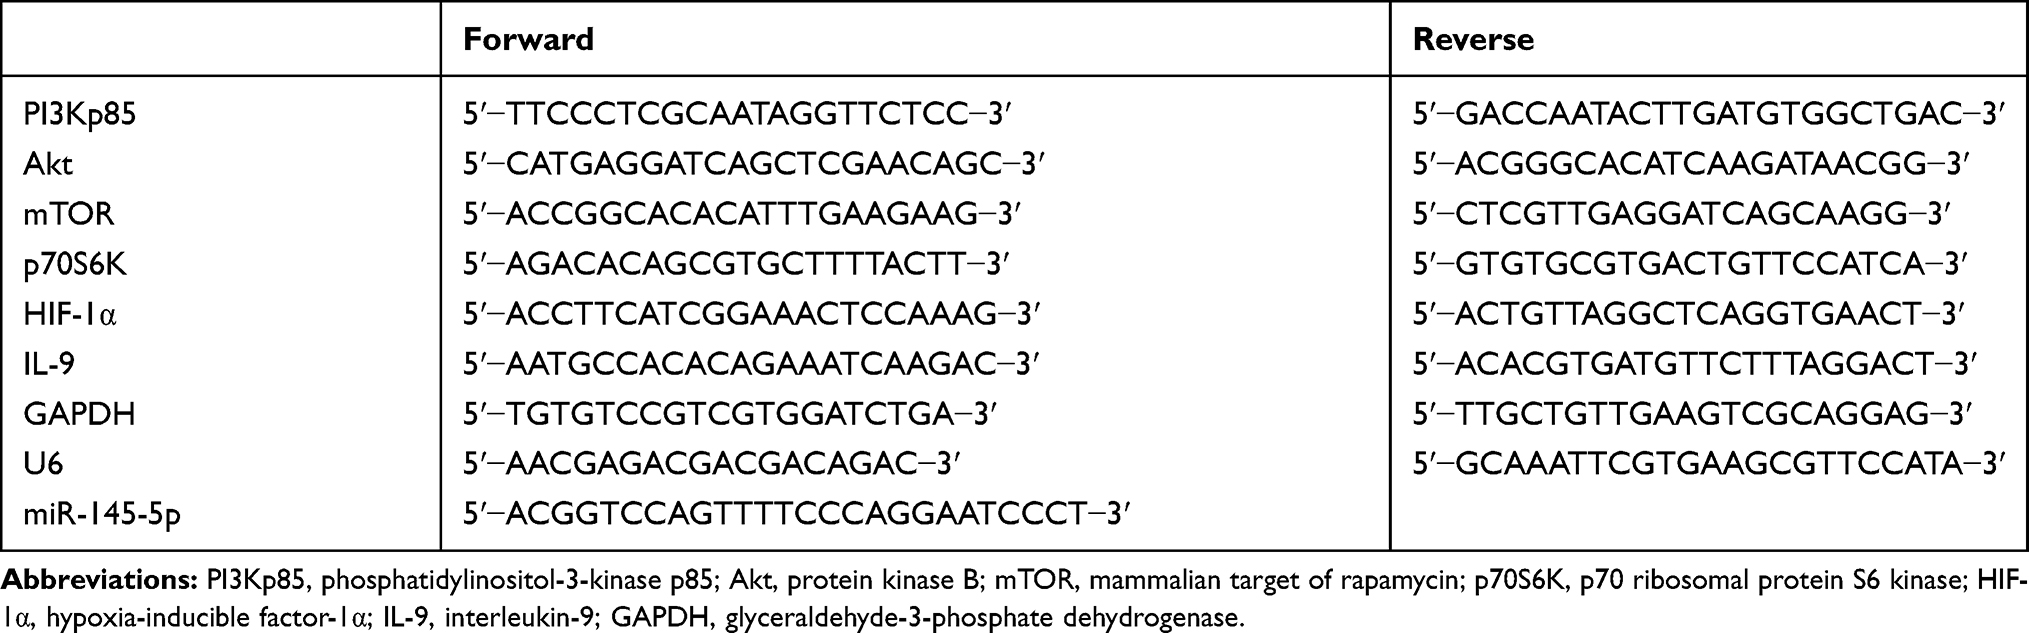 |
Table 1 Primer Sequence of RT-PCR |
Flow Cytometry
PerCP-Cy™5.5 Rat Anti-Mouse CD4, Alexa Fluor® 647 Armenian Hamster anti-Mouse IL-9, Alexa Fluor® 647 Hamster IgG2, Isotype Control, Fixation/Permeabilization Solution Kit, and Leukocyte Activation Cocktail were purchased from Becton Dickinson (Franklin Lakes, NJ, USA). Data were analyzed using FlowJo7.6 software.
Immunofluorescence
Cells were collected in 2 mL tubes. After fixing, permeabilization of the membrane, and blocking, cells were incubated with primary antibody at 4°C overnight, followed by incubation with secondary antibody at room temperature for 1 h, and staining with DAPI for 10 min. Cells were observed with a confocal microscope. This experiment was repeated three times.
Western Blot Analysis and Enzyme-Linked Immunoassay
Spleen tissues were lysed, and supernatants were centrifuged and quantified with a bicinchoninic acid (BCA) Protein Assay kit. The expression of PI3K/Akt/mTOR/p70S6K/HIF-1α-related proteins were detected by Western blot analysis. The antibodies used for Western blotting are the same as those used for immunofluorescence. These experiments were repeated three times. IL-9 and HIF-1α expression was detected by enzyme-linked immunoassay (ELISA) kits according to the manufacturer’s instructions. ELISA results were compared with the BCA results, and the concentrations of IL-9 and HIF-1α (pg/mg) were calculated.
Statistical Analyses
Statistical analysis was performed using SPSS 22.0 software. The comparison of continuous data between the two groups was performed using the Student’s t-test. Results are presented as the mean ± standard deviation. A P value less than 0.05 is considered statistically significant.
Results
Indicators of Model Success
After 6–7 days of modeling, the mice in each group presented with reduced food intake, decreased activity, and dry hair that easily shed. Compared with the NC group, the abovementioned symptoms in the mir-145agomir group were alleviated. Two weeks after modeling, the mouse abdomens were significantly swollen. However, compared with the NC group, the miR-145agomir group had less abdominal distension (Figure 1A). Ascites smears and H&E staining showed considerable nuclear staining and lymphoblastic H22 liver cancer cells (Figure 1B).
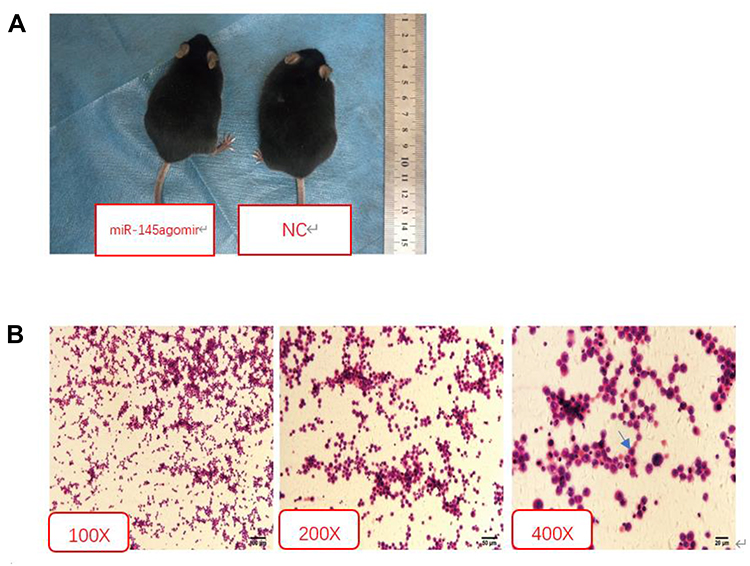 |
Figure 1 Indicators of model success. (A) Compared with the NC group, the miR-145agomir group had less abdominal distension. (B) H&E staining showed large nuclear staining, lymphoblastic liver cancer H22 cells. Abbreviations: NC, negative control; H&E, hematoxylin & eosin. |
miR-145 Inhibits Th9 Cell Polarization in vitro
CD4+ T cells were obtained from the spleen and transfected by MiR-145 mimics or NC. Subsequently, transforming growth factor beta (TGF-β) and IL-4 were added to a final concentration of 2 ng/mL and 10 ng/mL, respectively. After 72 h, the RT-PCR results showed that the expression of miR-145 increased, while that of IL-9 decreased in the miR-145 mimics group (Figure 2A and B). Flow cytometry and ELISA showed that IL-9 expression was downregulated in the miR-145 mimics group (Figure 2C–E). Taken together, these results showed that overexpression of miR-145 inhibited Th9 cell polarization and IL-9 expression in vitro.
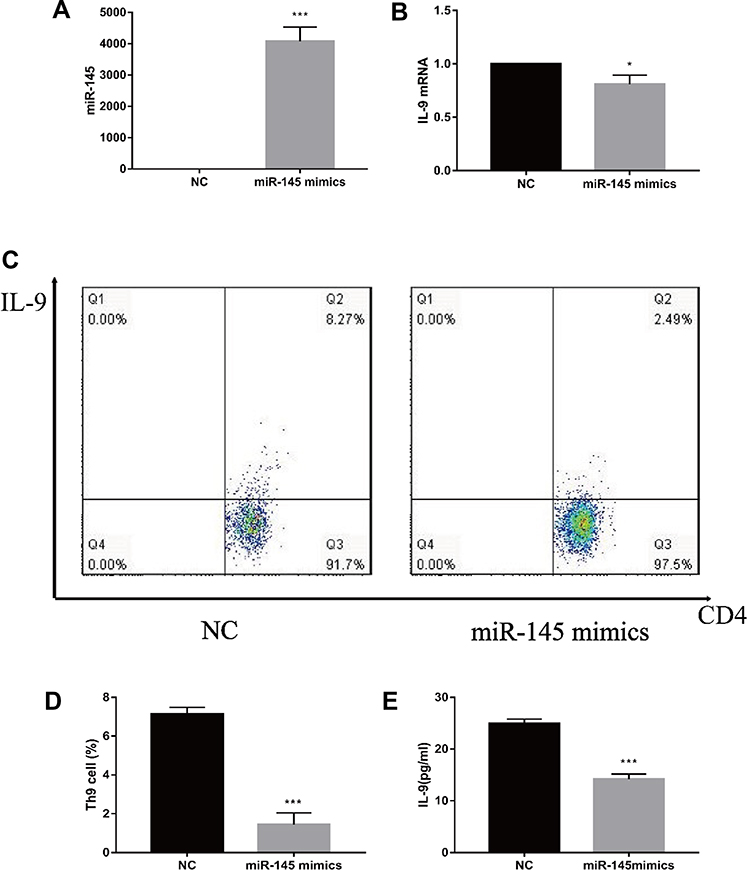 |
Figure 2 miR-145 negatively regulates Th9 cell polarization in vitro (n=3). CD4+ T cells were obtained and then cultured in RPMI 1640 media containing 10% FBS. MiR-145 mimics or negative control oligonucleotide were transfected into CD4+ T cells, followed by the addition of TGF-β (2 ng/mL) and IL-4 (10 ng/mL). (A, B) After 72 h, relative expressions of miR-145 and IL-9 mRNA were measured by RT-PCR. (C, D) Th9 cells were analyzed by flow cytometry. (E) ELISA was used to detect IL-9 levels in the culture supernatant. Notes: The data represent the mean ± standard deviation (SD) from three independent experiments. *P<0.05; ***P<0.01.Abbreviations: RPMI, Roswell Park Memorial Institute; FBS, fetal bovine serum; NC, negative control; TGF-β, transforming growth factor-β; IL, interleukin; RT-PCR, reverse transcription-polymerase chain reaction; ELISA, enzyme linked immunosorbent assay. |
miR-145 Inhibits HIF-1α Expression in vitro
Next, we determined the mechanism by which miR-145 inhibits Th9 cell generation in vitro. HIF-1α is one major transcription factor required for Th9 cell differentiation and IL-9 production. HIF-1α deficiency inhibits IL-9 mRNA synthesis, IL-9 secretion, and Th9 differentiation.19 After transfection and induction, we incubated these cells for 72 h and then quantified HIF-1α expression by RT-PCR and immunofluorescence. Downregulated HIF-1α was detected in the miR-145 mimics group (Figure 3A and B), demonstrating that miR-145 negatively regulated HIF-1α, which was necessary for Th9 cell polarization and IL-9 production.
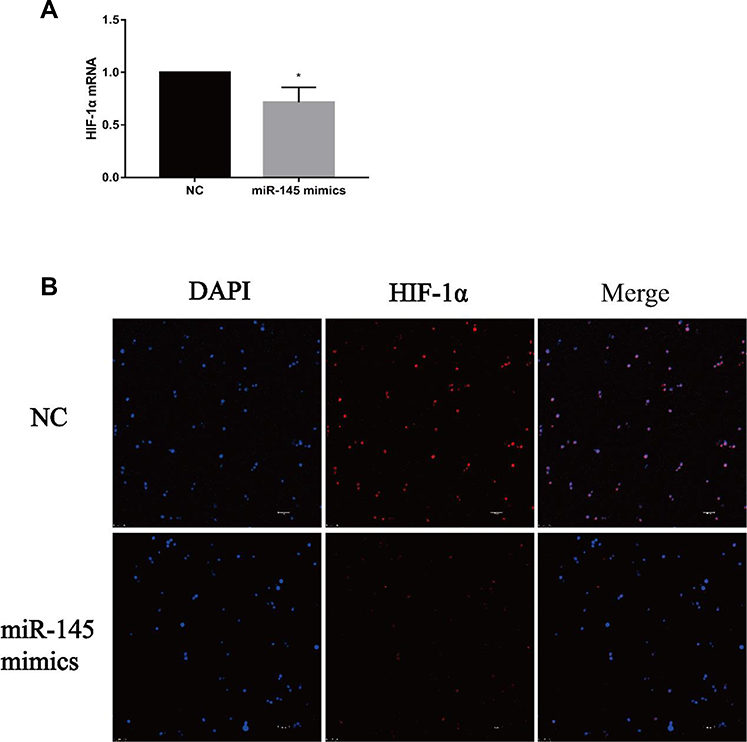 |
Figure 3 miR-145 inhibits HIF-1α expression in vitro (n=3). CD4+ T cells were obtained and transfected with miR-145 mimics or negative control oligonucleotide, followed by incubation for 3 days in the presence of TGF-β (2 ng/mL) and IL-4 (10 ng/mL). (A) HIF-1α mRNA was measured by RT-PCR. (B) Immunofluorescence was used to detect the expression of HIF-1α (Bar = 10 um). Notes: The data represent the mean ± standard deviation (SD) from three independent experiments. *P<0.05.Abbreviations: HIF-1α, hypoxia-inducible factor-1α; DAPI, 4ʹ,6-diamidino-2-phenylindole; NC, negative control; TGF-β, transforming growth factor-β; IL, interleukin; RT-PCR, reverse transcription-polymerase chain reaction. |
miR-145 Inhibits Activation of the PI3K/Akt/mTOR/p70S6K Pathway in vitro
The double luciferase assay confirmed that miR-145 targeted Akt3, inhibited PI3K/Akt pathway activation and HIF-1α expression, and inhibited the growth and metastasis of thyroid cancer.20 We hypothesized that overexpression of miR-145 could inhibit the PI3K/Akt/mTOR/p70S6K pathway activation in vitro. To verify our hypothesis, after transfection and induction, the cells were incubated for 72 h and then PI3K/Akt/mTOR/p70S6K mRNA expression was quantified by RT-PCR, as shown in Figure 4A–D. Compared with the NC group, expression of PI3K/Akt/p70S6K mRNA was decreased in the miR-145 mimics group. Furthermore, immunofluorescence was used to detect the expression of PI3K/Akt/mTOR/p70S6K. Consistent with the RT-PCR results, the expression of PI3K/Akt/p70S6K in cells expressing miR-145 mimics was suppressed (Figure 4E–H). These results suggest that overexpression of miR-145 inhibits activation of the PI3K/Akt/mTOR/p70S6K pathway in vitro.
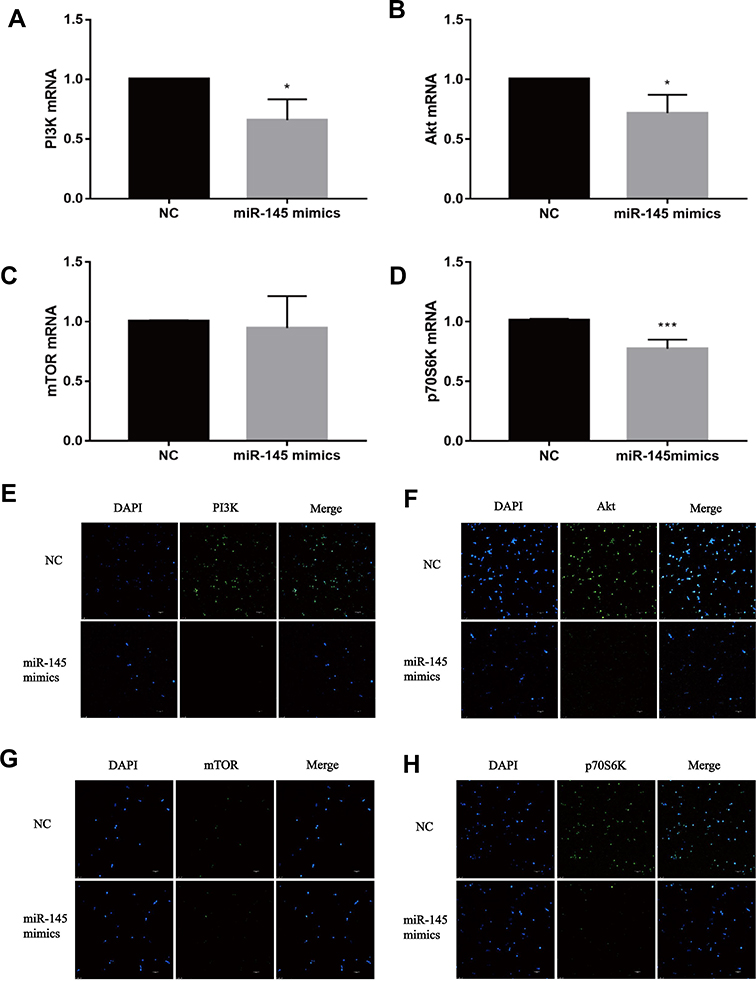 |
Figure 4 miR-145 inhibits PI3K/Akt/mTOR/p70S6K pathway activation in vitro (n=3). CD4+T cells were obtained and transfected with miR-145 mimics or negative control oligonucleotide. TGF-β (2 ng/mL) and IL-4 (10 ng/mL) were added. Expressions of PI3K mRNA (A), Akt mRNA (B), mTOR mRNA (C), and p70S6K mRNA (D) were measured by RT-PCR. Immunofluorescence for PI3K (E), Akt (F), mTOR (G), and p70S6K (H) (Bar = 10 um). Notes: The data represent the mean ± standard deviation (SD) from three independent experiments. *P<0.05; ***P<0.01.Abbreviations: PI3K, phosphatidylinositol-3-kinase; Akt, protein kinase B; mTOR, mammalian target of rapamycin; p70S6K, p70 ribosomal protein S6 kinase; DAPI, 4ʹ,6-diamidino-2-phenylindole; NC, negative control; TGF-β, transforming growth factor-β; IL, interleukin; RT-PCR, reverse transcription-polymerase chain reaction. |
miR-145 Inhibits Th9 Cell Production Through the PI3K/Akt/mTOR/p70S6K/HIF-1α Pathway in MA
To further explore the relationship between miR-145 and Th9 cells in MA, we established a liver cancer MA model. Then overexpression of miR-145 in mice was created by miR-145agomir transfection. The RT-PCR results showed that the expression of miR-145 in the spleen of mice in the miR-145agomir group was significantly higher than that in the control group (1.49±0.35 vs. 25.35 ± 4.49) (Figure 5A). After 2 weeks, mice were sacrificed, and spleen tissues were isolated. The miR-145agomir group showed reduced IL-9 expression (Figure 5B–E), demonstrating that overexpression of miR-145 inhibits Th9 cell production, similar to the in vitro results. In addition, the expression of miR-145 in the spleen of mice with liver cancer ascites showed a negative correlation with the proportion of Th9 cells (r=−0.951, P=0.000) (Figure 5F). Subsequently, in order to verify whether inhibition of Th9 cell production by overexpressed miR-145 was related to HIF-1 α in the MA model, we detected HIF-1α expression in the spleen. As shown in Figure 6A–D, the expression of HIF-1α was significantly reduced in the miR-145agomir group. HIF-1α-dependent glycolytic activity was not only a necessary condition for Th9 cell differentiation, but also directly targeted the IL-9 promoter region and controlled the production of IL-9 by CD4+ T cells. The decrease in HIF-1α expression was closely related to the decreased Th9 cell production. These results suggested that overexpression of miR-145 might decrease the expression of Th9 cells and IL-9 by inhibiting the expression of HIF-1α in MA. HIF-1α is a downstream regulator of PI3K/Akt/mTORC1/p70S6K. To further confirm whether miR-145 can regulate HIF-1α expression through the PI3K/Akt/mTOR/p70S6K pathway in MA, we used RT-PCR and Western blotting to detect PI3K/Akt/mTOR/p70S6K-related expression. The results showed that the levels of PI3K/Akt/mTOR/p70S6K mRNA were not significantly different. However, the expression of p-PI3K, p-Akt, p-mTOR, and p-p70S6K protein was lower than that of the NC group (Figure 7A–L). These results suggest that miR-145 could regulate HIF-1α expression through the PI3K/Akt/mTOR/pP70S6k pathway. In conclusion, miR-145 could inhibit the activation of the PI3K/Akt/mTOR/p70S6K pathway and reduce the expression of HIF-1α, which led to the suppression of Th9 cell differentiation and IL-9 production in MA.
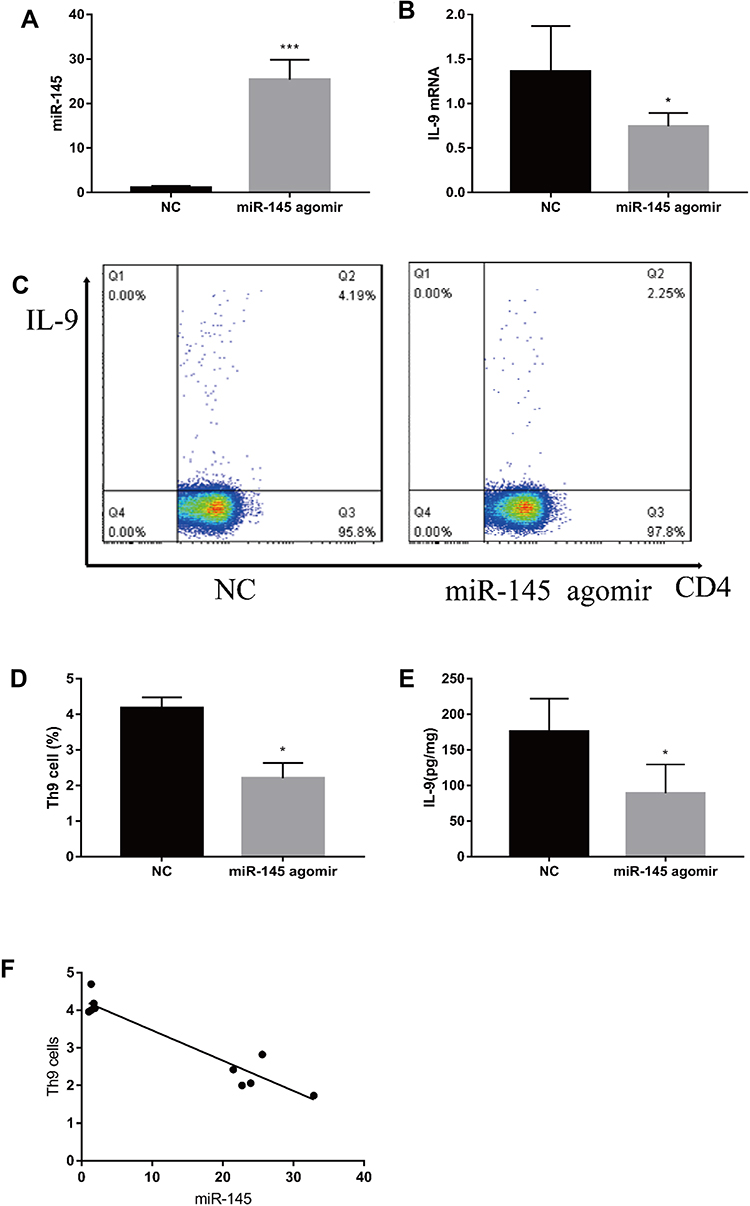 |
Figure 5 miR-145 inhibits Th9 cell production in a mouse model of MA (n=5). Construction of a mouse mode of MA in liver cancer, and intravenous injection of mmu-miR-145-5pagomir or negative control oligonucleotide. After 2 weeks, mice were sacrificed, and spleen tissue was isolated. (A, B) relative expressions of miR-145 and IL-9 mRNA were measured by RT-PCR. (C, D) Th9 cells were analyzed by flow cytometry. (E) ELISA was used to detect IL-9 levels. (F) The relationship between miR-145 and Th9 cells. *P<0.05; ***P<0.01. Abbreviations: MA, malignant ascites; NC, negative control; IL, interleukin; CD4, T helper cells; RT-PCR, reverse transcription-polymerase chain reaction; ELISA, enzyme linked immunosorbent assay. |
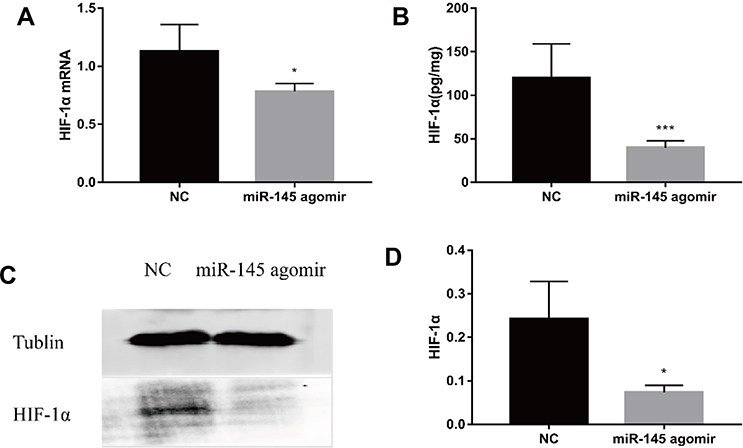 |
Figure 6 miR-145 suppresses HIF-1α expression in an MA model (n=5). Construction of a mouse model of MA in liver cancer, and intravenous injection of mmu-miR-145-5pagomir or negative control oligonucleotide. After 2 weeks, mice were sacrificed, and spleen tissue was isolated. (A) HIF-1α mRNA was measured by RT-PCR. (B) ELISA was used to detect the expression of HIF-1α. (C, D) Western blotting for HIF-1α. *P<0.05; ***P<0.01. Abbreviations: HIF-1α, hypoxia-inducible factor-1α; MA, malignant ascites; NC, negative control; RT-PCR, reverse transcription-polymerase chain reaction; ELISA, enzyme linked immunosorbent assay. |
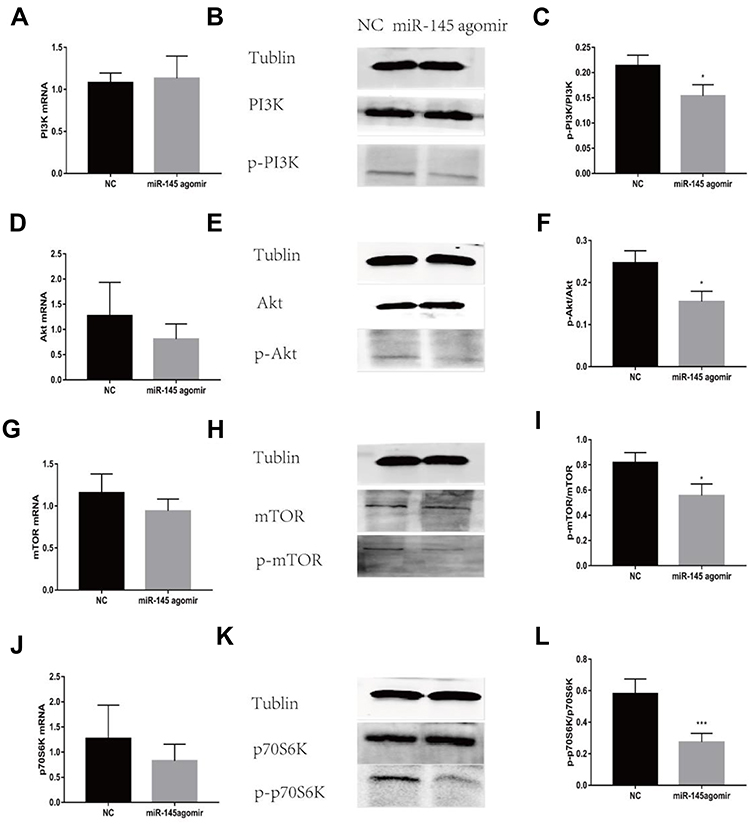 |
Figure 7 miR-145 inhibits PI3K/Akt/mTOR/p70S6K pathway activation in a mouse model of MA (n=5). Construction of a mouse model of MA in liver cancer, and intravenous injection of mmu-miR-145-5pagomir or negative control oligonucleotide. After 2 weeks, mice were sacrificed, and spleen tissue was isolated. PI3K mRNA (A), Akt mRNA (D), mTOR mRNA (G), and p70S6K mRNA (J) were measured by RT-PCR. Western blotting for p-PI3K (B, C), p-Akt (E, F), p-mTOR (H, I), and p-p70S6K (K, L). *P<0.05. ***P<0.01. Abbreviations: PI3K, phosphatidylinositol-3-kinase; p-PI3K, phosphorylation-phosphatidylinositol-3-kinase; Akt, protein kinase B; p-Akt, phosphorylation-protein kinase B; mTOR, mammalian target of rapamycin; p-mTOR, phosphorylation-mammalian target of rapamycin; p70S6K, p70 ribosomal protein S6 kinase; p-p70S6K, phosphorylation-p70 ribosomal protein S6 kinase; MA, malignant ascites; NC, negative control; RT-PCR, reverse transcription-polymerase chain reaction. |
Discussion
Th9 cells are new CD4+ T cells that have been discovered and confirmed in recent years.21,22 Th9 cells can stimulate inflammatory responses and participate in pathophysiological processes of various immune diseases.23,24 As the main effector of Th9 cells, IL-9 is both a growth factor on T cell and a direct effector on B cells. It can play an important role in the regulation of immunoglobulin synthesis. Our previous experiments confirmed that Th9 cells promoted the proliferation and migration of liver cancer cells through the signal transducer and activator of the transcription 3 (STAT3) signaling pathway.25 Anti-IL-9 treatment could prolong the median survival time of MA mouse models.26 These results suggested that Th9 cells were involved in the occurrence and development of MA in liver cancer by precipitating the tumor immune effects through IL-9. In the current study, we confirmed that: (I) miR-145 inhibited Th9 cell polarization and IL-9 expression in vitro; (II) miR-145 inhibited HIF-1α expression in vitro; (III) miR-145 inhibited PI3K/Akt/mTOR/p70S6K pathway activation in vitro; and (IV) miR-145 inhibited Th9 cell production and IL-9 expression through the PI3K/Akt/mTOR/p70S6K/HIF-1α pathway in MA. These findings suggest a novel therapeutic target to mediate Th9 cell differentiation.
MiRNAs are endogenous small non-coding RNAs with approximately 22 nucleotides in length in the eukaryotic cells. All miRNAs are completely or incompletely complementary paired with the three prime untranslated regions of the target miRNAs. They can degrade the target miRNA or inhibit the translation initiation of the target miRNA, as well as negatively regulate the gene expression at the post-transcriptional level.27 In addition, various miRNAs are involved in the processes of Th cell proliferation, differentiation, and immune response. For example, miR-20b inhibited the differentiation of CD4+ cells into Th17 cells in autoimmune encephalomyelitis by regulating the expression of retinoic acid-related orphan receptor gamma t and STAT3.28 Overexpression of miR-145 was shown to inhibit Th17 cell proliferation by inhibiting expression of the nuclear factor of activated T cells 1 in an experimental autoimmune myasthenia gravis.29 In our study, we showed that miR-145 treatment suppressed Th9 cell differentiation and IL-9 expression and negatively regulated HIF-1α expression. HIF-1α is a key transcription factor that regulates glycolytic enzyme expression and plays a central role in the production of pro-inflammatory cytokines.30 The development and maintenance of Th17 cells are achieved through glycolysis, which depends on the mTOR/HIF-1α pathway.31 HIF-1α deficiency could increase regulatory T cell production and block glycolysis, as well as inhibit Th17 cell differentiation.32 HIF-1α is also one of the major transcription factors required for Th9 cell polarization and IL-9 production. It was shown to directly target the IL-9 promoter region and control the production of IL-9.19 These results demonstrated that miR-145 could reduce the production of Th9 cells and IL-9 by inhibiting the expression of HIF-1α.
The PI3K/Akt/mTOR signaling pathway is important for the regulation of cell proliferation, invasion, metastasis, cell cycle, apoptosis, and various metabolic functions, and plays an important role in cancer progression. HIF-1α is a downstream regulator of mTORC1/p70S6K. Glycolytic activation through the mTOR/HIF-1α is required for the differentiation of Th9 cells. Sirtuin 1 relies on the mTOR/HIF1α signal transduction pathway and glycolytic pathway to directly target the IL-9 gene locus and inhibit the differentiation of Th9 cells.19 These findings indicated that activation of the PI3K/Akt/mTOR/p70S6K/HIF-1α pathway played a positive role in the generation of Th9 cells. Interestingly, overexpression of miR-145 could directly target p70S6K1, inhibit the expression of HIF-1α and vascular endothelial growth factor, inhibit the survival and migration of pancreatic cancer cells, enhance the chemical sensitivity of cancer cells to gemcitabine, and play an anti-cancer role. In addition, the double luciferase assay confirmed that Akt3 was a predicted target of miR-145 through a potential binding site within the 3′-UTR.20 In our study, we showed that miR-145 inhibited the activation of the PI3K/Akt/mTOR/p70S6K/HIF-1α pathway and inhibited the expression of HIF-1α, leading to impaired Th9 cell differentiation.
In both bacteria and eukaryotes, the cellular concentrations of proteins are correlated with the abundances of their corresponding mRNAs, but not strongly. They often show a squared Pearson correlation coefficient of ≈0.40, which indicates that ≈40% of the variation in protein concentration can be explained by ascertaining the mRNA abundances. To explain the remaining ≈60% of the variation, some combination of post-transcriptional regulation and measurement noise needs to be invoked.33 In our study, the in vitro experiment showed that miR-145 inhibited PI3K/Akt/mTOR/p70S6K at the both mRNA and protein levels. However, the in vivo experiment showed there were no significant inhibitory effects at the mRNA level. This may be related to miR-145 concentration. During modeling, the miR-145 concentration in the miR-145 agomir group and the negative control group was maintained at about 1:25. However, in vitro, the miR-145 concentration of the miR-145 mimics group and the negative control group was maintained at about 1: 4000 or higher.
Conclusion
We here established that miR-145 could suppress the differentiation of Th9 cells and IL-9 in vitro and in vivo, likely from inhibiting the activation of the PI3K/Akt/mTOR/p70S6K pathway and reducing the expression of HIF-1α.
Acknowledgments
This study was supported by a grant from the Nature Science Fund Project of the Guangxi Zhuang Autonomous Region of China (no: 31560257; 81960439). We acknowledge the helpful comments on this article received from our reviewers.
Disclosure
Dr Hai-Xing Jiang and Professor Shan-Yu Qin report a patent Certificate of Utility Model Patent licensed to Shan-Yu Qin, Hai-Xing Jiang, Cheng Shi, Bang-Li Hu, Rong-E Lei. The authors report no other conflicts of interest with respect to this work.
References
1. Akinyemiju T, Abera S, Ahmed MM, Alam N. The burden of primary liver cancer and underlying etiologies from 1990 to 2015 at the global, regional, and national level: results from the global burden of disease study 2015. JAMA Oncol. 2017;3(12):1683–1691. doi:10.1001/jamaoncol.2017.3055
2. Qi YF, Li HJ, Li J, Qi YF. Effect of Liushen Pill on PDGF and VEGF expression in H22 liver cancer ascites transplantation tumor and its related mechanism. World Tradit Chin Med. 2013;8(1):69–71.3.
3. Wu Y, Bao WG, Ding YH, Wu XY, Zhao DW. Clinical and experimental study of xiaoshui decoction in the treatment of primary liver cancer ascites. Chin J Integr Med. 2005;25(12):1066–1069.
4. Calin GA, Croce CM. MicroRNA signatures in human cancers. Nat Rev Cancer. 2006;6(11):857–866. doi:10.1038/nrc1997
5. Okugawa Y, Toiyama Y, Goel A. An update on microRNAs as colorectal cancer biomarkers: where are we and what’s next? Expert Rev Mol Diagn. 2014;14(8):1–23. doi:10.1586/14737159.2014.946907
6. Kent OA, Chivukula RR, Mullendore M, et al. Repression of the miR-143/145 cluster by oncogenic ras initiates a tumor-promoting feed-forward pathway. Genes Dev. 2010;24(24):2754–2759. doi:10.1101/gad.1950610
7. Yu Y, Nangia-Makker P, Farhana L, Rajendra SG, Levi E, Majumdar AP. miR-21 and miR-145 cooperation in regulation of colon cancer stem cells. Mol Cancer. 2015;14(1):98. doi:10.1186/s12943-015-0372-7
8. Zhen H, Li J, Lin F. miR-145 expression in hepatic carcinoma and its effects on cell proliferation and invasion of tumor. J Tongji Univ. 2012;2:11.
9. Chung YW, Bae HS, Song JY, et al. Detection of MicroRNA as novel biomarkers of epithelial ovarian cancer from the serum of ovarian cancer patient. Int J Gynecol Cancer. 2013;23(4):673–679. doi:10.1097/IGC.0b013e31828c166d
10. Duan X, Hu J, Wang Y, et al. MicroRNA-145: a promising biomarker for hepatocellular carcinoma (HCC). Gene. 2014;541(1):67–68. doi:10.1016/j.gene.2014.03.018
11. Noguchi S, Yamada N, Kumazaki M, et al. socs7, a target gene of microRNA-145, regulates interferon-β induction through STAT3 nuclear translocation in bladder cancer cells. Cell Death Dis. 2013;4(2):e482. doi:10.1038/cddis.2013.11
12. Yang XW, Jiang HX, Huang XL, et al. Role of Th9 cells and Th17 cells in the pathogenesis of malignant ascites. Asian Pac J Trop Biomed. 2015;5(10):806–811. doi:10.1016/j.apjtb.2015.07.013
13. Bahrami A, Hasanzadeh M, Hassanian SM, Shahidsales S, Avan A. The potential value of the PI3K/Akt/mTOR signaling pathway for assessing prognosis in cervical cancer and as a target for therapy. J Cell Biochem. 2017;118(12):4163–4169. doi:10.1002/jcb.26118
14. Céu C, Sofia P, Luís L, et al. Abnormal protein glycosylation and activated PI3K/Akt/mTOR pathway: role in bladder cancer prognosis and targeted therapeutics. PLoS One. 2015;10(11):e0141253. doi:10.1371/journal.pone.0141253
15. Yin T, Wang G, He S, et al. Malignant pleural effusion and ascites induce epithelial-mesenchymal transition and cancer stem-like cell properties via the Vascular Endothelial Growth Factor (VEGF)/Phosphatidylinositol 3-Kinase (PI3K)/Akt/Mechanistic Target of Rapamycin (mTOR) pathway. J Biol Chem. 2011;291(52):26750. doi:10.1074/jbc.M116.753236
16. Shi JS, Jiang K, Li ZD. MiR-145 ameliorates neuropathic pain via inhibiting inflammatory responses and mTOR signaling pathway by targeting Akt3 in a rat model[. Neurosci Res. 2017;S0168010217303851.
17. Zhu XF, Zhu RH. Curcumin suppresses the progression of laryngeal squamous cell carcinoma through the upregulation of miR-145 and inhibition of the PI3K/Akt/mTOR pathway. Onco Targets Ther. 2018;11:3521–3531. doi:10.2147/OTT.S159236
18. Zou C, Qing X, Feng M. miR-145 inhibits tumor angiogenesis and growth by N-RAS and VEGF. Cell Cycle. 2012;11(11):2137–2145. doi:10.4161/cc.20598
19. Wang Y, Bi Y, Chen X, et al. Histone deacetylase SIRT1 negatively regulates the differentiation of interleukin-9-producing CD4+ T cells. Immunity. 2016;44(6):1337–1349. doi:10.1016/j.immuni.2016.05.009
20. Boufraqech M, Zhang L, Jain M, et al. miR-145 suppresses thyroid cancer growth and metastasis and targets AKT3. Endocr Relat Cancer. 2014;21(4):517–531. doi:10.1530/ERC-14-0077
21. Dardalhon V, Awasthi A, Kwon H, et al. IL-4 inhibits TGF-beta-induced Foxp3+ T cells and, together with TGF-beta, generates IL-9+ IL-10+ Foxp3(-) effector T cells. Nat Immunol. 2008;131(12):1347–1355. doi:10.1038/ni.1677
22. Veldhoen M, Uyttenhove C, Snick JV, et al. Transforming growth factor-|beta| ‘reprograms’ the differentiation of T helper 2 cells and promotes an interleukin 9|ndash|producing subset. Nat Immunol. 2008;9(12):1341–1346. doi:10.1038/ni.1659
23. Zheng H, Yang B, Xu D, et al. Induction of specific T helper-9 cells to inhibit glioma cell growth. Oncotarget. 2017;8(3):4864.
24. Yong L, Qiang W, Gang X, et al. Th9 cells represent a unique subset of CD4 + T cells endowed with the ability to eradicate advanced tumors. Cancer Cell. 2018;33(6):1048–60.e7. doi:10.1016/j.ccell.2018.05.004
25. Lei RE. Role and Mechanism of Interleukin 9 in Liver Cancer and Its Malignant Peritoneal Effusion. Guangxi Medical University.2018.
26. Zhang PL, Lei RE, Qin QY, Shi C, Jiang HX. Efficacy of anti-IL-9 antibody in the treatment of liver cancer malignant ascites and its mechanism. Chin J Immunol. 2017;3.
27. Guo H, Ingolia NT, Weissman JS, Bartel DPJN. Mammalian microRNAs predominantly act to decrease target mRNA levels. Nature. 2010;466(7308):835–840. doi:10.1038/nature09267
28. Zhu E, Wang X, Zheng B, Wang Q, Yin Z. miR-20b suppresses Th17 differentiation and the pathogenesis of experimental autoimmune encephalomyelitis by targeting ROR t and STAT3. J Immunol. 2014;192(12):5599–5609. doi:10.4049/jimmunol.1303488
29. Wang J, Zheng SS, Xin N, et al. Identification of novel MicroRNA signatures linked to experimental autoimmune myasthenia gravis pathogenesis: down-regulated miR-145 promotes pathogenetic Th17 cell response. J Neuroimmune Pharmacol. 2013;8(5):1287–1302. doi:10.1007/s11481-013-9498-9
30. Cramer T, Yamanishi Y, Clausen BE, et al. HIF-1 alpha is essential for myeloid cell-mediated inflammation. Cel. 2003;112(5):645–657. doi:10.1016/S0092-8674(03)00154-5
31. Shi LZ, Wang R, Huang G, Vogel P, Chi H. HIF1alpha-dependent glycolytic pathway orchestrates a metabolic checkpoint for the differentiation of TH17 and Treg cells. J Exp Med. 2011;208(7):1367–1376. doi:10.1084/jem.20110278
32. Dang EV, Barbi J, Yang H-Y, et al. Control of TH17/Treg balance by hypoxia-inducible factor 1. Cell. 2011;146(5):0–784. doi:10.1016/j.cell.2011.07.033
33. Vogel C, Marcotte EMJNRG. Insights into the regulation of protein abundance from proteomic and transcriptomic analyses. Nat Rev Genet. 2012;13:679. doi:10.1038/nrg3185
 © 2020 The Author(s). This work is published and licensed by Dove Medical Press Limited. The full terms of this license are available at https://www.dovepress.com/terms.php and incorporate the Creative Commons Attribution - Non Commercial (unported, v3.0) License.
By accessing the work you hereby accept the Terms. Non-commercial uses of the work are permitted without any further permission from Dove Medical Press Limited, provided the work is properly attributed. For permission for commercial use of this work, please see paragraphs 4.2 and 5 of our Terms.
© 2020 The Author(s). This work is published and licensed by Dove Medical Press Limited. The full terms of this license are available at https://www.dovepress.com/terms.php and incorporate the Creative Commons Attribution - Non Commercial (unported, v3.0) License.
By accessing the work you hereby accept the Terms. Non-commercial uses of the work are permitted without any further permission from Dove Medical Press Limited, provided the work is properly attributed. For permission for commercial use of this work, please see paragraphs 4.2 and 5 of our Terms.