")
Back to Journals » Cancer Management and Research » Volume 11
miR-142-3p suppresses uveal melanoma by targeting CDC25C, TGFβR1, GNAQ, WASL, and RAC1
Authors Peng D, Dong J, Zhao Y, Peng X, Tang J, Chen X, Wang L, Hu DN, Reinach PS, Qu J, Yan D
Received 22 February 2019
Accepted for publication 18 April 2019
Published 24 May 2019 Volume 2019:11 Pages 4729—4742
DOI https://doi.org/10.2147/CMAR.S206461
Checked for plagiarism Yes
Review by Single anonymous peer review
Peer reviewer comments 2
Editor who approved publication: Dr Antonella D'Anneo
Dewei Peng,1,2 Jing Dong,1,2 Yunping Zhao,1,2 Xiaomei Peng,1,2 Jingjing Tang,1,2 Xiaoyan Chen,1,2 Lihua Wang,1,2 Dan-Ning Hu,2,3 Peter S Reinach,1,2 Jia Qu,1,2 Dongsheng Yan1,2
1School of Ophthalmology and Optometry, Eye Hospital, Wenzhou Medical University, Wenzhou, Zhejiang, People’s Republic of China; 2State Key Laboratory of Ophthalmology, Optometry and Visual Science, Wenzhou, Zhejiang, People’s Republic of China; 3Tissue Culture Center, New York Eye and Ear Infirmary, New York Medical College, New York, NY, USA
Purpose: Uveal melanoma (UM) is the most frequent metastatic ocular tumor in adults. Therapeutic intervention remains ineffective since none of the novel procedures used to treat this disease increased survival rates. To deal with this limitation, additional studies are required to clarify its pathogenesis. The current study focused on describing how epigenetic modulation by miR-142-3p affects changes in some cellular functions underlying UM pathogenesis.
Methods and results: Microarray analysis identified 374 miRNAs which were differentially expressed between UM cells and uveal melanocytes. miR-142-3p was one of the 10 most downregulated miRNAs. Quantitative RT-PCR analysis confirmed that miR-142-3p expression levels were significantly decreased in both UM cell lines and clinical specimens. The results of the MTS, clone formation, scratch wound, transwell assays, and in vivo biofluorescence imaging showed that miR-142-3p overexpression significantly inhibited cell proliferation, migration, and invasiveness. Nevertheless, miR-142-3p did not affect cell apoptotic activity or sensitivity to doxorubicin. Cell cycle and EdU analysis showed that miR-142-3p overexpression induced G1/G2 cell cycle arrest and reduced DNA synthesis in UM cells. Microarray analysis showed that miR-142-3p mainly regulates the TGFβ signaling pathway, and those in which MAPK and PI3K-Akt are constituents. Functional interactions between miR-142-3p and CDC25C, TGFβR1, GNAQ, WASL, and RAC1 target genes were confirmed based on the results of the luciferase reporter assay and Western blot analysis. CDC25C or RAC1 downregulation is in agreement with cell cycle arrest and DNA synthesis disorder induction, while downregulation of TGFβR1, GNAQ, WASL, or RAC1 accounts for declines in cell migration.
Conclusion: miR-143-3p is a potential therapeutic target to treat UM since overriding its declines in expression that occur in this disease reversed the pathogenesis of this disease. Such insight reveals novel biomarker for decreasing UM vitality and for improved tracking of tumor progression.
Keywords: miR-142-3p, uveal melanoma, tumor suppressor, molecular mechanisms
Introduction
MicroRNAs (miRNAs) are a group of highly conserved small noncoding RNAs with a length of 21–25 nucleotides. They act on their specific gene targets by translational repression or mRNA cleavage after assembling themselves into an RNA-induced silencing complex (RISC).1 In 1993, lin-4 became the first discovered miRNA, which was involved in developmental timing regulation in Caenorhabditis elegans.2 The essential roles miRNA in controlling gene expression are consistent with the estimates showing that approximately more than one-third of the human genome is conserved as miRNA targets.3 Specific miRNAs may play a dual role in controlling human cancers by acting either as oncogenes or tumor suppressors.4 This realization helps explain why much effort is being committed to characterizing miRNA expression profiles because such insight has pinpointed changes reflective of differences in cancer stages, prognosis, and assessment of treatment outcome.5 Hsa-miR-142-3p, as a member of miRNAs, is involved in the regulation of various physiological activities such as tumorigenesis,6,7 cell differentiation,8 and hematopoiesis.9 The association between changes in miR-142-3p expression level and tumor size and metastasis has made it possible to use it as a marker of tumorigenesis.6,10 Both in vitro and in vivo experiments have revealed that miR-142-3p upregulation can effectively inhibit the proliferation or migration of breast, cervical, and hepatocellular carcinoma cells.11–13
Uveal melanoma (UM) is the most frequent intraocular malignancy comprising approximately 3–5% of all melanoma cases. Its incidence varies by sex, race, and country, ranging from 0.31 to 8 per million cases.14 Even though initially the tumor can be effectively treated with advances in chemotherapy, radiation, and surgical treatment, most patients experience visual loss and more than a third require enucleation.15 Nevertheless, approximately 40–50% of these patients ultimately develop metastases, which can even occur 10 years after its initial diagnosis. Amongst those individuals who develop liver metastases, their median survival period is only about 6 months.16 These limitations make it apparent that there is a dire need to develop novel approaches to improve the outcome of UM treatment.
Our previous studies have revealed the important roles of miR-34a, miR-137, and miR-124a in controlling UM pathogenesis by targeting critical oncogenes c-Met or MITF.17–19 Our rationale for characterizing the possible role of miR-142-3p in this malignancy stemmed from miRNA microarray analysis showing that miR-142-3p was one of the most downregulated miRNAs in UM cells. This finding coupled with the fact that UM frequently harbors mutation of GNAQ,20 which is a predicted target gene of miR-142-3p, prompted us to determine if it is another epigenetic modulator of UM development. Here, we provide definitive evidence indicating that declines in miR-142-3p expression levels is an essential factor contributing to the development of numerous phenotypic changes characteristic of UM pathogenesis.
Materials and methods
Cell culture and tumor specimens
Human UM cell line M17 was isolated from a Caucasian patient with primary choroidal melanoma by Dr Dan-Ning Hu at the New York Eye and Ear Infirmary.21 Another UM cell line, SP6.5, was provided by Dr G. Pelletier (Research Center of Immunology, Quebec, Canada) and was isolated from a Caucasian patient with primary choroidal melanoma.22 UM cells were cultured in Dulbecco’s modified Eagle medium (DMEM; Thermo Fisher Scientific, Waltham, MA, USA) supplemented with 10% fetal bovine serum (FBS; Thermo Fisher Scientific) and incubated in a humidified incubator with 5% CO2 at 37°C. HEK293 cells were purchased from the American Type Culture Collection (ATCC, Manassas, VA, USA) and cultured in the same fashion. D78 was primarily cultured human adult uveal melanocytes isolated from a Caucasian donor by Dr Dan-Ning Hu at the New York Eye and Ear Infirmary, and um95 was isolated from a Chinese donor at the Eye Hospital of Wenzhou Medical University. The primary uveal melanocytes were grown as previously described.23 Twenty UM tissue samples were isolated and collected from patients of the Eye Hospital, Wenzhou Medical University, and the New York Eye and Ear Infirmary, New York Medical College after obtaining their documented informed consent in each case. Adjacent uveal tissues were used as a normal control. The clinical characteristics including age, gender, and metastasis of patients are detailed in
Quantitative RT-PCR (RT-qPCR)
Total RNA was isolated and purified from cells using TRIzol reagent (Thermo Fisher Scientific). Reverse transcription of miRNA and total RNA was performed with the TaqMan MicroRNA Reverse Transcription Kit (Thermo Fisher Scientific) and the Reverse Transcription System (Promega, Madison, WI, USA), respectively. Quantitative RT-PCR was performed using TaqMan MicroRNA Assay or Power SYBR Green PCR Master Mix with a 7500 Fast Real-Time PCR System (Applied Biosystems, Waltham, USA). The primers used in the quantitative RT-PCR are provided in
Cell proliferation assay
SP6.5 and M17 cells were plated in 96-well plates (3×10³ cells/well). Then, 50 nM of hsa-miR-142-3p mimic or an irrelevant negative control (Ambion, Austin, TX, USA) was transfected into the cells in each well using Lipofectamine RNAiMAX (Thermo Fisher Scientific). Cell proliferation was analyzed by the 3-(4,5-dimethylthiazol-2-yl)-5-(3-carboxymethoxyphenyl)-2-(4-sulfophenyl)-2H-tetrazolium (MTS) test using the CellTiter 96 AQueous Assay Kit (Promega, Madison, WI, USA) according to the manufacturer’s instructions. For the colony formation assay, the transfected cells were seeded in 6-well culture plates (1,000 cells/well). Crystal violet was used to stain the cells after 7 days and colony formation was assessed by counting four independent visual fields.
Cell-cycle analysis
SP6.5 and M17 cells were plated in 6-well plates (1×10⁵ cells per well) and were grown to approximately 50% confluence. After 48 hrs of transfection, trypsinization was performed and the dissociated cells were harvested followed by fixation with 70% ethanol, and washed in phosphate-buffered saline (PBS). RNase A and propidium iodide (PI) treatment was then performed for 20 mins. The FACSCalibur flow cytometer (BD Biosciences, San Jose, CA, USA) was then used to analyze at least 1×10⁵ cells.
DNA synthesis assay
SP6.5 and M17 cells were seeded onto glass coverslips in 24-well plates (3×10⁴ cells/well). DNA synthesis activity was evaluated 48 hrs after transfection using a Click-iT EdU Imaging Kit (Thermo Fisher Scientific) according to the manufacturer’s instructions. Multiple images per sample were collected with a fluorescence microscope (Carl Zeiss, Jena, Germany).
Apoptosis assay
Forty-eight hours after transfection, each cell line (SP6.5 and M17) was fixed in freshly prepared paraformaldehyde and stained with Hoechst 33,342 dye (Sigma, Milwaukee, WI, USA). The nuclear morphology was monitored by confocal laser scanning microscopy (LSM 710; Carl Zeiss). For identification of necrotic, early, and late stage apoptotic cells, Annexin-V and propidium iodide (Annexin-V-FLUOS Staining Kit; Roche, Indianapolis, IN, USA) was employed to stain the transfected cells following the manufacturer’s protocol. The stained cells were then detected via flow cytometry. To evaluate caspase activity, total caspase 3/7 activities were determined using a Caspase-Glo 3/7 Assay Kit (Promega) following the manufacturer’s instructions.
Cell migration and invasion assays
A scratch wound assay was performed to determine SP6.5 and M17 cell migratory behavior. These cell lines were plated in 6-well plates (1×10⁵ cells per well) and grown to approximately 50% confluence. They were then transfected and expanded to reach 100% confluence. A sterile 200-μL pipette tip was used to create a vertical scratch across the confluent cell monolayer. The floating cells and cellular debris were carefully removed by flushing them away with Hanks’ Balanced Salt Solution (HBSS) and then replenishing each well with fresh culture medium. Closure of the denuded regions was monitored by capturing images of wound closure at different times observed with an inverted microscope (Axiovert 200; Carl Zeiss). The transwell cell migration and invasion assay were conducted as previously described.19
In vivo tumor growth assay
Stable UM cell lines were generated expressing luciferase protein by transfecting them with pGL4.17 [luc2/Neo] Vector (Promega). Six-week-old female nude mice were obtained from Beijing Vital River Laboratory Animal Technology Co., Ltd. After 24 hrs of transfection with either miR-142-3p mimic or its irrelevant negative control (NC), 5×10⁴ UM cells in 1 μL PBS were inoculated into the suprachoroidal space of nude mice. To obtain transfection in their suprachoroidal space, the in vivo-jetPEI delivery reagent (Polyplus-Transfection, Strasbourg, France) was injected every 7 days for 2 weeks to deliver 1 μg of either miR-142-3p or NC. Three weeks later, the tumor sizes were measured by in vivo bioluminescence imaging with the IVIS Lumina Series III System (PerkinElmer, Waltham, MA, USA). Following euthanasia and enucleation, the eyes were fixed in methacarn solution for 1 hr at 4°C and dehydrated in an ethanol series and embedded in paraffin. Then, 4-μm thick sections were cut for hematoxylin and eosin staining, and images were collected in conjunction with an upright microscope (BX41; Olympus, Tokyo, Japan). The remaining samples were used for extracting RNA and analyzing the expression levels of miR-142-3p in tumor tissues. All animal treatments were performed in compliance with the National Institutes of Health Guide for the Care and Use of Laboratory Animals, and approval of the Wenzhou Medical University Animal Care and Use Committee.
Microarray-based miRNA and mRNA expression profiling assay
Total RNA was isolated and purified from UM cell lines (SP6.5 and M17) or uveal melanocytes (D78) using TRIzol reagent. Then, the total RNA was sent to CapitalBio Corporation (Beijing, China) for miRNA expression profiling analysis using CapitalBio Mammalian miRNA Array V 3.0. Data analysis was performed using SpotData Pro software (CapitalBio Corporation). The miRNAs showing statistically significant differences (FDR<0.05) and changes greater than 2-fold were counted as differentially expressed. The total RNA extracted from UM cells transfected with miR-142-3p or NC was sent to Shanghai Biotechnology Corporation (Shanghai, China) for transcriptomic analysis using the gene chip Affymetrix Human U133 Plus 2.0. Raw data were normalized by the MAS 5.0 algorithm in the Affy packages. A scatter plot analysis was used for the statistical analysis, and genes showing statistically significant differences (P<0.05) and changes greater than 2-fold were counted as differentially expressed.
The biological functions of the significantly changed mRNAs were examined by gene ontology (GO) analysis.25 The signaling pathways related to significantly changed mRNAs were analyzed based on the Kyoto Encyclopedia of Genes and Genomes (KEGG) database.26 Fisher’s exact test was used to classify the GO category and rank the significant signaling pathways, and the false discovery rate (FDR) was calculated to correct the p-values. TargetScanHuman27 was employed to clarify the identity of differentially expressed genes having several GO-terms and pathway-terms. Those selected were chosen as target genes of miR-142-3p and used to construct a functional network.
Prediction of miR-142-3p target genes
Computational target prediction methods, microarray assay results, and literature reports were used for screening the key targets of miR-142-3p in UM cells. As different prediction tools have their own pros and cons, we utilized multiple tools including TargetScanHuman27 and miRDB28 to improve the prediction power.
Luciferase reporter gene assay
The 3’ untranslated region (UTR) of target genes was amplified and separately inserted into the miRNA Expression Reporter Vector (pMIR-REPORT, Ambion). The mutated seed region was generated by a site-directed mutagenesis method as previously described.29 The primers used in the luciferase reporter assay are provided in
Western blot analysis
Western blot analysis was performed of harvested cell proteins 48 hrs after initiating transfection.17,18 Antibodies against CDC25C, GNAQ, WASL, RAC1, ERK1/2, phospho-ERK1/2, Akt, and phospho-Akt (Ser473) were purchased from Cell Signaling Technology (CST; Beverly, MA, USA), and anti-TGFβR1 antibody was obtained from Santa Cruz Biotechnology (Dallas, TX, USA). GAPDH (CST) was used as a loading control.
Data analysis
All data are expressed as the mean±SEM. Differences between cells transfected with miR-142-3p and NC were analyzed by Student’s t-test. A P-value of <0.05 was considered significant. Statistical significance: *P<0.05, **P<0.01, ***P<0.001.
Results
MiRNA profile and marked downregulation of miR-142-3p in UM cells and clinical specimens
To systematically identify differentially expressed miRNAs in UM cells, we performed miRNA microarray analysis of both two UM cell lines and normal uveal melanocytes. The results showed 24 markedly upregulated miRNAs and 350 significantly downregulated miRNAs in UM cells compared to normal uveal melanocytes (
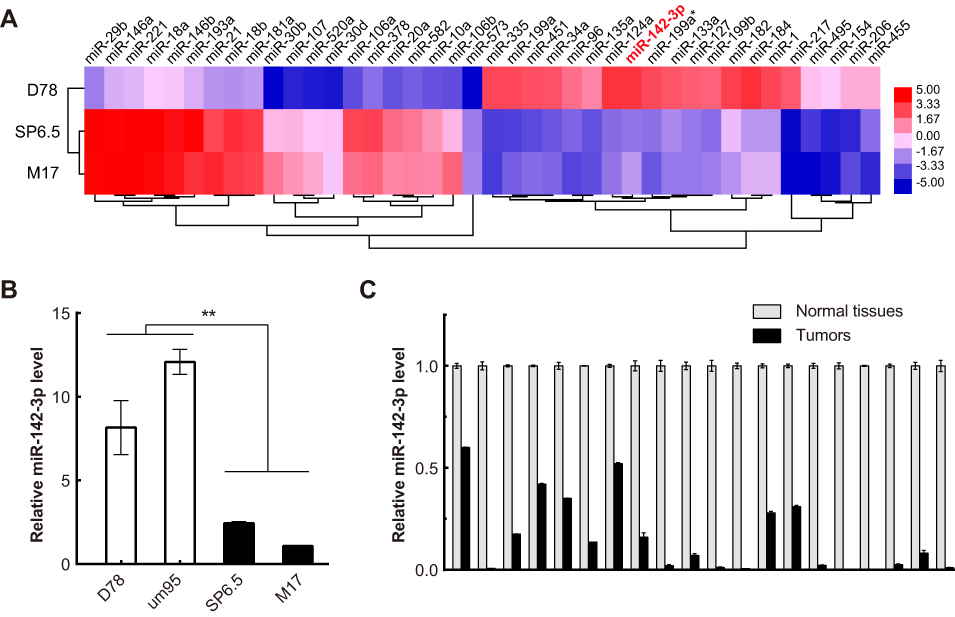 | Figure 1 MiR-142-3p is downregulated in uveal melanoma (UM) cells and clinical specimens. (A) The 20 most upregulated and downregulated miRNAs between UM cells (M17 and SP6.5) and normal uveal melanocytes (D78) were hierarchically clustered and displayed in a heat map. MiR-142-3p was among the most downregulated miRNAs (in red font). (B) RT-qPCR analysis of miR-142-3p levels in UM cell lines (SP6.5 and M17) and uveal melanocytes (D78 and um95). (C) RT-qPCR analysis of miR-142-3p levels in UM tissues and adjacent tissues. 1–20: clinical samples 1–20 of UM and adjacent tissues. Each experiment was carried out three times in triplicates. **P<0.01. |
RT-qPCR was performed to validate if there is an association between tumorigenesis and the miR-142-3p expression levels in the UM cell lines and clinical specimens. It is noteworthy the miR-142-3p levels in the UM cell lines SP6.5 and M17 were approximately 5-fold lower than those in normal uveal melanocytes D78 and um95 (P<0.01, Figure 1B). Regarding the miR-142-3p expression levels in 20 clinical specimens, they were also significantly lower than those of the normal adjacent uveal tissues (P<0.001, Figure 1C). These results suggest that UM tumorigenesis is linked to miR-142-3p downregulation.
MiR-142-3p inhibits UM cell proliferation through impeding DNA synthesis and inducing cell cycle G1/G2 arrest
To determine if there is an association between changes in miR-142-3p expression levels and UM tumorigenesis, the effect of miR-142-3p transfection into SP6.5 and M17 cells on cell proliferation was determined. The MTS assay results showed that SP6.5 and M17 cell proliferation was suppressed by overexpression of miR-142-3p (Figure 2A). There was a significant decrease in cell number from day 3 to day 5 in SP6.5 cells (day 5, 30%±1% decrease, P<0.01), and from day 2 to day 5 in M17 cells (day 5, 34%±3% decrease, P<0.01). In addition, overexpression of miR-142-3p significantly reduced colony formation compared to the NC group (Figure 2B and C).
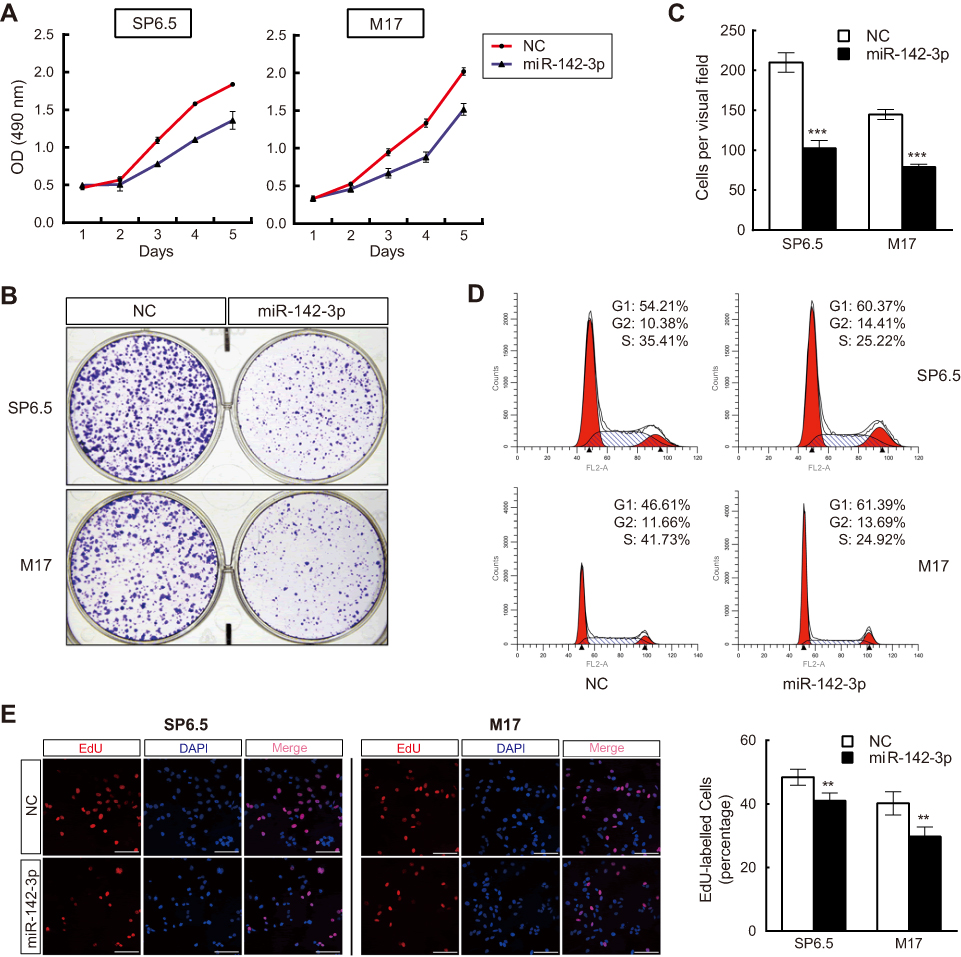 | Figure 2 MiR-142-3p inhibits uveal melanoma (UM) cell proliferation through cell cycle G1/G2 arrest and impeding DNA synthesis. (A) MTS assays of UM cells transfected with miR-142-3p or negative control (NC) (n=3/group). (B and C) Colony formation assay of UM cells transfected with miR-142-3p (n=3/group). (D) Cell cycle analysis of UM cells transfected with miR-142-3p (n=3/group). (E) DNA replication assay performed in UM cells transfected with miR-142-3p. Newly synthesized DNA was labeled with EdU (red) (n=3/group). Scale bars: 100 μm. **P<0.01, ***P<0.001. |
Cell cycle analysis revealed that miR-142-3p overexpression increased cell numbers in the G1 and G2 phases accompanied with a corresponding decrease in cells in the S phase (Figure 2D). These changes are reflective of declines in cell transition through the G1/S checkpoint. Similarly, DNA synthesis evaluation with the ethynyl-deoxyuridine (EdU) incorporation method showed that ectopic expression of miR-142-3p notably reduced the proportion of cells with newly replicated DNA (EdU-positive cells) compared with the NC (Figure 2E, P<0.01).
To further assess whether or not increases in apoptosis also accounted for miR-142-3p-mediated declines in cell growth, we carried out Hoechst staining, Annexin-V/PI double-staining, and the caspase 3/7 activity assay. However, changes in apoptosis incidence were not involved because there were no significant differences in nuclear morphology, apoptotic cell ratio, caspase 3/7 activity, or sensitivity to doxorubicin between miR-142-3p transfected cells and their NC counterpart (Figure 3). Therefore, it is apparent that miR-142-3p upregulation restrains UM cell proliferation through G1/G2 cell cycle arrest, and impeding DNA synthesis, rather than increasing apoptotic activity in UM cells.
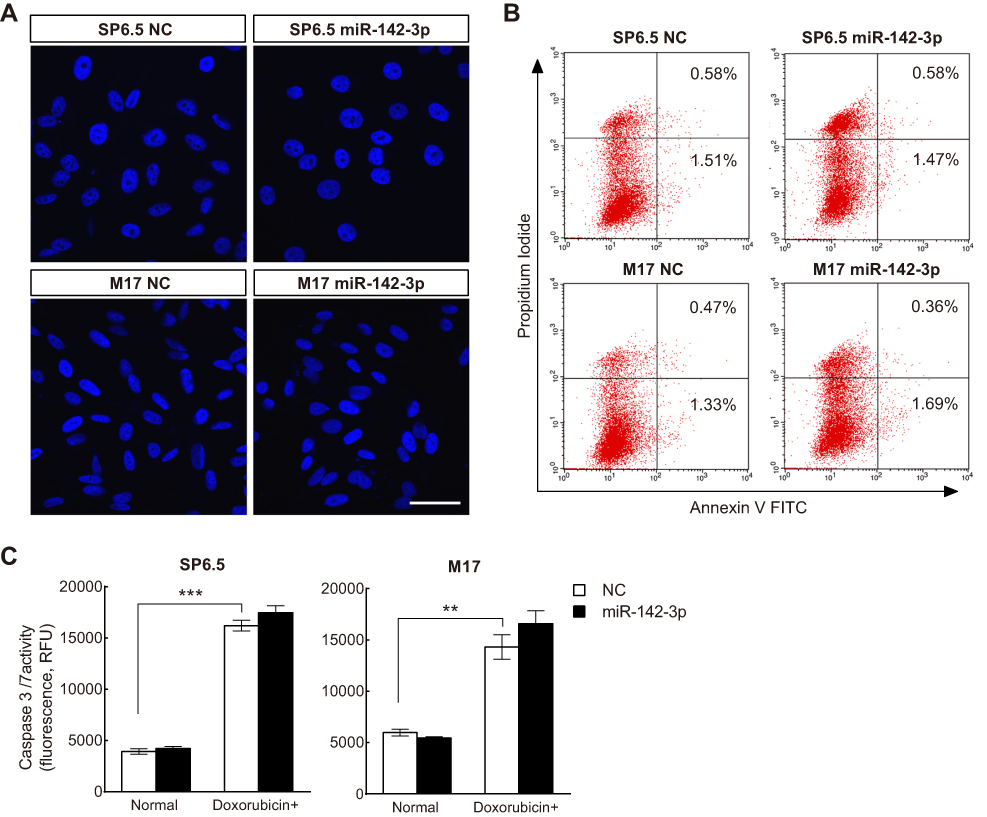 | Figure 3 Apoptotic activity assay in uveal melanoma (UM) cells transfected with miR-142-3p or NC. (A) Hoechst staining assay of UM cells transfected with miR-142-3p. Scale bars: 20 μm (n=3/group). (B) Annexin-V/PI double-staining assay of UM cells transfected with miR-142-3p. Cells were treated with Annexin V/PI and detected by flow cytometry (n=3/group). (C) Caspase 3/7 activity assay on UM cells transfected with miR-142-3p after doxorubicin treatment (n=3/group). Doxorubicin+, cells were treated with doxorubicin for 48 hrs. **P<0.01, ***P<0.001. |
MiR-142-3p suppresses UM cell migration and invasion
MiR-142-3p contributions to modulating cell migration and translayer permeation were evaluated based on determining if its upregulation delayed wound closure and translayer cell permeation. The scratch wound assay results indicated that miR-142-3p transfection of UM cells slowed wound closure relative to NC group (Figure 4A). Moreover, the number of the miR-142-3p transfected cells migrating to the underside of Transwell chambers decreased in comparison to the NC treated group (Figure 4B). Similarly, the miR-142-3p transfected cells displayed diminished invasive capacity relative to the NC cells (Figure 4C). Taken together, ectopic miR-142-3p expression hampers both UM cell migratory and invasive activity.
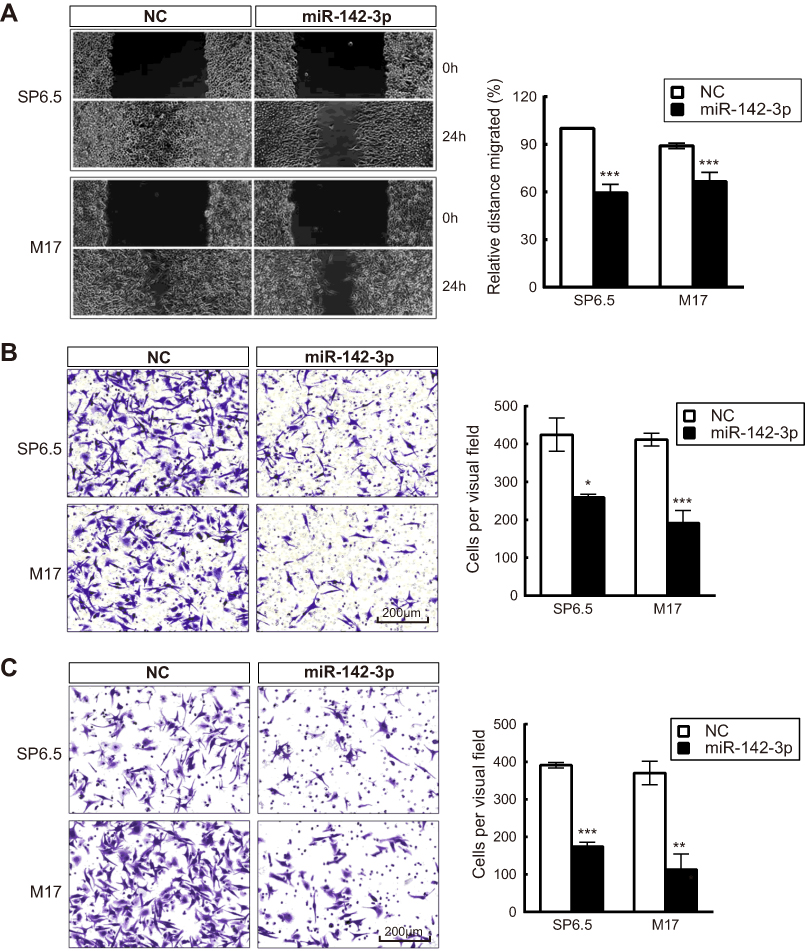 | Figure 4 Ectopic expression of miR-142-3p inhibits migratory and permeation activity of uveal melanoma (UM) cells. (A) Wound healing assay of UM cells transfected with miR-142-3p or NC (n=3/group). (B) Transwell assay of UM cells transfected with miR-142-3p or NC (n=3/group). (C) Matrigel invasion assay of UM cells transfected with miR-142-3p or NC (n=3/group). Cell permeation was assayed in transwells coated with matrigel. *P<0.05, **P<0.01, ***P<0.001. |
Mir-142-3p inhibits xenograft tumor growth in nude mice bearing UM cells
The in vivo relevance of miR-142-3p modulation was determined by using a suprachoroidal xenograft model in which the effects of miR-142-3p transfected UM cells or its NC were evaluated on their growth rates in the suprachoroidal space of athymic nude mice. After 3 weeks, the tumor size of miR-142-3p overexpressed xenografts was dramatically reduced compared to the NC xenografts (Figure 5). The miR-142-3p expression level was markedly increased in the miR-142-3p transfected xenografts compared to the NC group (
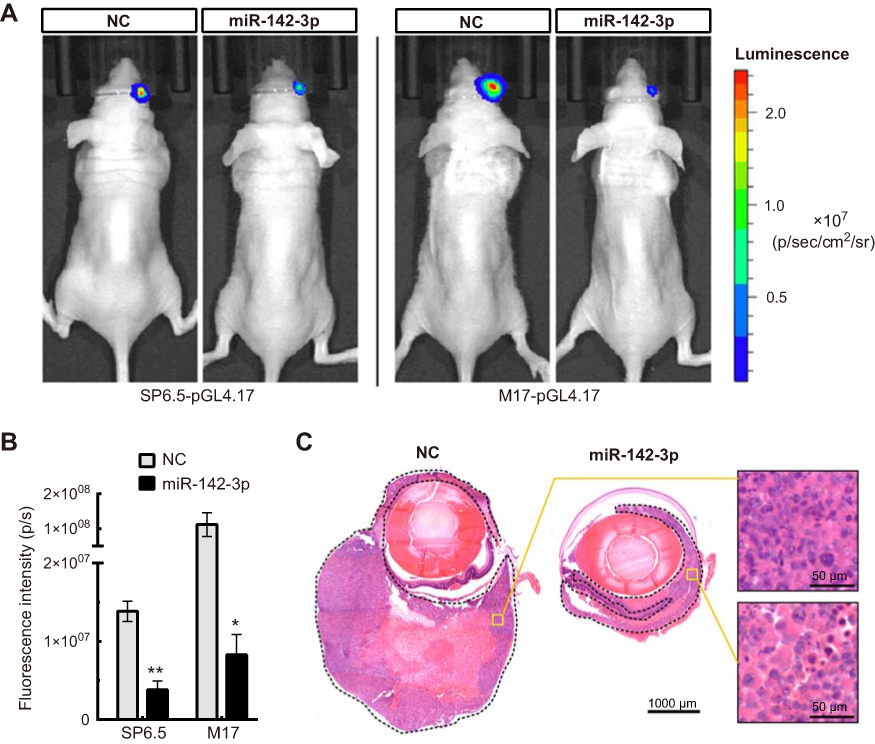 | Figure 5 Overexpression of miR-142-3p suppresses tumor growth in vivo. (A) In vivo biofluorescence imaging of nude mice following suprachoroidal injection of UM cells transfected with miR-142-3p or NC. (B) The quantitative data for the in vivo biofluorescence imaging assay (n=5/group). (C) Representative image of hematoxylin-eosin staining of eyeball sections from nude mice. The tumor tissues (formed by SP6.5-pGL4.17 cells) have been enclosed by a dashed line. *P<0.05, **P<0.01. |
Scatter plot analysis and miR-142-3p-target networks based on mRNA expression profiling
Transcriptomic microarray analysis was performed to compare gene expression profile changes in UM cells transfected with miR-142-3p with those transfected with the irrelevant NC. The transcriptomic analysis data have been deposited in ArrayExpress with accession number E-MTAB-6725. Figure 6A shows the genes whose expression levels changed by a factor greater than two: 782 were upregulated, whereas 545 were downregulated in SP6.5 cells. However, 854 were upregulated and 935 were downregulated in M17 cells, respectively. The results of the KEGG and gene ontology (GO) enrichment analysis indicate that miR-142-3p regulates multiple signaling pathways including MAPK, TGF-beta, Rap1, cGMP-PKG, and PI3K-Akt, and several cellular functions including endocytosis, focal adhesion, actin cytoskeleton, tight junction, and adherens junction (Figure 6B). As a validation, we examined two important regulatory constituents of the MAPK and PI3K-Akt pathways, ERK1/2 (MAPK3 and MAPK1) and Akt, by determining corresponding changes in their protein expression levels. Total ERK1/2 and Akt protein levels were unchanged after overexpression of miR-142-3p, but p-ERK1/2 and p-Akt expression levels decreased in both SP6.5 and M17 cells (Figure 6C).
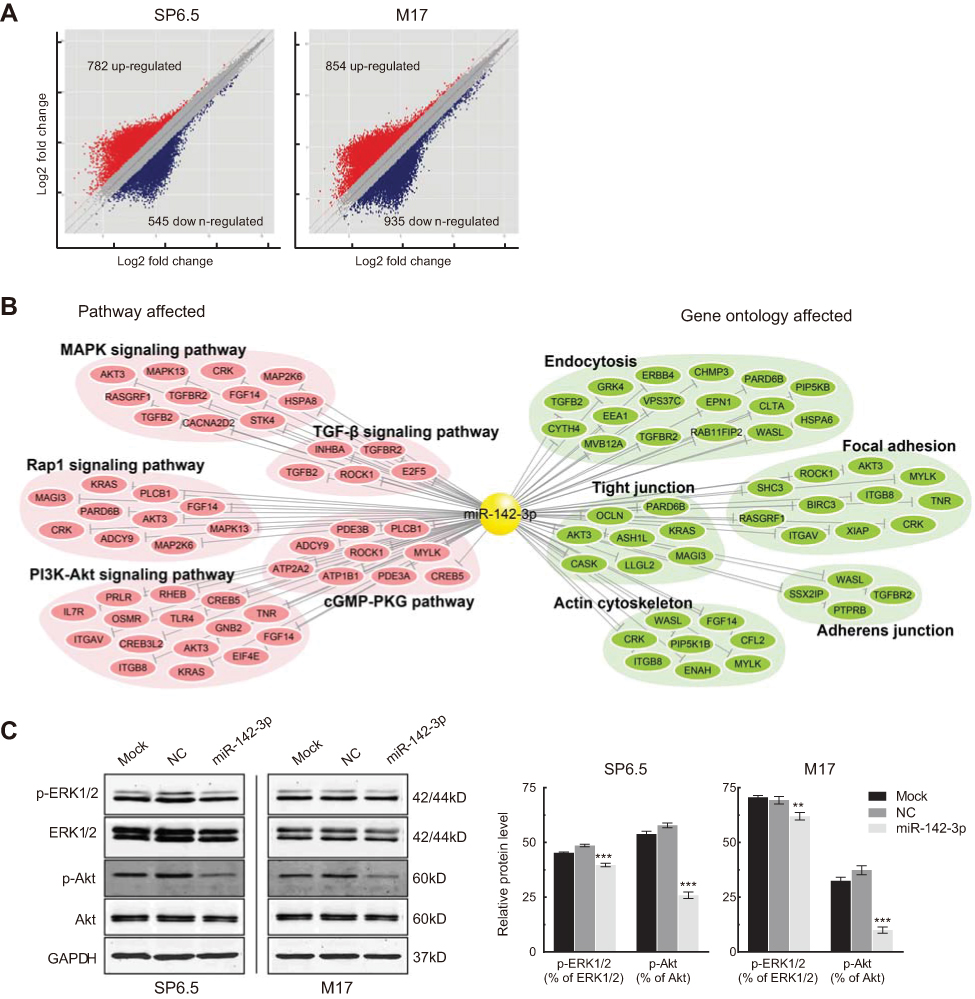 | Figure 6 Scatter plot analysis and miR-142-3p-target networks based on mRNA expression profiling. (A) Scatter plot analysis of gene expression profiling for uveal melanoma (UM) cells transfected with miR-142-3p or NC oligonucleotide. (B) A network of hsa-miR-142-3p and its predicted targets. The differentially expressed genes that were also the predicted target of hsa-miR-142-3p in several GO terms and pathway terms are selected to construct this network. (C) Western blot analysis of the expression of phospho-Akt (p-Akt), total Akt, phospho-ERK1/2 (p-ERK1/2), and total ERK1/2 in the UM cells transfected with miR-142-3p or NC. Representative data from three independent experiments are shown. **P<0.01, ***P<0.001. |
CDC25C, TGFβR1, GNAQ, WASL, and RAC1 are targets of miR-142-3p
In order to gain insight into the molecular mechanism underlying miR-142-3p function, we selected five candidate target genes of miR-142-3p for further analysis. They were chosen based on in silico prediction methods in combination with microarray assay results. Cell division cycle 25 homolog c (CDC25C), transforming growth factor beta receptor 1 (TGFβR1), guanine nucleotide-binding protein alpha-Q (GNAQ), Wiskott-Aldrich Syndrome like (WASL), and ras-related c3 botulinum toxin substrate 1 (RAC1) were selected as candidates for validation. As shown in
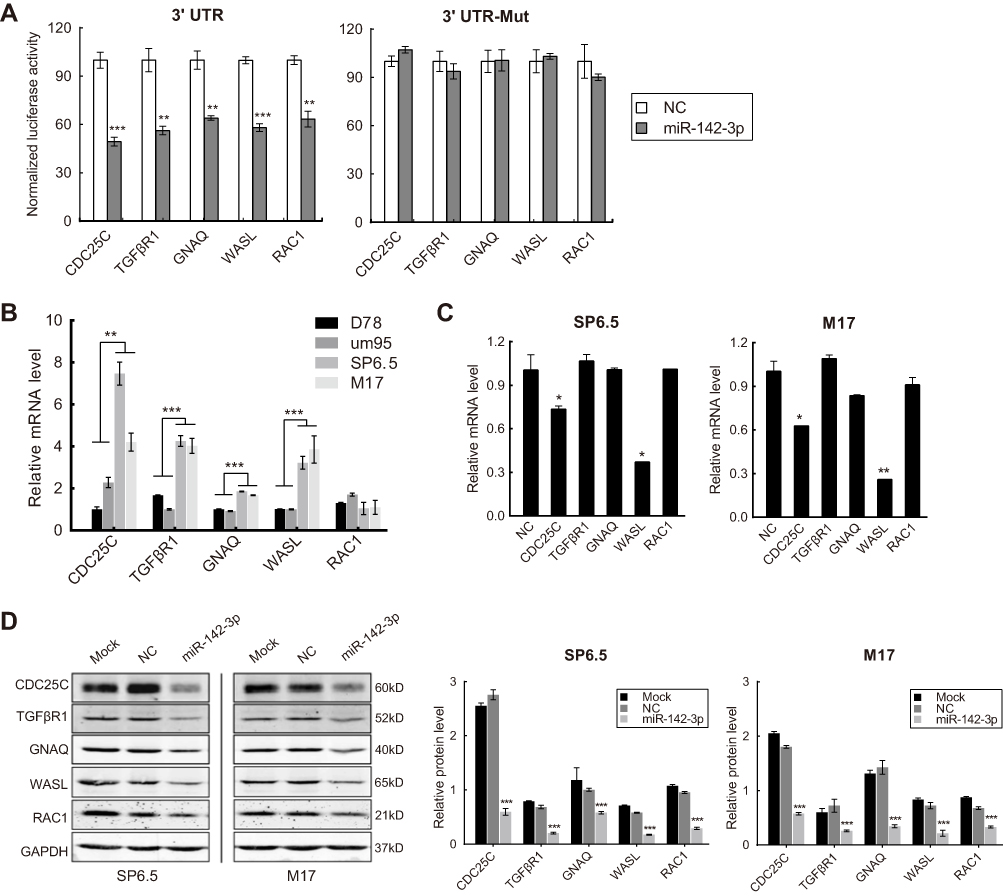 | Figure 7 CDC25C, TGFβR1, GNAQ, WASL, and RAC1 are targets of miR-142-3p. (A) Luciferase activity of HEK293 cells co-transfected with pLuc-targets 3′ UTR (left) or pLuc-targets 3ʹUTR-Mut (right), Renilla luciferase vector (transfection efficiency control), and miR-142-3p or NC. (B) RT-qPCR analysis of CDC25C, TGFβR1, GNAQ, WASL, or RAC1 mRNA levels in the uveal melanoma (UM) cells and uveal melanocytes. (C) RT-qPCR analysis of CDC25C, TGFβR1, GNAQ, WASL, or RAC1 mRNA levels in UM cells transfected with miR-142-3p or NC. (D) Western blot analysis of the protein levels of CDC25C, TGFβR1, GNAQ, WASL, or RAC1 in the UM cells transfected with miR-142-3p or NC. Each experiment was carried out three times. *P<0.05, **P<0.01, ***P<0.001. |
In addition, CDC25C, TGFβR1, GNAQ, and WASL mRNAs in the SP6.5 and M17 UM cell lines were markedly elevated compared with normal uveal melanocytes D78 and um95 (Figure 7B). MiR-142-3p overexpression in UM cells significantly reduced the mRNA levels of CDC25C and WASL (Figure 7C), and notably reduced the protein levels of CDC25C, TGFβR1, GNAQ, WASL, and RAC1 (Figure 7D). Therefore, CDC25C, TGFβR1, GNAQ, WASL, and RAC1 are direct gene targets of miR-142-3p in UM cells.
MiR-142-3p targets mediate differential effects on cell proliferation and migration
To confirm the identity of the aforementioned gene targets of miR-142-3p, we determined if their downregulation had the same effect as ectopic expression of this miRNA on responses controlled by these targets in UM cells. As indicated in Figure 8B, appreciable downregulation (Figure 8A) of the five targets with specific siRNA (GenePharma, Shanghai, China; See
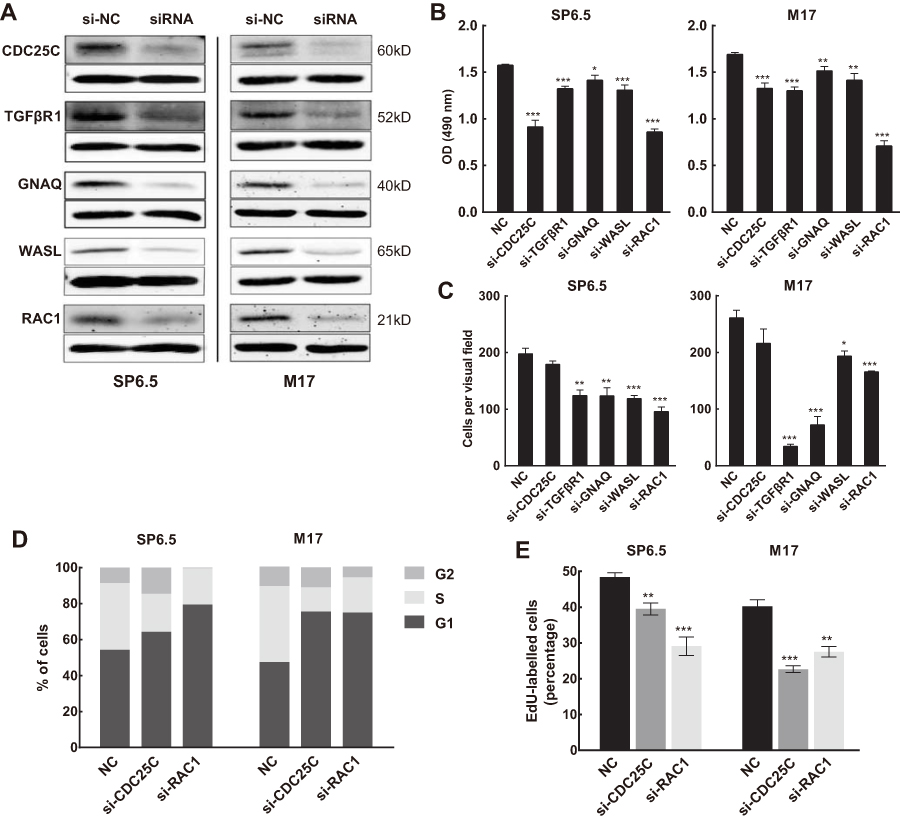 | Figure 8 MiR-142-3p targets mediate differential effects on uveal melanoma (UM) cell proliferation and migration. (A) Protein expression of CDC25C, TGFβR1, GNAQ, WASL, or RAC1 was efficiently knocked down by corresponding siRNA. (B) MTS assays of UM cells transfected with siRNA against CDC25C, TGFβR1, GNAQ, WASL, or RAC1 (n=3/group). (C) Transwell assay of UM cells transfected with siRNA against CDC25C, TGFβR1, GNAQ, WASL, or RAC1 (n=3/group). (D) Cell cycle analysis of UM cells transfected with siRNA against CDC25C or RAC1 (n=3/group). (E) DNA replication assay performed in UM cells transfected with siRNA against CDC25C or RAC1. Newly synthesized DNA was labeled with EdU (red) (n=3/group). *P<0.05, **P<0.01, ***P<0.001. |
As an important cell cycle-related protein, CDC25C is probably a key target through which miR-142-3p induces G1/G2 cell cycle arrest in UM cells. The results of cell cycle analysis confirmed this conjecture because CDC25C knockdown reduced cell cycle transitions through the G1/S checkpoint. As RAC1 also regulates cell cycle progression,30 this mode of action exists in UM cells because its knockdown led to G1 phase arrest (Figure 8D). In addition, DNA replication declined after transfection with either si-CDC25C or si-RAC1 (Figure 8E).
Discussion
Accumulating evidence shows that microRNA dysregulation is closely associated with the occurrence of diseases such as cancer.31 Thus, clarifying which specific miRNA or miRNA undergo large changes in specific diseases unravels potential biomarkers for improved disease diagnosis and prognosis. Here, we discovered that miR-142-3p was dramatically decreased in both UM cell lines and clinical specimens whereas its overexpression caused G1/G2 cell cycle arrest and suppressed DNA replication in UM cells. In addition, miR-142-3p downregulation is required for promoting cell migratory and invasive behaviors. Therefore, monitoring changes in miR-142-3p expression levels has the potential to be a biomarker of UM.
Taking into account the in silico results to make predictions based on microarray assays, we chose CDC25C, TGFβR1, GNAQ, WASL, and RAC1 as candidates for further investigation regarding their potential for use in improving management of this very insidious disease.
Each one of these potential candidates that we identified is known to be relevant for supporting cell survival and proliferation. CDC25C is an important cell cycle-related protein that promotes G2/M phase transition by dephosphorylating the mitosis-promoting factor cyclin B/cdk1.32 CDC25C is reported to be abnormally elevated in lung, breast, and cervical cancer33 and has a role in regulating DNA replication.34 TGFβR1 functions as a transducer, delivering extracellular signals controlling gene expression involved in a myriad of functions. This receptor is frequently upregulated in various types of cancer, such as keratoacanthoma, squamous cell carcinoma, oropharyngeal cancer, and cervical cancer.35,36 GNAQ is the alpha subunit of GTP binding proteins, which are important modulators or transducers in various transmembrane signaling systems.37 Changes in GNAQ expression are highly susceptible to UM formation. This is evident because 36–49% of patients presented with GNAQ mutations in a number of studies.20,38,39 WASL mediates the signal from cell surface receptors to the actin cytoskeleton and in turn accelerates the polymerization of actin through activating the ARP2/3 complex.40 RAC1 is a small GTP-binding protein that regulates actin polymerization.41 It is involved in mediating lamellipodia protrusion, cell proliferation, and migration.42,43 In addition, RAC1 is also involved in the regulation of cell cycle progression.30 In the current study, we also confirmed that CDC25C, TGFβR1, GNAQ, and WASL mRNA expression was markedly elevated in UM cells. Downregulating CDC25C, TGFβR1, GNAQ, WASL, or RAC1 mimicked the effects of miR-142-3p overexpression which inhibiting UM cell proliferation and/or migration. Knockdown of CDC25C and RAC1 induced cell cycle arrest and impeded DNA synthesis. Our microarray analysis implied that WASL plays multiple roles in the regulation of endocytosis, the actin cytoskeletal structure, and cell junction formation in UM cells. Based on the above information, TGFβR1 and GNAQ act as oncogenes in UM, and CDC25C, WASL, and RAC1 are three very relevant miR-142-3p gene targets holding out a promise for improved therapeutic management in UM.
In summary, we have made significant progress towards clarifying the important roles that miR-142-3p plays in regulating UM cellular functions. Our findings indicate that miR-142-3p acts as a tumor suppressor by targeting CDC25C, TGFβR1, GNAQ, WASL, and RAC1. It is conceivable that a strategy to induce miR-142-3p upregulation is potentially a promising avenue for improved clinical management of UM.
Acknowledgments
The authors thank Dr. Guy Pelletier (Research Center of Immunology, Quebec, Canada) for kindly providing the SP6.5 UM cell line. This research was supported by the National Natural Science Foundation of China (81272286 and 81301776), Major Program of Science Foundation of the Affiliated Eye Hospital of Wenzhou Medical University (YNZD201002), and Science Foundation of Wenzhou Medical University (QTJ11020). We would like to thank LetPub for providing linguistic assistance during the preparation of this manuscript.
Author contributions
Conception and design: DY and JQ; acquisition of data: DP, DNH, JD, YZ, XP, JT, and LW; analysis and interpretation of data: DP, XC, JD, and YZ; writing, review, and/or revision of the manuscript: DY, JQ, PSR, and DP. All authors contributed to data analysis, drafting and revising the article, gave final approval of the version to be published, and agree to be accountable for all aspects of the work.
Disclosure
The authors report no conflicts of interest in this work.
References
1. He L, Hannon GJ. MicroRNAs: small RNAs with a big role in gene regulation. Nat Rev Genet. 2004;5(7):522–531. doi:10.1038/nrg1379
2. Lee RC, Feinbaum RL, Ambros V. The C. elegans heterochronic gene lin-4 encodes small RNAs with antisense complementarity to lin-14. Cell. 1993;75(5):843–854.
3. Lewis BP, Burge CB, Bartel DP. Conserved seed pairing, often flanked by adenosines, indicates that thousands of human genes are microRNA targets. Cell. 2005;120(1):15–20. doi:10.1016/j.cell.2004.12.035
4. Zhang B, Pan X, Cobb GP, Anderson TA. microRNAs as oncogenes and tumor suppressors. Dev Biol. 2007;302(1):1–12. doi:10.1016/j.ydbio.2006.08.028
5. Calin GA, Croce CM. MicroRNA signatures in human cancers. Nat Rev Cancer. 2006;6(11):857–866. doi:10.1038/nrc1997
6. Chai S, Tong M, Ng KY, et al. Regulatory role of miR-142-3p on the functional hepatic cancer stem cell marker CD133. Oncotarget. 2014;5(14):5725–5735. doi:10.18632/oncotarget.2167
7. Lee YY, Yang YP, Huang MC, et al. MicroRNA142-3p promotes tumor-initiating and radioresistant properties in malignant pediatric brain tumors. Cell Transplant. 2014;23(4–5):669–690. doi:10.3727/096368914X678364
8. Lagrange B, Martin RZ, Droin N, et al. A role for miR-142-3p in colony-stimulating factor 1-induced monocyte differentiation into macrophages. Biochim Biophys Acta. 2013;1833(8):1936–1946. doi:10.1016/j.bbamcr.2013.04.007
9. Nishiyama T, Kaneda R, Ono T, et al. miR-142-3p is essential for hematopoiesis and affects cardiac cell fate in zebrafish. Biochem Biophys Res Commun. 2012;425(4):755–761. doi:10.1016/j.bbrc.2012.07.148
10. Dahlhaus M, Roolf C, Ruck S, Lange S, Freund M, Junghanss C. Expression and prognostic significance of hsa-miR-142-3p in acute leukemias. Neoplasma. 2013;60(4):432–438. doi:10.4149/neo_2013_056
11. Schwickert A, Weghake E, Bruggemann K, et al. microRNA miR-142-3p inhibits breast cancer cell invasiveness by synchronous targeting of WASL, integrin alpha V, and additional cytoskeletal elements. PLoS One. 2015;10(12):e0143993. doi:10.1371/journal.pone.0143993
12. Deng B, Zhang Y, Zhang S, Wen F, Miao Y, Guo K. MicroRNA-142-3p inhibits cell proliferation and invasion of cervical cancer cells by targeting FZD7. Tumour Biol. 2015;36(10):8065–8073. doi:10.1007/s13277-015-3483-2
13. Wu L, Cai C, Wang X, Liu M, Li X, Tang H. MicroRNA-142-3p, a new regulator of RAC1, suppresses the migration and invasion of hepatocellular carcinoma cells. FEBS Lett. 2011;585(9):1322–1330. doi:10.1016/j.febslet.2011.03.067
14. Krantz BA, Dave N, Komatsubara KM, Marr BP, Carvajal RD. Uveal melanoma: epidemiology, etiology, and treatment of primary disease. Clin Ophthalmol. 2017;11:279–289. doi:10.2147/OPTH.S89591
15. Damato B. Progress in the management of patients with uveal melanoma. The 2012 Ashton Lecture. Eye. 2012;26(9):1157–1172. doi:10.1038/eye.2012.126
16. Woodman SE, Williams MD, Esmaeli B. Uveal melanoma—molecular basis and potential treatment targets. US Ophthalmic Rev. 2011;4(2):131–135. doi:10.17925/USOR.2011.04.02.131
17. Yan D, Zhou X, Chen X, et al. MicroRNA-34a inhibits uveal melanoma cell proliferation and migration through downregulation of c-Met. Invest Ophthalmol Vis Sci. 2009;50(4):1559–1565. doi:10.1167/iovs.08-2681
18. Chen X, Wang J, Shen H, et al. Epigenetics, microRNAs, and carcinogenesis: functional role of microRNA-137 in uveal melanoma. Invest Ophthalmol Vis Sci. 2011;52(3):1193–1199. doi:10.1167/iovs.10-5272
19. Chen X, He D, Dong XD, et al. MicroRNA-124a is epigenetically regulated and acts as a tumor suppressor by controlling multiple targets in uveal melanoma. Invest Ophthalmol Vis Sci. 2013;54(3):2248–2256. doi:10.1167/iovs.12-10977
20. Van Raamsdonk CD, Bezrookove V, Green G, et al. Frequent somatic mutations of GNAQ in uveal melanoma and blue naevi. Nature. 2009;457(7229):599–602. doi:10.1038/nature07586
21. Hu DN, McCormick SA. Biochemical pathways: different gene expression and cellular pathways determining tumor phenotype comparison of uveal melanocytes and uveal melanoma cells. In: Albert DM, Polans A, editors. Ocular Oncology. New York: Marcel Dekker; 2003:189–210.
22. Soulieres D, Rousseau A, Deschenes J, Tremblay M, Tardif M, Pelletier G. Characterization of gangliosides in human uveal melanoma cells. Int J Cancer. 1991;49(4):498–503.
23. Hu DN, McCormick SA, Ritch R, Pelton-Henrion K. Studies of human uveal melanocytes in vitro: isolation, purification and cultivation of human uveal melanocytes. Invest Ophthalmol Vis Sci. 1993;34(7):2210–2219.
24. Livak KJ, Schmittgen TD. Analysis of relative gene expression data using real-time quantitative PCR and the 2(-Delta Delta C(T)) Method. Methods. 2001;25(4):402–408. doi:10.1006/meth.2001.1262
25. Ogata H, Goto S, Sato K, Fujibuchi W, Bono H, Kanehisa M. KEGG: Kyoto Encyclopedia of Genes and Genomes. Nucleic Acids Res. 1999;27(1):29–34.
26. Ashburner M, Ball CA, Blake JA, et al. Gene ontology: tool for the unification of biology. The gene ontology consortium. Nat Genet. 2000;25(1):25–29. doi:10.1038/75556
27. Agarwal V, Bell GW, Nam JW, Bartel DP. Predicting effective microRNA target sites in mammalian mRNAs. Elife. 2015;4:e05005.
28. Wong N, Wang X. miRDB: an online resource for microRNA target prediction and functional annotations. Nucleic Acids Res. 2015;43(Database issue):D146–D152. doi:10.1093/nar/gku1104
29. Reikofski J, Tao BY. Polymerase chain reaction (PCR) techniques for site-directed mutagenesis. Biotechnol Adv. 1992;10(4):535–547.
30. Yoshida T, Zhang Y, Rivera Rosado LA, et al. Blockade of Rac1 activity induces G1 cell cycle arrest or apoptosis in breast cancer cells through downregulation of cyclin D1, survivin, and X-linked inhibitor of apoptosis protein. Mol Cancer Ther. 2010;9(6):1657–1668. doi:10.1158/1535-7163.MCT-09-0906
31. Adams BD, Anastasiadou E, Esteller M, He L, Slack FJ. The inescapable influence of noncoding RNAs in cancer. Cancer Res. 2015;75(24):5206–5210. doi:10.1158/0008-5472.CAN-15-1989
32. Hoffmann I, Clarke PR, Marcote MJ, Karsenti E, Draetta G. Phosphorylation and activation of human cdc25-C by cdc2--cyclin B and its involvement in the self-amplification of MPF at mitosis. Embo J. 1993;12(1):53–63.
33. Cao XC, Yu Y, Hou LK, et al. miR-142-3p inhibits cancer cell proliferation by targeting CDC25C. Cell Prolif. 2016;49(1):58–68. doi:10.1111/cpr.12235
34. Turowski P, Franckhauser C, Morris MC, Vaglio P, Fernandez A, Lamb NJ. Functional cdc25C dual-specificity phosphatase is required for S-phase entry in human cells. Mol Biol Cell. 2003;14(7):2984–2998. doi:10.1091/mbc.e02-08-0515
35. Berger F, Geddert H, Faller G, Werner M, Dimmler A. Pattern of TGFbeta receptor 1 expression differs between kras-mutated keratoacanthomas and squamous cell carcinomas of the skin. Pathol Res Pract. 2014;210(9):596–602. doi:10.1016/j.prp.2014.05.006
36. Levovitz C, Chen D, Ivansson E, et al. TGFbeta receptor 1: an immune susceptibility gene in HPV-associated cancer. Cancer Res. 2014;74(23):6833–6844. doi:10.1158/0008-5472.CAN-14-0602-T
37. Vemula S, Griewank K, Bastian B. GNAQ (guanine nucleotide binding protein (G protein), q polypeptide). Atlas Genet Cytogenet Oncol Haematol. 2011;15(10):831–835.
38. Populo H, Vinagre J, Lopes JM, Soares P. Analysis of GNAQ mutations, proliferation and MAPK pathway activation in uveal melanomas. Br J Ophthalmol. 2011;95(5):715–719. doi:10.1136/bjo.2009.174417
39. Onken MD, Worley LA, Long MD, et al. Oncogenic mutations in GNAQ occur early in uveal melanoma. Invest Ophthalmol Vis Sci. 2008;49(12):5230–5234. doi:10.1167/iovs.08-2145
40. Uenishi E, Shibasaki T, Takahashi H, et al. Actin dynamics regulated by the balance of neuronal Wiskott-Aldrich syndrome protein (N-WASP) and cofilin activities determines the biphasic response of glucose-induced insulin secretion. J Biol Chem. 2013;288(36):25851–25864. doi:10.1074/jbc.M113.464420
41. Boshans RL, Szanto S, van Aelst L, D‘Souza-Schorey C. ADP-ribosylation factor 6 regulates actin cytoskeleton remodeling in coordination with Rac1 and RhoA. Mol Cell Biol. 2000;20(10):3685–3694.
42. Waterman-Storer CM, Worthylake RA, Liu BP, Burridge K, Salmon ED. Microtubule growth activates Rac1 to promote lamellipodial protrusion in fibroblasts. Nat Cell Biol. 1999;1(1):45–50. doi:10.1038/9018
43. Su J, Li H. RAC1 overexpression promotes the proliferation, migration and epithelial-mesenchymal transition of lens epithelial cells. Int J Clin Exp Pathol. 2015;8(9):10760–10767.
 © 2019 The Author(s). This work is published and licensed by Dove Medical Press Limited. The full terms of this license are available at https://www.dovepress.com/terms.php and incorporate the Creative Commons Attribution - Non Commercial (unported, v3.0) License.
By accessing the work you hereby accept the Terms. Non-commercial uses of the work are permitted without any further permission from Dove Medical Press Limited, provided the work is properly attributed. For permission for commercial use of this work, please see paragraphs 4.2 and 5 of our Terms.
© 2019 The Author(s). This work is published and licensed by Dove Medical Press Limited. The full terms of this license are available at https://www.dovepress.com/terms.php and incorporate the Creative Commons Attribution - Non Commercial (unported, v3.0) License.
By accessing the work you hereby accept the Terms. Non-commercial uses of the work are permitted without any further permission from Dove Medical Press Limited, provided the work is properly attributed. For permission for commercial use of this work, please see paragraphs 4.2 and 5 of our Terms.