")
Back to Journals » Cancer Management and Research » Volume 11
miR-140-5p alleviates the aggressive progression of Wilms’ tumor through directly targeting TGFBR1 gene
Received 17 June 2018
Accepted for publication 4 January 2019
Published 19 February 2019 Volume 2019:11 Pages 1641—1651
DOI https://doi.org/10.2147/CMAR.S177508
Checked for plagiarism Yes
Review by Single anonymous peer review
Peer reviewer comments 3
Editor who approved publication: Dr Kenan Onel
This paper has been retracted
Hailei Wang,1 Chunyan Lou,1 Na Ma2
1Department of Pediatrics, Huaihe Hospital of Henan University, Kaifeng, Henan, China; 2Department of Neurology, Henan Kaifeng Children’s Hospital, Kaifeng, Henan, China
Background and objective: Although many miRNAs are identified to be deregulated and play vital roles in the progression of Wilms’ tumor (WT), there are still a large number of miRNAs are waiting for us to explore. The purpose of the present study is to investigate the different expressing profiles of miRNAs in WT tissues and the adjacent normal tissues, and probe the effects and mechanism of a certain miRNA among the different expressing miRNAs.
Methods: miRNA microarray was recruited to assess the differently expressed miRNAs in WT tissues and normal tissues, which was further verified by RT-PCR. Receiver operating characteristic curves were performed to calculate the specificity and sensitivity of miRNAs in the diagnose of WT. CCK-8, flow cytometry, wound healing, transwell chamber and tumor-burdened assays were used to assess cell growth, apoptosis, migration, invasion and tumorigenesis. Luciferase report assay was used to evaluate the interaction between miR-140-5p and TGFBR1.
Results: A total of 34 miRNAs were abnormally expressed in the WT tissues, among which, miR-140-5p was identified to be obviously down-regulated in WT tissues, and the AUC of it was 0.961. Besides, we found that patients with miR-140-5p low expression always had a shorter overall survival and more aggressive clinical features, such as bigger tumor size (P=0.002), higher pathological stage (P=0.003) and higher occurrence rate of lymph node metastasis (P=0.009) than those in patients with miR-140-5p high expression. Moreover, luciferase reporter assay showed that TGFBR1 was the direct target of miR-140-5p, which was negatively regulated by miR-140-5p and was highly expressed in WT tissues. Furthermore, knockdown of miR-140-5p obviously enhanced the proliferation and tumorigenesis and repressed the apoptosis of G401 cells, and these effects were all abolished when TGFBR1 was down-regulated.
Conclusion: The present study illustrates that miR-140-5p functions as a tumor suppressor in the occurrence and development of WT via targeting TGFBR1, which provides theoretical foundation for serving miR-140-5p as a new diagnosis marker even a therapeutic target for WT.
Keywords: miR-140-5p, TGFBR1, Wilms’ tumor
Introduction
Wilms’ tumor (WT), also known as nephroblastoma, is the most usual malignant pediatric renal tumor,1 which prevails in children of age <5 years and affects approximately one per 10,000 children worldwide.2 Owing to the recent advancements in the diagnosis and treatment protocols, the overall survival rates of WT patients exceeded 90% in 2009,3 which was significantly higher than that of about 30% in the 1930s.4 However, 13% of WT patients relapse in the first 2 years after treatment.5 It is identified that gene abnormalities trigger the unbounded growth of tumor cells and expedite the occurrence and development of WT.6,7 However, the molecular mechanisms accounting for the progression of WT are not completely understood.
MiRNAs are a class of small, endogenous, and non-coding RNA molecules, 18–25 nucleotides in length. MiRNAs induce the post-transcriptional repression of their target genes through pairing with the respective mRNA8 and widely take part in the regulation of majority of physiological processes, including cell apoptosis, proliferation, survival, cell cycle, and differentiation.9 Given that >50% of miRNAs are located in cancer-associated genomic regions or in fragile sites, they are of importance in the pathogenesis of many types of cancers,10,11 including WT. For example, Ludwig et al12 performed microarrays to identify the miRNA expression profiling of 36 WT tissues and four normal kidney tissues, and found that miRNAs-183, -301a/b, and -335 were upregulated in the blastemal subtype, while miRNAs-181b, -223, and -630 were upregulated in the regressive subtype. Jiang et al13 demonstrated that miR-1180 was overexpressed in WT tissues, and knockdown of it induced the apoptosis of SK-NEP-1 cells and decreased tumor growth in nude mice. Liu et al14 demonstrated that knockdown of miR-19b obviously inhibited the proliferation, invasion, and migration of SK-NEP-1 WT cells. All these findings suggest the vital roles that miRNAs play in the development and progression of WT.
Furthermore, many studies have reported on the important role of miRNAs in the diagnosis and treatment of WT.15,16 Ludwig et al16 indicated that miRNAs such as miRs-130b-3p, -100-5p, and -143-3p had the highest diagnostic potentials with the area under the curve (AUC) of 0.94, 0.90, and 0.89, respectively. The accuracy of these three miRNAs in distinguishing WT patients from healthy individuals was 84.58%, sensitivity was 76.67%, and specificity was 92.5%. Moreover, the deregulation of certain miRNAs may explain the occurrence and development of chemoradiotherapy resistance in WT.17 Despite the fact that many miRNAs have been identified to be strongly involved in the progression of WT, there are still many miRNAs that need to be explored.
To further explore whether miRNAs can serve as hopeful prognostic markers for WT and dissect their roles in the progression of WT, we assessed different miRNA expression profiles of three paired WT tissues and paracancerous tissue samples using miRNA microarray. MiR-140-5p was identified to be significantly downregulated in the WT tissues and displayed high clinical value in the diagnosis of WT. Functional experiments clarified that miR-140-5p suppressed the progression of WT by targeting TGFBR1.
Materials and methods
Patients and tissue samples
A total of 95 cases of WT patients were chosen for our study. To identify the specific miRNA profiles in WT tissue, we selected three matched tumor tissues and adjacent tissues randomly. The written informed consent was obtained from every participant or his/her parents. This study involved human samples and was conducted in accordance with the Helsinki Declaration; the study was approved by the ethical committee of Henan Kaifeng Children Hospital.
miRNA microarray for miRNA profiles
Total RNA was extracted from three paired WT tissues and the adjacent non-tumor tissues. The miRCURYTM Array Labeling kit was used to label the total RNA, and the miRCURYTM Array was used for hybridization. The image of the chip was scanned with Axon GenePix 4000B and excited at 635 nm. The image was stored as Tagged Image File (TIF) format, with GenePix pro V6.0 for data analysis, and the results were exported to Excel file format. Cluster software was used to cluster the results of the different expression profiles of miRNAs between WT tissues and non-tumor tissues. If the expression pattern of miRNA in WT tissue samples showed more than twofold change and a P-value of <0.05 concurrently when compared to those in adjacent non-tumor tissue samples, then those miRNAs were considered to be significantly differentially expressed between the two groups.
Cell culture
Normal renal tubular epithelial cell line HK-2 was purchased from Chinese Academy of Medical Sciences (Shanghai, China) and cultured in keratinocyte serum-free medium (Thermo Fisher Scientific, Waltham, MA, USA) supplemented with gentamicin/amphotericin solution 500X (Thermo Fisher Scientific). Human WT cell lines SK-NEP-1 and G401 were purchased from American Tissue Culture Collection (ATCC, Rockville, MD, USA). SK-NEP-1 cells were cultured in McCoy’s 5A medium (Sigma-Aldrich Co., St Louis, MO, USA) supplemented with NaHCO3 (2.2 g/L), 15% FBS (Thermo Fisher Scientific), and 1% penicillin/streptomycin (Thermo Fisher Scientific). G401 cells were routinely maintained in McCoy’s 5A medium supplemented with 10% FBS, and all cells were maintained at 37°C in a humidified atmosphere with 5% CO2.
Cell transfection
To upregulate or downregulate the expression of miR-140-5p in cells, the mimic or inhibitor of miR-140-5p obtained from Guangzhou RuiBo Company (Guangzhou, Guangdong, China) was transfected into WT G401 or SK-NEP-1 cells at 50%–60% confluence with Lipofectamine 2000 (Thermo Fisher Scientific). ShRNAs that target human TGFBR1 gene were obtained from OriGene (No TL320549; Rockville, MD, USA) and used to knockdown TGFBR1 expression in G401 or SK-NEP-1 cells.
Real-time PCR (RT-PCR) analysis
For RT-PCR analysis of miRNAs, total RNA was extracted from tissue samples using a miRNA Purification Kit (CWBIO, Beijing, China), followed by reversed transcription to cDNA with a miRNA cDNA Synthesis Kit (CWBIO). Then gene expression was assessed by RT-PCR using miRNA qPCR Assay Kit (CWBIO). The relative levels of mRNA were calculated by the 2−∆∆Ct method. U6 small RNA was used as an internal control for normalization and quantification of miRNAs.
Western blotting analysis
Total protein was extracted from G401 cells with RIPA buffer containing 1% protease inhibitor (Sigma-Aldrich Co.). After quantification with bicinchoninic acid method (Sigma-Aldrich Co.), 20 µg of protein from each sample was submitted to 10% SDS-PAGE and then transferred to nitrocellulose membranes (Thermo Fisher Scientific). Next, the membrane was blocked with 5% nonfat milk diluted in Tris-buffered saline with 0.1% Tween 20 and incubated with the primary antibody against TGFBR1 (No ab31013; Abcam, Cambridge, UK) or GAPDH (No ab9485; Abcam) overnight at 4°C, followed by incubation with horse radish peroxidase-conjugated secondary antibody (Zhongshan Jinqiao Biology Company, Beijing, China). Finally, the proteins were visualized by enhanced chemiluminescence technique (EMD Millipore, Billerica, MA, USA) and quantified using Quantity One software.
Cell proliferation and apoptosis
Cell counting kit-8 (CCK-8) assay (Dojindo, Tokyo, Japan) was performed to determine cell proliferation. About 5×10³ G401 or SK-NEP-1 cells were seeded into 96-well plate and transfected with mimics, inhibitor, inhibitor + sh-TGFBR1, or their negative control oligonucleotides, respectively. The culture medium was removed and 100 µL of CCK-8 medium was added into the 96-well plate after 5 days of transfection and incubated at 37°C for another 4 hours. The absorbance at 450 nm was measured using a microplate reader (Bio-Rad, Richmond, CA, USA).
Cell apoptosis was determined by flow cytometry using an Annexin V-FITC/propidium iodide apoptosis detection kit (BD Biosciences, San Jose, CA, USA), as described in a previous study.18 After staining, the cells were submitted to a flow cytometer (BD Biosciences), and the apoptosis rate was analyzed by Flowjo 7.6 software.
Cell migration and invasion
Wound healing assay was used to evaluate cell migration. Briefly, G401 cells were seeded in six-well plate and incubated overnight, followed by transfection with mimic or inhibitor of miR-140-5p or their negative control. Then scratching was done with 20 µL pipette tips when the confluence reached 100%. Then the cells were washed several times with PBS to remove the floating cells, and the medium was replaced with fresh cell culture medium without FBS. Photographs were taken at 0 and 24 hours after the scratching step.
For cell invasion, G401 cells (1×10⁵ cells suspended in 200 µL of culture medium without FBS) transfected with a mimic or inhibitor of miR-140-5p or their negative control were seeded onto the top chamber of a transwell coated with Matrigel, and 600 µL of complete culture medium was added into the bottom chamber synchronously. Then, the transwell was kept in a cell incubator for 48 hours. Next, the non-invasive cells in the top chamber were wiped using cotton swabs and cells in the bottom chamber were fixed in 4% paraformaldehyde and stained with 0.25% crystal violet for 10 minutes. Photographs were taken in five randomly selected fields using a microscope under 200× magnification.
Luciferase reporter assay
G401 cells were transiently co-transfected with the luciferase reporter plasmid containing the wild type of TGFBR1 3′-UTR or the mutant type of TGFBR1 with the binding sites mutated (GenePharma, Shanghai, China) and miR-140-5p mimic or mimic-NC, miR-140-5p inhibitor or inhibitor-NC. Then luciferase activities were measured at 48-hour post-transfection using the Dual-Luciferase Reporter Assay System (Promega, Fitchburg, WI, USA) according to the manufacturer’s protocol. Renilla luciferase activity was used to normalize the luciferase activity of firefly.
In vivo tumor-burdened experiment
For animal assay, 18 male BALB/c nude mice weighing 18–20 g were purchased from Shanghai Biomodel Organism Science & Technology Development Co., Ltd (Shanghai, China). Mice were fed in specific pathogen-free conditions on a 12-hour light/dark cycle with standard food and water for 1 week before experiment. The nude mice were randomly divided into three groups: control group (G401 cells), miR-140-5p inhibitor group (G401 cells treated with miR-140-5p inhibitor), and miR-140-5p + sh-TGFBR1 group (G401 cells treated with miR-140-5p inhibitor and sh-TGFBR1 together), with six mice in each group. About 2×10⁶ cells (suspended in 0.2 mL PBS) were injected into the right lateral upper arm of each nude mice. Twenty-eight days after the implantation, all mice were euthanized and tumors were removed and weighed. The protocols involving animals were performed in accordance with the Animal Experiment Ethics Review of Henan Kaifeng Children Hospital, which also approved this study.
Data analysis
Each experiment was performed at least in triplicate, and the results are expressed as the mean ± SD. Receiver operating characteristic (ROC) curves were constructed to calculate the AUC, intending to evaluate the specificity and sensitivity of serving miRNAs as the diagnostic biomarkers for WT. The log-rank test was performed to compare the survival of patients with high/low levels of miR-140-5p. Student’s t-test or one-way ANOVA was carried out to analyze the differences between two groups or >2 groups, and P-value <0.05 was regarded as statistically significant.
Results
Expression profiles of miRNAs in WT tissues and the adjacent non-tumor tissues
First, we determined the different miRNA expression profiles in three matched WT tissues and the adjacent non-tumor tissues through miRNA microarray analysis. A total of 34 miRNAs were identified to be differently expressed in WT tissues and the adjacent non-tumor tissues significantly (all P-values <0.01); of those, eleven miRNAs were upregulated while 23 miRNAs were downregulated in the WT group as compared to that of the adjacent tumor tissues (Table 1, Figure 1). Next, we performed RT-PCR to verify the expression of these 34 different expression miRNAs in 95 paired WT tissues and the adjacent non-tumor tissues. Results demonstrated that miR-141, miR-214, miR-140-5p, and miR-193a-3p were significantly downregulated in the WT tissues as compared to those in the adjacent normal tissues, and miR-140-5p showed the lowest expression level (Figure 2), suggesting that these miRNAs might be involved in the progression of WT.
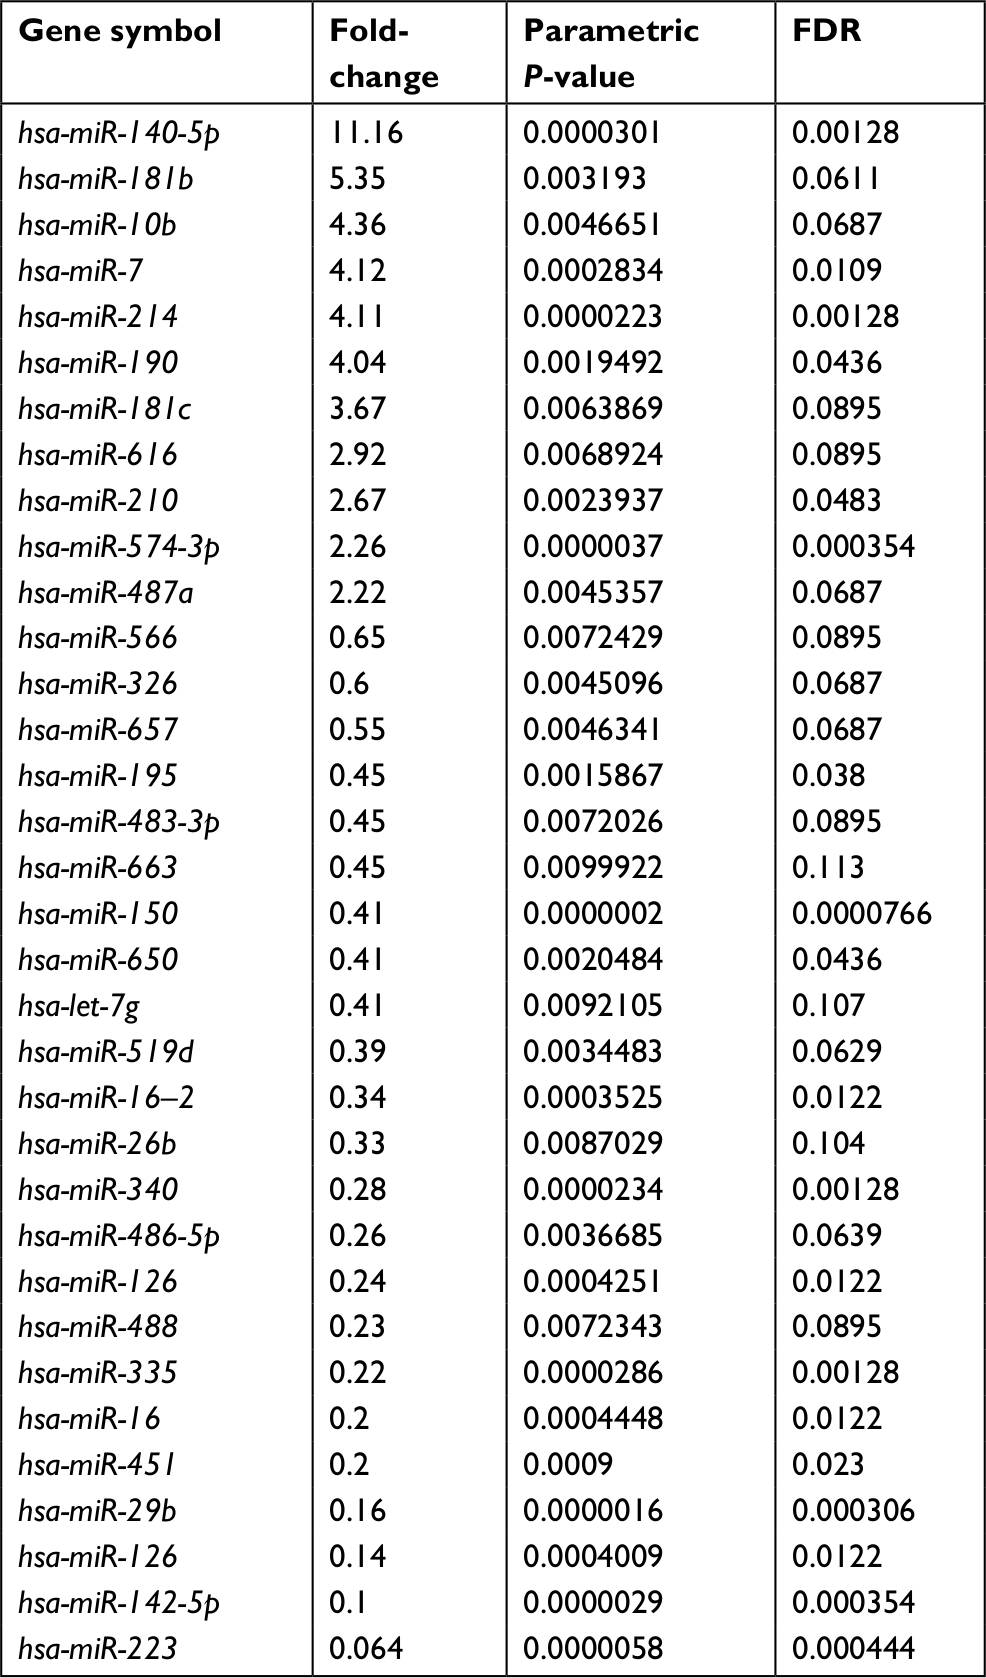 | Table 1 The different expression miRNAs in WT tissues and the adjacent non-tumor tissues Abbreviations: WT, Wilms’ tumor; FDR, P-value corrected by Benjamini & Hochberg multiple tests. |
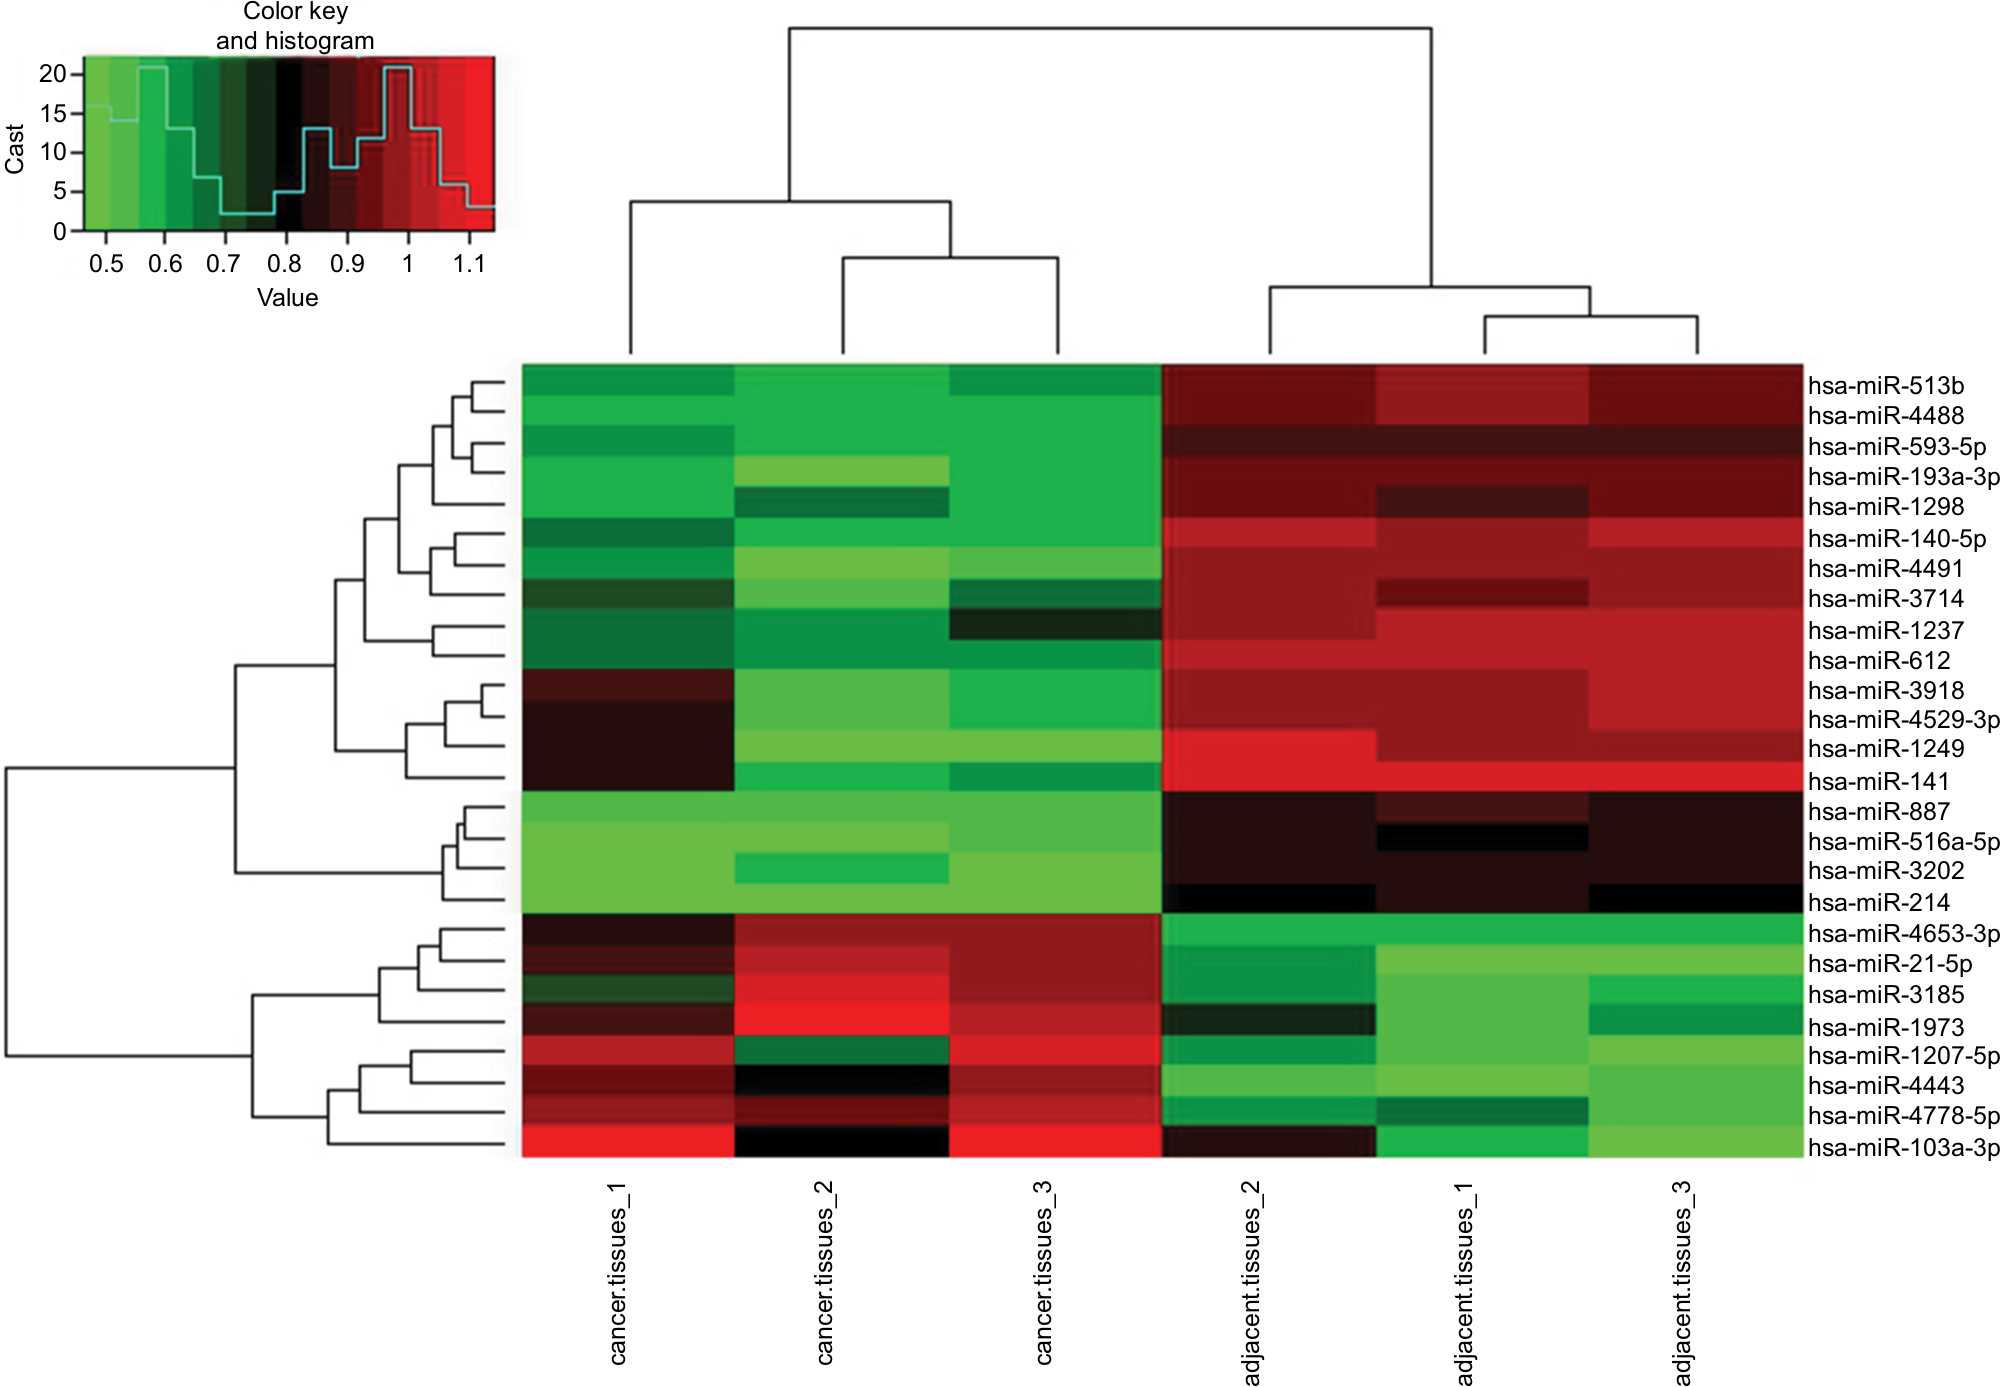 | Figure 1 miRNA expression profiles in WT tissues and the corresponding adjacent normal tissues. Note: The heatmap from unsupervised hierarchical clustering showed miRNAs with high expression in red and miRNAs with low expression in green. Abbreviation: WT, Wilms’ tumor. |
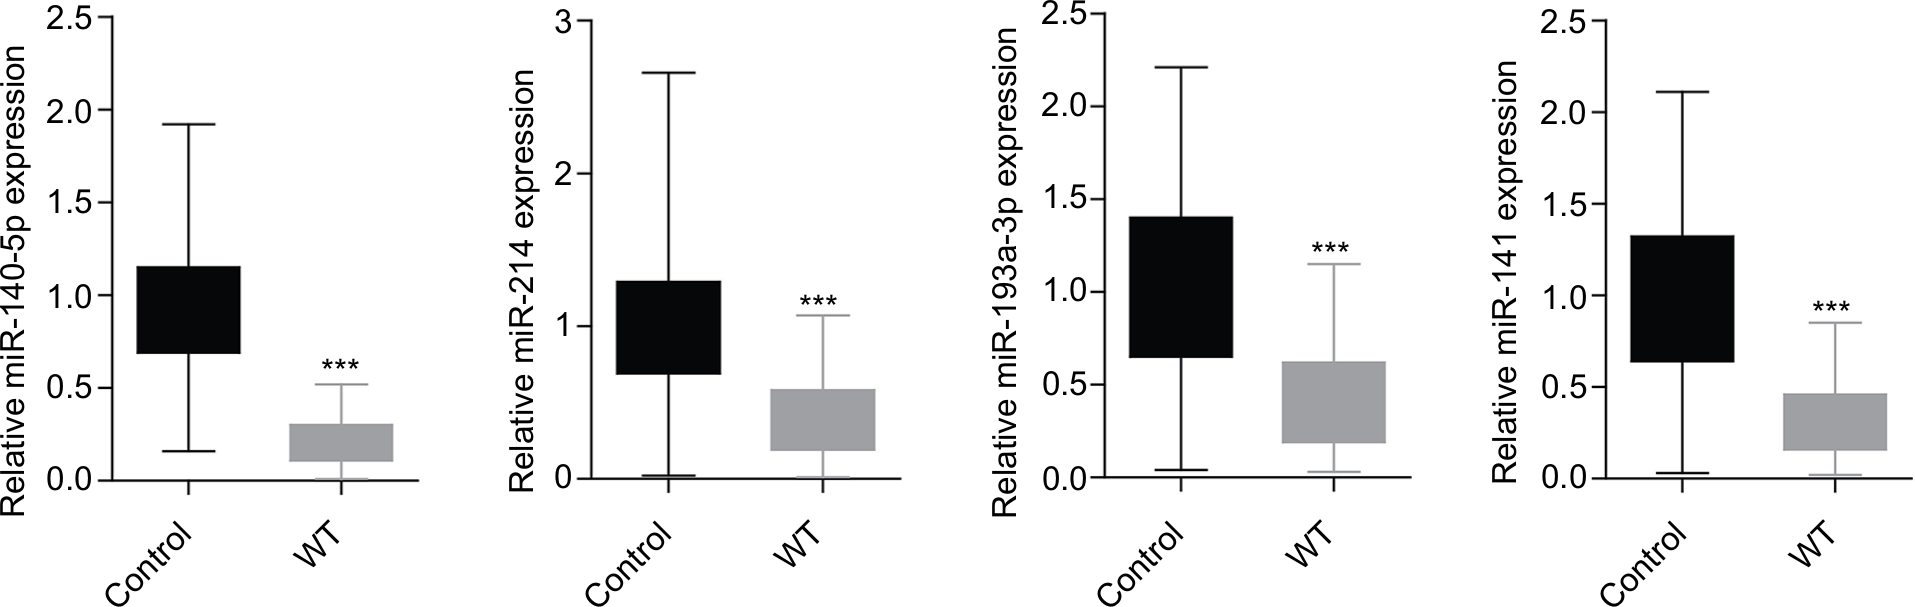 | Figure 2 RT-PCR verification of the expression of miRNAs in 95 paired WT tissues and the adjacent tissues according to the results of miRNA microarray. Notes: Results demonstrated that the expression levels of miR-141, miR-214, miR-140-5p, and miR-193a-3p were all significantly decreased in WT tissues (n=3, ***P<0.001, WT group vs control group). Abbreviations: WT, Wilms’ tumor; RT-PCR, real-time PCR. |
Biomarker potential of miRNAs in WT
Then, we assessed the potential of miR-141, miR-214, miR-140-5p, or miR-193a-3p to serve as a biomarker for WT diagnosis by using ROC analysis. ROC curves for miR-141, miR-214, miR-140-5p, or miR-193a-3p showed that AUCs were 0.893 (95% CI: 0.844–0.941), 0.867 (95% CI: 0.813–0.960), 0.961 (95% CI: 0.935–0.986), and 0.844 (95% CI: 0.788–0.900), respectively. Among them, miR-140-5p showed the highest AUC (Figure 3).
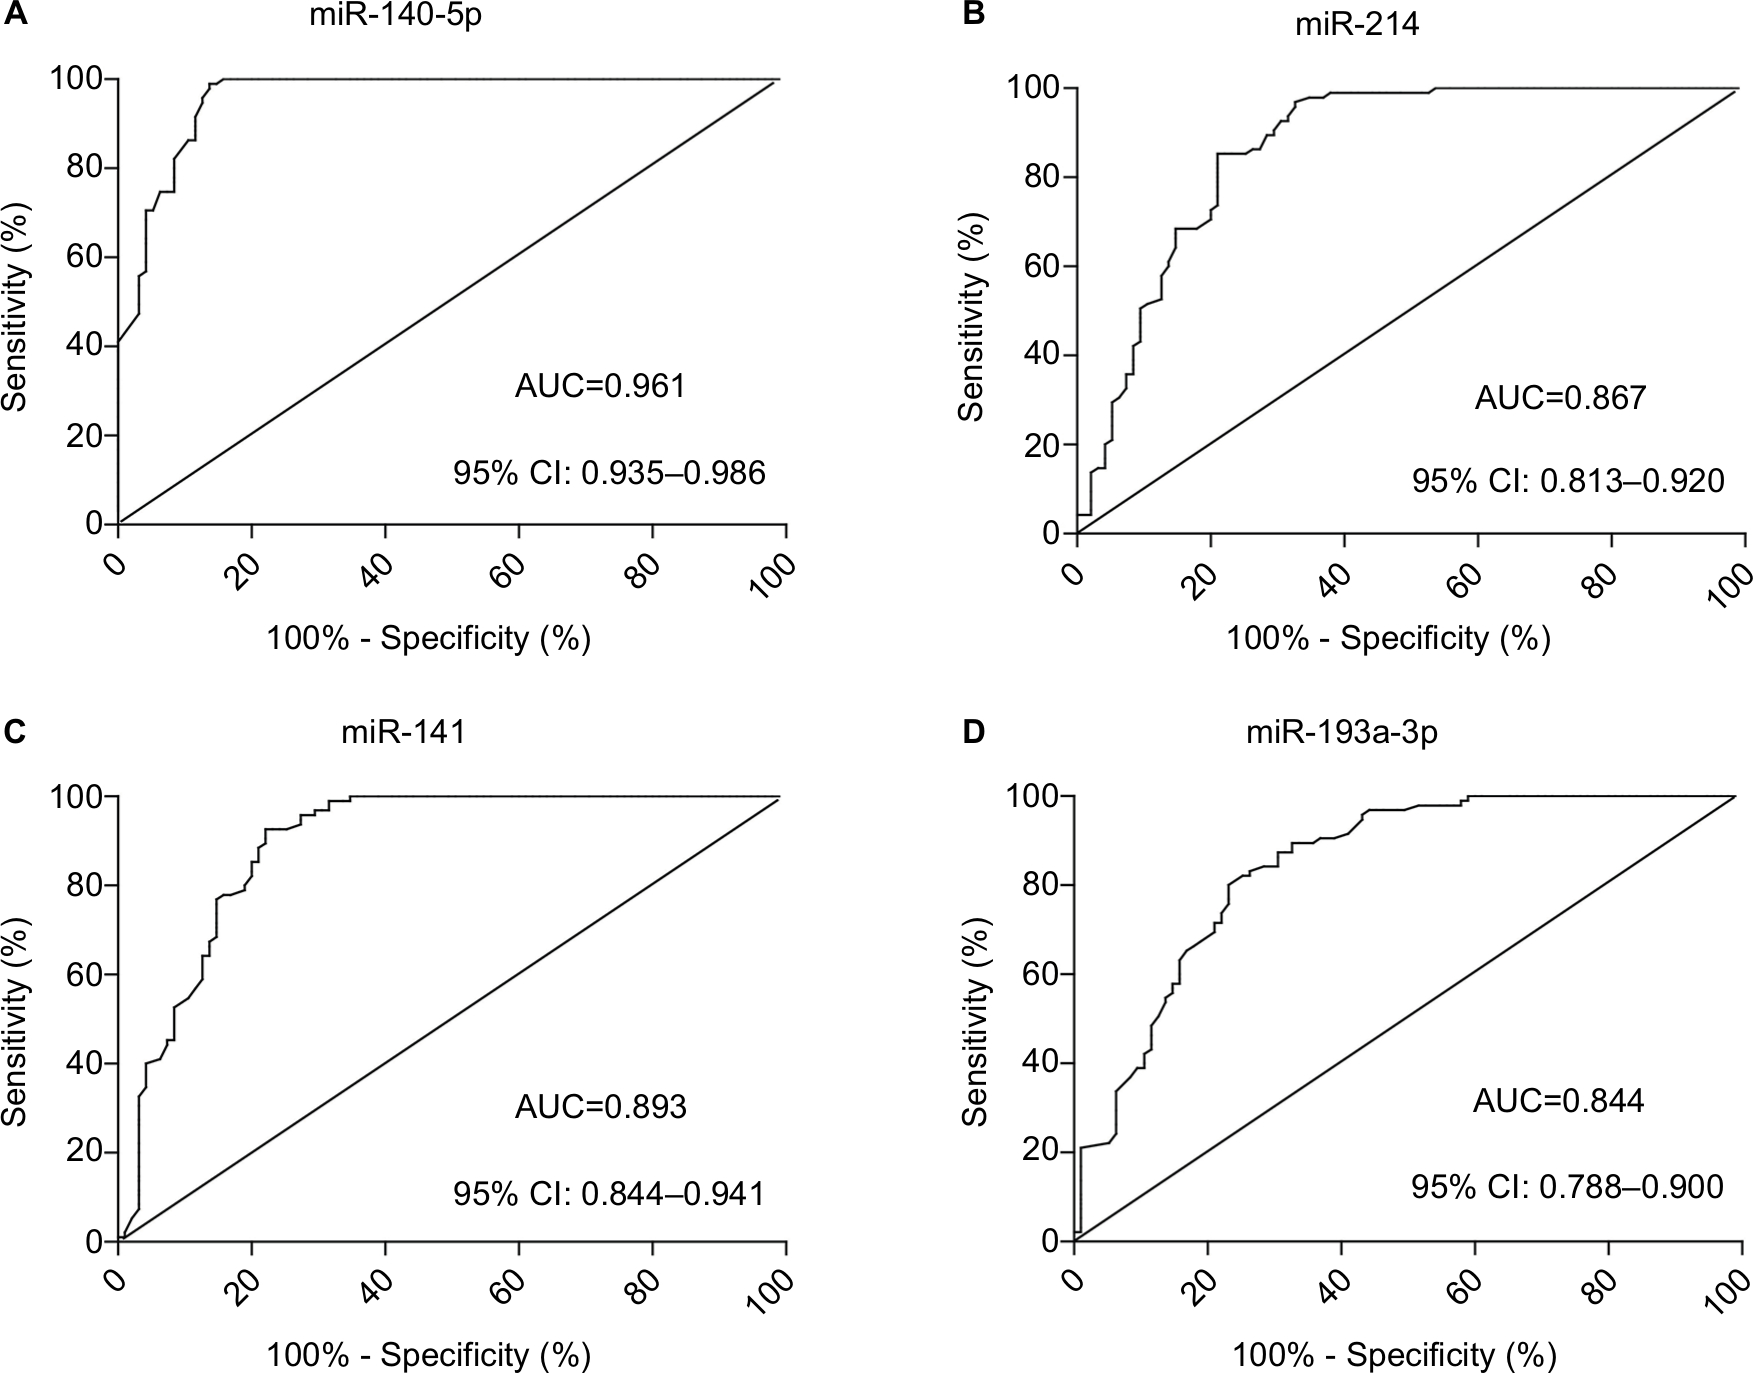 | Figure 3 Biomarker potential of miRNAs in WT. ROC curves for (A) miR-140-5p, (B) miR-214, (C) miR-141, and (D) miR-193a-3p as markers to distinguish WT from normal tissue. Mean AUC values are given for tenfold cross-validation runs including 95% CI. Abbreviations: AUC, area under the curve; WT, Wilms’ tumor; ROC, receiver operating characteristic. |
Low expression of miR-140-5p links advanced clinical progression and poor outcome of WT patients
Then, we assessed the association between miR-140-5p expression patterns and the progression and prognosis of WT patients. In a total of 95 patients with WT, 66 patients highly expressed miR-140-5p and 29 patients expressed miR-140-5p to a lower extent. As shown in Table 2, the expression of miR-140-5p was negatively associated with tumor size (P=0.002), pathological stage (P=0.003), and the occurrence rate of lymph node metastasis (P=0.009). Moreover, patients with low expression of miR-140-5p always had shorter overall survival than patients with high expression of miR-140-5p (Figure 4). All data indicate that miR-140-5p plays an important role in the progression of WT.
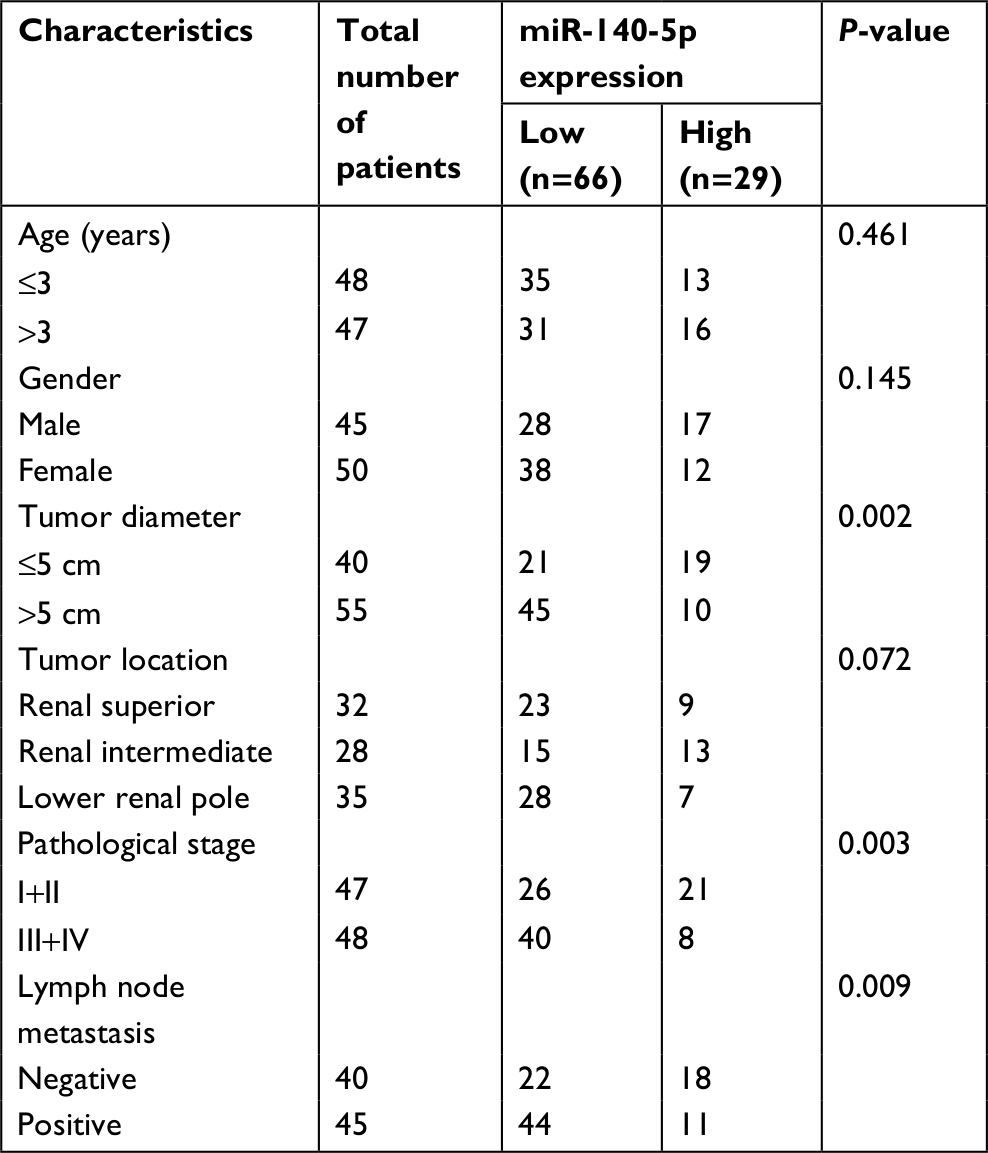 | Table 2 Association between miR-140-5p expression and clinicopathological characteristics of 95 WT patients Abbreviation: WT, Wilms’ tumor. |
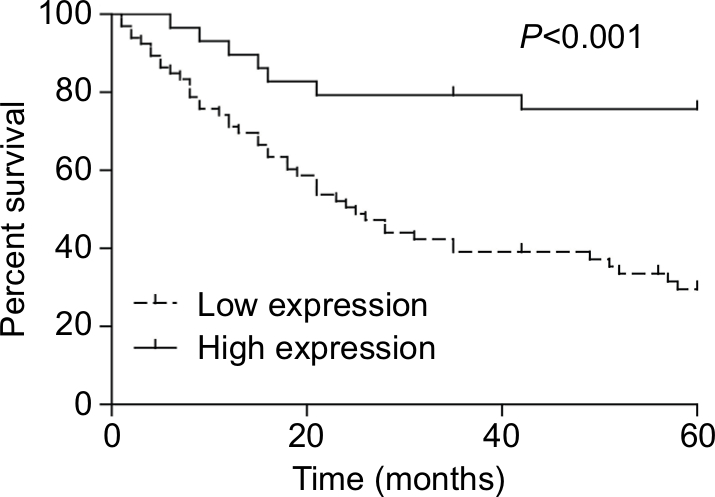 | Figure 4 Low expression of miR-140-5p reduced the overall survival of WT patients. Note: Kaplan–Meier curve was used to evaluate the overall survival of WT patients with high or low expression of miR-140-5p. Abbreviation: WT, Wilms’ tumor. |
Upregulation of miR-140-5p represses the proliferation, migration, and invasion of WT cells
Then, we emphatically explored the effects of miR-140-5p on the occurrence and development of WT. Compared with that of normal kidney cell line HK-2, the expression of miR-140-5p was reduced in WT cell lines G401 and SK-NEP-1 (Figure 5A). Subsequently, we performed cell functional experiments to explore the effects of miR-140-5p on cell proliferation, apoptosis, migration, and invasion. Upregulation of miR-140-5p with miR-140-5p mimic transfection significantly repressed the proliferation of G401 and SK-NEP-1 cells (Figure 5B, C) and promoted cell apoptosis (Figure 5D), and downregulation of miR-140-5p showed the opposite results (Figure 5B–D). In addition, compared with G401 cells transfected with mimic-NC, mimic of miR-140-5p significantly inhibited cell migration (Figure 6A) and invasion (Figure 6B), and vice versa (Figure 6A, B). Taken together, these results illustrate that miR-140-5p exerts a tumor-inhibiting role in the occurrence and progression of WT.
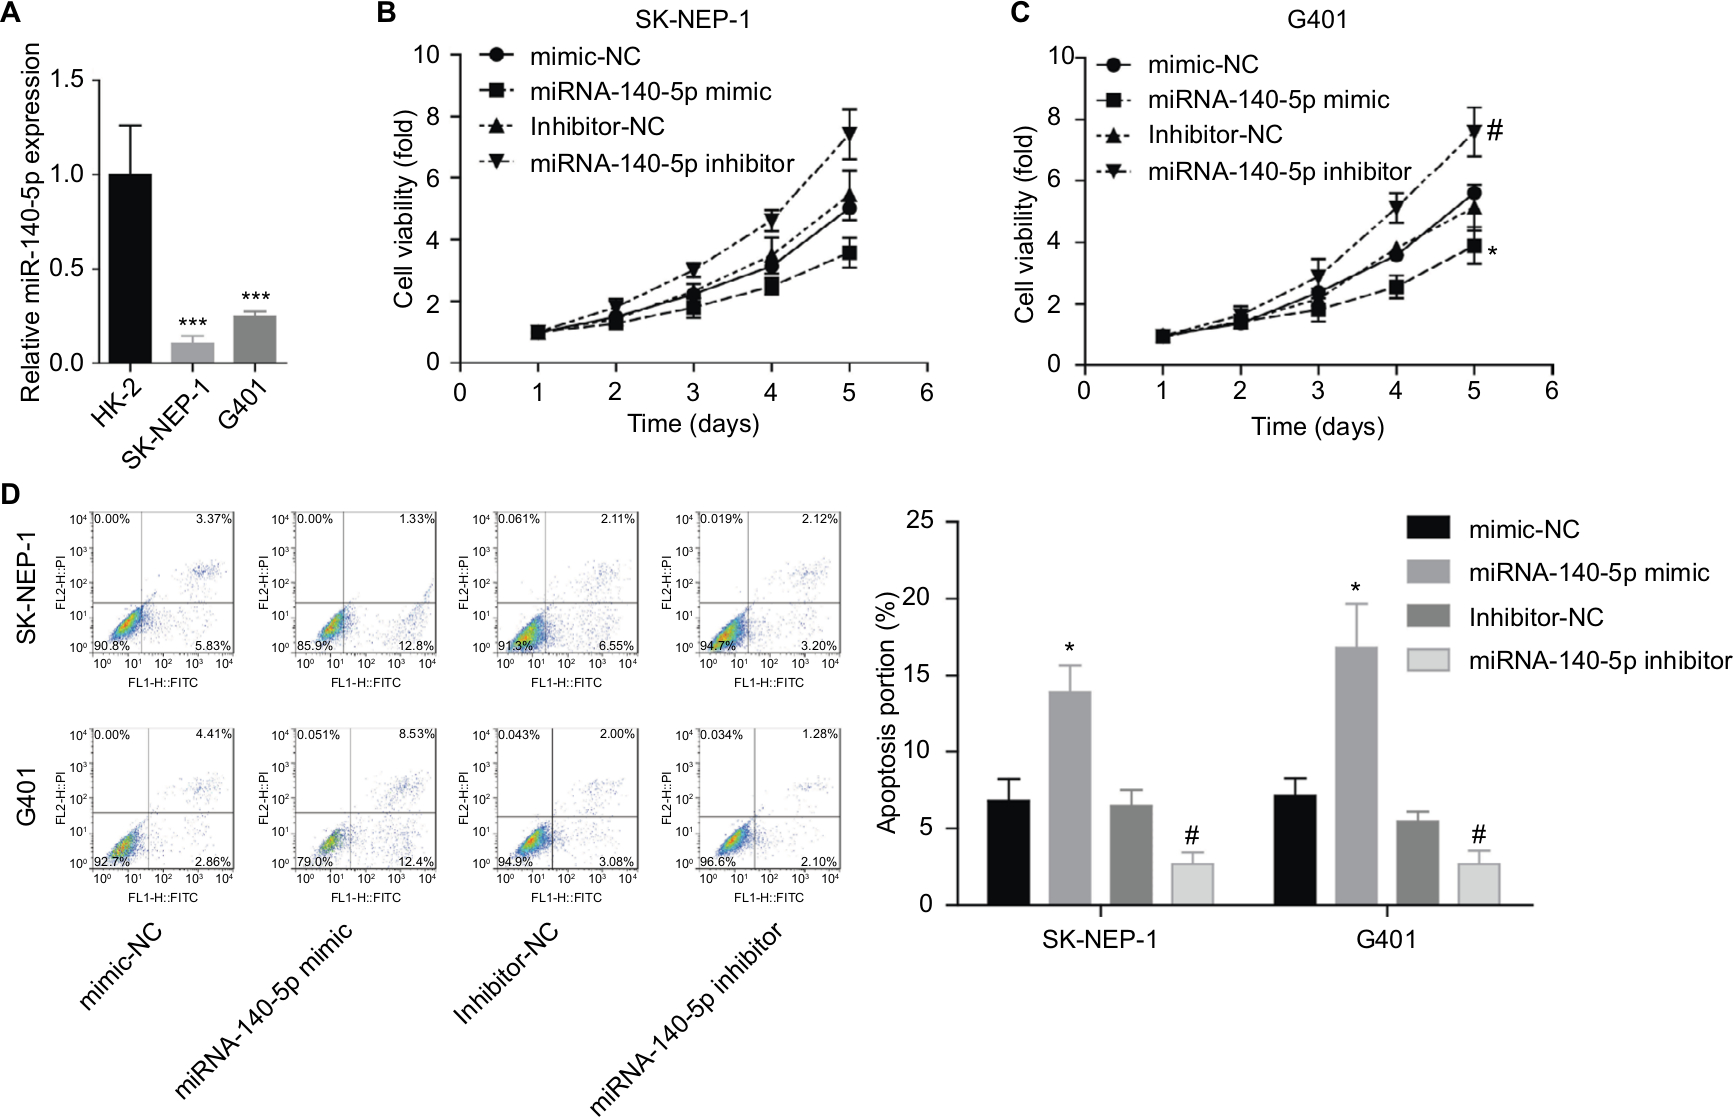 | Figure 5 Upregulation of miR-140-5p inhibited the proliferation and promoted the apoptosis of G401 and SK-NEP-1 cells. Notes: (A) RT-PCR analysis of the expression of miR-140-5p in normal kidney cell line HK-2 and WT cell lines, G401 and SK-NEP-1 (n=3, ***P<0.001). Next, miR-140-5p mimic, mimic-NC, miR-140-5p inhibitor, and inhibitor-NC were transfected to G401 and SK-NEP-1 cells, and then (B, C) CCK-8 assay was used to evaluate cell proliferation. (D) Flow cytometry with Annexin V/PI double staining was used to assess cell apoptosis (n=3, *P<0.05, miR-140-5p inhibitor group vs inhibitor-NC group; #P<0.05, miR-140-5p mimic group vs mimic-NC group). Abbreviations: NC, negative control; RT-PCR, real-time PCR; WT, Wilms’ tumor; CCK-8, cell counting kit-8; PI, propidium iodide. |
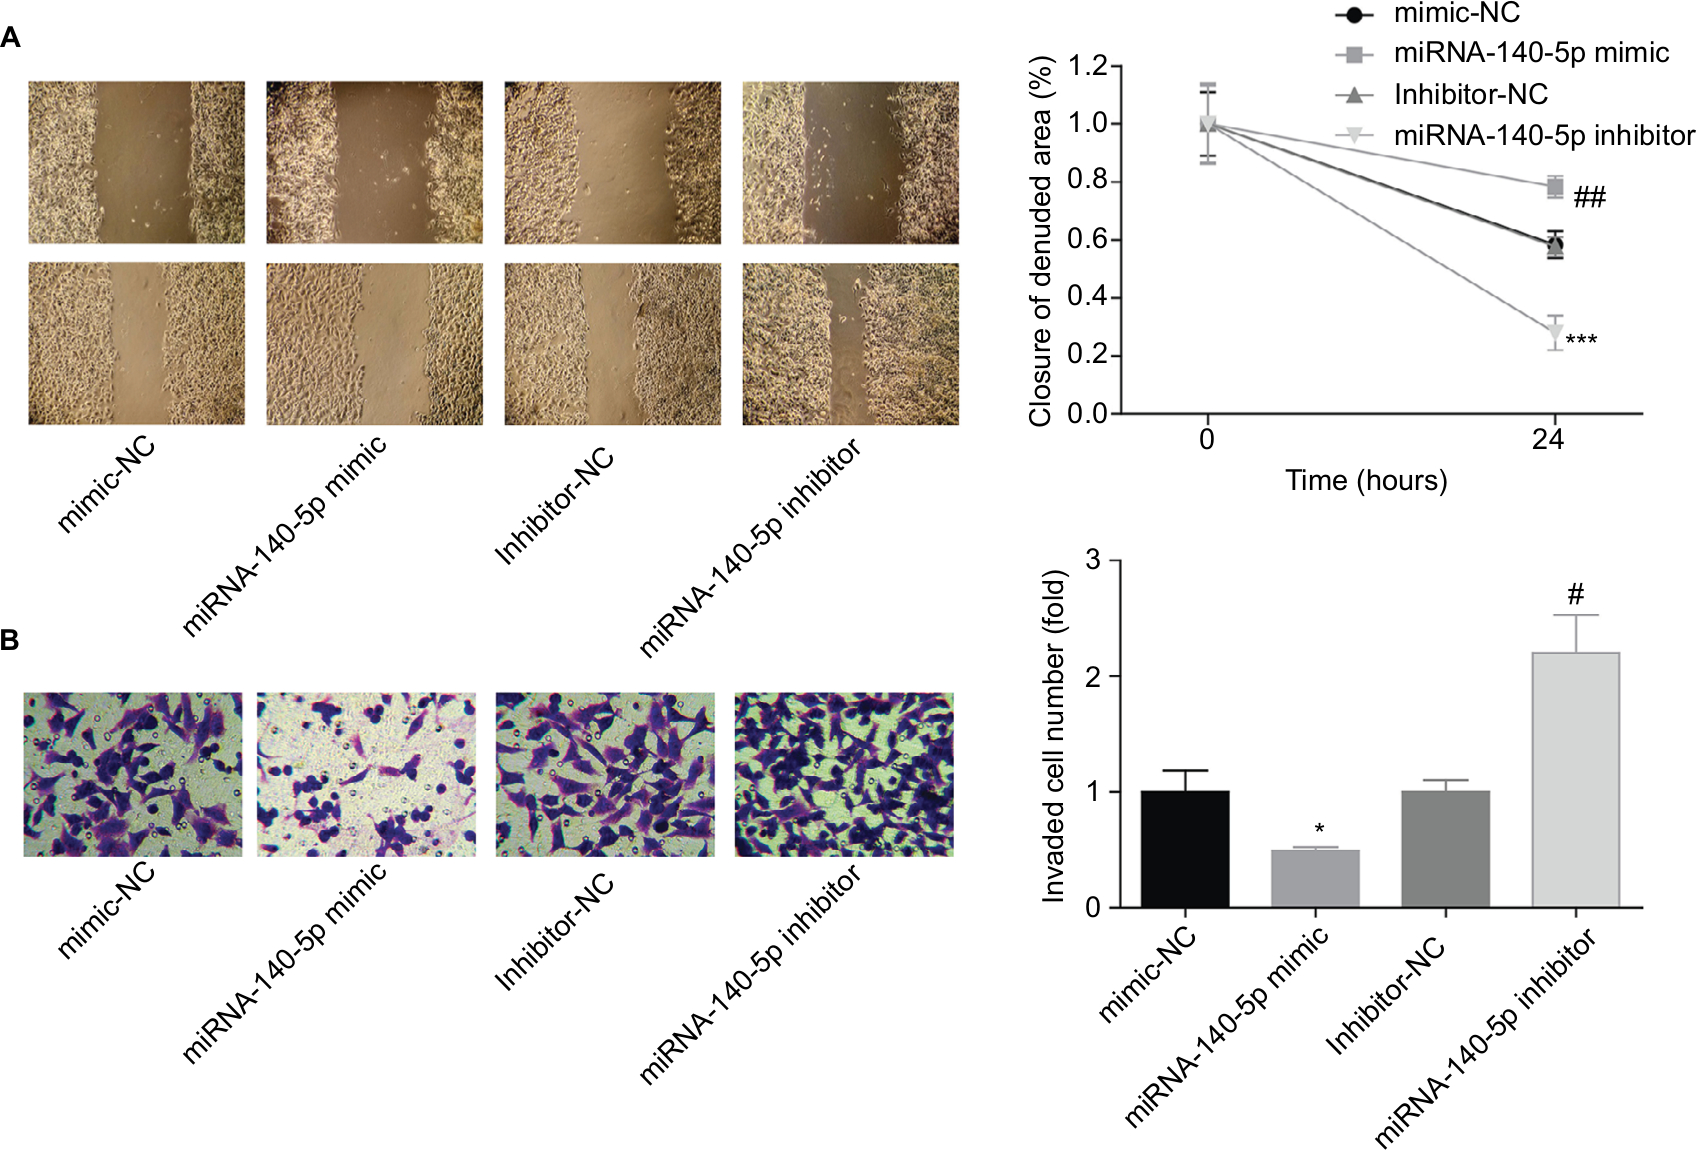 | Figure 6 Upregulation of miR-140-5p inhibited the migration and invasion of G401 cells. Notes: miR-140-5p mimic, mimic-NC, miR-140-5p inhibitor, and inhibitor-NC were transfected into G401 cells, and then (A) wound healing assay was performed to assess cell migration after 24 hours of transfection. (B) Transwell assay was carried out to determine cell invasion after 48 hours of transfection (n=3, *P<0.05, ***P<0.001, miR-140-5p inhibitor group vs inhibitor-NC group; #P<0.05, ##P<0.01, miR-140-5p mimic group vs mimic-NC group). Abbreviation: NC, negative control. |
MiR-140-5p negatively regulates TGFBR1 expression in WT cells
Then, the target genes that may be regulated by miR-140-5p were searched using TargetScan (http://www.targetscan.org/vert_61), miRanda (http://www.microrna.org/), and miRTarBase (http://mirtarbase.mbc.nctu.edu.tw/index.php). The results showed that TGFBR1 is a target gene whose expression was negatively modulated by miR-140-5p. Figure 7A shows the combining sequences between miR-140-5p and TGFBR1 gene. Besides, dual-luciferase reporter assay was performed to assess the effects of miR-140-5p on the post-transcriptional activity of TGFBR1. Results showed that upregulation of miR-140-5p significantly decreased the fluorescence activity and vice versa, whereas the fluorescence activity showed no obvious change when the binding sites between miR-140-5p and TGFBR1 were mutated (Figure 7B, C). Based on this finding, we also performed Western blotting assay to detect the expression of TGFBR1 in WT tissues and the adjacent non-tumor tissues, and results showed that the expression level of TGFBR1 protein was apparently elevated in WT tissues when compared with that of the adjacent tissues (Figure 7D). These results illustrate that miR-140-5p might inhibit WT progression by directly targeting TGFBR1.
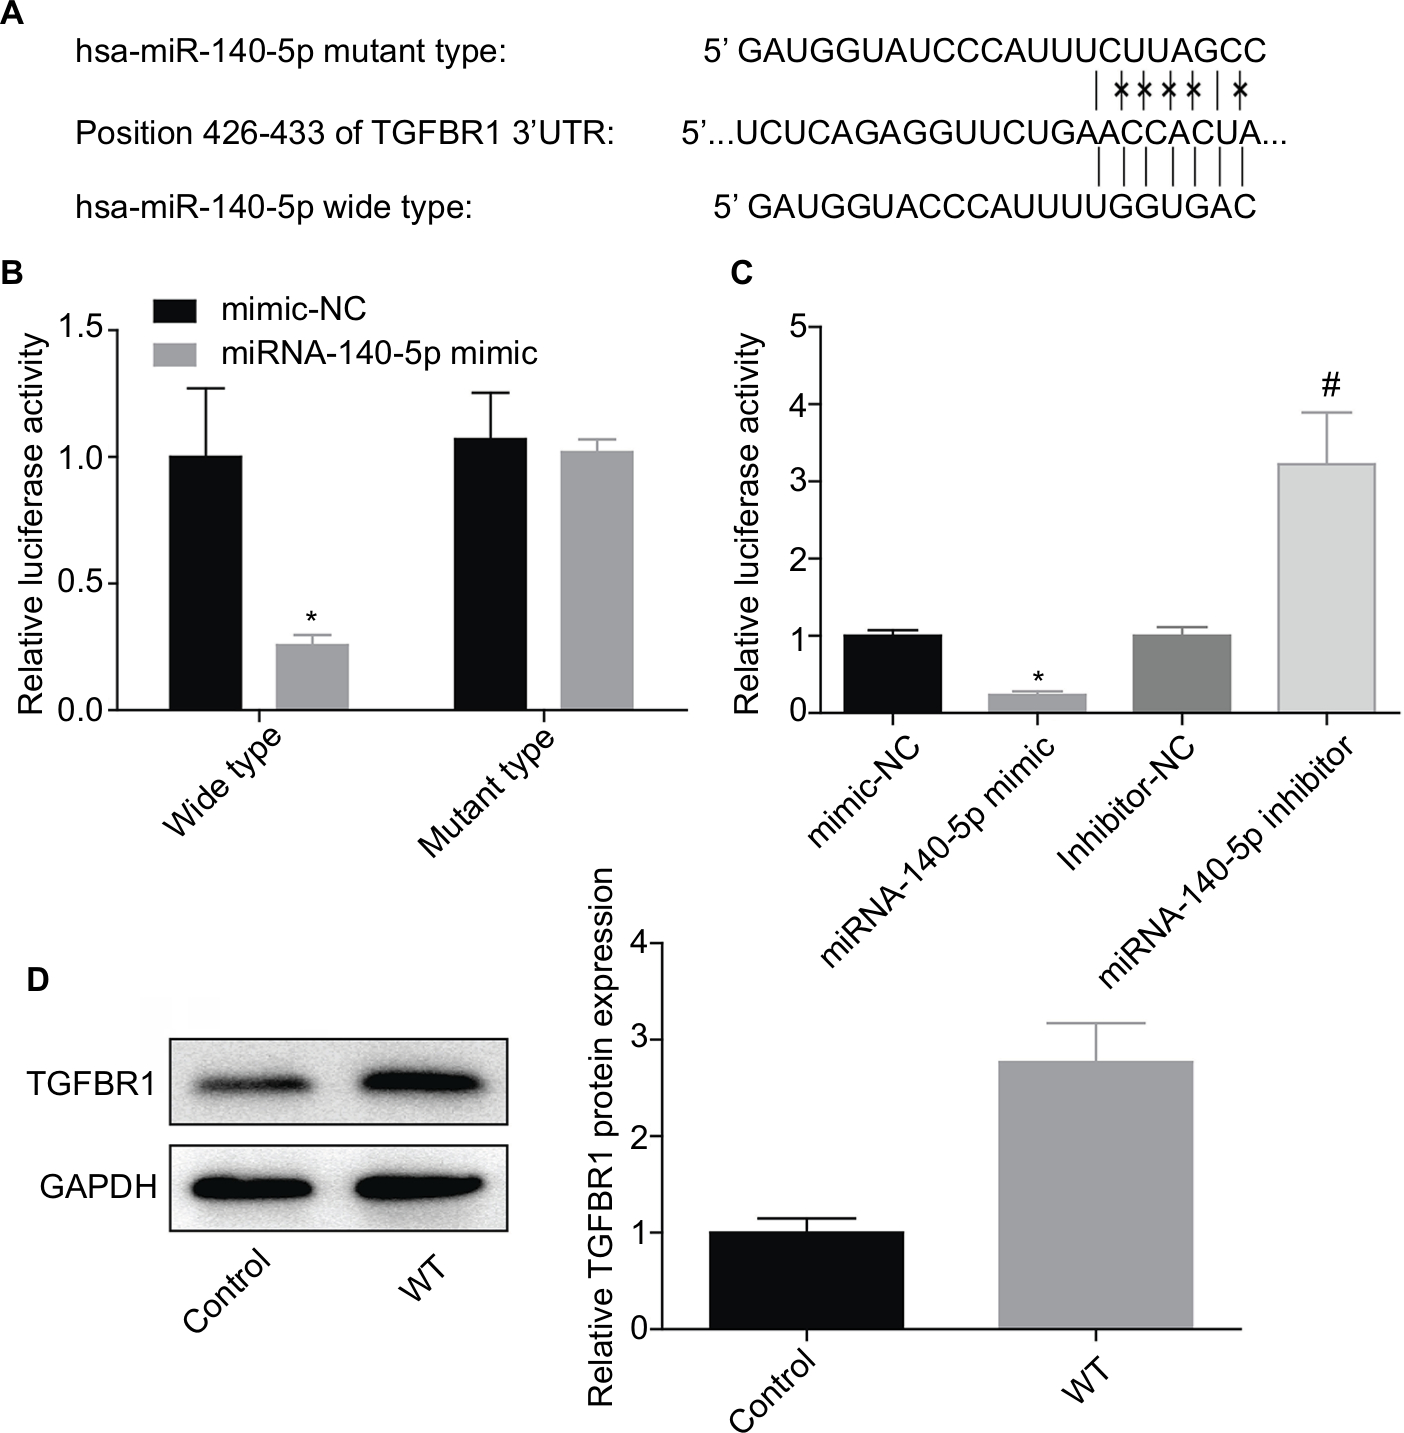 | Figure 7 miR-140-5p combined with TGFBR1 and negatively regulated its expression. Notes: (A) The combining sequence between miR-140-5p and TGFBR1 gene. (B, C) G401 cells were co-transfected with WT or MT together with miR-140-5p mimic, mimic-NC, miR-140-5p inhibitor, or inhibitor-NC for 48 hours, and then dual-luciferase reporter assay system was used to assess the luciferase activity (n=3, *P<0.05, miR-140-5p inhibitor group vs inhibitor-NC group; #P<0.05, miR-140-5p mimic group vs mimic-NC group). (D). Western blotting was performed to analyze the protein expression of TGFBR1 in Wilms’ tumor tissues and the adjacent non-tumor tissues (n=3, *P<0.05, Wilms’ tumor group vs control group). Abbreviations: NC, negative control; WT, Wilms’ tumor; 3′ UTR, 3′ untranslated region. |
Knockdown of miR-140-5p accelerates the progression of WT through upregulation of TGFBR1 expression
Finally, we explored the role of TGFBR1 in the process where miR-140-5p inhibited WT progression. Knockdown of TGFBR1 abolished the promotion of cell proliferation together with the inhibition of apoptosis induced by miR-140-5p downregulation (Figure 8A, B). Furthermore, downregulation of miR-140-5p significantly promoted the tumorigenesis of G401 cells, whereas this effect was impaired when TGFBR1 was downregulated (Figure 8C). These results suggest that knockdown of miR-140-5p accelerates the progression of WT through upregulation of TGFBR1 expression.
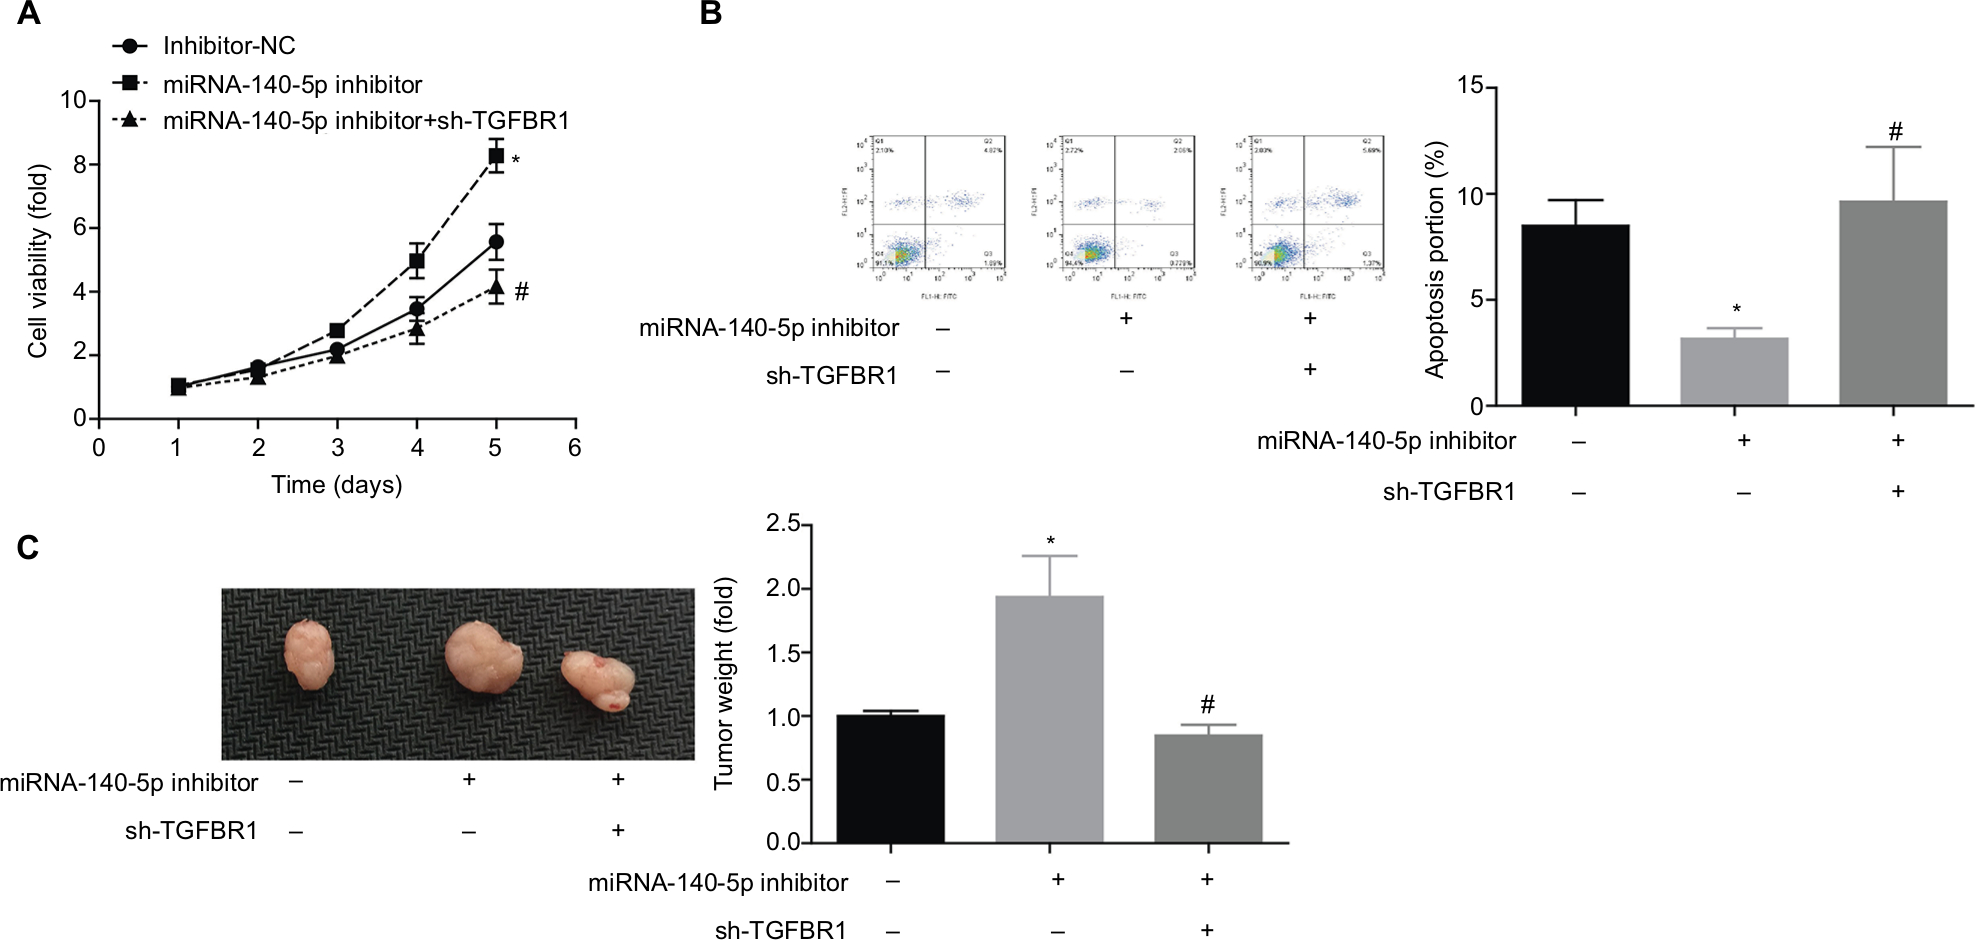 | Figure 8 Knockdown of miR-140-5p enhanced cell proliferation and tumorigenesis through upregulation of TGFBR1 expression. Notes: G401 cells were transfected with inhibitor-NC, miR-140-5p inhibitor, or miR-140-5p inhibitor + sh-TGFBR1, and then (A) CCK-8 assay was used to detect cell proliferation. (B) Flow cytometry (Annexin V/PI staining) was performed to assess cell apoptosis. (C) In vivo tumor-burdened experiment was carried out to determine the tumor size and weight influenced by miR-140-5 p/TGFBR1 (n=3, *P<0.05, miR-140-5p inhibitor group vs inhibitor-NC group; #P<0.05, miR-140-5p inhibitor + sh-TGFBR1 group vs miR-140-5p inhibitor group). Abbreviations: NC, negative control; CCK-8, cell counting kit-8; PI, propidium iodide. |
Discussion
MiRNAs are strongly implicated in a majority of carcinogenic programs through regulation of gene expression at the post-transcriptional level, including cell survival, apoptosis, differentiation, invasion, cell cycle, and angiogenesis.19 For example, miR-21 was reported to be highly expressed in WT tissues, and its upregulation enhanced the aggressive progression of WT through binding to PTEN.20 MiR-101 mitigated the angiogenesis and metastasis of nasopharyngeal carcinoma cells by directly repressing ITGA3.21 The present study focused on the function of miRNAs in the progression of WT and found that miR-140-5p was downregulated in WT tumors and that high expression of miR-140-5p deteriorated the clinical features and outcomes of patients with WT, and promoted the progression of WT by directly targeting TGFBR1.
The same miRNA can exert completely opposite roles in different tumors, which seem to be decided by the type of tumors.22,23 To our best knowledge, reports indicated that miR-140-5p served as a tumor suppressor in different types of cancers. For example, Lu et al24 found that miR-140-5p was downregulated in primary and metastasis breast cancer tissues when compared with that in the matched adjacent normal tissues, and its upregulation obviously repressed cell invasion and angiogenesis. Fang et al25 demonstrated that miR-140-5p was poorly expressed in gastric cancer tissues, and its upregulation significantly suppressed the proliferation, migration, and invasion of gastric cancer cells. Besides, studies also identified that miR-140-5p functioned as a tumor suppressor gene in ovarian cancer,26 hepatocellular carcinoma,27 non-small-cell lung cancer,28 colorectal cancer,29 and biliary tract cancer.30 Consistently, we also identified that miR-140-5p served as a tumor suppressor in WT, with the expression level decreased in WT tissues, and its downregulation significantly enhanced cell proliferation and tumorigenesis and repressed cell apoptosis.
MiRNAs negatively regulate gene expression through binding to the 3′-UTR of their target mRNAs.31 The present study demonstrated that miR-140-5p combined with the 3′-UTR of TGFBR1 and negatively regulated its expression, which was similar to the mechanism in which miR-140-5p alleviated the progression of hepatocellular carcinoma.27 TGFBR1 is the TGFβ receptor type 1. Once TGFβ ligands are formed, they would first combine with the TGFβ receptor type 2 (TGFBR2); TGFBR1 is then recruited to TGFBR2 and is activated,32,33 and subsequently the Smad, PAK1, MAPK, or AKT pathway is activated to regulate many biological processes.34 Zhang et al35 have found that TGF-β1 is positively expressed in WT tissues, especially in the invasive or metastatic tissues, and upregulation of TGF-β1 enhanced the invasive capacity of WT cells, suggesting that TGF-β signal pathway plays a vital role in the development and progression of WT. However, the effects and molecular mechanism of TGFBR1 in the progression of WT remain largely undefined. The current study is the first to indicate that TGFBR1 is highly expressed in WT tissues, which exerts an oncogenic role in the progression of WT and is negatively regulated by miR-140-5p.
In conclusion, the current study explored the different expression profiles of miRNAs between WT tissues and the surrounding normal tissues and revealed that miR-140-5p is downregulated in WT tissues. The low expression of miR-140-5p accelerates the malignant clinical feature of WT patients and promotes the occurrence and development of WT by directly targeting TGFBR1. Overall, this study provides a theoretical foundation for miR-140-5p to be used as a diagnosis marker and therapeutic target for WT.
Disclosure
The authors report no conflicts of interest in this work.
References
Davidoff AM. Wilms tumor. Adv Pediatr. 2012;59(1):247–267. | ||
Breslow N, Olshan A, Beckwith JB, Green DM. Epidemiology of Wilms tumor. Med Pediatr Oncol. 1993;21(3):172–181. | ||
Davidoff AM. Wilms’ tumor. Curr Opin Pediatr. 2009;21(3):357–364. | ||
Farber S. Chemotherapy in the treatment of leukemia and Wilms’ tumor. JAMA. 1966;198(8):826–836. | ||
Furtwängler R, Nourkami N, Alkassar M, et al. Update on relapses in unilateral nephroblastoma registered in 3 consecutive SIOP/GPOH studies – a report from the GPOH-nephroblastoma study group. Klin Padiatr. 2011;223(3):113–119. | ||
Hohenstein P, Pritchard-Jones K, Charlton J. The yin and yang of kidney development and Wilms’ tumors. Genes Dev. 2015;29(5):467–482. | ||
Spreafico F, Ciceri S, Gamba B, et al. Chromosomal anomalies at 1q, 3, 16q, and mutations of Six1 and Drosha genes underlie Wilms tumor recurrences. Oncotarget. 2016;7(8):8908–8915. | ||
Bartel DP. MicroRNAs: genomics, biogenesis, mechanism, and function. Cell. 2004;116(2):281–297. | ||
Gammell P. MicroRNAs: recently discovered key regulators of proliferation and apoptosis in animal cells: identification of miRNAs regulating growth and survival. Cytotechnology. 2007;53(1–3):55–63. | ||
Krutovskikh VA, Herceg Z. Oncogenic microRNAs (OncomiRs) as a new class of cancer biomarkers. Bioessays. 2010;32(10):894–904. | ||
Ambros V. The functions of animal microRNAs. Nature. 2004; 431(7006):350–355. | ||
Ludwig N, Werner TV, Backes C, et al. Combining miRNA and mRNA expression profiles in Wilms tumor subtypes. Int J Mol Sci. 2016;17(4):475. | ||
Jiang X, Li H. MiR-1180-5p regulates apoptosis of Wilms’ tumor by targeting p73. Onco Targets Ther. 2018;11:823–831. | ||
Liu GL, Yang HJ, Liu B, Liu T. Effects of microRNA-19b on the proliferation, apoptosis, and migration of Wilms’ tumor cells via the PTEN/PI3K/AKT signaling pathway. J Cell Biochem. 2017;118(10):3424–3434. | ||
Schmitt J, Backes C, Nourkami-Tutdibi N, et al. Treatment-independent miRNA signature in blood of Wilms tumor patients. BMC Genomics. 2012;13:379. | ||
Ludwig N, Nourkami-Tutdibi N, Backes C, et al. Circulating serum miRNAs as potential biomarkers for nephroblastoma. Pediatr Blood Cancer. 2015;62(8):1360–1367. | ||
Watson JA, Bryan K, Williams R, et al. miRNA profiles as a predictor of chemoresponsiveness in Wilms’ tumor blastema. PLoS One. 2013;8(1):e53417. | ||
Xiao L, Shi XY, Zhang Y, et al. YAP induces cisplatin resistance through activation of autophagy in human ovarian carcinoma cells. Onco Targets Ther. 2016;9:1105–1114. | ||
Sun X, Charbonneau C, Wei L, Chen Q, Terek RM. miR-181a targets RGS16 to promote chondrosarcoma growth, angiogenesis, and metastasis. Mol Cancer Res. 2015;13(9):1347–1357. | ||
Cui M, Liu W, Zhang L, et al. Over-expression of miR-21 and lower PTEN levels in Wilms’ tumor with aggressive behavior. Tohoku J Exp Med. 2017;242(1):43–52. | ||
Tang XR, Wen X, He QM, et al. MicroRNA-101 inhibits invasion and angiogenesis through targeting ITGA3 and its systemic delivery inhibits lung metastasis in nasopharyngeal carcinoma. Cell Death Dis. 2017;8(1): e2566. | ||
Babashah S, Soleimani M. The oncogenic and tumour suppressive roles of microRNAs in cancer and apoptosis. Eur J Cancer. 2011;47(8):1127–1137. | ||
Shenouda SK, Alahari SK. MicroRNA function in cancer: oncogene or a tumor suppressor? Cancer Metastasis Rev. 2009;28(3–4):369–378. | ||
Lu Y, Qin T, Li J, et al. MicroRNA-140-5p inhibits invasion and angiogenesis through targeting VEGF-A in breast cancer. Cancer Gene Ther. 2017;24(9):386–392. | ||
Fang Z, Yin S, Sun R, et al. miR-140-5p suppresses the proliferation, migration and invasion of gastric cancer by regulating YES1. Mol Cancer. 2017;16(1):139. | ||
Lan H, Chen W, He G, Yang S. miR-140-5p inhibits ovarian cancer growth partially by repression of PDGFRA. Biomed Pharmacother. 2015;75:117–122. | ||
Hao Y, Feng F, Chang R, Yang L. MicroRNA-140-5p suppresses tumor growth and metastasis by targeting TGFBR1 and FGF9 in hepatocellular carcinoma. Hepatology. 2013;58:205–217. | ||
Flamini V, Jiang WG, Cui Y. Therapeutic role of miR-140-5p for the treatment of non-small cell lung cancer. Anticancer Res. 2017;37(8):4319–4327. | ||
Zhai H, Fesler A, Ba Y, Wu S, Ju J. Inhibition of colorectal cancer stem cell survival and invasive potential by hsa-miR-140-5p mediated suppression of Smad2 and autophagy. Oncotarget. 2015;6(23):19735–19746. | ||
Yu J, Zhang W, Tang H, et al. Septin 2 accelerates the progression of biliary tract cancer and is negatively regulated by miR-140-5p. Gene. 2016;589(1):20–26. | ||
Li SD, Zhang JR, Wang YQ, Wan XP. The role of microRNAs in ovarian cancer initiation and progression. J Cell Mol Med. 2010;14(9):2240–2249. | ||
Massagué J, Gomis RR. The logic of TGFbeta signaling. FEBS Lett. 2006;580(12):2811–2820. | ||
Shi Y, Massagué J. Mechanisms of TGF-beta signaling from cell membrane to the nucleus. Cell. 2003;113(6):685–700. | ||
Kim W, Kim E, Lee S, et al. TFAP2C-mediated upregulation of TGFBR1 promotes lung tumorigenesis and epithelial-mesenchymal transition. Exp Mol Med. 2016;48(11):e273. | ||
Zhang L, Liu W, Qin Y, Wu R. Expression of TGF-β1 in Wilms’ tumor was associated with invasiveness and disease progression. J Pediatr Urol. 2014;10(5):962–968. |
 © 2019 The Author(s). This work is published and licensed by Dove Medical Press Limited. The full terms of this license are available at https://www.dovepress.com/terms.php and incorporate the Creative Commons Attribution - Non Commercial (unported, v3.0) License.
By accessing the work you hereby accept the Terms. Non-commercial uses of the work are permitted without any further permission from Dove Medical Press Limited, provided the work is properly attributed. For permission for commercial use of this work, please see paragraphs 4.2 and 5 of our Terms.
© 2019 The Author(s). This work is published and licensed by Dove Medical Press Limited. The full terms of this license are available at https://www.dovepress.com/terms.php and incorporate the Creative Commons Attribution - Non Commercial (unported, v3.0) License.
By accessing the work you hereby accept the Terms. Non-commercial uses of the work are permitted without any further permission from Dove Medical Press Limited, provided the work is properly attributed. For permission for commercial use of this work, please see paragraphs 4.2 and 5 of our Terms.