")
Back to Journals » OncoTargets and Therapy » Volume 13
miR-106b-5p Inhibits IRF1/IFN-β Signaling to Promote M2 Macrophage Polarization of Glioblastoma
Authors Shi Y, Zhang B, Zhu J, Huang W, Han B, Wang Q, Qi C, Wang M, Liu F
Received 17 November 2019
Accepted for publication 6 July 2020
Published 30 July 2020 Volume 2020:13 Pages 7479—7492
DOI https://doi.org/10.2147/OTT.S238975
Checked for plagiarism Yes
Review by Single anonymous peer review
Peer reviewer comments 2
Editor who approved publication: Dr Jianmin Xu
Yu Shi,1,* Bin Zhang,2,* Jian Zhu,3,* Wu Huang,4 Bin Han,4 Qilong Wang,4 Chunjian Qi,5 Minghai Wang,4 Fang Liu4
1Department of Neurology, Xuzhou Hospital Affiliated to Jiangsu University, Xuzhou, Jiangsu, People’s Republic of China; 2Department of Neurosurgery, Jintan People’s Hospital, Changzhou, Jiangsu, People’s Republic of China; 3Department of Neurosurgery, Yancheng No.1 People’s Hospital, Yancheng, Jiangsu, People’s Republic of China; 4Department of Neurosurgery, Nanjing Medical University Affiliated Changzhou NO.2 People’s Hospital, Changzhou, Jiangsu, People’s Republic of China; 5Department of Central Lab, Nanjing Medical University Affiliated Changzhou NO.2 People’s Hospital, Changzhou, Jiangsu, People’s Republic of China
*These authors contributed equally to this work
Correspondence: Fang Liu
Department of Neurosurgery, Nanjing Medical University Affiliated Changzhou NO.2 People’s Hospital, Changzhou 213003, Jiangsu, People’s Republic of China
Email [email protected]
Purpose: The microRNA (miRNA) profile changes in the tumor-associated macrophages. However, the role of miR-106b-5p in the glioblastoma-associated macrophages is poorly understood.
Materials and Methods: In our study, miR-106b-5p and M2 macrophage markers were detected by qRT-PCR and Western blotting in THP1 cells, with the conditioned medium from U251 cells or M2 macrophages in response to IL-4 stimulation and M1 macrophages stimulated by LPS and IFN-γ. IFN regulatory factor (IRF1) was identified as a target of miR-106b-5p in the glioma infiltrating macrophages by luciferase reporter assay. The molecular mechanisms involved in the miR-106b-5p-mediated regulation of M2 polarization were clarified by shRNA knockdown assay.
Results: Our results showed miR-106b-5p expression was upregulated in glioma-infiltrating macrophages. miR-106b-5p regulated M2 polarization of glioma infiltrating macrophages and enhanced the growth of glioma-infiltrating macrophages. IRF1 was identified as a target of miR-106b-5p. Furthermore, miR-106b-5p inhibited IRF1 expression by targeting IRF1/IFN-β pathway to promote M2 polarization of macrophages.
Conclusion: miR-106b-5p may inhibit IRF1/IFN-β signaling to promote M2 macrophage polarization of glioblastoma, and it may become a novel target for the treatment of glioblastoma.
Keywords: glioma, miR-106b-5p, IRF1/IFN-β, M2 macrophage polarization, glioma-associated microenvironment
Introduction
Glioblastoma multiforme (GBM) is one of the most common aggressive and infiltrative primary brain tumors and there are no effective treatments for GBM currently.1 A striking feature of high-grade gliomas is the accumulation of a large number of immune cells in the tumor, and macrophages are the main cell type among these immune cells and also known as the tumor-associated macrophages (TAMs).2,3 TAMs are mainly originated from peripheral blood monocytes, migrate and accumulate in the GBM after the breakdown of blood-brain barrier (BBB) by different tumor-derived signals.4 It has been shown that TAMs are a plastic and heterogeneous cell population, and can change their phenotype as an efficient response to different microenvironment stimulations.5 TAMs may become an ideal therapeutic target for the inhibition of tumor progression.6 According to the polarization status, macrophages can be divided into two major subsets: M1 macrophages and M2 macrophages. M1 macrophages are induced by bacterial lipopolysaccharide (LPS) and interferon (IFN)-γ, and can produce interleukin (IL)-12, IL-23, IL-6 and tumor necrosis factor (TNF)-α, which may mediate the resistance to pathogens. M2 macrophages are stimulated by IL-4 and can produce IL-10, CD206, and TGF-β, which may accelerate tissue repair and remodeling and facilitate tumor progression.7,8 M1 and M2 macrophages may experience mutual switch as a response to different stimuli, and then a dynamic balance is reached.
microRNAs (miRNAs) refer to short non-coding endogenous RNAs and can bind to the 3ʹ-terminal untranslated regions (3ʹ-UTR) of target genes, finally leading to the mRNA degradation or translation termination.9 Studies have confirmed that miRNAs are involved in the regulation of oncogene expression, cell cycle and transcription factors in brain tumors,10 such as miR-7, miR-21, miR-26a, miR-124, miR-142, miR-137, and miR-106b-5p.11,12 miR-106b-5p is an oncogenic miRNA involved in the proliferation and apoptosis of tumor cells, such as gastric cancer cells, hepatocellular carcinoma cells, prostate cancer cells, and breast cancer cells.13–16 Our previous study revealed that miR-106b-5p played an important role in the regulation of proliferation and apoptosis of glioma cells and was related to the glioma tumorigenesis.17 However, the role of miR-106b-5p in the glioblastoma-infiltrating macrophages has not been evaluated to date. Here, our results showed that miR-106b-5p was pivotal for the M2 polarization of glioma-infiltrating macrophages: miR-106b-5p could regulate macrophage polarization of glioblastoma through regulating IRF1 and disturbing the functional binding among IRF1, IFN-β and IRF5.
Materials and Methods
Ethics Statement and Clinical Sample Collection
The whole study was approved by the Experimental Animal Care Committee, Changzhou NO. 2 People’s Hospital of Nanjing Medical University and all the animal procedures were conducted according to the Guideline for Care and Use of Laboratory Animals. The human glioma tumors and adjacent normal brain tissues were collected from the Department of Neurosurgery, the First Hospital of Soochow University and Changzhou NO.2 People’s Hospital of Nanjing Medical University. Glioblastoma was pathologically confirmed (World Health Organization grade IV), and written informed consent was obtained from each subject.
Experimental Animals
Male C57BL/6J mice (6 to 8 weeks) were purchased from SLAC (Shanghai, China), and housed in an environment at 21±2°C and with the humidity of 55%±10%. Mice were grown in 290×178×160 mm cages (Suzhou Fengshi, China), and given ad libitum access to food (Jiangsu Xietong, China) and water. Mice were monitored twice daily for health status, and no adverse events were observed.
Cell Culture and Treatments
THP-1 cells and Raw264.7 cells were obtained from ATCC. Both THP-1 cells and Raw264.7 were maintained in RPMI 1640 supplemented with 10% fetal bovine serum (FBS, ScienCell), 100 mg/mL penicillin, and 100 mg/mL streptomycin. To generate M1-polarized THP-1 macrophage, 1×10⁶ THP-1 cells were seeded into six-well plates, treated with 100 nM PMA (Sigma-Aldrich) for 48 h, and then incubated with 100 ng/mL LPS (Sigma-Aldrich) and 20 ng/mL IFN-γ (SinoBiological) for another 24 h. To generate M1-polarized Raw264.7 macrophages, 5×10⁵ cells were seeded into six-well plates, and treated with 100 ng/mL LPS and 20 ng/mL IFN-γ for 16 h. To generate M2-polarized THP-1 macrophages, 1×10⁶ THP-1 cells were seeded into six-well plates, then treated with 100 nM PMA for 48 h, and incubated with 20 ng/mL IL-4 (PeproTech) for another 24 h. To generate M2-polarized Raw264.7 macrophages, 5×10⁵ cells were seeded into six-well plates and treated with 20 ng/mL IL-4 for 16 h. Human Astrocyte cell line HA cells, glioblastoma cell line U251 cells, and murine glioblastoma cell line GL261 cells were obtained from ATCC and maintained in the high glucose Dulbecco’s modified Eagle’s medium supplemented with 10% FBS, 100 mg/mL penicillin, and 100 mg/mL streptomycin at 37°C with 5% CO2. HEK293T cells were maintained in the Dulbecco’s modified Eagle’s medium supplemented with 10% FBS, 100 mg/mL penicillin, and 100 mg/mL streptomycin at 37 oC with 5% CO2.
RNA Oligos Synthesis and Plasmid Construction
The miR-106b-5p mimics and inhibitors, siRNA against human IRF1 (5ʹ-GCACCAGUGAUCUGUACAATT-3ʹ, 5ʹ-UUGUACAGAUCACUGGUGCTT-3ʹ) and the scramble control RNA oligos were synthesized in the GenePharma (Shanghai, China). All miRNAs were used at a final concentration of 100 pmol to transfect using LipofectamineTM 2000 reagent (Invitrogen) according to the manufacturer’s instructions. To overexpress IRF1, the ORF of human IRF1 was cloned into the pIRES2-EGFP, downstream of the CMV promoter. The 3ʹ-UTR of both wild type and mutant type IRF1 was inserted into the pGL3 reporter vector.
Luciferase Reporter Assay
HEK293T cells were maintained in a 24-well plate and transfected with 400 ng of pGL3 luciferase reporter vector and 40 ng of the Renilla luciferase vector with Lipofectamine 2000 when the cell confluence reached 70%. Cell extracts were collected 24 h later, and luciferase activity was measured with the Dual-Luciferase Reporter Assay system (Promega, WI, USA) according to the manufacturer’s instructions. All transfection assays were performed in triplicate.
Quantitative RT-PCR
Total RNA was extracted using TRIzol reagent with reported method.18 Reverse transcription was performed with 2 μg of total RNA using a cDNA synthesis kit (Thermo Fisher). RT-PCR was performed using SYBR Green Master Mix in the 7500 real-time PCR system (Applied Biosystems). PCR primers used in the present study are shown in Table 1. β-actin and GAPDH served as internal controls. Primers for reverse transcription PCR (RT-PCR) were purchased from GenePharma (Shanghai) and used for the synthesis of human miR-106b-5p. HmiR-106b-5p specific reverse transcription primer: 5ʹ-GTCGGGTCCAGAGCAGGGTCCGAGGTACACGTTCGCTCTGGACCCGACATCTGCACT-3ʹ, HmiR-106b-5p forward primer: 5ʹ-TGCCGCTAAAGTGCTGACAG-3ʹ, Reverse primer: 5ʹ-CAGAGCAGGGTCCGAGGTA-3ʹ. U6 was used as an endogenous control.
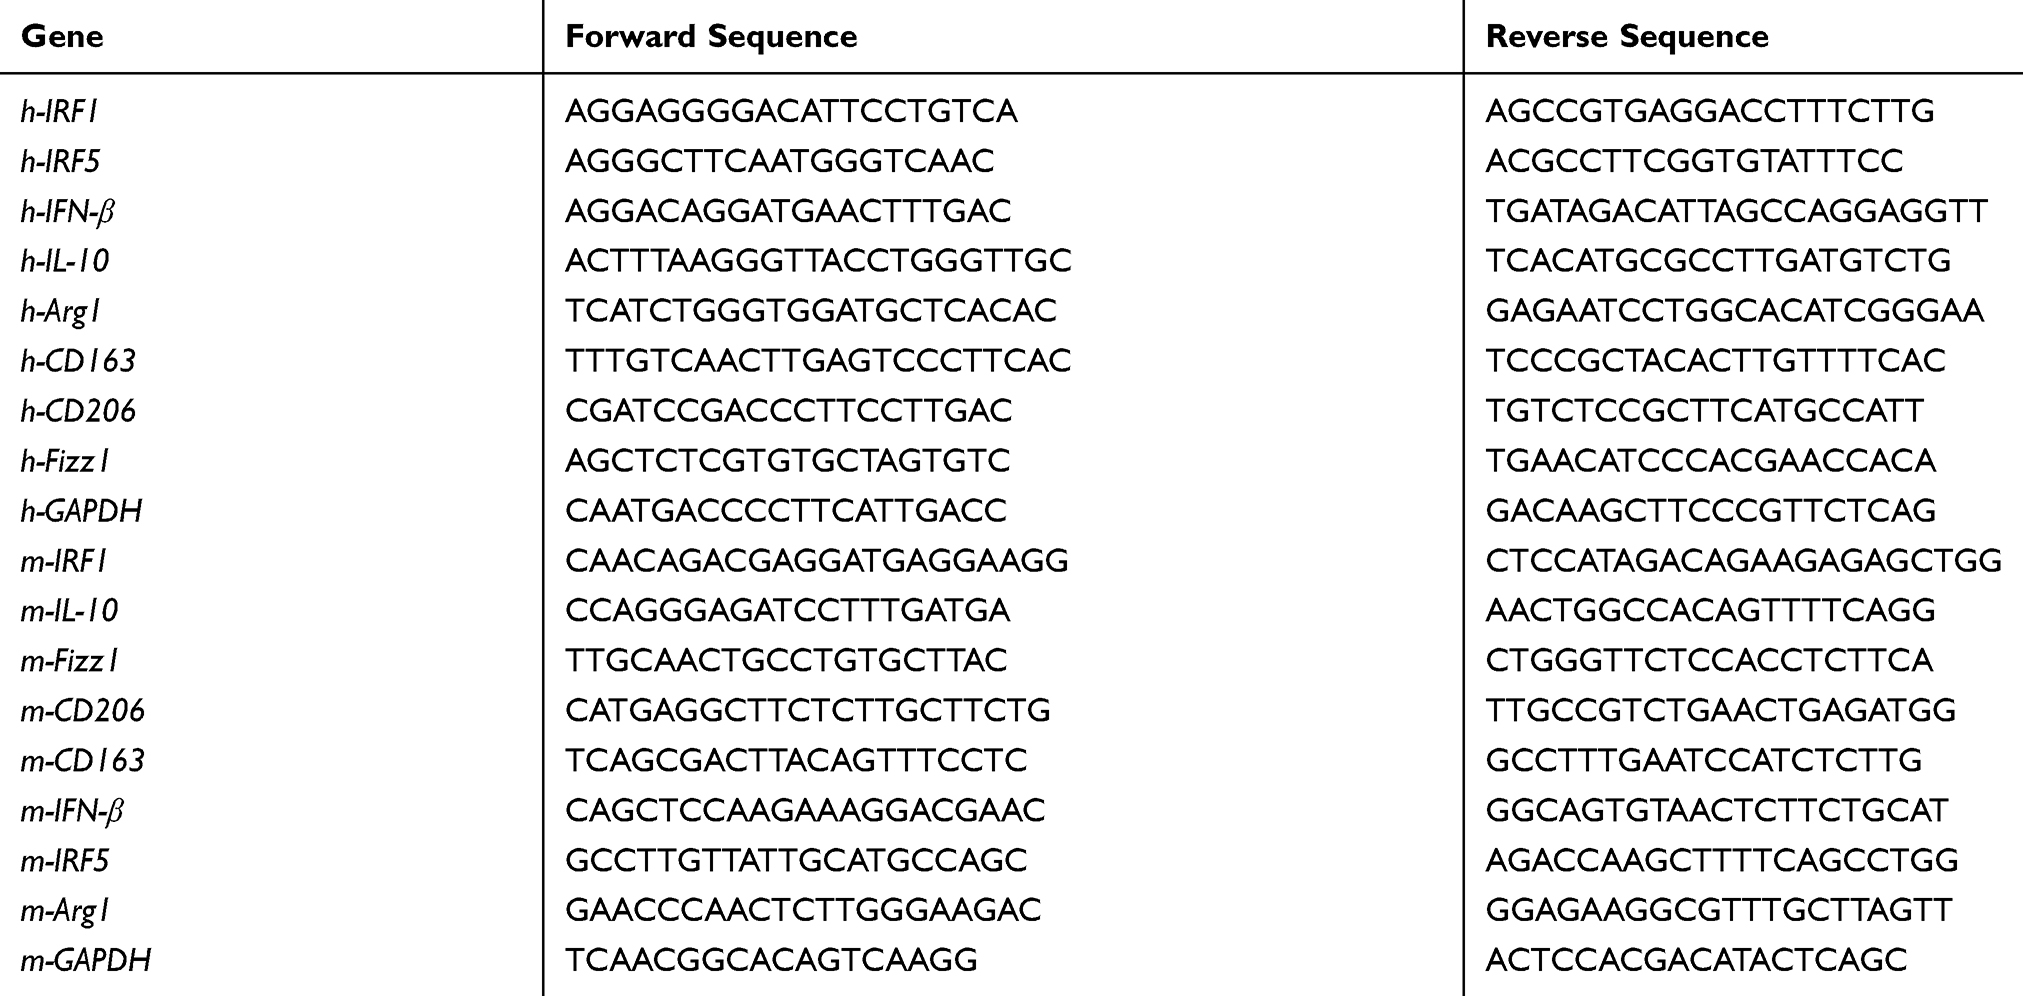 |
Table 1 Sequences of the Primers Used for qRT-PCR |
Western Blotting
Total proteins were extracted, and protein concentration was determined by BCA assay; 25 μg of total proteins were separated on SDS-polyacrylamide gel electrophoresis (PAGE) (12%) and then transferred onto nitrocellulose membrane which was blocked with 5% non-fat milk in Tris-buffered saline (20 mM Tris and 150 mM NaCl, pH7.4) with 0.05% Tween-20. Membranes were incubated with primary antibody against IRF1 (#8478, Cell Signaling Technology) or β-actin (#3700, Cell Signaling Technology) overnight at 4°C, followed by incubation with HRP-conjugated secondary antibody. Proteins were visualized with the ECL reagent (Thermo Fisher).
Peritoneal Macrophages Isolation
Male C57BL/6J mice (6 to 8 weeks) were injected intraperitoneally (i.p.) with 1 mL of sterile 3% thioglycollate (Sigma-Aldrich). After 3–5 days, peritoneal macrophages were collected by PBS intraperitoneal lavage according to the reported method.19 The cells were centrifugated and then resuspended in RPMI 1640 medium (Hyclone) with 10% FBS; 24 h later, the macrophages were rinsed thrice with Hank’s balanced salt solution to remove non-adherent cells.
In vivo Experiments
The miR-106b-5p mimics double strand (5ʹ-UAAAGUGCUGACAGUGCAGAU-3ʹ, 5ʹ-CUGCACUGUCAGCACUUUAUU-3ʹ) and the negative control miRNA double strand (5ʹ-UUCUCCGAACGUGUCACGUTT-3ʹ, 5ʹ-ACGUGACACGUUCGGAGAATT-3ʹ), the miR-106b-5p inhibitor single strand (5ʹ-AUCUGCACUGUCAGCACUUUA-3ʹ) and the negative control miRNA single strand (5ʹ-CAGUACUUUUGUGUAGUACAA-3ʹ) were synthesized in the GenePharma (Shanghai, CN).
Male C57BL/6J mice aged 6–8 weeks were grown under specific pathogen-free conditions. To induce subcutaneous tumors, GL261 cells (1.5×10⁷ cells in 100 μL of PBS) in logarithmical growth phase were injected into the right hind flanks of mice. The tumor size was measured every 3 or 4 days; when the palpable tumor was 100 mm3, mice were administered with miR-106b-5p mimics or inhibitors using Lipofectamine 2000 by local tumor injection (n=5 per group). The tumor size was measured once every 3 or 4 days for 27 days. Tumor volume (V) was calculated as follow: V=(ab2)/2, in which a is the longest and b the shortest diameter of the tumor.
Syngeneic Intracranial Glioma Model
To induce intracerebral tumors in C57BL/6J mice, GL261 cells in logarithmic growth phase were collected and resuspended with PBS at 5×10⁴ cells/5 μL. The GL261 cells were loaded into a 10-μL syringe (Gaoge, Shanghai, CN). Cells were injected intracranially 2 mm to the right of bregma and 4 mm below the surface of the skull at the coronal suture using a stereotactic instrument (Stoelting, Wood Dale, US). When neurological symptoms were observed, mice were sacrificed and perfused with 4% paraformaldehyde. The brain was collected and fixed in 4% paraformaldehyde for further detection.
Immunohistochemistry (IHC)
Tumor tissues from mice were fixed in 10% formaldehyde for 12–24 h, then embedded in paraffin and sectioned into 4-μm sections. After deparaffinization and rehydration, sections were treated with 10 mM citrate buffer (pH 6.0) at 95°C for 10 min, and then with 3% H2O2 to block endogenous peroxidase for 10 min at room temperature. Then, sections were incubated with primary antibody overnight at 4°C (IRF1 [#8478, Cell Signaling Technology], CD163 [ab182422, Abcam] and Ki67 [ab15580, Abcam]), followed by incubation with horse radish peroxidase (HRP) conjugated secondary antibody for 30 min at room temperature. The positive signal was visualized with 0.05% 3,3ʹ-diaminobenzidine (DAB) (ZSGB-BIO, Beijing). The images were captured under an optical microscope (XSP-8CA, Shanghai, CN).
In situ Hybridization (ISH)
The localization of miR-106b-5p was observed by in situ hybridization (ISH) on 4-μm sections with digoxigenin-labelled oligonucleotide miR-106b-5p detection probe (MK10121, Boster, CN) according to the manufacturer’s instructions.
Statistical Analysis
Quantitative data were from three measurements and are expressed as mean ± standard deviation (SD) and compared with Student t test. A value of two-sided P less than 0.05 was considered statistically significant. All statistical analyses were performed using GraphPad Prism 5 (GraphPad Software, La Jolla, CA).
Results
miR-106b-5p Mediated M2 Polarization of TAMs
To simulate glioma infiltrating microenvironment, human THP-1 cells were stimulated with conditioned medium of human U251 glioma cells, and human astrocytes HA cells served as a control. The mRNA expression of miR-106b-5p and representative genes of M2 phenotype (Arg1, IL-10, CD163 and CD206) were detected by qRT-PCR. The THP1 cells stimulated with conditioned medium of U251 cells exhibited a higher mRNA expression of miR-106b-5p, Arg1, IL-10, CD163 and CD206 than the HA cells (*P<0.05, **P<0.01, Figure 1A and B). The miR-106b-5p mRNA expression was further detected in M1 macrophages and M2 macrophages. qRT-PCR showed the miR-106b-5p expression was down-regulated in M1 subset and upregulated in M2 subset in human THP-1-induced and murine Raw264.7-induced macrophages (*P<0.05, **P<0.01, Figure 1C), suggesting that miR-106b-5p is related to both M1 and M2 macrophage polarization.
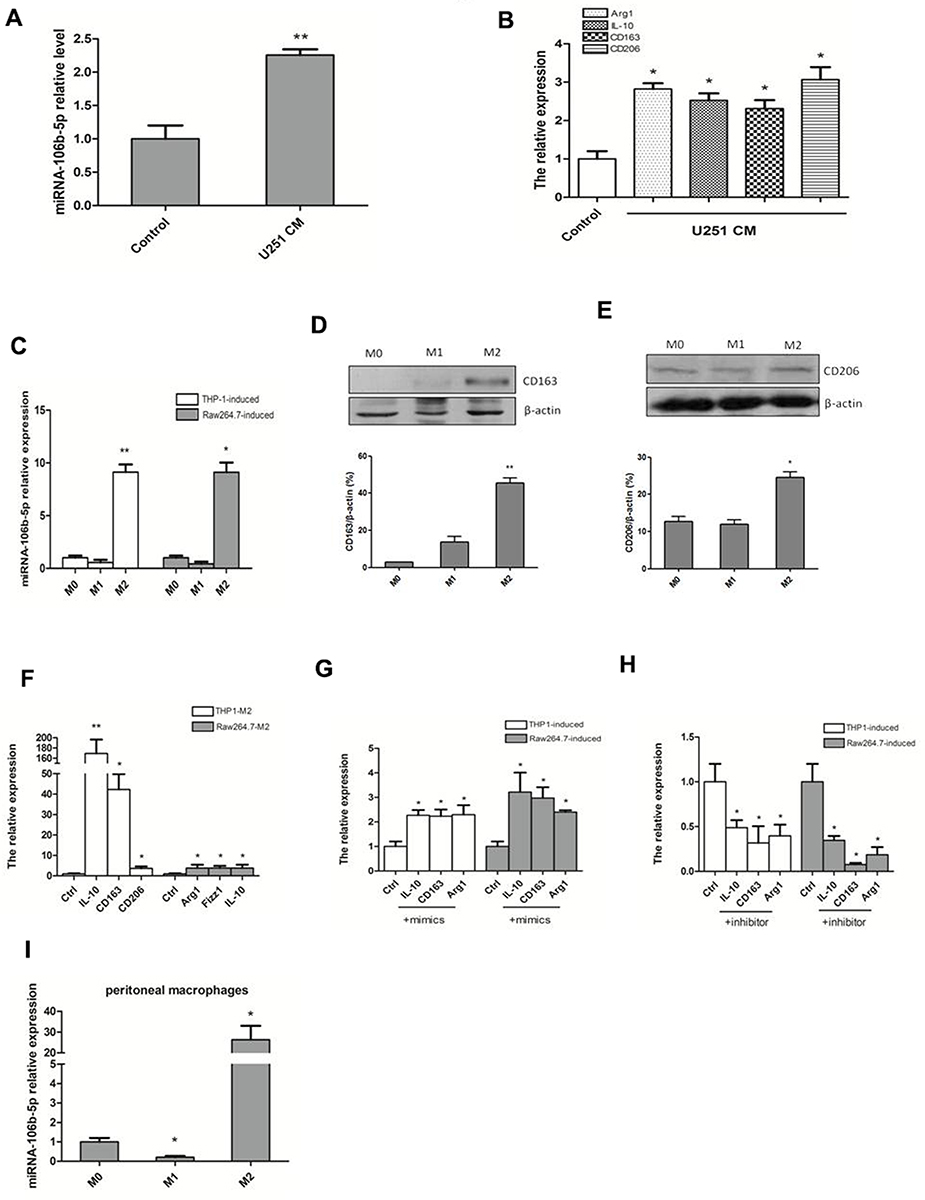 |
Figure 1 miR-106b-5p mediated M2 polarization of TAMs. (A) miR-106b-5p expression was significantly up-regulated in THP-1 cells treated with conditioned medium from human U251 glioma cells, and human astrocytes HA cells served as a control (**P<0.01 vs control). (B) Expressions of M2 macrophage markers (Arg1, IL-10, CD163 and CD206) were significantly up-regulated in THP-1 cells treated with conditioned medium from human U251 glioma cells (*P<0.05 vs control). (C) miR-106b-5p expression was downregulated in M1 subset, but upregulated in M2 subset (*P<0.05, ** P<0.01 vs M0). (D) The CD163 protein expression increased in M2 macrophages as compared to M0 and M1 macrophages (**P<0.01 vs M0). (E) CD206 protein expression increased in M2 macrophages as compared to M0 and M1 macrophages (*P<0.05 vs M0). (F) Expressions of M2 macrophage markers (Arg1, IL-10, Fizz1, CD163, CD206) were upregulated (qRT-PCR; *P<0.05, ** P<0.01 vs control). (G) Expressions of M2 macrophage markers (IL-10, CD163 and Arg1) were upregulated after transfection with miR-106b-5p mimics (*P<0.05 vs control). (H) mRNA expressions of M2 macrophage markers (IL-10, CD163 and Arg1) were down-regulated after transfection with miR-106b-5p inhibitor (*P<0.05 vs control). (I) The expression level of miR-106b-5p was decreased when PMs were stimulated with LPS in M1, and the level was markedly increased stimulated with IL-4 in M2 (*P<0.05 vs M0). |
CD163 and CD206 protein expressions increased in M2 macrophages compared with both M0 and M1 macrophages (*P<0.05, **P<0.01 Figure 1D and E). The mRNA expressions of M2 phenotype markers (Arg1, IL-10, CD163, CD206 and Fizz1) were also upregulated (*P<0.05, **P<0.01, Figure 1F). After transfection with miR-106b-5p mimics in THP-1-M0 and Raw264.7-M0 cells, the expressions of M2 markers (IL-10, CD163, and Arg1) were upregulated significantly (*P<0.05, Figure 1G). However, after transfection with miR-106b-5p inhibitor, the expressions of M2 markers (IL-10, CD163, and Arg1) were downregulated markedly by as shown by qRT-PCR (*P<0.05, Figure 1H).
To further confirm the miR-106b-5p expression during macrophage polarization, the expression of miR-106b-5p in peritoneal macrophages (PMs) from thioglycollate-elicited mouse was detected by qRT-PCR. The expression level of miR-106b-5p was decreased when PMs were stimulated with LPS in M1, and the level was markedly increased stimulated with IL-4 in M2 (*P<0.05, Figure 1I).
IRF1 is a Target of miR-106b-5p in Glioma Infiltrating Macrophages
IRF1 is a member of the interferon regulatory factor (IRF) family and belongs to a class of transcription factors involved in the regulation of immune processes and oncogenesis.20 Multiple bioinformatics analyses (Targetscan, MIRDB, PICTAR-VERT) showed IRF1 was a potential target of miR-106b-5p (Figure 2A). To further confirm whether miR-106b-5p can bind to IRF1 mRNA directly, the 3ʹ-UTR reporter activities of IRF1 were assessed by luciferase assay. Results showed miR-106b-5p inhibited IRF1 luciferase activity in cotransfected 293T cells, whereas directed mutational alteration 3ʹ-UTR IRF1-binding site resulted in complete abolishment of miR-106b-5p binding activity in cotransfected 293T cells (**P<0.01, Figure 2B).
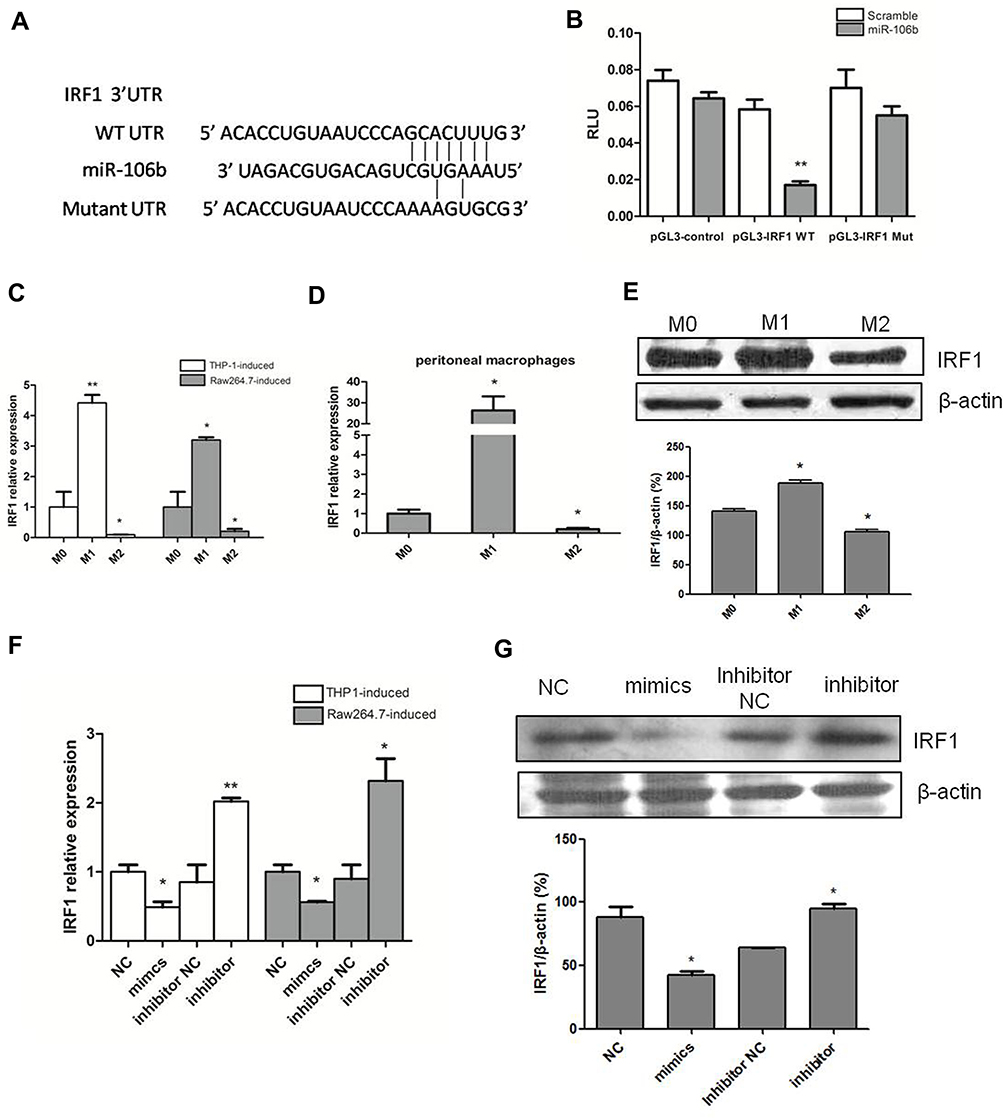 |
Figure 2 IRF1 is a target gene of miR-106b-5p in the glioma infiltrating macrophages. (A) The predicted miR-106b-5p-binding site of the 3ʹ-UTR, and mutation of IRF1 3ʹ-UTR disrupted miR-106b-5p binding. (B) Luciferase activity assay showed the binding of miR-106b-5p to the 3ʹUTR of IRF1 and inhibition of IRF1 (**P<0.01 vs scramble). (C) IRF1 expression was significantly upregulated in M1 subset and downregulated in M2 subset in THP-1 and Raw264.7 cells (*P<0.05, **P<0.01 vs M0). (D) IRF1 expression was significantly upregulated in M1 macrophages and downregulated in M2 macrophages in murine peritoneal macrophages (*P<0.05 vs M0). (E) Western blotting of IRF1 in M1, M2 and M0 macrophages (*P<0.05). (F) IRF1 expression was detected after transfection with miR-106b-5p mimics or inhibitor in THP1 and Raw264.7 cells. RF1 expression decreased after miR-106b-5p mimics treatment, and increased after miR-106b inhibitor treatment (*P<0.05, **P<0.01 vs NC). (G) Protein expression of IRF1 after transfection with miR-106b-5p mimics or inhibitor; *P<0.05. |
Subsequently, the IRF1 expression was detected in M1 macrophage and M2 macrophage derived from THP-1 and Raw264.7 cells. Results revealed the upregulation of IRF1 expression in M1 macrophages and downregulation of IRF1 expression in M2 macrophages in human THP-1, murine Raw264.7 and peritoneal macrophages (*P<0.05, **P<0.01, Figure 2C and D). Consistent with the above findings in M1 and M2 macrophages, IRF1 protein expression increased in M1 macrophages, but decreased in M2 macrophages (Western blot; *P<0.05, Figure 2E). Transfection with miR-106b-5p mimics or inhibitor altered the mRNA expression of IRF1 in THP1 and Raw264.7 cells: IRF1 expression decreased after miR-106b-5p mimics treatment and increased after miR-106b inhibitor treatment (*P<0.05, **P<0.01, Figure 2F). The IRF1 protein expression showed the same trend in the IRF1 mRNA expression (*P<0.05, Figure 2G).
miR-106b-5p Expression in Human Glioblastoma and Syngeneic Intracranial Glioma Model
Using in situ hybridization, miR-106b-5p was detected in the human glioblastoma tissues and adjacent normal brain tissues. Results showed that miR-106b-5p expression was upregulated in the human glioblastoma tissues as compared to normal brain tissues (Figure 3A, n=3). Meanwhile, the Ki67 expression was also upregulated in the human glioblastoma tissues as compared to normal brain tissues (Figure 3B, n=3). Then, the miR-106b-5p and Ki67 expression was further detected in the intracranial glioma model. Results showed both miR-106b-5p and Ki67 expression were upregulated in the intracranial glioma model as compared to control group (Figure 3C and D n=3). Meanwhile, IRF1 mRNA and protein expression decreased in the intracranial glioma model as compared to control group (real-time RT-PCR and Western blot, Figure 3E and F n=3).
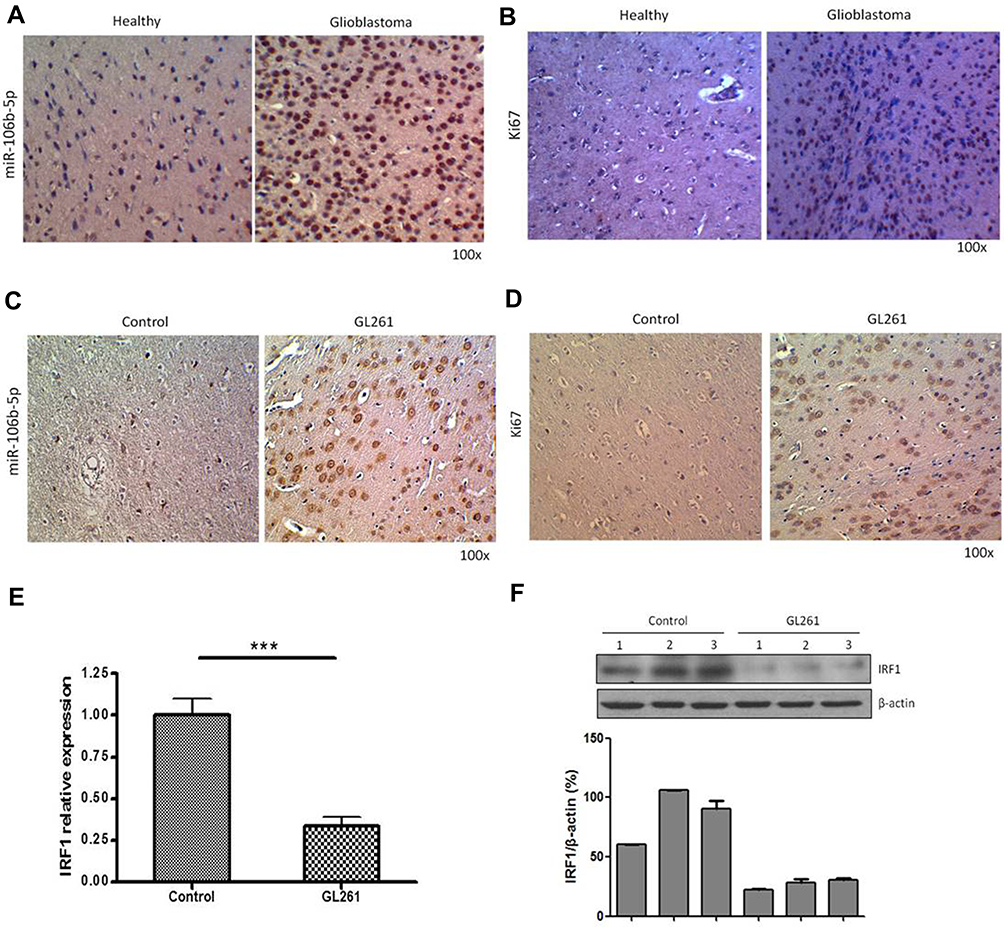 |
Figure 3 miR-106b-5p expression in the glioblastoma and syngeneic intracranial glioma model. (A) In the in situ hybridization, digoxigenin-conjugated oligonucleotide miR-106b-5p probe was used to detect miR-106b-5p expression in the glioblastoma. Left: normal brain tissues. Right: glioblastoma tissues (n=3, 100×). (B) Immunohistochemistry for Ki67 in the glioblastoma. Left: normal brain tissues. Right: glioblastoma tissues. (C) In the in situ hybridization-, digoxigenin-conjugated oligonucleotide miR-106b-5p probe to detect miR-106b-5p expression in the syngeneic intracranial glioma models (n=3, 100×). (D) Immunohistochemistry for Ki67 in the syngeneic intracranial glioma models (n=3, 100×). (E) IRF1 expression in the syngeneic intracranial glioma models (qRT-PCR, ***P<0.001). (F) IRF1 expression in the syngeneic intracranial glioma models (Western blotting; n=3). |
miR-106b-5p Enhanced Glioma Growth and Glioma-Infiltrating Macrophage Proliferation
GL261 murine glioma cells were implanted into C57BL/6J mice and the role of miR-106b-5p in tumor growth was further assessed in vivo (Figure 4A, n=10/group). When the subcutaneous GL261 tumors became palpable (about 100 mm3), miR-106b-5p mimics/inhibitor or scramble control was administered. In the miR-106b-5p mimics group, the tumor volume increased significantly (*P<0.05, Figure 4B and D), and there was no significant difference between miR-106b-5p inhibitor group and scramble control group (Figure 4C and D). Immunohistochemistry revealed that IRF1 expression was markedly suppressed in the miR-106b-5p mimics group, and there was no significant difference between miR-106b-5p inhibitor group and scramble control group (Figure 4E). In addition, Ki67 and CD163 expressions markedly increased in the miR-106b-5p mimics group, and no significant difference was observed between miR-106b-5p inhibitor group and scramble control group (Figure 4F and G).
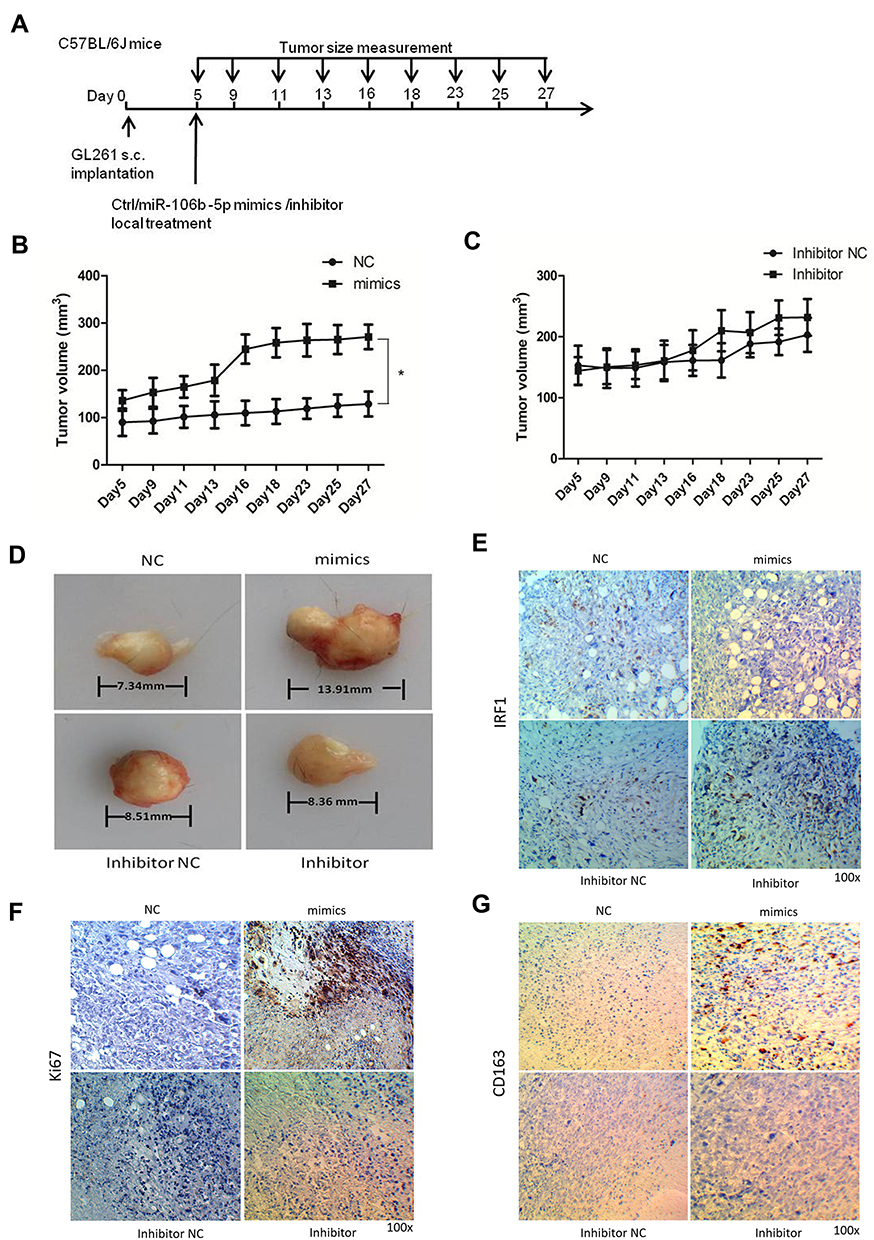 |
Figure 4 miR-106b-5p enhanced the proliferation of glioma-infiltrating macrophages to increase tumor growth. (A) The time points of tumor cell inoculation and measurements; (B, C) volumes of subcutaneous GL261 tumor in the miR-106b-5p mimics/inhibitor group and NC group (*P<0.05 vs control, n=10). (D) Subcutaneous GL261 tumor in C57BL/6J mice. (E) IRF1 protein expression (IHC; 100×, n=3). (F) Ki67 protein expression (IHC; 100×, n=3). (G) CD163 protein expression (IHC; 100×, n=3). |
miR-106b-5p Promoted M2 Polarization of Macrophages by Targeting IRF1/IFN-β Pathway
To further investigate whether IRF1 regulated M2 polarization during monocyte-to-macrophage differentiation, we co-transfected THP-1-M0 cells and Raw264.7-M0 cells with miR-106b-5p mimics and pIRES2-IRF1, or miR-106b-5p inhibitor and IRF1 siRNA. Results showed that overexpression and silencing of IRF1 could reverse the downregulated and upregulated IRF1 expression after transfection with miR-106b-5p mimics and inhibitor, respectively. Next, the expressions of M2 macrophage markers were detected after transfection of miR-106b-5p mimics, inhibitor, pIRES2-IRF1 or IRF1 siRNA. Co-transfection of miR-106b-5p mimics and pIRES2-IRF1 inhibited the expression of M2 markers in macrophages. The silencing of IRF1 could restore the expression of M2 macrophage markers in macrophages transfected with miR-106b-5p inhibitor (*P<0.05, Figure 5A and B).
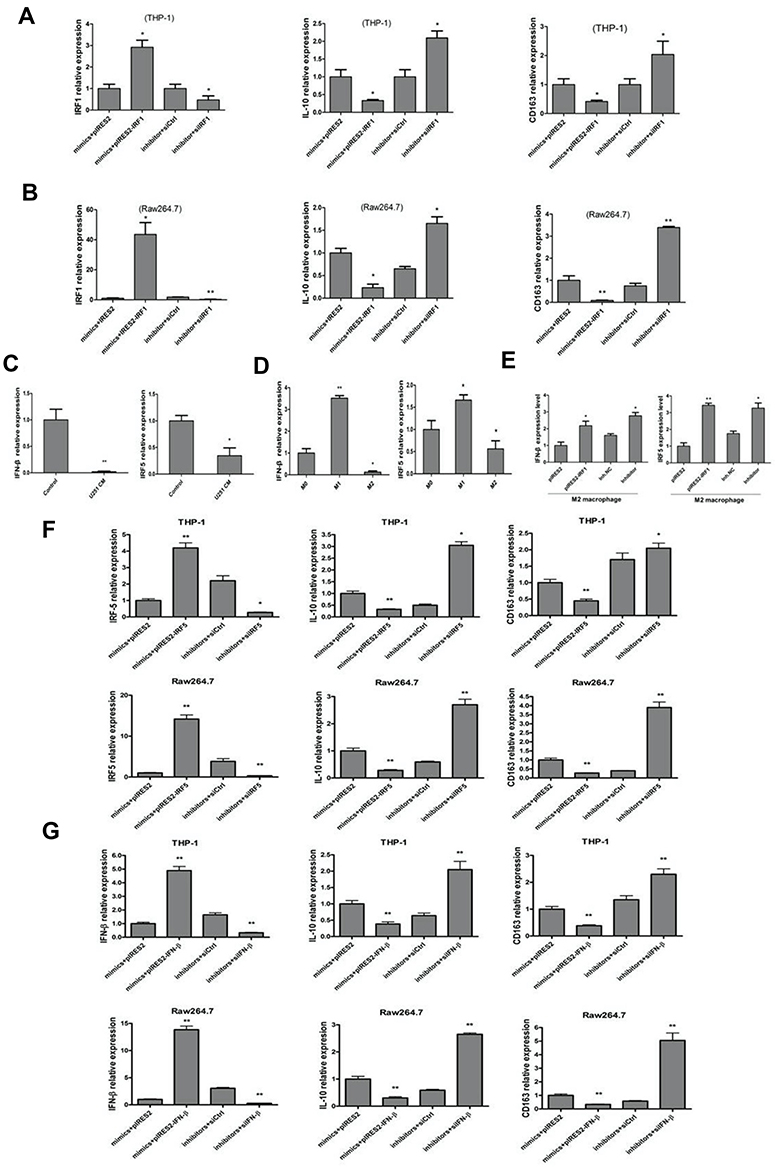 |
Figure 5 miR-106b-5p promoted M2 polarization of macrophages by targeting IRF1/IFN-β pathway. (A, B) Over-expression/silencing of IRF1 could reverse the down-regulated and up-regulated IRF1 expression by miR-106b-5p mimics and inhibitor, respectively (*P<0.05, **P<0.01 vs control). (C) The mRNA expressions of IFN-β and IRF5 significantly decreased in THP-1 cells treated with conditioned medium from U251 cell as glioma-infiltrating macrophage model (*P<0.05, **P<0.01 vs control). (D) The mRNA expressions of IFN-β and IRF5 significantly increased in M1 macrophages, and decreased in M2 macrophage (*P<0.05, ** P<0.01 vs M0). (E) The mRNA expressions of IFN-β and IRF5 increased after overexpression of IRF1 or inhibition of miR-106b-5p (*P<0.05, **P<0.01 vs control). (F) The mRNA expression of IRF5, IL-10 and CD163 in THP1 and Raw264.7 cells transfected with IRF5 or siIRF5 and miR-106b-5p mimics or inhibitor. (G) The mRNA expression of IFN-β, IL-10 and CD163 in THP1 and Raw264.7 cells transfected with IFN-β or siIFN-β and miR-106b-5p mimics or inhibitor. |
Previous studies have shown that IRF1 and IFN-β are two crucial molecules involved in the LPS and IFN-γ-initiated signaling pathway. They interact with each other, and participate in the IRF5-mediated regulation of M1 macrophages. Whether IFN-β and IRF5 expressions decrease in glioma-infiltrating macrophages is still unclear. As shown in Figure 5C, the mRNA expressions of IFN-β and IRF5 significantly decreased in THP-1 cells treated with conditioned medium from U251 cells as a glioma-infiltrating macrophage model. The mRNA expressions of IFN-β and IRF5 significantly increased in the M1 macrophages, and decreased in the M2 macrophages (*P<0.05, **P<0.01, Figure 5D). Based on the above findings, the IFN-β mRNA expression in M2 polarization was detected in cells transfected with pIRES2-IRF1 or miR-106b-5p inhibitor. Results showed the IFN-β and IRF5 mRNA expressions increased after overexpression of IRF1 or use of miR-106b-5p inhibitor compared with control group (*P<0.05, **P<0.01, Figure 5E).
To confirm that the IRF5 and IFN-β take part in miR-106b-5p-mediated macrophage polarization, we co-transfected THP-1-M0 cells and Raw264.7-M0 cells with miR-106b-5p mimics and pIRES2-IRF5 or pIRES2-IFN-β, or miR-106b-5p inhibitor and IRF1 or IFN-β siRNA followed by treatment with conditioned medium from U251 cells. Co-transfection of miR-106b-5p mimics and pIRES2-IRF5 or pIRES2-IFN-β significantly markedly decreased IL-10 and CD163 expressions in THP-1 cells and Raw264.7 (*P<0.05, ** P<0.01). Co-transfection of miR-106b-5p inhibitor and si-IFN-β or si-IRF5 significantly markedly increased IL-10 and CD163 expressions (Figure 5F–G). (*P<0.05, ** P<0.01). These findings indicate that miR-106b-5p is involved in the M2 polarization of macrophages by destructing IRF1-IFN-β -IRF5 pathway.
miR-106b-5p Regulates IRF1 to Regulate M2 Macrophage Polarization in Glioblastoma
In conclusion, our findings suggest that miR-106b-5p expression is down-regulated in M1 macrophages and up-regulated in M2 macrophages in glioblastoma microenvironment. In addition, miR-106b-5p binds to IRF1 directly to inhibit IRF1 expression in glioblastoma. Macrophages are a plastic cell population, and undergo a dynamic switch between M1 and M2 macrophages. There is a complex interaction among IRF1, IFN-β and IRF5 in M1 macrophage polarization, and they can interact with each other and form a complex to promote M1 polarization. We speculate decreased IRF1 may block the interaction of IRF1, IFN-β and IRF5 and promote the switch from M1 to M2 phenotype. This may be a critical mechanism for the glioblastoma growth (Figure 6).
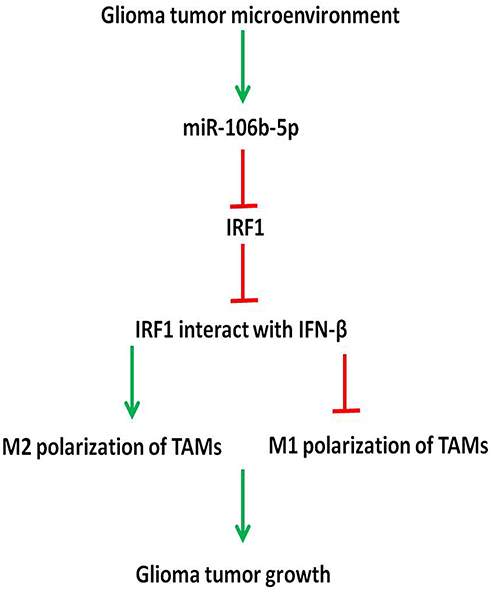 |
Figure 6 IRF1 regulates miR-106b-5p in M2 macrophage polarization. Our findings suggest, in glioma tumor microenvironment, miR-106b-5p expression is down-regulated in M1 macrophages, but up-regulated in M2 macrophages. miR-106b-5p binds to IRF1 to inhibit IRF1 expression in glioma tumor microenvironment. Macrophages are plastic cell population, and undergo a phenotypically dynamic switch between M1 and M2 macrophages. IRF1, IFN-β and IRF5 interact with each other to promote M1 polarization. We speculate that the decrease of IRF1 may block the interaction of IRF1/IFN-β/IRF5 and promote M1 to M2 polarization. This is important for the glioma tumor growth. |
Discussion
Glial tumor constitutes approximately half of all newly diagnosed primary brain tumors, and is the most aggressive and infiltrative primary brain tumor with poor prognosis.21 Gliomas are divided into four different grades according to the World Health Organization criteria based on the histopathological characteristics; low-grade gliomas are defined as grade I/II and high-grade gliomas as grade III/IV.22 It has been reported that the survival time is 5 years and 10 years in 50%~70% patients with glioma of grade I and II, respectively.23 However, the survival of patients with high-grade gliomas is still unacceptable. The survival time of patients with grade IV glioma (glioblastoma multiforme) is no more than 18 months (15–18 months).24 Currently, surgery, radiotherapy and conventional chemotherapies fail to significantly improve the prognosis of high-grade glioma. In recent years, immunotherapy has become a focus in the investigations about glioma treatment.25
TAMs are the most common cell type among glioma-infiltrating immune cells. TAMs show a prominent plasticity and can also alter their phenotype as a response to different environmental stimuli. There are two major subtypes of macrophages, M1 and M2 macrophages. M1 macrophages are the classically activated macrophages and M2 macrophages are the alternatively activated macrophages.26 M1 macrophages are induced by T helper type I (Th1) cytokines and may exert antitumor effects, whereas M2 macrophages are induced by T helper type 2 (Th2) cytokines and may confer pro-tumor effects.27–29 It has been revealed that the number of M2 macrophages is significantly higher in the glioma tissues than that in normal brain tissues, and M2 macrophages are associated with glioma tumor progression.30 Thus, the tumor grade and prognosis may be evaluated according to the number of M2 macrophages.31 It has been reported that TAMs from glioma may secrete IL-10, TGF-β and other cytokines. These cytokines can block the anti-tumor activity of T cells and natural killer cells, and then promote the tumor growth, infiltration and angiogenesis.32 It has been found that TAMs in lower-grade astrocytomas have M1 phenotype, whereas TAMs in glioma possess M2 phenotype.33 In addition, M2 macrophages can promote angiogenesis through releasing the insulin-like growth factor-binding protein 1 (IGFBP1) in GBM.34 All these indicate that M2 TAMs play a pivotal role in the progression of glioma.
miRNAs are noncoding molecules involved in the posttranscriptional regulation, and can regulate the differentiation, activation and polarization of macrophages. It has been shown that miRNAs are involved in the response of human monocytes/macrophages to inflammatory stimuli.35 In our previous study, results showed that miR-106b-5p expression was high in both glioma tumors and cell lines. There is evidence showing that miR-106b-5p has a crucial role in the cancerous transformation of glioma cells.15 In the present study, the role of miR-106b-5p in the macrophage polarization in the glioma-associated microenvironment.
Our study indicated that miR-106b-5p expression in the glioma tissues and M2 macrophages was higher than in normal brain tissues, and it in the M1 macrophages was lower than in the M0 macrophages. It has been shown that miR-106b-5p can promote M2 macrophage polarization by regulating a variety of cytokines, altering the biological properties of TAMs. Further study on the role of miR-106b-5p in the M2 polarization suggests that IRF1, the target gene of miR-106b-5p, is likely to be an upstream factor of the IRF1/IFN-β/IRF5 signaling pathway. The binding specificity of miR-106b-5p for IRF1 was confirmed by luciferase reporting assays and mutational analyses in the present study.
IRFs are a type of transcriptional regulators, and their expression can be induced by bacterial or viral infection. The IRF family consists of nine members, including IRF1, IRF2, IRF3, IRF4, IRF5, IRF6, IRF7, IRF8 (ICSBP) and IRF9 (ISGF3γ/p48), in mammals. Several studies have shown that the IRF family plays prominent roles in antiviral defense, tumor suppression, immune response, cell differentiation, apoptosis, and systemic lupus erythematosus (SLE) susceptibility.36–38 It has been reported that IRF1/5/8 can regulate the M1 polarization of macrophages, whereas IRF4 is involved in the M2 polarization.39 However, the mechanisms by which of IRFs regulate macrophage polarization are not yet fully understood.
IRF1 was originally identified as a transcriptional activator of IFN-β in virus-infected fibroblasts. IRF1 expression can be upregulated after IFN-γ stimulation, and IRF1 can bind to the IRF-stimulated responsive element (ISRE)/IRF-E site after IFN-β treatment.40 The IRF1 nuclear expression in human monocytes is mainly induced by IFN-γ and LPS simultaneously, rather than by IFN-γ or LPS alone.41
We found that the mRNA and protein expressions of IRF1 increased in M1 macrophages, but decreased in M2 macrophage. Overexpression of miR-106b-5p decreased the mRNA and protein expressions of IRF1, but blockage of miR-106b-5p increased the mRNA and protein expressions of IRF1. Our results also showed that miR-106b-5p regulated M2 polarization of macrophages specifically via IRF1.
It has been shown that IFN-β expression is high in THP1-M1 macrophages, but reduces in THP1-M2 macrophages.42 In addition, IRF1 can regulate IFN-β and IRF5 by binding to the IRF-E and ISRE. The association between IRF1 and IFN-β has been confirmed in the polarization of M1 macrophages.43 Krausgruber et al found that IRF5 expression was high in M1 macrophages, could induce a profile of characteristic gene-expression and cytokine-secretion, and promoted robust TH1-TH17 responses. They found IRF5 was a factor that could inhibit the expression of M2 macrophage markers.44
In our study, the expressions of IFN-β and IRF5 were detected in TAMs, M1 and M2 macrophages. Results showed that the mRNA expressions of IFN-β and IRF5 decreased in TAMs and M2 macrophages, but increased in M1 macrophages. Furthermore, overexpression of IRF1 or inhibition of miR-106b-5p in M2 macrophages increased the production and binding capacity of IFN-β. Our study indicates that miR-106b-5p acts as an oncogenic miRNA to play an important role in the glioma-associated microenvironment.
A comprehensive understanding of macrophage polarization is needed for development of antitumor strategies. Several signaling pathways have been identified to be related to the polarization of macrophages. There is evidence showing that macrophage polarization can be regulated at the transcriptional level, and some regulators (including STAT1, activator protein 1 [AP1], IRF1/3/5/9 and HIF-1α) play crucial roles in the macrophage polarization. Our results showed miR-106b-5p could regulate M2 polarization via IRF1, and IRF1 cooperates with IFN-β and IRF5 to play significant roles in the antitumor effects in the glioma-associated microenvironment.
In conclusion, our findings suggest that, in glioma tumor microenvironment, miR-106b-5p expression is down-regulated in M1 macrophages, but up-regulated in M2 macrophages. miR-106b-5p can bind to IRF1 to inhibit IRF1 expression in the glioma tumor microenvironment. It has been confirmed that macrophages are a plastic cell population, and undergo a dynamic switch between M1 and M2 phenotypes. There exists a complex interaction among IRF1, IFN-β and IRF5 in the M1 macrophage polarization, and they interact with each other to promote M1 polarization. We speculate that to decrease IRF1 expression may block the interaction among IRF1, IFN-β and IRF5, which promotes M1 to M2 polarization. This may be responsible for the glioma tumor growth in the glioma tumor microenvironment.
Conclusions
Our findings suggest inhibition of miR-106b-5p in macrophage polarization may serve as a potential strategy for the glioma treatment.
Acknowledgments
The authors thank Wei Li and Jing Lu for technical assistance in the animal experiments. This work was supported by National Natural Science Foundation of China (81302181), Jiangsu Provincial Medical Youth Talent Program and the Key Research and Development Program of Jiangsu Province (BE2019652).
Disclosure
The authors report no conflicts of interest in this work.
References
1. Stupp R, Tosoni A, Bromberg JE, et al. Sagopilone (ZK-EPO, ZK 219477) for recurrent glioblastoma. A Phase II multicenter trial by the European Organisation for Research and Treatment of Cancer (EORTC) Brain Tumor Group. Ann Oncol. 2011;22(9):2144–2149. doi:10.1093/annonc/mdq729
2. Badie B, Schartner JM. Flow cytometric characterization of tumor-associated macrophages in experimental gliomas. Neurosurgery. 2000;46(4):957–961. doi:10.1097/00006123-200004000-00035
3. Penfield W. Microglia and the process of phagocytosis in gliomas. Am J Pathol. 1925;1(1):77–9015.
4. Burger PC. Revising the World Health Organization (WHO) Blue Book–’Histological typing of tumours of the central nervous system’. J Neurooncol. 1995;24(1):3–7. doi:10.1007/BF01052650
5. Das A, Sinha M, Datta S, et al. Monocyte and macrophage plasticity in tissue repair and regeneration. Am J Pathol. 2015;185(10):2596–2606. doi:10.1016/j.ajpath.2015.06.001
6. Chanmee T, Ontong P, Konno K, Itano N. Tumor-associated macrophages as major players in the tumor microenvironment. Cancers. 2014;6(3):1670–1690. doi:10.3390/cancers6031670
7. Gordon S. Alternative activation of macrophages. Nat Rev Immunol. 2003;3(1):23–35. doi:10.1038/nri978
8. Martinez FO, Sica A, Mantovani A, Locati M. Macrophage activation and polarization. Front Biosci. 2008;13(13):453–461. doi:10.2741/2692
9. Davis BN, Hata A. Regulation of MicroRNA biogenesis: a miRiad of mechanisms. Cell Commun Signal. 2009;7(1):18. doi:10.1186/1478-811X-7-18
10. Gillies JK, Lorimer IA. Regulation of p27Kip1 by miRNA 221/222 in glioblastoma. Cell Cycle. 2007;6(16):2005–2009. doi:10.4161/cc.6.16.4526
11. Hermansen SK, Kristensen BW. MicroRNA biomarkers in glioblastoma. J Neurooncol. 2013;114(1):13–23. doi:10.1007/s11060-013-1155-x
12. Moller HG, Rasmussen AP, Andersen HH, Johnsen KB, Henriksen M, Duroux M. A systematic review of microRNA in glioblastoma multiforme: micro-modulators in the mesenchymal mode of migration and invasion. Mol Neurobiol. 2013;47(1):131–144. doi:10.1007/s12035-012-8349-7
13. Cai K, Wang Y, Bao X. MiR-106b promotes cell proliferation via targeting RB in laryngeal carcinoma. J Exp Clin Cancer Res. 2011;30(1):73. doi:10.1186/1756-9966-30-73
14. Smith AL, Iwanaga R, Drasin DJ, et al. The miR-106b-25 cluster targets Smad7, activates TGF-beta signaling, and induces EMT and tumor initiating cell characteristics downstream of Six1 in human breast cancer. Oncogene. 2012;31(50):5162–5171. doi:10.1038/onc.2012.11
15. Li Y, Tan W, Neo TW, et al. Role of the miR-106b-25 microRNA cluster in hepatocellular carcinoma. Cancer Sci. 2009;100(7):1234–1242. doi:10.1111/j.1349-7006.2009.01164.x
16. Petrocca F, Visone R, Onelli MR, et al. E2F1-regulated microRNAs impair TGFbeta-dependent cell-cycle arrest and apoptosis in gastric cancer. Cancer Cell. 2008;13(3):272–286. doi:10.1016/j.ccr.2008.02.013
17. Liu F, Gong J, Huang W, et al. MicroRNA-106b-5p boosts glioma tumorigenesis by targeting multiple tumor suppressor genes. Oncogene. 2014;33(40):4813–4822. doi:10.1038/onc.2013.428
18. Chomczynski P, Sacchi N. Single-step method of RNA isolation by acid guanidinium thiocyanate-phenol-chloroform extraction. Anal Biochem. 1987;162(1):156–159. doi:10.1016/0003-2697(87)90021-2
19. Fecho K, Lysle DT. Morphine-induced enhancement in the granulocyte response to thioglycollate administration in the rat. Inflammation. 2002;26(6):259–271. doi:10.1023/A:1021408500630
20. Eckhardt I, Weigert A, Fulda S. Identification of IRF1 as critical dual regulator of Smac mimetic-induced apoptosis and inflammatory cytokine response. Cell Death Dis. 2014;5(12):e1562. doi:10.1038/cddis.2014.498
21. Jovcevska I, Kocevar N, Komel R. Glioma and glioblastoma – how much do we (not) know? Mol Clin Oncol. 2013;1(6):935–941. doi:10.3892/mco.2013.172
22. Louis DN, Ohgaki H, Wiestler OD, et al. The 2007 WHO classification of tumours of the central nervous system. Acta Neuropathol. 2007;114(2):97–109. doi:10.1007/s00401-007-0243-4
23. Compton JJ, Laack NN, Eckel LJ, Schomas DA, Giannini C, Meyer FB. Long-term outcomes for low-grade intracranial ganglioglioma: 30-year experience from the Mayo Clinic. J Neurosurg. 2012;117(5):825–830. doi:10.3171/2012.7.JNS111260
24. Bradley D, Rees J. Updates in the management of high-grade glioma. J Neurol. 2014;261(4):651–654. doi:10.1007/s00415-013-7032-x
25. Bowman RL, Joyce JA. Therapeutic targeting of tumor-associated macrophages and microglia in glioblastoma. Immunotherapy. 2014;6(6):663–666. doi:10.2217/imt.14.48
26. Kennedy BC, Showers CR, Anderson DE, et al. Tumor-associated macrophages in glioma: friend or foe? J Oncol. 2013;2013:486912. doi:10.1155/2013/486912
27. Duluc D, Corvaisier M, Blanchard S, et al. Interferon-gamma reverses the immunosuppressive and protumoral properties and prevents the generation of human tumor-associated macrophages. Int J Cancer. 2009;125(2):367–373. doi:10.1002/ijc.24401
28. Labonte AC, Tosello-Trampont AC, Hahn YS. The role of macrophage polarization in infectious and inflammatory diseases. Mol Cells. 2014;37(4):275–285. doi:10.14348/molcells.2014.2374
29. Chistiakov DA, Bobryshev YV, Nikiforov NG, Elizova NV, Sobenin IA, Orekhov AN. Macrophage phenotypic plasticity in atherosclerosis: the associated features and the peculiarities of the expression of inflammatory genes. Int J Cardiol. 2015;184:436–445. doi:10.1016/j.ijcard.2015.03.055
30. Sorensen MD, Dahlrot RH, Boldt HB, Hansen S, Kristensen BW. Tumour-associated microglia/macrophages predict poor prognosis in high-grade gliomas and correlate with an aggressive tumour subtype. Neuropathol Appl Neurobiol. 2018;44(2):185–206. doi:10.1111/nan.12428
31. Jang JY, Lee JK, Jeon YK, Kim CW. Exosome derived from epigallocatechin gallate treated breast cancer cells suppresses tumor growth by inhibiting tumor-associated macrophage infiltration and M2 polarization. BMC Cancer. 2013;13(1):421. doi:10.1186/1471-2407-13-421
32. Qi L, Yu H, Zhang Y, et al. IL-10 secreted by M2 macrophage promoted tumorigenesis through interaction with JAK2 in glioma. Oncotarget. 2016;7(44):71673–71685. doi:10.18632/oncotarget.12317
33. Wang SC, Hong JH, Hsueh C, Chiang CS. Tumor-secreted SDF-1 promotes glioma invasiveness and TAM tropism toward hypoxia in a murine astrocytoma model. Lab Invest. 2012;92(1):151–162. doi:10.1038/labinvest.2011.128
34. Nijaguna MB, Patil V, Urbach S, et al. Glioblastoma-derived macrophage colony-stimulating factor (MCSF) induces microglial release of insulin-like growth factor-binding protein 1 (IGFBP1) to promote angiogenesis. J Biol Chem. 2015;290(38):23401–23415. doi:10.1074/jbc.M115.664037
35. Graff JW, Dickson AM, Clay G, McCaffrey AP, Wilson ME. Identifying functional microRNAs in macrophages with polarized phenotypes. J Biol Chem. 2012;287(26):21816–21825. doi:10.1074/jbc.M111.327031
36. Jensen MA, Niewold TB. Interferon regulatory factors: critical mediators of human lupus. Transl Res. 2015;165(2):283–295. doi:10.1016/j.trsl.2014.10.002
37. Paun A, Pitha PM. The IRF family, revisited. Biochimie. 2007;89(6–7):744–753. doi:10.1016/j.biochi.2007.01.014
38. Salloum R, Niewold TB. Interferon regulatory factors in human lupus pathogenesis. Transl Res. 2011;157(6):326–331. doi:10.1016/j.trsl.2011.01.006
39. Gunthner R, Anders HJ. Interferon-regulatory factors determine macrophage phenotype polarization. Mediators Inflamm. 2013;2013:731023. doi:10.1155/2013/731023
40. Reis LF, Harada H, Wolchok JD, Taniguchi T, Vilcek J. Critical role of a common transcription factor, IRF-1, in the regulation of IFN-beta and IFN-inducible genes. EMBO J. 1992;11(1):185–193. doi:10.1002/j.1460-2075.1992.tb05041.x
41. Tan RS, Taniguchi T, Harada H. Identification of the lysyl oxidase gene as target of the antioncogenic transcription factor, IRF-1, and its possible role in tumor suppression. Cancer Res. 1996;56(10):2417–2421.
42. El Fiky A, Perreault R, McGinnis GJ, Rabin RL. Attenuated expression of interferon-beta and interferon-lambda1 by human alternatively activated macrophages. Hum Immunol. 2013;74(12):1524–1530. doi:10.1016/j.humimm.2013.08.267
43. Xie C, Liu C, Wu B, et al. Effects of IRF1 and IFN-beta interaction on the M1 polarization of macrophages and its antitumor function. Int J Mol Med. 2016;38(1):148–160. doi:10.3892/ijmm.2016.2583
44. Krausgruber T, Blazek K, Smallie T, et al. IRF5 promotes inflammatory macrophage polarization and TH1-TH17 responses. Nat Immunol. 2011;12(3):231–238. doi:10.1038/ni.1990
 © 2020 The Author(s). This work is published and licensed by Dove Medical Press Limited. The full terms of this license are available at https://www.dovepress.com/terms.php and incorporate the Creative Commons Attribution - Non Commercial (unported, v3.0) License.
By accessing the work you hereby accept the Terms. Non-commercial uses of the work are permitted without any further permission from Dove Medical Press Limited, provided the work is properly attributed. For permission for commercial use of this work, please see paragraphs 4.2 and 5 of our Terms.
© 2020 The Author(s). This work is published and licensed by Dove Medical Press Limited. The full terms of this license are available at https://www.dovepress.com/terms.php and incorporate the Creative Commons Attribution - Non Commercial (unported, v3.0) License.
By accessing the work you hereby accept the Terms. Non-commercial uses of the work are permitted without any further permission from Dove Medical Press Limited, provided the work is properly attributed. For permission for commercial use of this work, please see paragraphs 4.2 and 5 of our Terms.