")
Back to Journals » International Journal of Nanomedicine » Volume 9 » Issue 1
Microwave-assisted polyol synthesis of carbon nitride dots from folic acid for cell imaging
Authors Guan W, Gu W, Ye L, Guo C, Su S, Xu P, Xue M
Received 29 May 2014
Accepted for publication 27 August 2014
Published 31 October 2014 Volume 2014:9(1) Pages 5071—5078
DOI https://doi.org/10.2147/IJN.S68575
Checked for plagiarism Yes
Review by Single anonymous peer review
Peer reviewer comments 3
Editor who approved publication: Dr Thomas Webster
Weiwei Guan,1,* Wei Gu,2,* Ling Ye,2 Chenyang Guo,1 Su Su,1 Pinxiang Xu,1,3 Ming Xue1,3
1Department of Pharmacology, School of Basic Medical Sciences, Capital Medical University, Beijing, People’s Republic of China; 2Department of Chemical Biology, School of Chemical Biology and Pharmaceutical Sciences, Capital Medical University, Beijing, People’s Republic of China; 3Beijing Laboratory for Biomedical Detection Technology and Instrument, Beijing, People’s Republic of China
*These authors contributed equally to this work
Abstract: A green, one-step microwave-assisted polyol synthesis was employed to prepare blue luminescent carbon nitride dots (CNDs) using folic acid molecules as both carbon and nitrogen sources. The as-prepared CNDs had an average size of around 4.51 nm and could be well dispersed in water. Under excitation at 360 nm, the CNDs exhibited a strong blue luminescence and the quantum yield was estimated to be 18.9%, which is greater than that of other reported CNDs. Moreover, the CNDs showed low cytotoxicity and could efficiently label C6 glioma cells, demonstrating their potential in cell imaging.
Keywords: carbon nitride dots (CNDs), folic acid, photoluminescence, cell imaging
Introduction
Bioimaging, a process of acquiring and visualizing structural or functional images of living systems down to the molecular level, is of great importance in seeking to reveal, diagnose, or examine diseases. Carbon dots (CDs) have attracted tremendous attentions in bioimaging due to their unique optic characteristics such as tunable emission wavelength and high stability.1,2 Most importantly, the CDs are free of heavy metals, avoiding severe environmental and biological incompatibility issues.3,4 Up to now, numerous approaches, such as laser ablation,5 electrochemical oxidation,6,7 chemical oxidation,8,9 thermolysis,10,11 and a microwave-assisted method,3,10,12 have been developed for the preparation of CDs. Among these approaches, the microwave-assisted method is the most economical and convenient for large-scale production of CDs. However, the quantum yield (QY) of the CDs prepared by the microwave-assisted method is usually not satisfactory. To improve the photoluminescent (PL) efficiency, an additional surface-passivation step is a must. For example, the quantum yield of CDs prepared by microwave-assisted pyrolysis of glycerol was 4.63%, and it increased to 12.02% after surface passivation.13
An alternative strategy to enhance the PL efficiency of CDs is to substitute carbon atoms with heteroatoms, such as nitrogen, sulfur, and silicon. 14–16 So far, the nitrogen atom has been widely used as a substitution because it has a comparable atomic size for bonding with carbon atoms. For instance, carbon nitride dots (CNDs) were successfully obtained by the carbonization of CCl4 in the presence of 1, 2-ethylenediamine under microwave heating.17 As the nitrogen substitution disordered the carbon hexagonal rings and create emission energy traps through the radiative recombination induced by electron–hole pairs, the obtained CNDs emitted blue luminescence upon UV excitation. Nevertheless, the use of CCl4 as the carbon source produces a toxic volatile vapor during microwave heating. Alternatively, CNDs can be fabricated by microwave-assisted pyrolysis of less-toxic organic amines in the presence of acids.18 The QY of as-prepared CNDs, however, was less than 10%. Therefore, it remains highly desirable to search for new carbon sources in line with a simple and green synthesis route with an improved PL efficiency.
In the present study, folic acid (FA) molecules containing both carbon and nitrogen atoms were adopted as the precursors to produce blue luminescent CNDs by a one-step microwave-assisted polyol method.19 Another important feature of this green and simple approach is that the formation and the functionalization of CNDs were accomplished simultaneously. The surface-functionalized CNDs derived from the carbonization of FA could be obtained within 1 minute and were well dispersed in water. The PL properties of the CNDs were investigated in detail. Moreover, the potential of these blue luminescent CNDs in cell imaging was explored.
Methods
Synthesis of CNDs
CNDs were synthesized through a microwave-assisted polyol method.19 In brief, 15 mg of FA was first dissolved in 3 mL of diethylene glycol, followed by addition of 200 μL of concentrated hydrochloric acid. After ultrasonication, the mixture was placed at the center of the rotation plate of a domestic 750 W microwave oven (Glanz, Guangdong, People’s Republic of China) and heated for 40 seconds. When cooled down to room temperature, the red-brown suspension was subjected to dialysis against pure water through a dialysis membrane (molecular weight cutoff =500 Da) for 3 days. Next, the suspension in the dialysis membrane was vacuum-dried and then rinsed with anhydrous ethanol. The purified suspension was centrifuged (13,000 g) for 15 minutes.Finally, the precipitate was vacuum-dried at ambient temperature to yield CNDs.
Characterization
The ultraviolet-visible (UV-Vis) absorption spectrum was collected on a UV2550 UV–Vis spectrophotometer (Shimadzu, Japan). The PL emission measurements were performed on an F2500 fluorometer (Hitachi; Japan), with a slit width of 2.5 nm for both excitation and emission. The excitation wavelength increased by a 20 nm increment from 320 nm to 460 nm. The morphology of CNDs were examined by transmission electron microscopy (TEM) on a JEM-2100 microscope (JEOL, Japan) and high-resolution transmission electron microscopy (HRTEM) on a JEM-2100F microscope (JEOL), respectively. The accelerating voltage was 200 kV for TEM and HRTEM. The specimen for TEM was prepared by dropping an aqueous dispersion of CNDs onto a copper grid coated with a lacy carbon film and subsequently dried in a vacuum. Zeta potential and size distribution measurements were performed on a ZS90 Zetasizer (Malvern, United Kingdom). The Fourier transform infrared spectrum of CNDs was collected on an IR Prestige-21 spectrophotometer (Shimadzu). The X-ray photoelectron spectroscopy (XPS) spectrum of CNDs was measured on an Axis Ultra Imaging Photoelectron Spectrometer (Kratos, Shimadzu, Japan).
Measurement of QY
The QY of CNDs was estimated by using quinine sulfate (in 0.1 M H2SO4, QY =54%) as a reference. The absorbance values of CNDs and quinine sulfate were measured at 360 nm, and PL emission spectra of CNDs and quinine sulfate were recorded at an excitation wavelength of 360 nm. The integrated fluorescence intensity is the area under the PL curve in the wavelength range from 380 to 700 nm. Then, the integrated fluorescence intensity against the absorbance was plotted linearly with intercept at zero. The QY of CNDs was then calculated according to the following equation:
| (1) |
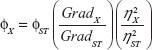
where the subscripts ST and X denote quinine sulfate and CNDs, respectively, Φ is the QY, Grad is the gradient from the linear plot of integrated fluorescence intensity versus absorbance, and η is the refractive index of the solvent (both are 1.33). In order to minimize the reabsorption effects, the absorbance at 360 nm in a 10 mm cuvette was kept below 0.1.
Fluorescence quenching measurements
The Stern–Volmer constant, KSV, is related to fluorescence intensities by the following Stern–Volmer equation:
| (2) |
where the F0 and F are the fluorescence intensities in absence and presence of quencher (metal ions), respectively, and [Q] is the concentration of quencher. To explore the effect of metal ions on the PL, various metal ions including Na+, Ca2+, Al3+, Cu2+, and Fe3+ were added into aqueous suspension of CNDs.
Cell culture and viability assay
Glioma C6 cells were cultured in Dulbecco’s Modified Eagle’s Medium (HyClone) with high glucose, containing 10% fetal bovine serum, 100 U/mL penicillin, and 100 mg/mL streptomycin at 37°C in 5% CO2 humidified atmosphere.
The cytotoxicity of CNDs was assessed by the MTT [3-(4,5-Dimethylthiazolyl-2)-2,5-diphenyltetrazolium bromide] assay.20 The C6 cells were counted and seeded into 96-well culture plates at a density of 7×10⁴ cells/well, then incubated for 12 hours. After the culture medium was removed, CNDs with different concentrations, from 50–300 μg/mL, were added into each well and incubated for another 24 hours. The medium was refreshed with 120 μL medium containing 20 μL MTT (5 mg/mL in phosphate-buffered solution) and incubated for additional 4 hours. Finally, all medium was depleted and 150 μL/well of dimethyl sulfoxide (DMSO) was added, followed by shaking for 10 minutes. The optical density of each well was immediately measured at 490 nm on a Model 680 Microplate Reader (Bio-Rad, USA) to assess the cell viability. DMSO and nontreated cells were used as the blank and control groups, respectively. The relative cell viability was expressed as follows:
| (3) |

where Abs is absorbance.
Confocal microscope
The C6 cells were seeded into 35 mm cell-culture plate and grown for 12 hours. Then, the culture medium was replaced by 1 mL fresh medium containing 100 μg/mL CNDs. The cells were incubated for another 24 hours. The samples were examined under a Leica confocal laser scanning microscope.
Results and discussion
Characterization of CNDs
Figure 1A shows the TEM image of CNDs, which revealed that these spherical nanoparticles were well separated from each other. The HRTEM image taken from a single CND showed that the size of CNDs was about 4 nm and that the lattice spacing was 0.20 nm (inset, Figure 1A). The corresponding particle size histograms (Figure 1B) further supported that these CNDs had a narrow size distribution of 3.62–5.62 nm with an average value of 4.51 nm. The zeta potential titration (Figure 1C) revealed that zeta potential of CNDs at pH 7.4 was -7.15 mV, suggesting that the surface of CNDs was functionalized with carboxyl groups. As shown in Figure 1D, the characteristic infrared bands of υ (O-H) and υ (C=O) at 3,426 and 1,647 cm−1 confirmed the existence of carboxyl groups on the surface of CNDs. Besides, the band at 1,638 cm−1 assigned to υ (C=N) validated the nitrogen-containing carbon ring.
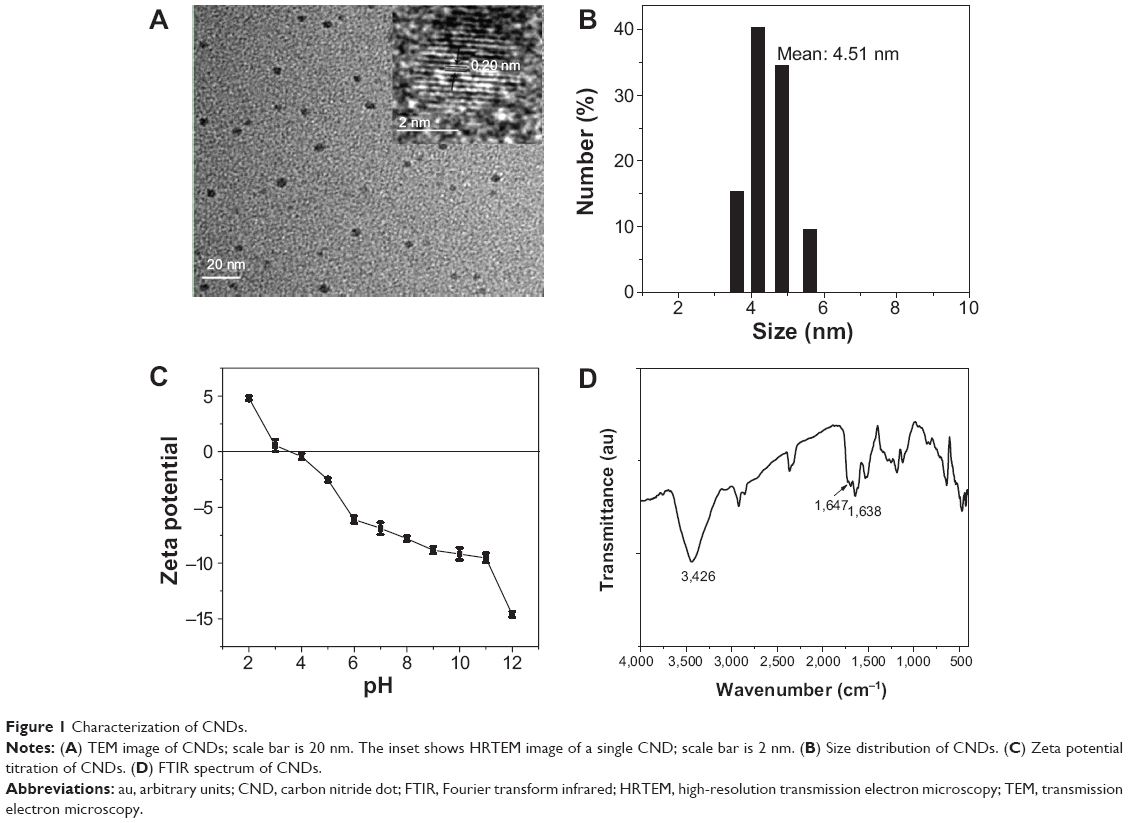 | Figure 1 Characterization of CNDs. |
The composition of CNDs was characterized by XPS. The XPS survey spectrum of CNDs exhibited three peaks at 285.5, 399.5 and 532.5 eV, which were attributed to C1s, N1s, and O1s, respectively (Figure 2A). This data indicates that the CNDs were mainly composed of C, N, and O atoms. Furthermore, Figure 2B illustrates the XPS spectrum of CNDs in the C1s region. The peak at 286.2 eV revealed the presence of N–C=N (carbon bonded to two nitrogen atoms). Meanwhile, peaks at 287.7 and 288.8 eV were due to C–O and C=O.17,18,21 The XPS spectrum of CNDs in the O1s region showed the peaks at 531.2 and 532.6 eV, confirming the presence of C–O and C=O. The N1s spectrum (Figure 2C) of CNDs exhibited a sole peak at 399.5 eV associated with N–C=N, verifiying the presence of nitrogen in the carbon ring. Note that the N1s spectrum of CNDs differs from that of nitrogen-doped carbon dots, which typically showed N1s peaks originated from C3-N and N-H.22
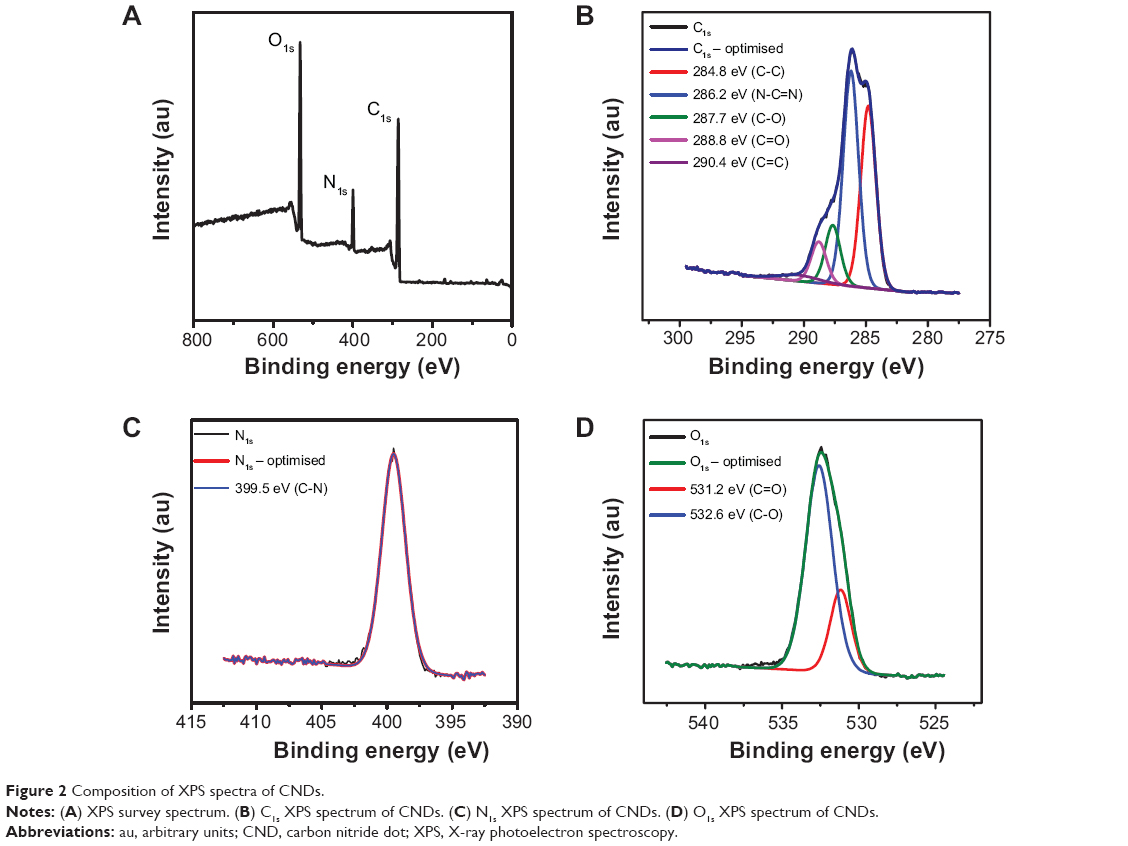 | Figure 2 Composition of XPS spectra of CNDs. |
The PL properties of CNDs
Figure 3A presents the UV-Vis absorption and PL emission spectra of the as-prepared CNDs. The UV-Vis spectrum showed an adsorption peak at 270 nm, which was attributed to the n−π* transition. The PL emission with a peak at around 460 nm was observed for the aqueous dispersion of CNDs under excitation at 360 nm, which corresponded to the visible blue color under UV illumination (365 nm) as shown in the digital picture (inset, Figure 3a). Using quinine sulfate (QY =54%) as the reference, the QY of CNDs was estimated to be 18.9% (shown in Figure 3B), which is higher than that of other reported CNDs.17,18,23
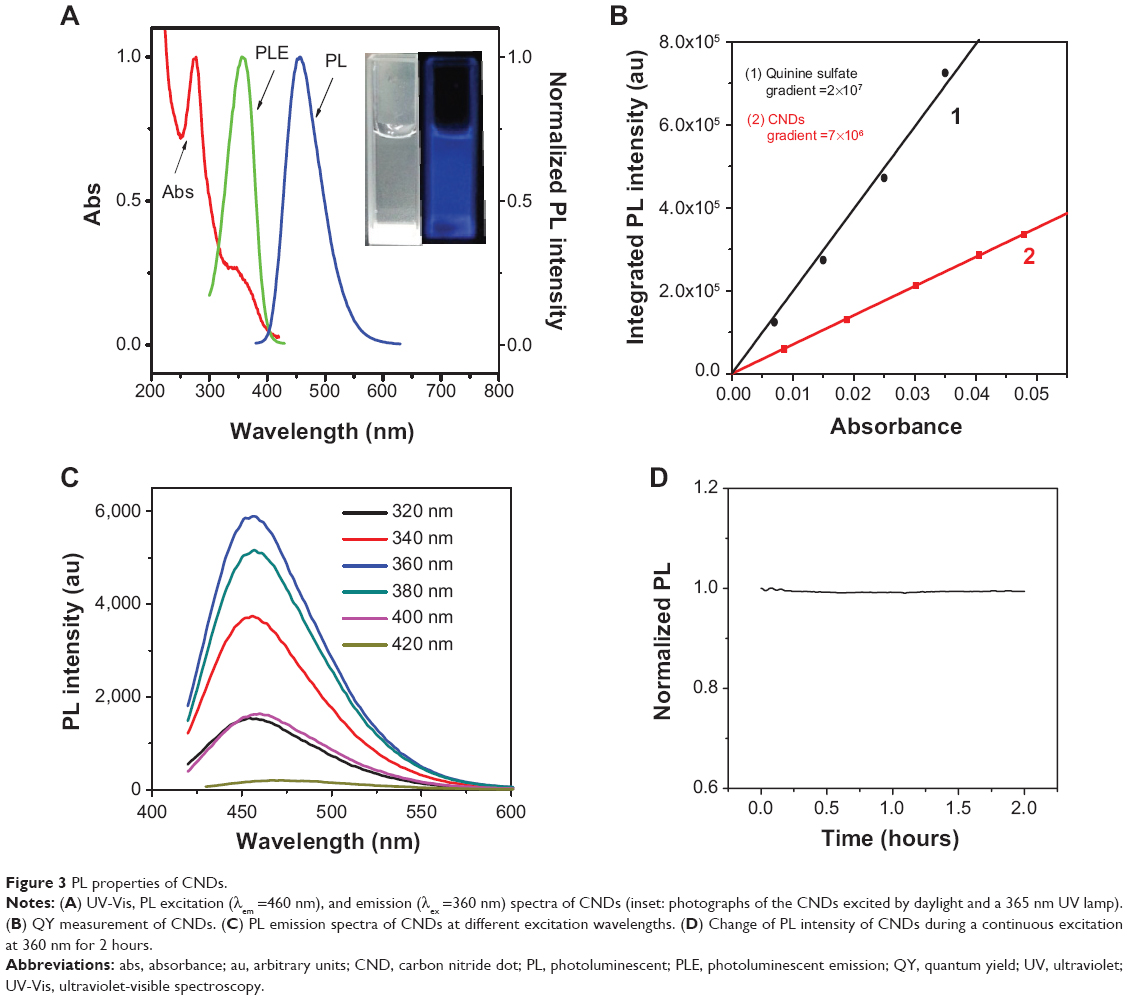 | Figure 3 PL properties of CNDs. |
Next, we implemented a detailed study to further explore the PL properties of CNDs by varying the excitation wavelength from 320 nm to 420 nm (shown in Figure 3C). Intriguingly, the emission peak remained nearly invariable (at 460 nm) and the intensity of PL reached its maximum when the excitation wavelength was 360 nm. As different energy levels are associated with different “surface states” that are responsible for the excitation-dependent-emission,24 the observed excitation-independent emission thereby indicates a relatively uniform surface of CNDs.3 The wavelength-independent PL makes the CNDs useful for cell imaging where the autofluorescence could be minimized. Moreover, it was found that these CNDs showed good photostability, as the PL intensity remained almost constant under continuous 360 nm excitations for up to 2 hours (Figure 3D).
Effect of metal ions and pH on the PL of CNDs
Figure 4A shows the change in PL intensity of CNDs upon addition of metal ions. It can be seen that the PL intensity of CNDs is almost unchanged upon addition of Na+, Ca2+, and Al3+ ions. In contrast, apparent fluorescence quenching was observed upon addition of Cu2+ and Fe3+ ions. Figure 4B indicates the linear fitting of the interaction between CNDs and Cu2+ (λex =360 nm) and Figure 4C shows the linear fitting of the interaction between CNDs and Fe3+ (λex =360 nm). The mechanism of fluorescence quenching caused by Cu2+ and Fe3+ ions was then studied according to the Stern–Volmer equation and it was found that both of them were static quenching, probably due to the formation of coordination bond between the carboxyl groups of CNDs and Cu2+ or Fe3+ ions. The KSV were 2.4×10⁵ M−1 (Cu2+) and 1×10⁶ M−1 (Fe3+), respectively. Furthermore, the influence of pH value on the PL of CNDs was also examined (shown in Figure 4D). It was revealed that the PL of CNDs kept stable in the range of pH 4–10. However, a significant decrease in the PL intensity was observed when pH <4 and pH >10.
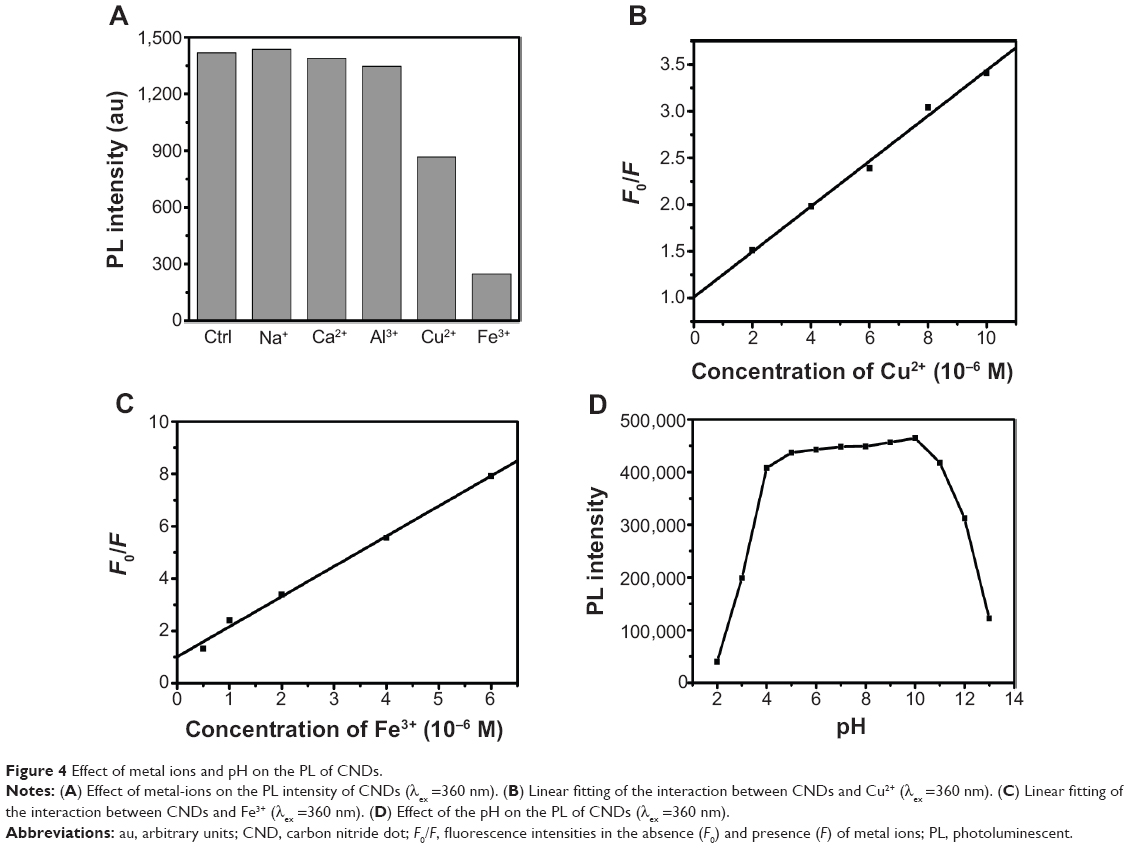 | Figure 4 Effect of metal ions and pH on the PL of CNDs. |
Cytotoxicity and cell imaging
To assess the cytotoxicity of CNDs, the relative viabilities of C6 cells exposed to CNDs were measured by the MTT assay. As shown in Figure 5, CNDs showed negligible cytotoxicity toward C6 cells, as cell viability of at least 86% was retained even though the concentration of CNDs was as high as 300 μg/mL for 24 hours. The confocal laser scanning microscope images clearly evidenced that C6 cells incubated with CNDs (100 μg/mL) emitted blue luminescence upon excitation at 405 nm, while no fluorescence was observed in the control group (shown in Figure 6). Moreover, it was noted that the emissive CNDs were distributed mainly in the cytoplasm and particularly around the cell nucleus. The luminescence of CNDs in the cell nucleus, however, was relatively weak.
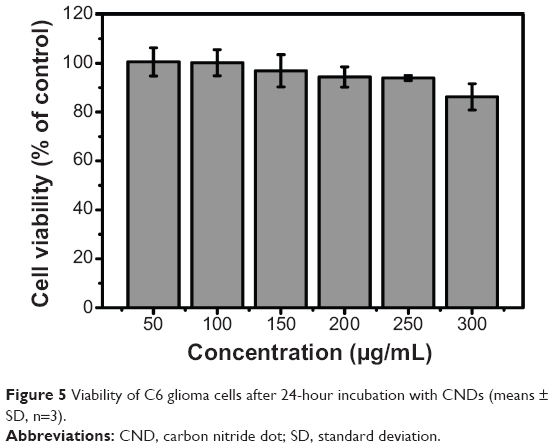 | Figure 5 Viability of C6 glioma cells after 24-hour incubation with CNDs (means ±SD, n=3). |
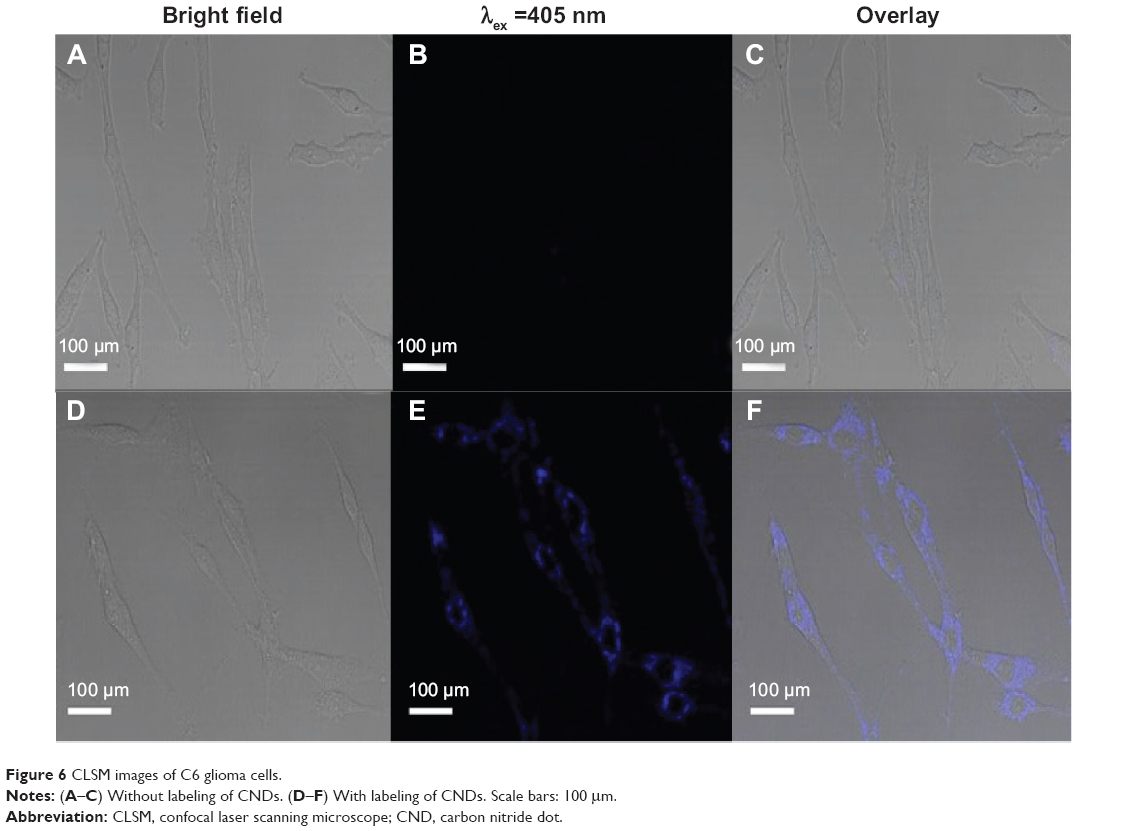 | Figure 6 CLSM images of C6 glioma cells. |
Conclusion
In summary, blue luminescent CNDs with an improved QY (18.9%) were successfully prepared by the one-step microwave-assisted polyol method using FA as precursor. The as-obtained CNDs had a narrow size distribution with average diameters of 4.51 nm and exhibited an excitation-dependent emission. Moreover, the CNDs showed low cytotoxicity and could efficiently label the C6 cells, indicating that they are a promising nanoprobe for cell imaging.
Acknowledgments
The authors thank the National Foundation of Natural Sciences of China (81173121, 81271639), the Key Program of Beijing Natural Science Foundation (KZ201110025024), the Projects for Academic Human Resources Development in Institutions of High Learning (PHR201007111), and Beijing Laboratory for Biomedical Detection Technology and Instrument (PXM2014-014226-000021) under the jurisdiction of Beijing Municipality of the People’s Republic of China.
Disclosure
The authors declare that they have no competing interests in this work.
References
Baker SN, Baker GA. Luminescent carbon nanodots: emergent nanolights. Angew Chem Int Ed Engl. 2010;49(38):6726–6744. | ||
Esteves da Silva JCG, Gonçalves HMR. Analytical and bioanalytical applications of carbon dots. Trends Analyt Chem. 2011;30(8):1327–1336. | ||
Zhai X, Zhang P, Liu C, et al. Highly luminescent carbon nanodots by microwave-assisted pyrolysis. Chem Commun (Camb). 2012;48(64):7955–7957. | ||
Qiao ZA, Wang Y, Gao Y, et al. Commercially activated carbon as the source for producing multicolor photoluminescent carbon dots by chemical oxidation. Chem Commun (Camb). 2010;46(46):8812–8814. | ||
Sun YP, Zhou B, Lin Y, et al. Quantum-sized carbon dots for bright and colorful photoluminescence. J Am Chem Soc. 2006;128(24):7756–7757. | ||
Li Y, Zhao Y, Cheng H, et al. Nitrogen-doped graphene quantum dots with oxygen-rich functional groups. J Am Chem Soc. 2012;134(1):15–18. | ||
Lu J, Yang JX, Wang J, Lim A, Wang S, Loh KP. One-pot synthesis of fluorescent carbon nanoribbons, nanoparticles, and graphene by the exfoliation of graphite in ionic liquids. ACS Nano. 2009;3(8):2367–2375. | ||
Liu H, Ye T, Mao C. Fluorescent carbon nanoparticles derived from candle soot. Angew Chem Int Ed Engl. 2007;46(34):6473–6475. | ||
Tian L, Ghosh D, Chen W, Pradhan S, Chang X, Chen S. Nanosized carbon particles from natural gas soot. Chem Mater. 2009;21(13):2803–2809. | ||
Yang Y, Cui J, Zheng M, et al. One-step synthesis of amino-functionalized fluorescent carbon nanoparticles by hydrothermal carbonization of chitosan. Chem Commun (Camb). 2012;48(3):380–382. | ||
Zhu S, Zhang J, Qiao C, et al. Strongly green-photoluminescent graphene quantum dots for bioimaging applications. Chem Commun (Camb). 2011;47(24):6858–6860. | ||
Jaiswal A, Ghosh SS, Chattopadhyay A. One step synthesis of C-dots by microwave mediated caramelization of poly(ethylene glycol). Chem Commun (Camb). 2012;48(3):407–409. | ||
Liu C, Zhang P, Tian F, Li W, Li F, Liu W. One-step synthesis of surface passivated carbon nanodots by microwave assisted pyrolysis for enhanced multicolor photoluminescence and bioimaging. J Mater Chem. 2011;21(35):13163–13167. | ||
Wohlgemuth SA, White RJ, Willinger MG, Titirici MM, Antonietti M. A one-pot hydrothermal synthesis of sulfur and nitrogen doped carbon aerogels with enhanced electrocatalytic activity in the oxygen reduction reaction. Green Chem. 2012;14(5):1515–1523. | ||
Li Q, Zhang S, Dai L, Li LS. Nitrogen-doped colloidal graphene quantum dots and their size-dependent electrocatalytic activity for the oxygen reduction reaction. J Am Chem Soc. 2012;134(46):18932–18935. | ||
Qian Z, Shan X, Chai L, Ma J, Chen J, Feng H. Si-doped carbon quantum dots: a facile and general preparation strategy, bioimaging application, and multifunctional sensor. ACS Appl Mater Interfaces. 2014;6(9):6797–6805. | ||
Liu S, Tian J, Wang L, Luo Y, Zhai J, Sun X. Preparation of photoluminescent carbon nitride dots from CCl4 and 1, 2-ethylenediamine: a heat-treatment-based strategy. J Mater Chem. 2011;21(32):11726–11729. | ||
Liu S, Tian J, Wang L, Luo Y, Sun X. A general strategy for the production of photoluminescent carbon nitride dots from organic amines and their application as novel peroxidase-like catalysts for colorimetric detection of H2O2 and glucose. RSC Adv. 2012;2:411–413. | ||
Liu Y, Xiao N, Gong N, et al. One-step microwave-assisted polyol synthesis of green luminescent carbon dots as optical nanoprobes. Carbon. 2014;68:258–264. | ||
Takahashi S, Abe T, Gotoh J, Fukuuchi Y. Substrate-dependence of reduction of MTT: a tetrazolium dye differs in cultured astroglia and neurons. Neurochem Int. 2002;40(5):441–448. | ||
Barman S, Sadhukhan M. Facile bulk production of highly blue fluorescent graphitic carbon nitride quantum dots and their application as highly selective and sensitive sensors for the detection of mercuric and iodide ions in aqueous media. J Mater Chem. 2012;22(41):21832–21837. | ||
Yang Z, Xu M, Liu Y, et al. Nitrogen-doped, carbon-rich, highly photoluminescent carbon dots from ammonium citrate. Nanoscale. 2014;6(3):1890–1895. | ||
Liu S, Wang L, Tian J, et al. Acid-driven, microwave-assisted production of photoluminescent carbon nitride dots from N, N-dimethylformamide. RSC Adv. 2011;1(6):951–953. | ||
Tang L, Ji R, Cao X, et al. Deep ultraviolet photoluminescence of water-soluble self-passivated graphene quantum dots. ACS Nano. 2012;6(6):5102–5110. |
 © 2014 The Author(s). This work is published and licensed by Dove Medical Press Limited. The full terms of this license are available at https://www.dovepress.com/terms.php and incorporate the Creative Commons Attribution - Non Commercial (unported, v3.0) License.
By accessing the work you hereby accept the Terms. Non-commercial uses of the work are permitted without any further permission from Dove Medical Press Limited, provided the work is properly attributed. For permission for commercial use of this work, please see paragraphs 4.2 and 5 of our Terms.
© 2014 The Author(s). This work is published and licensed by Dove Medical Press Limited. The full terms of this license are available at https://www.dovepress.com/terms.php and incorporate the Creative Commons Attribution - Non Commercial (unported, v3.0) License.
By accessing the work you hereby accept the Terms. Non-commercial uses of the work are permitted without any further permission from Dove Medical Press Limited, provided the work is properly attributed. For permission for commercial use of this work, please see paragraphs 4.2 and 5 of our Terms.