")
Back to Journals » OncoTargets and Therapy » Volume 13
MicroRNA Profile Identifies miR-6165 Could Suppress Gastric Cancer Migration and Invasion by Targeting STRN4
Authors Wang Z, Li Y, Cao J, Zhang W , Wang Q, Zhang Z , Gao Z, Ye Y, Jiang K, Wang S
Received 8 March 2019
Accepted for publication 11 February 2020
Published 3 March 2020 Volume 2020:13 Pages 1859—1869
DOI https://doi.org/10.2147/OTT.S208024
Checked for plagiarism Yes
Review by Single anonymous peer review
Peer reviewer comments 4
Editor who approved publication: Dr William C. Cho
Zhu Wang,1,2 Yang Li,1,2 Jian Cao,1 Wei Zhang,1,2 Quan Wang,1,2 Zhen Zhang,1,2 Zhidong Gao,1 Yingjiang Ye,1,2 Kewei Jiang,1,2 Shan Wang1,2
1Department of Gastroenterological Surgery, Peking University People’s Hospital, Beijing 100044, People’s Republic of China; 2Laboratory of Surgical Oncology, Beijing Key Laboratory of Colorectal Cancer Diagnosis and Treatment Research, Peking University People’s Hospital, Beijing 100044, People’s Republic of China
Correspondence: Shan Wang; Kewei Jiang Tel/Fax +86-10-88326608
Email [email protected]; [email protected]
Background: Recent studies showed that aberrant expression of miRNAs causes tumor-suppressing or promoting effects in various cancers including gastric cancer (GC). Our previous studies showed that lots of miRNAs and mRNA expressed differentially in GC and normal tissues. However, the critical miRNAs and mRNA need to be clarified.
Materials and Methods: Microarray sequencing was used to profile the differential expression of miRNAs and mRNA in GC and normal tissues. Bioinformatics analysis and database prediction were used to search the critical miRNAs and mRNA. Real-time quantitative polymerase chain reaction (RT-qPCR), luciferase reporter assay, immunohistochemistry (IHC), wound healing assay and transwell assay were used to clarify the relationship between the target miRNAs and mRNA. Statistical analysis was used to seek their value of diagnosis and prognosis.
Results: We identified microRNA-6165 (miR-6165) as a novel cancer-related miRNA in GC through high-throughput microarray sequencing. By bioinformatics analysis and luciferase reporter assay, we found STRN4 was the target of miR-6165. Via a series of cell experiments, we determined that miR-6165 suppressed GC cells migration and invasion by targeting STRN4. Also, we discovered the potential diagnosis and prognosis value of miR-6165 and STRN4.
Conclusion: It was found that miR-6165 might suppress GC migration and invasion by targeting STRN4 in vitro, and the further research should focus more on the potential diagnosis and prognosis value of miR-6165 and STRN4 in gastric cancer patients.
Keywords: gastric cancer, miR-6165, STRN4, migration and invasion
Introduction
Gastric cancer (GC) is one of the most common malignant tumors worldwide.1,2 More than 410,000 new GC cases are diagnosed in China, ranking second among all the cancers.3 Although many strategies in the cancer treatment, including surgery, chemotherapy, and radiotherapy treatments, have been supplied in the cancer treatment, the effect is still very limited. Furthermore, the patients with invasion and metastasis have poorer prognosis.4,5 Therefore, it is crucial to explore the molecular mechanism underlying the progression of GC.
MicroRNAs (miRNAs) are a class of small, endogenous, noncoding RNAs, which involve in many biological processes by regulating the expression of target mRNA.6 Aberrant expression of miRNAs causes tumor-suppressing or promoting effects in various cancers including GC.7,8 MiR-6165 was reported to express in brain tumor-derived cell lines and tissues, and overexpressing miR-6165 in brain tumor-derived cell line induced the cancer cell apoptosis.9 Studies have shown that the same cancer-related miRNA could be involved in different cancers.10–12 However, little is known about the role of miR-6165 in GC.
Striatin-4 (STRN4) belongs to the WD repeat striatin family, and usually acts as scaffolding or signaling protein by binding calmodulin in a calcium-dependent manner.13 Striatin family proteins are also known to form a complex with protein phosphatases and protein kinases, which further regulates the signaling pathways involved in cell proliferation, differentiation, apoptosis, and transformation.14,15 It was reported that silencing of STRN4 suppresses proliferation, migration, invasion, and the anchorage-independent growth of several cancer cells.16
In this study, we first detected miR-6165 was significantly decreased in GC tissues and cell lines and then determined the role of miR-6165 in GC cells migration and invasion. Finally, we predicted and confirmed that STRN4 is the target of miR-6165. Our findings suggest that miR-6165 inhibits the migration, and invasion of GC cancer cells by targeting STRN4.
Materials and Methods
Tissue Specimens
GC tissues and paired nontumor tissues were collected from 15 GC patients who underwent surgery at Peking University People’s Hospital from 2016 to 2017. All the tissues were immediately snap frozen in liquid nitrogen and stored at −80°C until RNA extraction. This study was approved by the Research Ethics Committee of Peking University People’s Hospital. Informed consent was obtained from all of the patients in accordance with the Declaration of Helsinki.
Cell Lines
The human GC cell lines HEK-293T, HCG-27, and AGS were obtained from American Type Culture Collection (ATCC); SGC-7901, BGC-823, and the human gastric epithelial cell line GES-1 were purchased from the Chinese Academy of Sciences Cell Bank. These cell lines (HCG-27, AGS, SGC-7901, BGC-823 and GES-1) were routinely cultured in RPMI-1640 (Gibco, Invitrogen/Life Technologies, CA) supplemented with 10% fetal calf serum (Gibco, Invitrogen/Life Technologies, CA) while HEK-293T cells was cultured by DMEM (Gibco, Invitrogen/Life Technologies, CA) added with 8% fetal calf serum (Gibco, Invitrogen/Life Technologies, CA), even both the supplemented DMEM and RPMI-1640 additionally supplied penicillin (100 U/mL) and streptomycin (100 U/mL) at the meantime. All cell lines were cultured at 37°C with 5% CO2 and at saturated humidity.
Real-Time Quantitative Polymerase Chain Reaction
Real-time quantitative polymerase chain reaction (RT-qPCR) analysis Total RNA was extracted using the mir-Vana miRNA Isolation Kit (Ambion, Austin, TX, USA) or TRIzol reagent (Invitrogen, Carlsbad, CA, USA) according to the manufacturers’ instructions. The RNA was reverse transcribed into cDNA using the miScript Reverse Transcription Kit (QIAGEN, Dusseldorf, Germany). RT-qPCR was performed using the SYBR Green PCR Master Mix (Applied Biosystems, Foster City, CA, USA) on an ABI7500 real-time PCR system (Applied Biosystems). U6 was used as an endogenous control for normalization of miR-6165 levels. GAPDH was used as an endogenous control for normalization. The 2-ΔΔCt method was used for the relative quantification of gene expression. Primers for PCR used in this study are shown in Table 1.
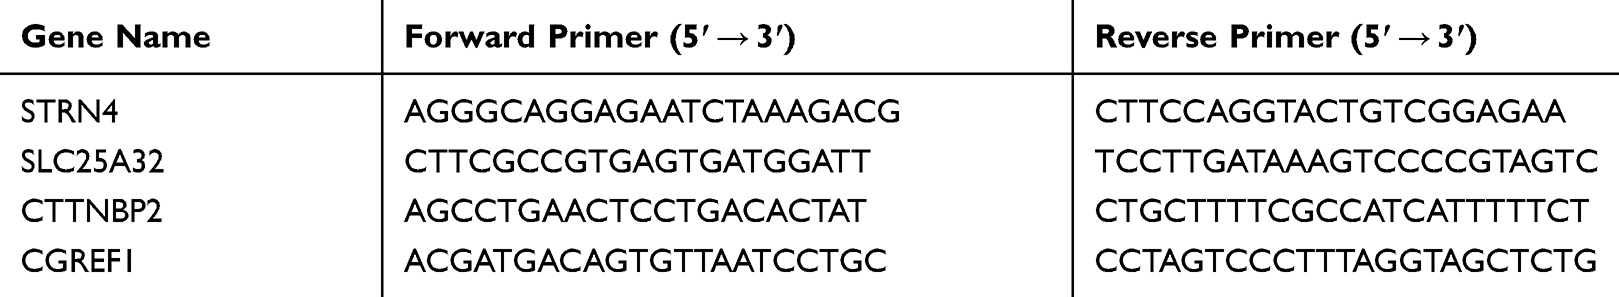 |
Table 1 Primers Used for PCR in This Study |
Cell Transfection
The miR-6165 mimics, mimic controls, miR-129-5p inhibitor, STRN4 siRNA were obtained from RiboBio (Guangzhou, China). AGS cells were plated in 12-well plate. After cells reached 40–60% confluence, transient transfection was performed using Lipofectamine 2000 (Invitrogen, Carlsbad, California, USA) according to the manufacturer’s instruction.
Luciferase Reporter Assay
3×10⁴ HEK-293T cells were seeded in 24-well plates in triplicate. Forty-eight hours after cotransfection with corresponding plasmids and microRNA precursors, luciferase reporter assays were conducted using Dual-luciferase reporter assay system (Promega, Madison, WI) according to the manufacturer’s instructions. Relative luciferase activity was normalized to the Renilla luciferase internal control.
Wound Healing Assay
At 48 hrs after transfection, AGS cells were put into the 6-well plates with a density of 6×10⁵ cells per well, and scratches were made vertical to the outer bottom lines with pipet tips. Then, the cells were washed, the detached cells and debris were removed, and serum-free medium was added to each well. Finally, the pictures were taken with an inverted phase contrast microscope. After taking pictures, the plates were incubated in a cell incubator at 37°C for another 24 hrs, and the second round of pictures was taken.
Transwell Assay
For the migration assay, 1×10⁴ cells taken 48 hrs after transfection were resuspended in 200 μL serum-free RPMI-1640 and added to the upper chamber of 24-well Transwell chambers. The lower chamber was filled with 500 μL RPMI-1640 containing 10% FBS. Cells were cultured for 24 hrs at 37°C. Then, the cells remaining on the upper surface of the Transwell insert were removed using cotton wool. Cells on the underside of the membrane were fixed and stained with crystal violet (Sigma). Five random microscopic fields per chamber were counted and the data were averaged. For the invasion assay, the chambers were pre-coated with Matrigel Basement Membrane Matrix (BD Bioscience, San Jose, CA, USA).
Evaluation of Immunohistochemical Staining
The immunohistochemical staining results were assessed by evaluating the mean score, which accounted for both the intensity of staining and the proportion of tumor cells with an unequivocal positive reaction. Each section was independently assessed by two pathologists who were blinded to the patient data. Positive reactions were defined as those showing brown signals in the cell cytoplasm. A staining index was determined by multiplying the staining intensity score by positive area score. The staining intensity was scored as follows: 0, negative; 1, weak; 2, moderate; and 3, strong. The proportion of positive cells was defined as follows: 0, less than 5%; 1, 6% to 25%; 2, 26% to 50%; 3, 51% to 75%; and 4, greater than 75%. Cases with a score among 0–6 were considered to exhibit low expression, and those with a score among 7–12 were regarded to exhibit high expression.
Statistical Analysis
All the data presented are the mean ± SD. We used two-tailed Student’s t-tests to make comparisons between two different groups. One-way ANOVA was done for analyses of continuous data. A P-value less than 0.05 was considered statistically significant. All statistical analyses were performed using SPSS software version 20.0 (SPSS, Chicago, Illinois, USA). GraphPad Prism 6 software (GraphPad Software Inc., San Diego, Calif.) was used for plotting.
TCGA data were analyzed with R-3.3.2. Significantly differentially expressed microRNAs and mRNAs were selected according to the absolute value of log2 fold change (Log2FC) ≤1 0.5 and the adjusted p-value < 0.05.
Results
Expression Profiling of miRNA and mRNA in GC Tissues
Four paired of GC and normal tissues were used to profile the expression of miRNA and mRNA applying miRNA microarray (Human miRNA Microarray, Release 21.0, 8x60K, Agilent) and mRNA microarray (mRNA Human Gene Expression Microarray V4.0, 4x180K, CapitalBio) respectively (Figure 1A, B and Supplemental material 1, 2). Five hundred and eighty miRNAs and 30,245 coding transcripts (from 21,901 genes) were collected from authoritative databases such as EMBL, GenBank, miRBase, TargetScan, and miRanda. To explore valuable potential biomarkers, a more stringent strategy (fold change > 1.5, P < 0.05)17 was executed to filtrate these microarray data.
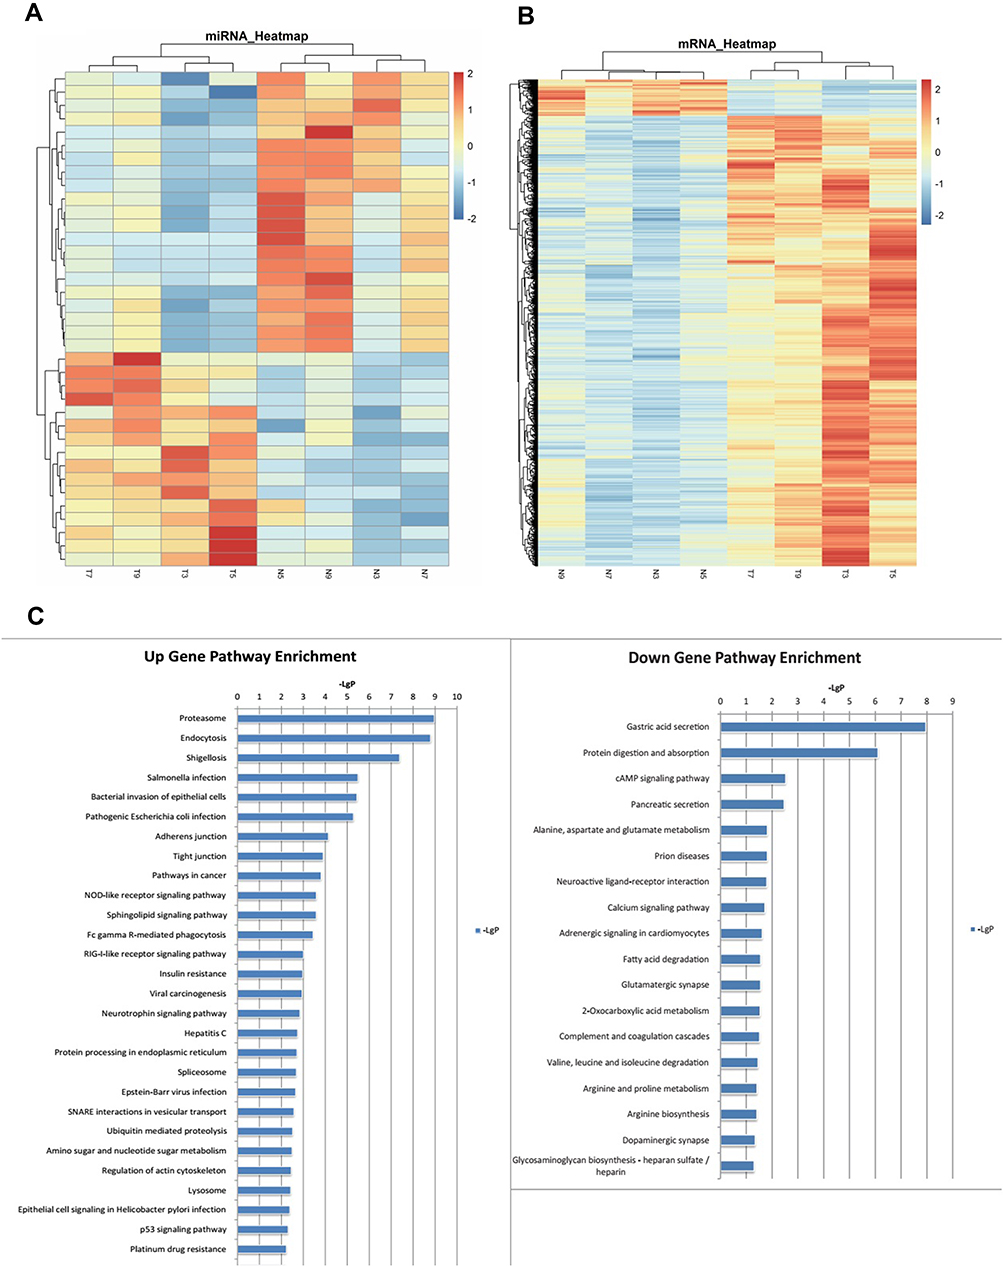 |
Figure 1 Expression profiling of miRNA and mRNA in GC tissues. (A) Heat map of differentially expressed miRNAs; (B) Heat map of differentially expressed miRNAs; (C) Differentially expressed mRNAs were analyzed by pathway enrichment. Notes: Red indicates high relative expression and blue indicates low relative expression. The expression of miRNAs (A) and mRNAs (B) were hierarchically clustered on the y-axis, and the tissue samples are hierarchically clustered on the x-axis (Fold change ≥ 1.5, p < 0.05). Expression levels are presented in red and blue, indicating upregulated and downregulated RNAs, respectively. Numbers marked with T and N are from four paired GC and paired normal tissues, respectively (T means GC tissues and N means normal tissues). |
We identified 38 miRNAs and 3601 mRNAs differentially expressed in GC tissues versus paired normal tissues. Among them, 16 miRNAs and 3332 mRNAs were upregulated, while 22 miRNAs and 269 mRNAs were downregulated in GC tissues. The differentially expressed mRNAs were analyzed by pathway enrichment, and we found many pathways were directly or indirectly associated with the cancer progress (Figure 1C and Supplemental material 3).
Coexpression Network to Predict Critical miRNA and Target mRNA in GC Tissues
We selected the 38 differentially expressed miRNAs to be subsequent research objects, and predict their target mRNA using the database. The TargetScan and miRanda databases predicted 246480 and 9391 target mRNAs, respectively (containing repetitive individuals), and the intersection was 9250 mRNAs (Figure 2A and Supplemental material 4). Then, we took the intersected of database predicted target mRNA and the detected differentially expressed mRNAs from microarrays, and got 1871 mRNAs (Figure 2B).
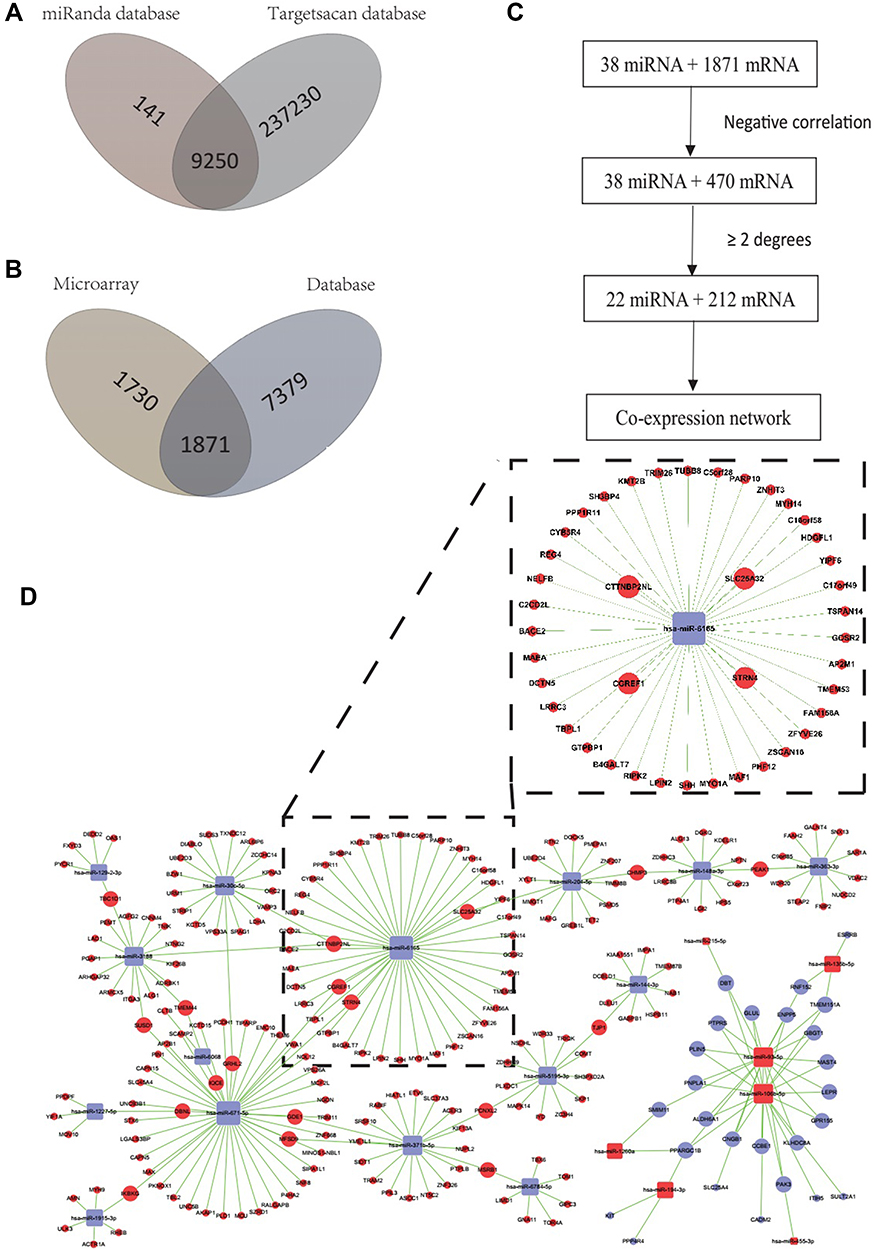 |
Figure 2 Co-expression network to predict critical miRNA and target mRNA in GC tissues. (A) Predicted target mRNAs from TargetScan and miRanda databases; (B) Intersected of database predicted target mRNA and the detected differentially expressed mRNAs from microarrays; (C) The prcess of Screening critical miRNAs and mRNAs; (D) Co-expression network of critical miRNAs and mRNAs.Notes: Round nodes represent mRNAs, and square nodes represent miRNAs. Blue indicates downregulated, and red indicates upregulated. The number of connections among miRNA and mRNA, also named “degree”, only the miRNA and mRNA having at least two degrees were corralled into the network analysis. |
According to the negative correlation between miRNA and mRNA, 470 mRNA were left. Then, we analyzed the number of connections among miRNA and mRNA, also named “degree”, only the miRNA and mRNA having at least two degrees were corralled into the network analysis.18,19 At last 22 miRNAs and 212 mRNAs were brought into the co-expression network (Figure 2C and Supplemental material 5).
In co-expression networks, each miRNA or mRNA corresponds to a node, and the connected string indicates a potential regulatory relationship between them (Figure 2D). The co-expression network showed that one miRNA or mRNA might correlate with one to dozens of mRNAs or miRNAs, and the more number of connections, also named “degree”, suggested more activities in which the miRNA or mRNA might attend. MiR-6165 is one of the most degreed miRNA (degree=49), and STRN4 is one of the “largest” target among its regulated mRNA, which means STRN4 mRNA has a high level differentially expressed (Log2FC=2.286, p<0.05) in GC.
Relative Expression and Co-Expression Relationship of miR-6165 and Target STRN4 mRNA in Tissues
To confirm the analysis result, we examined the expressing changes of top four mRNA predicted in bioinformatics after adding miR-6165 mimics and found the STRN4 was most significantly downregulated (Figure 3A). The expressions of miR-6165 and STRN4 mRNA in GC and normal tissues from original microarray data were consistent in either individual patient or average level (20.51±8.39 vs 97.77±45.62, p < 0.05; 2556.55±846.00 vs 1118.54±2.36, p=244.00) (Figure 3B). Then, we examined their expression in other 15 pairs of GC and normal tissues by RT-qPCR, and found that miR-6165 was significantly downregulated in GC tissues (0.37±0.04 vs 0.72±0.05, p<0.05), while STRN4 upregulated (0.71±0.05 vs 0.48±0.05, p<0.05) (Figure 3C). We found a consisted result from an experiment in 449 samples from TCGA database (p<0.05) (Figure 3D). Furthermore, we observed a significantly negative correlation among the expression of miR-6165 and STRN4 mRNA in GC tissues (Spearman correlation, r=−1.037, p < 0.05) (Figure 3E).
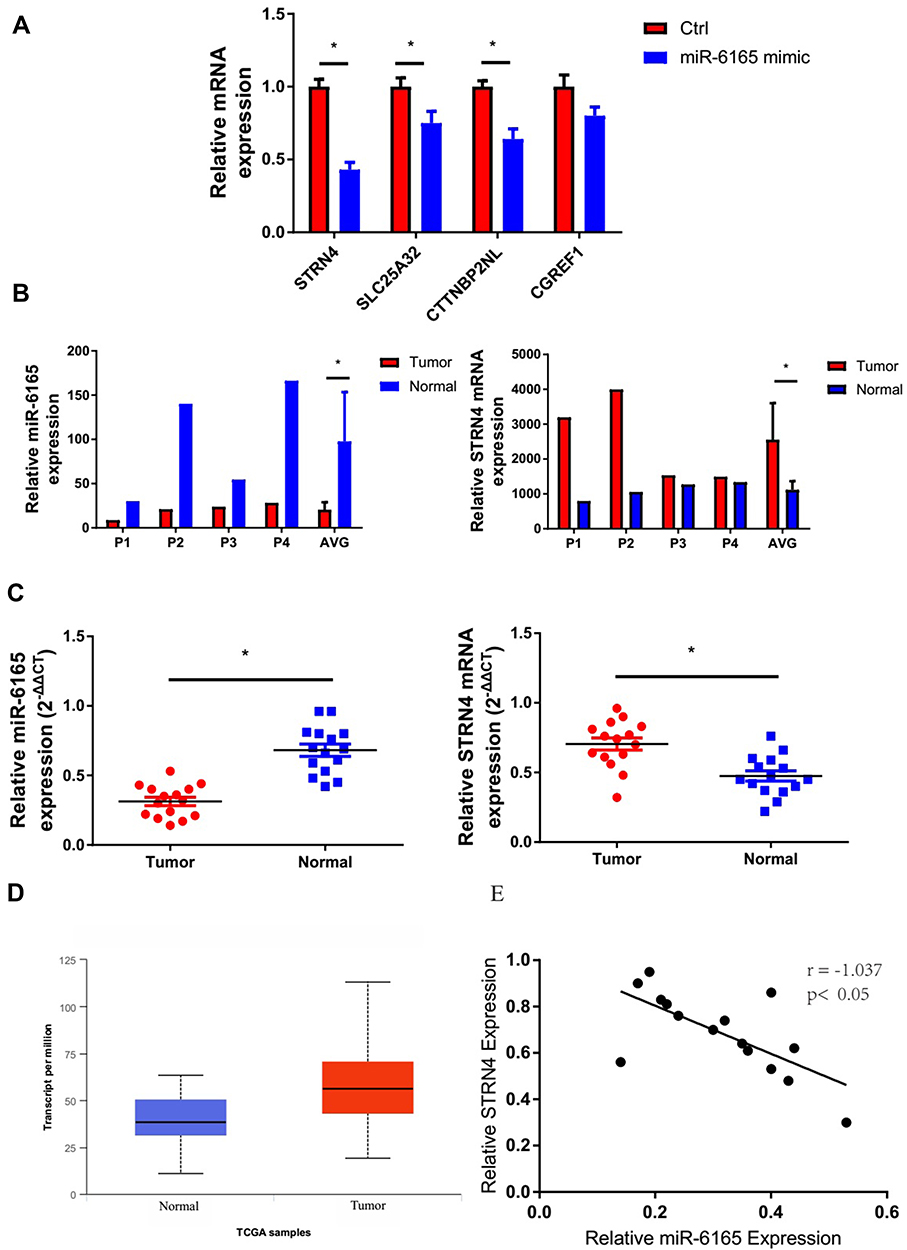 |
Figure 3 Relative expression and co-expression relationship of miR-6165 and target STRN4 mRNA in tissues. (A) Expressing changes of top four mRNA predicted in bioinformatics after adding miR-6165 mimics and STRN4 was most significantly downregulated; (B) Expression of miR-6165 and STRN4 mRNA in GC and normal tissues from original microarray data; (C) Expression of miR-6165 and STRN4 mRNA in GC and normal tissues from 15 paired of samples; (D) Experiment of STRN4 mRNA in 449 samples from TCGA database; (E) Correlation among the expression of miR-6165 and STRN4 mRNA in GC tissues (Spearman correlation, r=−1.037, p < 0.05). Notes: *Means statistically significant difference (p<0.05), and P1, P2, P3, P4 represent the patient numbers and AVG mean Average expression. |
MiR-6165 Suppressed GC Cells Migration and Invasion by Targeting STRN4 in vitro
We predicted the binding region of miR-6165 and STRN4 mRNA using database (Figure 4A and Supplemental material 6) and performed a luciferase reporter assay using miRNA-6165 precursors. Each miRNA precursor was co-transfected with the luciferase reporters into HEK-293T cells. Compared with the control RNA, miR-6165a and miR-6165b reduced the luciferase reporter activity by at least 40%. Next, we mutated the miRNA target site and found that the transfection with miRNA-6165 precursors had no significant effect on luciferase activity when the corresponding target site was mutated from the luciferase reporter (Figure 4A). These results suggested that miR-6165 and STRN4 mRNA bind together in this target site.
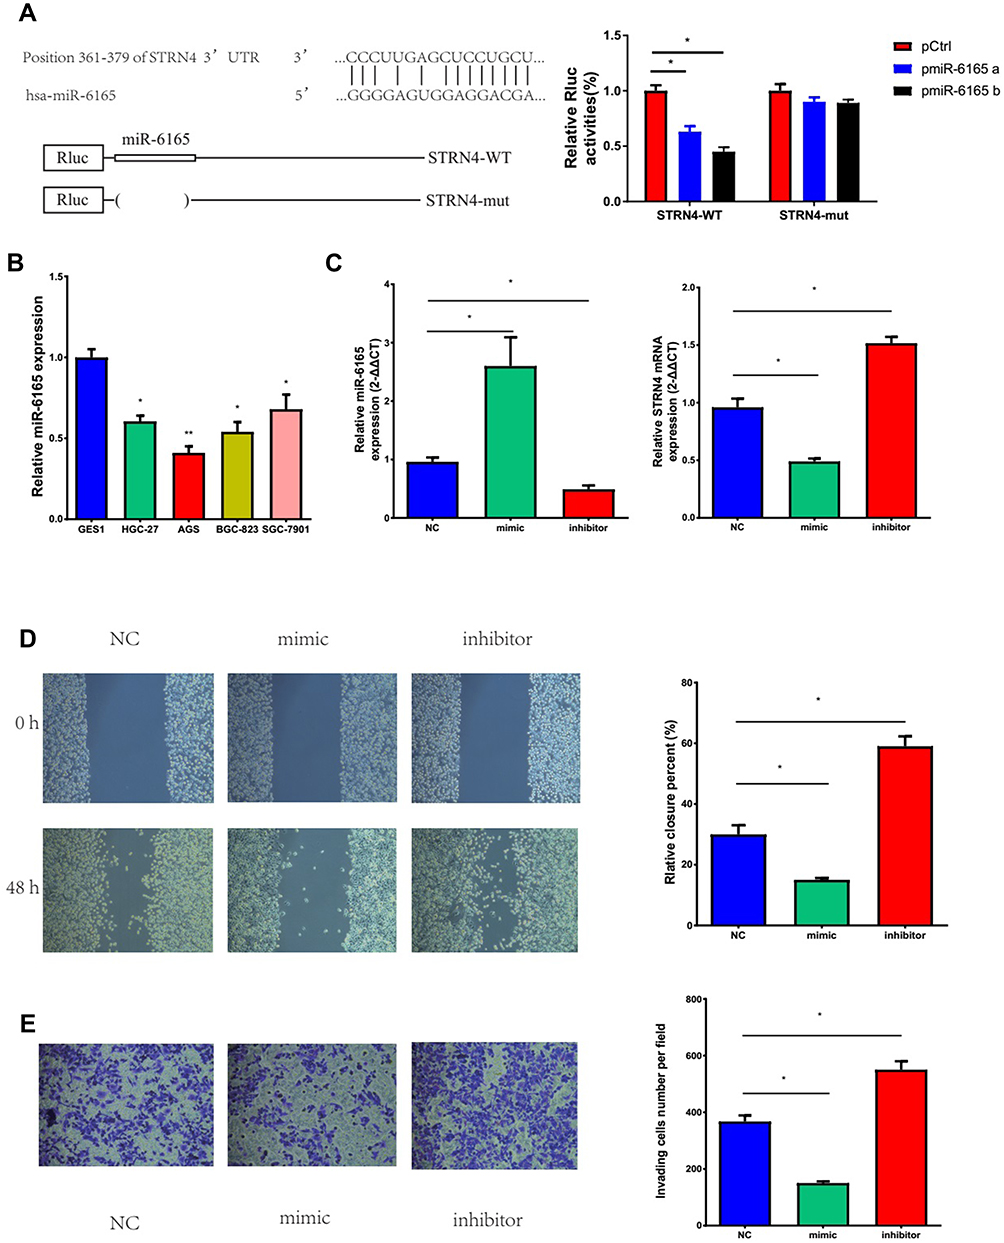 |
Figure 4 MiR-6165 suppressed GC cells migration and invasion by targeting STRN4 in vitro. (A) Results of bioinformatics predicted and luciferase reporter assay; (B) Expression quantities of miR-6165 in different GC cell lines (SGC-7901, HCG-27, AGS, and BGC-823) and normal gastric cell (GES); (C) Expressions of miR-6165 and STRN4 mRNA among three groups: mimic control (NC), miR-6165 mimics (mimics), and miR-6165 inhibitor (inhibitor); (D) Results of wound healing assay; (E) Results of transwell assay. Note: *Means statistically significant difference (p<0.05). |
We measured the expression quantities of miR-6165 in different GC cell lines (SGC-7901, HCG-27, AGS, and BGC-823) and normal gastric cell (GES) using RT-qPCR method. Compared with GES, the expression level of miR-6165 in all kinds of GC cells turned out to be significantly lower (p<0.05). Considering that AGS had the lowest expression level, this cell line was chosen for further investigations (Figure 4B).
The AGS cells were distributed among three groups: mimic control (NC), miR-6165 mimics (mimics), and miR-6165 inhibitor (inhibitor). We examined the expression of miR-6165 and STRN4 using RT-qPCR method, it showed that miR-6165 mimics or inhibitor were successfully transfected in AGS cells (p<0.05). We also found that the expression of STRN4 showed corresponding changes in different groups: when silencing miR-6165, STRN4 expression was upregulated (1.00±0.06 vs 1.52±0.05, p<0.05), while overexpressing miR-6165, the expression was downregulated (1.00±0.06 vs 0.47±0.05, p<0.05) (Figure 4C).
The cell wound healing assay and transwell assay were used to measure cell migrate and invasive ability. We detected wound healing ability was enhanced in the miR-6165 inhibitor group (0.31±0.04 vs 0.57±0.05, p<0.05), and the ability was depressed in the miR-6165 mimic group (0.31±0.04 vs 0.16±0.02, p<0.05) (Figure 4D). And similar trends were observed in the experiment of transwell assay: overexpression of miR-6165 inhibited the migration and invasion abilities of AGS cells (370.50±13.25 vs 158.50±6.50, p<0.05), while the downregulation of miR-6165 notably increased the invading cell percent (370.90±13.25 vs 537.50±22.50, p<0.05) (Figure 4E).
STRN4 Protein Showed a Higher Expression in GC Tissues
We examined STRN4 protein expression in tissue arrays containing 30 pairs of GC and normal tissues, and different expression was detected in GC and normal tissues (Figure 5). We next calculated the numerical value of immunohistochemical (IHC) staining for each tissue considering both the intensity of staining and the proportion of tumor cells with an unequivocal positive reaction. Through analyzing the quantitative value of expression, we found that a higher expression of STRN4 protein presented in GC tissues (73.33% vs 20.00%, p<0.05) (Figure 5B).
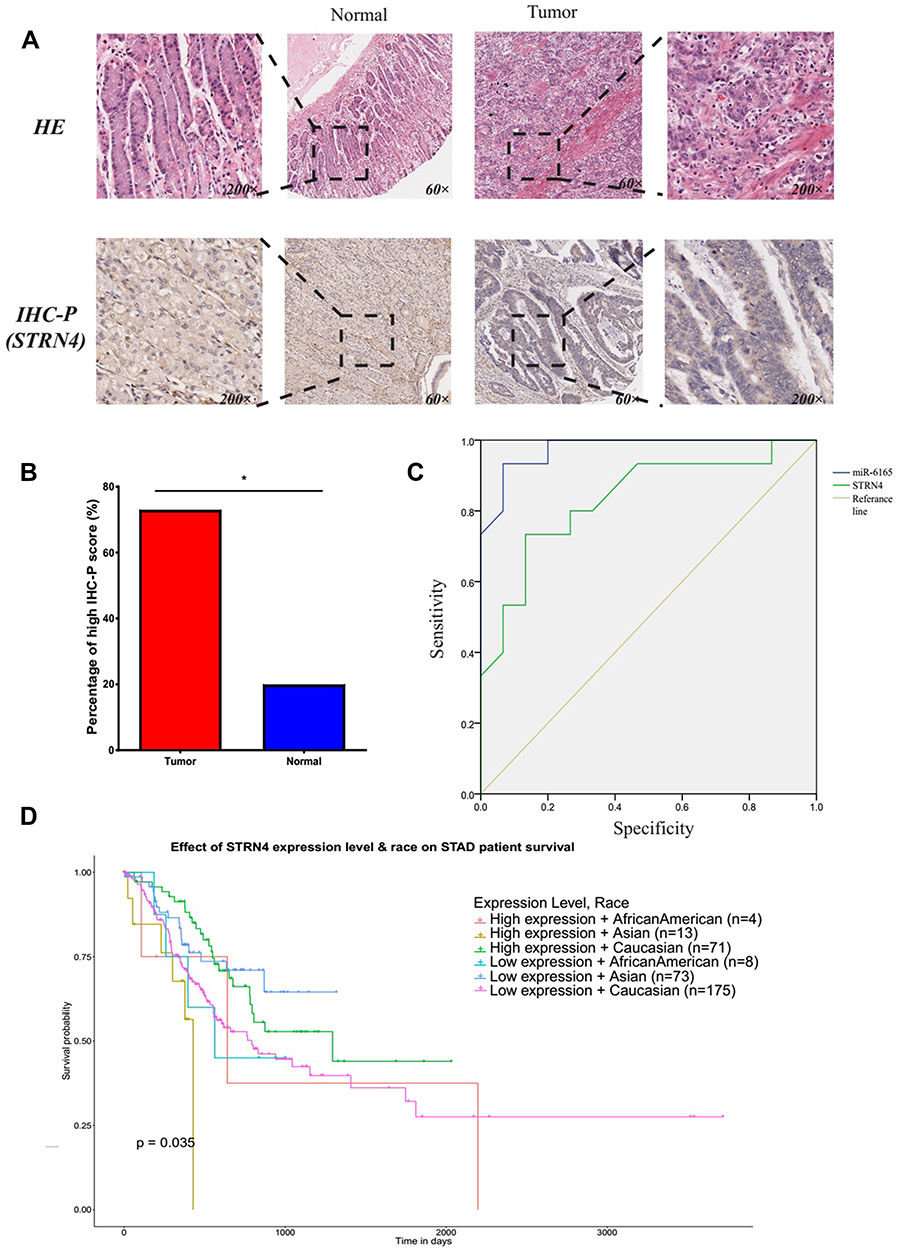 |
Figure 5 Expression of STRN4 protein in GC and normal tissues by Immunohistochemical staining. (A) STRN4 protein expression in tissue arrays using HE (p﹥0.05); (B) A higher expression of STRN4 protein presented in GC tissues; (C) The AUC (area under the curve) of miR-6165 and STRN4 mRNA. (p < 0.05); (D) GC patients with high expression of STRN4 had a poorer survival probability from a survey of TCGA database among different races (p <0.05). Notes: *Means statistically significant difference (p<0.05); HE represents hematoxylin-eosin staining. |
The Diagnosis and Prognosis Value of miR-6165 and STRN4 mRNA
We further evaluated the diagnostic value of these miR-6165 and STRN4 mRNA for GC by plotting a receiver operating characteristic curve (Figure 5C). The area under the curve (AUC) of miR-6165 and STRN4 mRNA were 0.976 (95% CI: 0.932–1.000) and 0.833 (95% CI: 0.684–0.982), respectively, which meant both of them had the potential to be the detecting marker for GC diagnosis.
A survey of TCGA database showed that GC patients with high expression of STRN4 had a poorer survival probability among different races (p<0.05) (Figure 5D), which suggested STRN4 expression might have great potential to be a prognostic indicator.
Discussion and Conclusion
In recent years, the role of miRNAs in GC has attracted much attention due to their critical role in tumor progression. In the year of 2012, Parsi et al9 firstly reported Hsa-mir-6165 [EBI accession#: FR873488], the existence of a conserved putative microRNA, and ultimately managed to detect the endogenous expression of miR-6165 in several glioma cell lines. As known, it is acknowledged that glioma primary tumors trend to express NGFR which might be explained indirectly by co-transcription of miR-6165 in these cells. Moreover, these authors also concluded that overexpressing miR-6165 in brain tumor-derived cell line (U87) would induce the cancer cell apoptosis and coordinated with significantly down-regulated predicted target genes, including Pkd1 and DAGLA; Furthermore, Hassanlou et al20 validated that miR-6165 affected the cell cycle progression and could increase apoptosis in different human cell lines which included HeLa, HCT116, SW480, and HEK293T cell lines. In this study, we first identified miR-6165 as a novel cancer-related miRNA in GC through high-throughput microarray sequencing. By bioinformatics analysis and luciferase reporter assay, we found STRN4 was the target of miR-6165. Via a series of cell experiments, we determined that miR-6165 suppressed GC cells migration and invasion by targeting STRN4. Moreover, we found the potential diagnosis and prognosis value of miR-6165 and STRN4 mRNA.
MiRNAs play various roles in biological processes, including cell proliferation, metastasis, differentiation, development, and apoptosis.21,22 Among them, several miRNA were reported to be related with cell invasion and metastasis. For example, Ueda et al23 found miRNA-214 could enhance GC progress through hedgehog signaling, and Liao et al24 showed that miRNA-196b promoted GC cells migration and invasion by increased vimentin, MMP-2, and MMP-9. Our study identified a new miRNA associated with GC, and with the in-deep study, such cancer-related miRNAs might contribute to reveal the ultimate problem of cancer treatment.
STRN4 was reported to directly associate with TNIK and MAP4K4.25 Yu et al26 showed TNIK gene amplification played an essential role of in gastric cancer growth, and Liu et al27 found that silencing of MAP4K4 could suppress proliferation, induces G1 cell cycle arrest and induces apoptosis in gastric cancer cells. Therefore, STRN4 might attend multiple signaling pathways in GC process. Further study needs to clarify the definitive answer.
However, this conclusion is obviously based upon some limitations. Firstly, there was the lack of the experiment on miR-6165 and STRN4 mRNA in GC cells in vivo; and secondly, we conducted miR-6165 suppressed GC cells migration and invasion by targeting STRN4 in vitro, as we acknowledged, these experimental methods such as the cell wound healing assay and transwell assay is less accurate to evaluate GC cell migrate and invasive ability, when compared with the genes and related proteins; Thirdly, since only 15 pairs of GC tissues and adjacent normal gastric tissues were used to confirm the expression profile of miR-6165 and STRN4 and to generate the ROC curves, the number of samples was too small to get the potential conclusions and it is also necessary to expand the samples to use for further confirmation.
Ultimately, we concluded that miR-6165 might suppress GC cells migration and invasion by targeting STRN4 in vitro, and the potential diagnosis and prognosis value of miR-6165 and STRN4 mRNA in GC cells should be concentrated on in future.
Acknowledgments
This study was supported by grants from the National Natural Science Foundation of China (81372291). Kewei Jiang and Shan Wang have equal last authorship.
Disclosure
There are no conflicts of interest for the authors to report in this work.
References
1. Hohenberger P, Gretschel S. Gastric cancer. Lancet. 2003;304:305–315. doi:10.1016/S0140-6736(03)13975-X
2. Bray F, Ferlay J, Soerjomataram I, et al. Global cancer statistics 2018: GLOBOCAN estimates of incidence and mortality worldwide for 36 cancers in 185 countries. CA Cancer J Clin. 2018;68:394–424. doi:10.3322/caac.21492
3. Chen W, Sun K, Zheng R, et al. Cancer incidence and mortality in China, 2014. Chin J Cancer Res. 2018;30:1–12. doi:10.21147/j.issn.1000-9604.2018.01.01
4. Orditura M, Galizia G, Sforza V, et al. Treatment of gastric cancer. Acta Unio Int Contra Cancrum. 2014;355:729–735.
5. Mikami J, Kimura Y, Makari Y, et al. Clinical outcomes and prognostic factors for gastric cancer patients with bone metastasis. World J Surg Oncol. 2017;15:8. doi:10.1186/s12957-016-1091-2
6. Garzon R, Calin GA, Croce CM. MicroRNAs in Cancer. Annu Rev Med. 2009;60:167–179. doi:10.1146/annurev.med.59.053006.104707
7. Ge X, Liu X, Lin F, et al. MicroRNA-421 regulated by HIF-1α promotes metastasis, inhibits apoptosis, and induces cisplatin resistance by targeting E-cadherin and caspase-3 in gastric cancer. Oncotarget. 2016;7:24466–24482. doi:10.18632/oncotarget.8228
8. Han C, Zhou Y, An Q, et al. MicroRNA-1 (miR-1) inhibits gastric cancer cell proliferation and migration by targeting MET. Tumour Biol. 2015;36:6715–6723. doi:10.1007/s13277-015-3358-6
9. Parsi S, Soltani BM, Hosseini E, et al. Experimental verification of a predicted intronic microRNA in human NGFR gene with a potential pro-apoptotic function. PLoS One. 2012;7:e35561. doi:10.1371/journal.pone.0035561
10. Huang N, Lin J, Jian R, et al. MiR-219-5p inhibits hepatocellular carcinoma cell proliferation by targeting glypican-3. FEBS Lett. 2012;586:884–891. doi:10.1016/j.febslet.2012.02.017
11. Ji C, Rui D, Peng Z, et al. miR-219-5p plays a tumor suppressive role in colon cancer by targeting oncogene Sall4. Oncol Rep. 2015;34:1923. doi:10.3892/or.2015.4168
12. Jiang Y, Yin L, Jing H, Zhang H. MicroRNA-219-5p exerts tumor suppressor function by targeting ROBO1 in glioblastoma. Tumor Biol. 2015;36:1–9. doi:10.1007/s13277-015-3651-4
13. Castets F, Rakitina T, Gaillard S, et al. Zinedin, SG2NA, and striatin are calmodulin-binding, WD repeat proteins principally expressed in the brain. J Biol Chem. 2000;275:19970–19977. doi:10.1074/jbc.M909782199
14. Janssens V, Goris J. Protein phosphatase 2A: a highly regulated family of serine/threonine phosphatases implicated in cell growth and signalling. Biochem J. 2001;353:417. doi:10.1042/bj3530417
15. Hoof CV, Goris J. Phosphatases in apoptosis: to be or not to be, PP2A is in the heart of the question. Biochim Biophys Acta. 2003;1640:97–104. doi:10.1016/S0167-4889(03)00029-6
16. Meihong W, Toshinori H, Eri A, et al. Silencing of STRN4 suppresses the malignant characteristics of cancer cells. Cancer Sci. 2015;105:1526–1532.
17. Sun TT, He J, Liang Q, et al. A novel lncRNA GClnc1 promotes gastric carcinogenesis and may act as a modular scaffold of WDR5 and KAT2A complexes to specify the histone modification pattern. Cancer Discov. 2016;6:784. doi:10.1158/2159-8290.CD-15-0921
18. Prieto C, Risueño A, Fontanillo C, De Las Rivas J. Human gene coexpression landscape: confident network derived from tissue transcriptomic profiles. PLoS One. 2008;3:e3911. doi:10.1371/journal.pone.0003911
19. Hohmann S. UNICELLSYS - Understanding the cell’s functional organization. J Biotechnol. 2010;150:545. doi:10.1016/j.jbiotec.2010.09.902
20. Hassanlou M, Soltani BM, Mowla SJ. Expression and function of hsa-miR-6165 in human cell lines and during the NT2 cell neural differentiation process. J Mol Neurosci. 2017;63:254–266. doi:10.1007/s12031-017-0954-5
21. Lin H, Hannon GJ. MicroRNAs: small RNAs with a big role in gene regulation. Na Rev Gen. 2004;5:522–531.
22. Bushati N, Cohen SM. microRNA functions. Annu Rev Cell Dev Biol. 2007;23:175. doi:10.1146/annurev.cellbio.23.090506.123406
23. Ueda T, Volinia S, Okumura H, et al. Relation between microRNA expression and progression and prognosis of gastric cancer: a microRNA expression analysis. Lancet Oncol. 2010;11:136–146. doi:10.1016/S1470-2045(09)70343-2
24. Liao YL, Hu LY, Tsai KW, et al. Transcriptional regulation of miR-196b by ETS2 in gastric cancer cells. Carcinogenesis. 2012;33:760–769. doi:10.1093/carcin/bgs023
25. Toshinori H, Satoko I, Hitoki H, et al. Misshapen-like kinase 1 (MINK1) is a novel component of striatin-interacting phosphatase and kinase (STRIPAK) and is required for the completion of cytokinesis. J Biol Chem. 2012;287:25019. doi:10.1074/jbc.M112.372342
26. Yu D, Zhang X, Wang H, et al. The essential role of TNIK gene amplification in gastric cancer growth. Oncogenesis. 2014;3:e89. doi:10.1038/oncsis.2014.2
27. Liu YF, Guo-Qiang QU, Yun-Min LU, et al. Silencing of MAP4K4 by short hairpin RNA suppresses proliferation, induces G1 cell cycle arrest and induces apoptosis in gastric cancer cells. Mol Med Rep. 2016;13:41–48. doi:10.3892/mmr.2015.4510
 © 2020 The Author(s). This work is published and licensed by Dove Medical Press Limited. The full terms of this license are available at https://www.dovepress.com/terms.php and incorporate the Creative Commons Attribution - Non Commercial (unported, v3.0) License.
By accessing the work you hereby accept the Terms. Non-commercial uses of the work are permitted without any further permission from Dove Medical Press Limited, provided the work is properly attributed. For permission for commercial use of this work, please see paragraphs 4.2 and 5 of our Terms.
© 2020 The Author(s). This work is published and licensed by Dove Medical Press Limited. The full terms of this license are available at https://www.dovepress.com/terms.php and incorporate the Creative Commons Attribution - Non Commercial (unported, v3.0) License.
By accessing the work you hereby accept the Terms. Non-commercial uses of the work are permitted without any further permission from Dove Medical Press Limited, provided the work is properly attributed. For permission for commercial use of this work, please see paragraphs 4.2 and 5 of our Terms.