")
Back to Journals » Cancer Management and Research » Volume 12
microRNA-519d Induces Autophagy and Apoptosis of Human Hepatocellular Carcinoma Cells Through Activation of the AMPK Signaling Pathway via Rab10
Authors Zhang YJ, Pan Q, Yu Y, Zhong XP
Received 4 March 2019
Accepted for publication 9 December 2019
Published 15 April 2020 Volume 2020:12 Pages 2589—2602
DOI https://doi.org/10.2147/CMAR.S207548
Checked for plagiarism Yes
Review by Single anonymous peer review
Peer reviewer comments 3
Editor who approved publication: Dr Ahmet Emre Eşkazan
Yi-Jie Zhang,1,2 Qi Pan,1,2 Yang Yu,1,2 Xin-Ping Zhong1,2
1Department of Hepatobiliary and Organ Transplantation, The First Affiliated Hospital of China Medical University, Shenyang 110001, People’s Republic of China; 2The Key Laboratory of Organ Transplantation of Liaoning Province, The First Affiliated Hospital of China Medical University, Shenyang 110001, People’s Republic of China
Correspondence: Xin-Ping Zhong
Department of Hepatobiliary and Organ Transplantation, The First Affiliated Hospital of China Medical University, No. 155, Nanjing North Street, Heping District, Shenyang 110001, Liaoning Province, People’s Republic of China
Tel +86-13309831481
Email [email protected]
Background and Aim: Hepatocellular carcinoma (HCC) is a type of cancer with high mortality rates. The overexpression of microRNA-519d (miR-519d) has been explored in different types of cancers, which could significantly help suppress cancer development. This study aimed to investigate the interaction of miR-519d with its target gene, Rab10, as well as its effects on cell proliferation and autophagy in HCC cells through modulation of the AMPK signaling pathway.
Methods: Microarray analysis was used to analyze the differentially expressed genes in HCC, and the target genes of the screened-out miRNA were predicted and verified. The expression of miR-519d and Rab10, AMPK signaling pathway-related proteins, apoptosis- and autophagy-related proteins was determined by RT-qPCR and Western blot analysis in HCC tissues and cell lines. Lastly, the effects of miR-519d and Rab10 in HCC cell proliferation, apoptosis, and mouse tumour xenograft in vivo were examined through gain- and loss-of-function experiments.
Results: MiR-519d was down-regulated and Rab10 was upregulated in HCC tissues and cell lines. Overexpression of miR-519d decreased the expression of Rab10, mTOR, and Bcl-2, but increased the expression of Bax, Beclin1, Atg5, and p53. Upregulated miR-519d and downregulated Rab10 expression suppressed cell proliferation and induced cell apoptosis and autophagy in HCC cells. Finally, upregulation of miR-519d inhibited tumour growth in vivo.
Conclusion: The result obtained in this study indicates that up-regulation of miR-519d inhibits proliferation and promotes apoptosis and autophagy of HCC cells through activation of the AMPK signaling pathway via downregulating Rab10, which provides a potential target for the treatment of HCC.
Keywords: microRNA-519, Rab10, Adenosine 5ʹ-monophosphate-activated protein signaling pathway, hepatocellular carcinoma, proliferation, autophagy
Introduction
As one of the most common types of cancer worldwide, hepatocellular carcinoma (HCC) accounts for about 5.6% of all cancers with a high mortality rate.1 HCC can be triggered by aberrant proto-oncogene activation and inactivation of tumor suppressor genes in liver cells and some signaling pathways that were abnormally regulated can also promote hepatocarcinogenesis.2 Few symptoms reveal in early stage of HCC, and most cases of advanced-stage HCC showed the implication of the hepatitis C virus and hepatitis B virus infection in hepatocarcinogenesis, which results in a poor prognosis and low survival rates.3,4 Currently, surgery, tyrosine kinase inhibitor and image-guided tumor ablation are treatment options for HCC patients with poor prognosis.5,6 Therefore, it is urgent to find new therapeutic targets to develop more effective treatments for HCC patients.
MicroRNAs (miRNAs) in human cancers usually show aberrant expression in tumor tissues and tight correlations with tumour, for example, miR-126 was downregulated in alcohol-related HCC.7–9 MiR-519d was also studied in various types of cancers, and its overexpression has been found to significantly suppress the development of breast and nasopharyngeal cancers.10,11 Furthermore, miR-519d expression has been reported to be up-regulated in HCC via p53 and DNA hypomethylation.12 Also, miR-519d was predicted to bind the 3ʹ-untranslated region (UTR) of the Ras-related protein 10 in brain (Rab10) by the microRNA.org website. Rab proteins are members of the small guanosine triphosphatases (GTPases), involved in controlling vesicle budding, motility, uncoating, and fusion by recruiting effector proteins.13,14 The Rab proteins also play a particularly important role in tumor cell proliferation and invasion; for example, their down-regulation has been found to suppress osteosarcoma cell proliferation.15,16 Interestingly, in skeletal muscle, the Rab GTPase-activating protein TBC1D1 is phosphorylated by adenosine monophosphate-activated protein (AMP)-activated protein kinase (AMPK) in response to insulin and muscle contraction.17 The AMPK signaling pathway serves as an energy sensor that regulates organismal and cellular metabolism, including lipid metabolism.18 Additionally, the AMPK signaling pathway has been reported to be down-regulated in both tumor cells and viruses which results in a reduced cell capacity to restrain tumor and virus growth.19 Moreover, a previous study revealed that the AMPK signaling pathway was blocked in HCC.20 AMPK silencing has been found to prevent apoptosis upon N6-isopentenyladenosine treatment, while basal autophagosome turnover is repressed as a result of unprenylated Rab7.21 Based on the previously-mentioned literature, we hypothesized that miR-519d was involved in HCC via the AMPK signaling pathway by controlling Rab10. Therefore, this study aimed to investigate the effects of miR-519d on HCC cell proliferation, apoptosis, and autophagy through modulation of the AMPK signaling pathway by binding to Rab10.
Materials and Methods
Ethics Statement
This study was approved by the Ethics Committee of the First Affiliated Hospital of China Medical University. This study was conducted in accordance with the Declaration of Helsinki and written informed consents were obtained from all patients. All animal care and use protocols in this study were carried out following the Regulations for the Administration of Affairs Concerning Experimental Animals permitted by the State Council of People’s Republic of China. All animal experiments were approved by the Animal Ethical and Experimental Committee of the First Affiliated Hospital of China Medical University. All efforts were made to minimize the suffering of animals.
Microarray Analysis
The Gene Expression Omnibus (GEO, https://www.ncbi.nlm.nih.gov/geo/) database was used to obtain HCC-related gene expression from microarray dataset GSE49515.22 The microarray consisted of 10 peripheral blood mononuclear cell samples from healthy individuals and patients with HCC. The limma package available for the R programming language was used to perform differential analysis, with a |log FoldChange| > 2 and p value < 0.05 set as threshold to identify differentially expressed genes (DEGs). Moreover, the pheatmap package was used to construct a heatmap of DEGs. ClueGO is a Cytoscape plug-in that visualizes the non-redundant biological terms for large clusters of genes in a functionally grouped network. With the application of the plug-in, Kyoto Encyclopedia of Genes and Genomes (KEGG) functional analysis was carried out on the DEGs identified from the HCC microarray data. UALCAN (http://ualcan.path.uab.edu/index.html), a user-friendly and interactive web resource for analyzing cancer transcriptome data, was used to analyse Rab10 gene expression in HCC and normal samples from The Cancer Genome Atlas (TCGA). Then, the miRDB (http://mirdb.org/miRDB/index.html), mirDIP (http://ophid.utoronto.ca/mirDIP/index.jsp#r), miRNApath (http://lgmb.fmrp.usp.br/mirnapath/tools.php), TargetScan (http://www.targetscan.org/vert_71/) and DIANA databases (http://diana.imis.athena-innovation.gr/DianaTools/index.php?r=microT_CDS/index) were used to predict regulative miRNAs of Rab10. The intersection of the top 100 miRNAs in the predicted results was obtained. If the number was less than 100, then all predicted results were included.
Study Subjects
HCC and paracancerous tissues were collected from 76 patients diagnosed with HCC in the Department of Pathology in the First Affiliated Hospital of China Medical University. The patients included 55 males and 21 females. The ages of the patients ranged from 18 to 72 years, with a mean age of 48 years. Among the patients with HCC, there were 69 patients positive to the hepatitis B surface antigen (HBsAg) and 7 patients negative to the HBsAg. Twenty-eight patients were classified as well-differentiated HCC, 31 patients as moderately differentiated HCC, and 17 patients as poorly differentiated HCC, according to Sugihara’s classification of HCC.23 (Table 1)
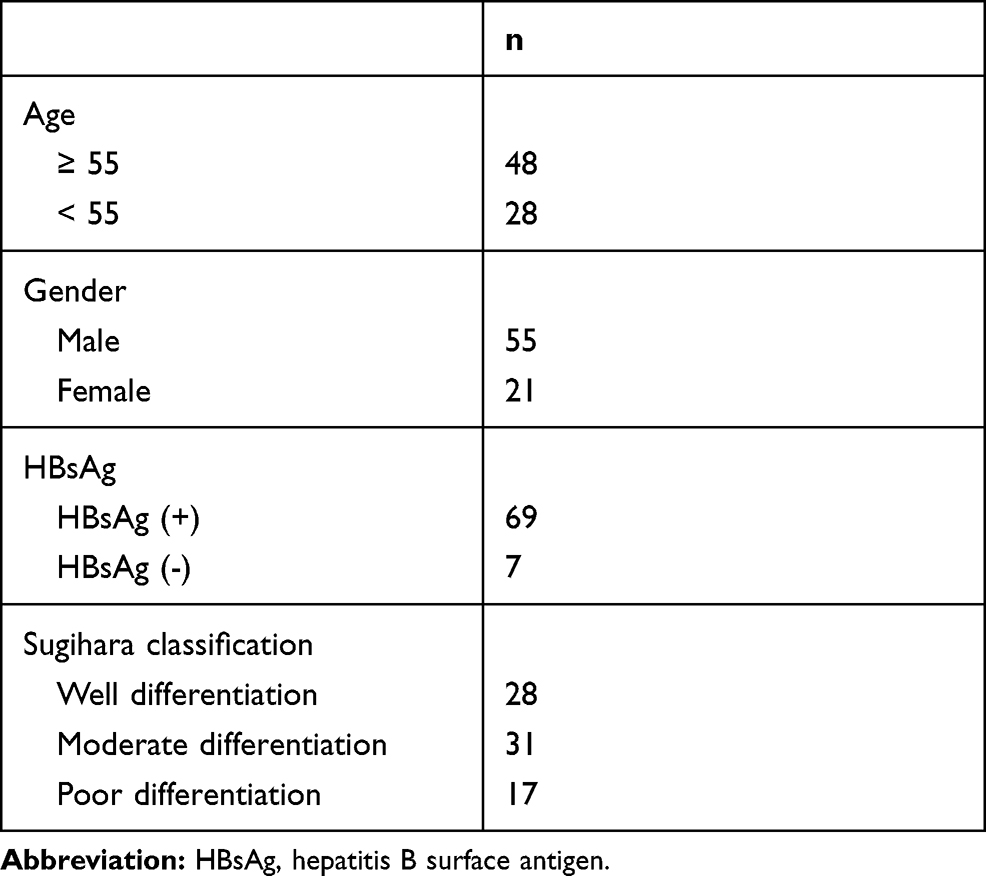 |
Table 1 Patients Characteristics |
Immunohistochemistry
Tissue samples were fixed in 10% formalin, embedded in paraffin, and sliced into 4 μm sections. The sections were heated at 60ºC for 1 h, followed by conventional xylene dewaxing and gradient alcohol dehydration. The sections were rinsed in 3% H2O2 (Sigma-Aldrich Chemical Company, St Louis, MO, USA) at 30°C for 30 min, then boiled in 0.01 M citric acid buffer solution at 95°C for 20 min, blocked with normal goat serum solution (C-0005, Shanghai Haoran Biological Technology Co., Ltd., Shanghai, China) at 37°C for 10 min, and incubated with the primary antibody, mouse anti-human Rab10 (1: 200, ab104859, Abcam Inc., Cambridge, UK) for 12 h at 4°C. Then, the sections were incubated with the secondary antibody, biotinylated goat-anti-mouse (1: 500, ab181367, Abcam Inc., Cambridge, UK) for 10 min at room temperature. Then, the sections were reacted with streptavidin-horseradish peroxidase (0343-10000U, Imunbio, Beijing, China) at room temperature for 10 min, developed by diaminobenzidine (ST033, Whiga Biosmart Co., Ltd., Guangzhou, Guangdong, China), and stored in a dark room at room temperature for 8 min. After washing under running water, the sections were counterstained with haematoxylin (PT001, Shanghai Bogoo Biological Technology Co., Ltd., Shanghai, China), conventionally dehydrated, cleared, mounted and observed under an optical microscope (CX41-12C02, Olympus, Tokyo, Japan). The image analysis software (Nikon, Tokyo, Japan) was used to count the number of positive cells. Three fields of vision in each section were selected (200 ×). The percentage of positive cells in total cells in each field was calculated; the percentage lower than 10% was considered as negative and higher than 10% was positive.
Reverse Transcription-Quantitative Polymerase Chain Reaction (RT-qPCR)
Total RNA was isolated from tissues and cells using an RNA extraction kit (10,296,010, Invitrogen Inc., Carlsbad, CA, USA). Then the PrimeScript RT kit (Sigma-Aldrich, St. Louis, MO, USA) was used to reversely transcribe RNA into cDNA. The amplification reaction was made in a total volume of 10 µL. The reverse transcription reaction conditions were as follows: reverse-transcription reaction at 37ºC for 15 min (3 times), and reverse transcriptase inactivation reaction at 85ºC for 5 s. The primers for miR-519d, Rab10, p53, mammalian target of rapamycin (mTOR), Bcl-2 associated X protein (Bax), B-cell lymphoma-2 (Bcl-2), Beclin1, Atg5, and the internal references U6 and glyceraldehyde-3-phosphate dehydrogenase (GAPDH) (Table 2) were designed and synthesized by Takara Biomedical Technology (Beijing, China). The RT-qPCR was performed with a PCR kit (Sigma-Aldrich, St. Louis, MO, USA). The internal reference for miR-519d was U6, while the internal reference for Rab10, mTOR, p53, Bax, Bcl-2, Beclin1 and Atg5 was GAPDH. The 2−ΔΔCt method was used to calculate the relative expression. These procedures were also applied to cell experiments.
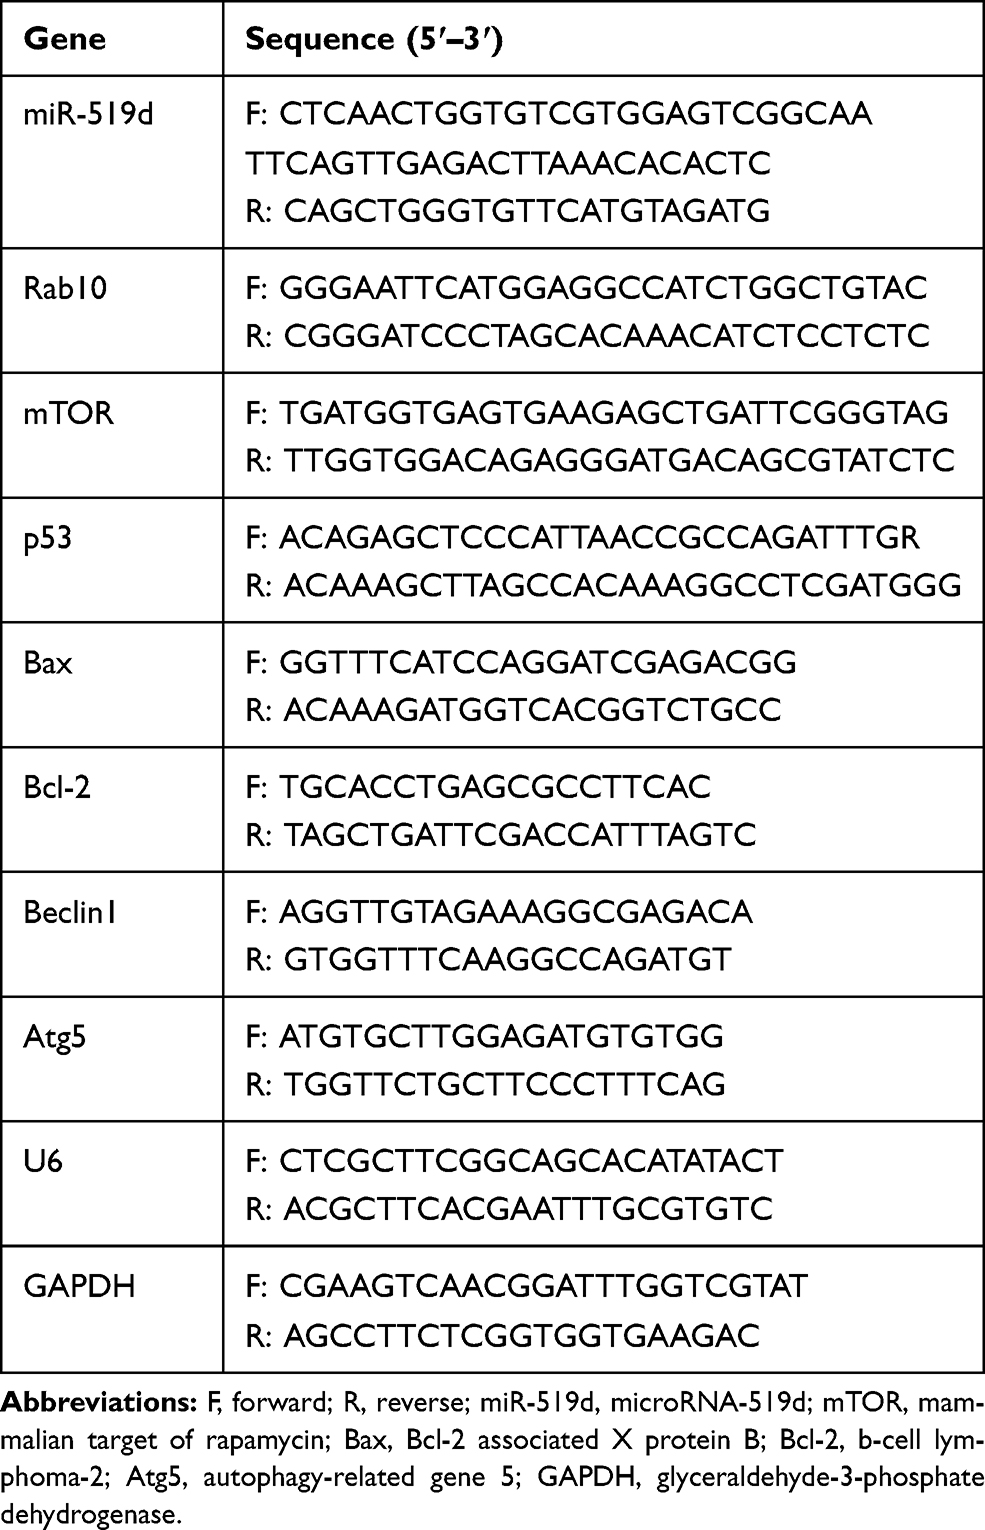 |
Table 2 Primer Sequences of Related Genes for Reverse Transcription-Quantitative Polymerase Chain Reaction |
Dual-Luciferase Reporter Gene Assay
The MicroRNA.org website was used to analyze the target genes of miR-519d. The dual-luciferase reporter gene assay was used to determine whether Rab10 gene was a direct target of miR-519d. The synthetic Rab10-3ʹUTR gene fragment was introduced into a pMIR-reporter (Promega, Madison, WI, USA) using the endonucleases SpeI and HindIII. The complementary sequence mutation sites of the seed sequence were designed on the Rab10 wild-type (WT). After restriction endonuclease digestion and ligation with T4 DNA ligase, the target fragments were inserted into the pMIR-reporter reporter plasmid. The correctly sequenced luciferase-reporter plasmid WT or mutation (MUT) were respectively co-transfected with miR-519d and negative control (NC) into HEK-293T cells (Beinuo Life Science, Shanghai, China). After being transfected for 48 h, the cells were collected and lysed. The luciferase activity was detected by the firefly luciferase assay kit.
Cell Culture, Grouping, and Transfection
The human normal hepatocyte L-02 cells and the human HCC cell lines HCC9724 and Huh7 were cultured in high-glucose Dulbecco’s modified Eagle’s medium (Gibco, Carlsbad, CA, USA) containing 100 µg/mL of penicillin, 15% fetal bovine serum and 100 µg/mL of streptomycin at 37°C in a 5% CO2 incubator with saturated humidity. The culture medium was renewed every 1–2 d and the cells in the logarithmic growth phase were used for further study. The cells at the third passage were classified into blank (without any treatment), negative control (NC), miR-519d mimic (transfected with miR-519d mimic), miR-519d inhibitor (transfected with miR-519d inhibitor), small interfering RNA-Rab10 (siRNA-Rab10; transfected with siRNA-Rab10) and miR-519d inhibitor + siRNA-Rab10 (transfected with miR-519d inhibitor and siRNA-Rab10) groups. HCC cells at the logarithmic growth phase were seeded into a 6-well plate. When the cell confluence reached 30 ~ 50%, cell transfection was carried out according to the protocol of Lipofectamine 2000 (11,668–019, Invitrogen, New York, CA, USA). After 24 ~ 48 h of culture, the following experiment was carried out.
Western Blot Analysis
After 48 h of transfection, the cells were lysed using a radioimmunoprecipitation assay (RIPA, C0481, Sigma-Aldrich, St. Louis, MO, USA) buffer on ice for 30 min. Then, the protein samples were centrifuged at 25,764 g and 4°C for 20 min, separated by sodium dodecyl sulphate polyacrylamide gel electrophoresis (SDS-PAGE), and transferred onto a nitrocellulose membrane. Then, the membranes were blocked in Phosphate-Buffered Saline/Tween (PBST) containing 10% skimmed milk at 4°C overnight. The membrane was then incubated at 37°C for 2 h with the primary antibody, rabbit anti-human Rab10 (1: 100, ab110517), mTOR (1: 2000, ab2732), p53 (1: 200, ab26), Bax (1: 1000, ab32503), Bcl-2 (1: 1000, ab32142), Beclin1 (1: 500, ab62557), Atg5 (1: 1000, ab108327), and LC3B (1:1000, ab48394). All antibodies were purchased from Abcam Inc. (Cambridge, UK). Later, the samples were incubated with the secondary antibody, horseradish peroxidase (HRP)-labelled goat anti-rabbit IgG (1: 1000, DF109489, Shanghai Yaoyun Biological Technology Co., Ltd., Shanghai, China) at 37°C for 2 h, followed by three washes with PBST for 10 min. An enhanced chemiluminescence kit (ECL kit, 36208ES60, Amersham Pharmacia, Piscataway, NJ, USA) was used for membrane developing. Semi-quantitative analysis of the bands was carried out using the ImageJ image analysis software. GAPDH was used as an internal reference. The mean grey value of target protein band to internal reference band was considered as the relative protein expression. Three parallel wells were set for each protein sample.
3[4,5-Dimethylthiazolyl]-2,5-Diphenyltetrazolium Bromide (MTT) Assay
Cells at the logarithmic growth phase were seeded in a 96-well plate at a concentration of 1 × 10⁴ cells/well in 200 µL of culture medium. The HCC cells were allowed to grow for adherence for 24 h at 37°C with 5% CO2. At the 24th, 48th, 72nd and 96th h of culture, the cells in each well were added with 20 μL of MTT (5 mg/mL, B7777, APExBIO, Houston, TX, USA) and left for another 4 h of culture. After the addition of 150 μL of dimethyl sulfoxide, the optical density (OD) value of each well was measured at a wavelength of 490 nm using a microplate reader. The experiment was conducted in triplicate.
Immunofluorescence
Initially, the HCC cells in the best growth condition were detached, uniformly triturated into a single cell solution at a concentration of 5 × 10⁴ cells/mL, and seeded in NEST fluorescence dedicated medium. After 12 h, the solution was renewed and 10 μL of mRFP-GFP-LC3 adenovirus concentrated solution was added into each medium. After the transfection was completed, the cells were cultured in an incubator for 8 h and then further cultured in fresh cell medium. After 24 h, the fluorescence spot number and distribution of LC3 in HCC cells were detected under a fluorescence microscope and analysed using the ImageJ image analysis software.
Flow Cytometry
After 48 h of transfection, the cell density was adjusted to 1 × 10⁶ cells/mL after treatment with 0.25% trypsin. The cells (1 mL) were centrifuged at 403 × g for 10 min, and centrifuged with 2 mL of PBS. The cells were fixed with 70% pre-cold ethanol overnight at 4°C. The cell suspension (100 µL) was reacted with 50 µg of propidium iodide (PI) containing RNAase in the dark for 30 min. Later, the suspension was filtered using a 100-nylon mesh. The cell cycle was analyzed at a wavelength of 488 nm using a flow cytometer (Becton, Dickinson and Company, Franklin Lakes, NJ, USA).
Annexin V-Fluorescein Isothiocyanate (FITC)/PI double staining was used to detect cell apoptosis. The collected cells were cultured in 5% CO2 incubator at 37°C for 48 h. After that, the cells were centrifuged, resuspended in 200 µL of binding buffer, and reacted with 10 µL of Annexin V-FITC (ab14085, Abcam Inc., Cambridge, MA, USA) and 5 µL of PI in the dark for 15 min. Lastly, 300 µL of binding buffer was added to the cell samples. Cell apoptosis was detected using a flow cytometer at an excitation wavelength of 488 nm.
HCC Xenograft Experiment
Twelve specific pathogen-free female BALB/c mice (aged 6 weeks and weighing 15–18 g) were obtained from the Hunan SJA Laboratory Animal Co., Ltd. (Changsha, Hunan, China). Huh7 cells in the logarithmic growth phase were dispersed into cell suspension (1 × 10⁷ cell/mL) which was injected into the left armpit of the mice. When the tumour size reached 50 mm3, the mice were subcutaneously injected with 10 nmol/mouse of either miR-519d agomir or NC agomir once every five days. After five weeks of drug treatment, the mice were euthanized. The tumours were removed and weighed, and the total protein was extracted for Western blot analysis.
Statistical Analysis
The data were analyzed using the SPSS 21.0 software (IBM Corp. Armonk, NY, USA). Measurement data were expressed as mean ± standard deviation. The variation analysis between tumor tissues and paracancerous tissues was analyzed using a paired t-test. Comparisons between two groups were conducted by independent-sample t-test, while comparisons among multiple groups were assessed by one-way analysis of variance (ANOVA) and Tukey’s post hoc test. The enumeration data were expressed as percentage, and the statistical methods were tested by chi-square analysis. A value of p<0.05 was considered statistically significant.
Results
The Role of Rab10 as an Oncogene in HCC
The GEO database was used to obtain the HCC microarray dataset GSE49515. Differential expression analysis was carried out on HCC and normal samples from this microarray dataset, which identified 589 DEGs. These results also revealed 340 genes with significantly increased expression and 249 genes with markedly reduced expression. Figure 1A illustrates 30 DEGs from this microarray. KEGG analysis was further performed on 589 DEGs (Figure 1B) and the results revealed their involvement in tumor-related pathways. Moreover, among these DEGs, Rab10 gene was found to be closely associated with the AMPK signaling pathway (Figure 1C) and correlated with tumor-related KEGG through the AMPK signaling pathway. Further research in the KEGG database found that the Rab10 gene was closely correlated with the AMPK signaling pathway (map04152). In fact, the AMPK signaling pathway has been proved to be strongly linked to various tumors such as HCC.24,25 Further study of gene expression in the HCC database from the TCGA website (Figure 1D) revealed that the Rab10 gene was highly expressed in multiple stages of HCC, which matched the observations from Rab10 gene expression in the GSE49515 microarray data. To further understand the upstream regulatory mechanisms of the Rab10 gene, databases such as miRDB were used to predict regulatory miRNAs for Rab10. The intersecting miRNAs from the top 100 predictions from five databases were obtained (Figure 1E) and identified hsa-miR-36-3p and hsa-miR-519d as the two intersecting miRNAs from all five databases. Previous studies have suggested that hsa-miR-519d may be closely associated with HCC,26,27 but its detailed functions in HCC were still unclear. Based on these observations, we inferred that hsa-miR-519d may regulate the progression of HCC through interacting with Rab10, thus modulating the AMPK signaling pathway.
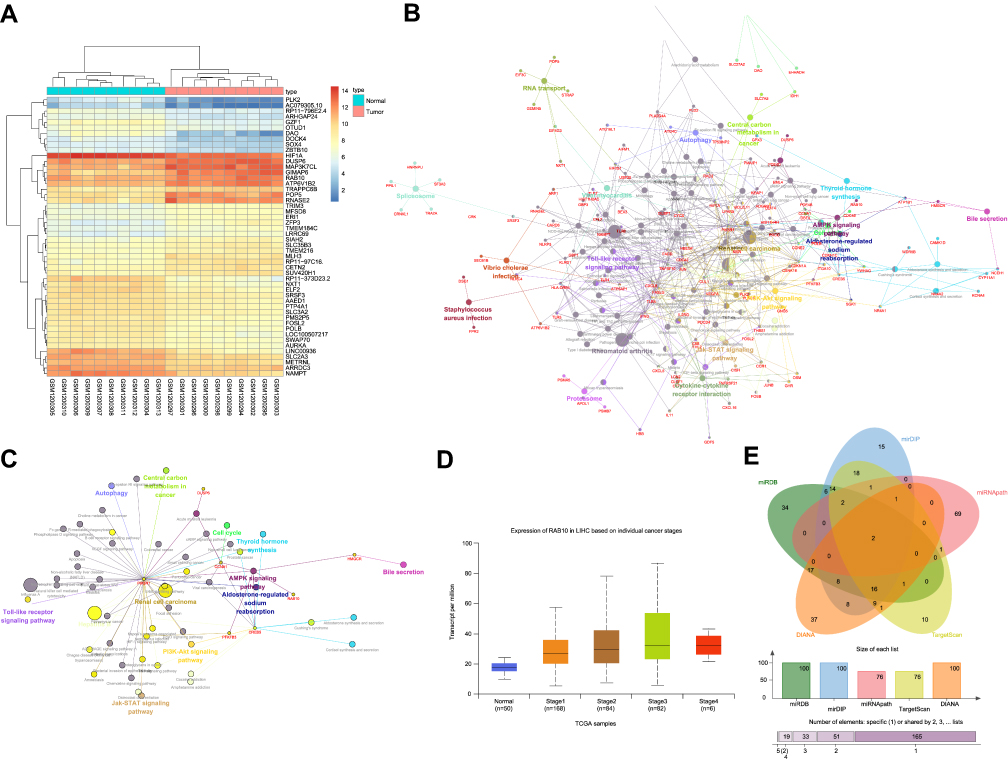 |
Figure 1 Rab10 is predicted to be an oncogene in HCC. (A) Histogram of the DEGs in the HCC expression microarray; X-axis represents the sample number and Y-axis represents genes; dendrogram above represents sample cluster; the dendrogram in the left represents the gene expression cluster; each cube represents the level of a gene in a sample; (B–C) KEGG functional analysis on DEGs in HCC microarray; circles represent different genes and related signaling pathways; lines connecting circles represent interactive relationship between genes and the signaling pathway; Panel (B) represents KEGG function of all related DEGs; Panel (C) represents Rab10-related genes and signaling pathway; (D) Rab10 gene expression in TCGA HCC database; X-axis represents sample number and Y-axis represents gene expression; normal control samples and 4 HCC samples at different stages are shown from left to right; (E) Prediction for regulatory miRNAs of Rab10 gene; 5 ovals respectively represent predicted results from 5 database; the middle part represents the intersection of predicted results. Abbreviations: miR-519d, microRNA-519d; HCC, hepatocellular carcinoma; AMPK, adenosine 5ʹ-monophosphate-activated protein; KEGG, Kyoto Encyclopedia of Genes and Genomes; TCGA, The Cancer Genome Atlas; DEGs, differentially expressed genes. |
Rab10 Is Highly Expressed in HCC Tissues and Cell Lines
In order to detect the expression of Rab10 in HCC, we used RT-qPCR and immunohistochemistry. The results showed that the expression of Rab10 was significantly higher in HCC tissues and cells than in paracancerous tissues (Figure 2A and B). Compared to the paracancerous tissues, the HCC tissues presented significantly increased positive expression rate of Rab10 (p<0.05; Figure 2C and D). These results showed that Rab10 was up-regulated in HCC tissues and cell lines.
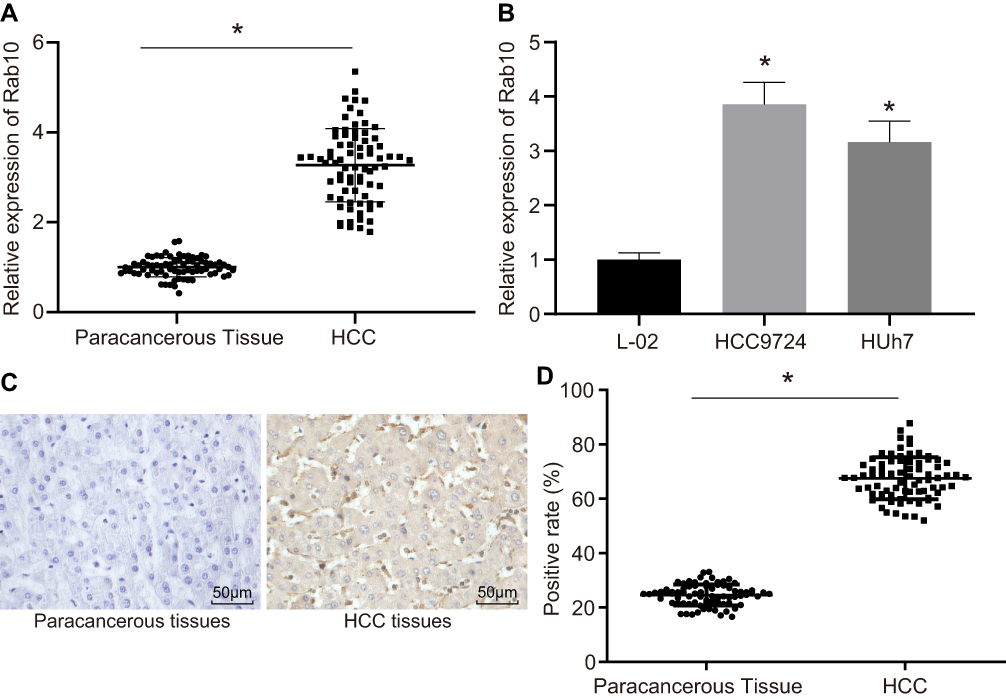 |
Figure 2 Rab10 is upregulated in HCC tissues and cell lines. (A) The mRNA expression of Rab10 in paracancerous tissues and HCC tissues determined by RT-qPCR (n=76); (B) The mRNA expression of Rab10 in human normal hepatocyte L-02 cells and human HCC cell lines HCC9724 and Huh7; (C) The immunohistochemical staining of Rab10 in paracancerous tissues and HCC tissues (n=76) (× 200); (D) Positive expression rate of Rab10 in the HCC tissues and paracancerous tissues (n=76); a chi-square test was used for the analysis; *p<0.05 vs the paracancerous tissues or L-02 cells. Abbreviation: HCC, hepatocellular carcinoma. |
Silencing of Rab10 Inhibits Proliferation and Promotes Apoptosis and Autophagy of HCC Cells
To get an insight into the possible mechanism and functions of Rab10 on HCC cell properties, Rab10 was silenced in Huh7 cells and the expression of the related functional genes was measured by RT-qPCR and Western blot analysis. Moreover, the proliferation, autophagy and apoptosis of HCC cells were detected by MTT assay, immunofluorescence, and flow cytometry. The results obtained from RT-qPCR and Western blot analysis showed that the expression of Bax, Beclin1, Atg5 and p53, the extent of AMPK phosphorylation as well as the ratio of LC3II/LC3I were increased following siRNA-Rab10 treatment, while the expression of Rab10, mTOR and Bcl-2 was decreased compared to that of the HCC cells without treatment or treated with the NC (p<0.05; Figure 3A and B). Consistently, functional experiments revealed that compared with HCC cells without treatment or treated with the NC, the HCC cells treated with siRNA-Rab10 displayed reduced proliferation (Figure 3C), enhanced autophagy (Figure 3D), elevated number of cells in the G0/G1 phase, reduced number of cells in the S phase (Figure 3E), and significantly increased cell apoptosis rate (Figure 3F). Together, these findings demonstrated that Rab10 could potentiate apoptosis and autophagy in HCC cells. The same results were also obtained in the HCC cell line HCC9724 (Supplementary Figure 1).
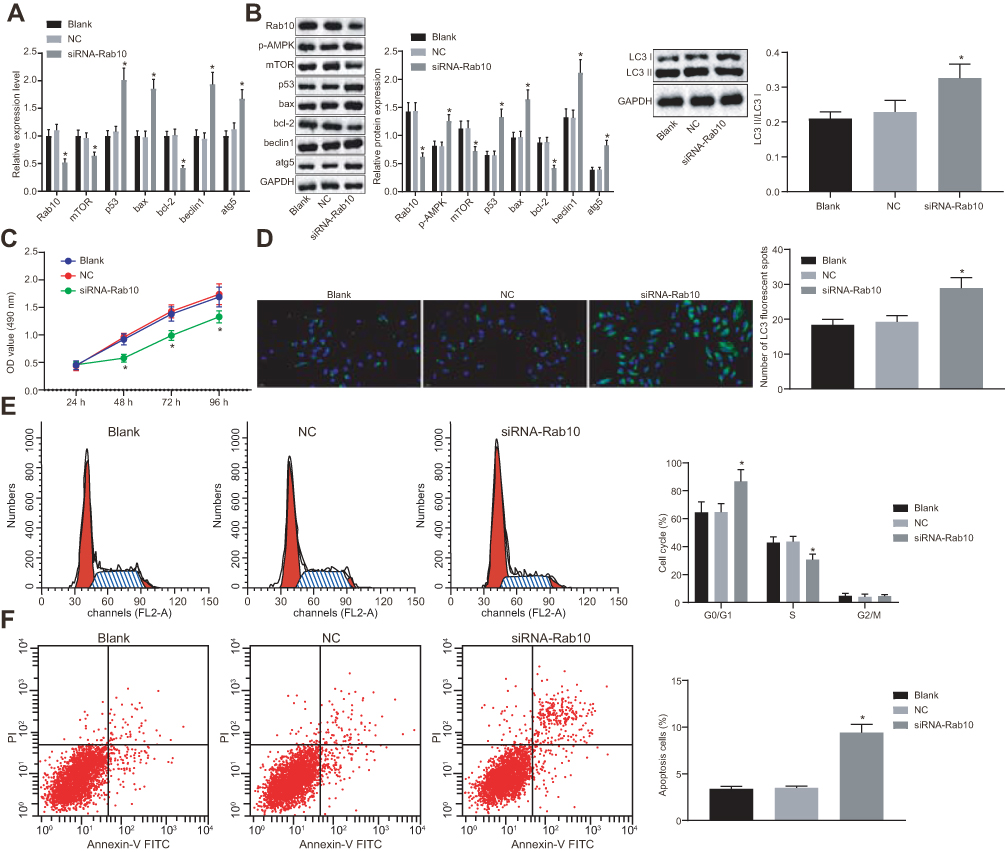 |
Figure 3 Silencing Rab10 inhibits the proliferation of Huh7 cells and induces apoptosis and autophagy. The Huh7 cells were treated with siRNA-Rab10 and NC. (A) mRNA expression of Rab10, Bax, Beclin1, Atg5, p53, mTOR and Bcl-2 detected by RT-qPCR; (B) Protein expression of Bax, Beclin1, Atg5, p53, Rab10, mTOR, and Bcl-2 and the extent of AMPK phosphorylation normalized to GAPDH detected by Western blot analysis; (C) OD value of Huh7 cells at the 24th, 48th, 72nd and 96th h assessed by MTT assay; (D) Huh7 cell autophagy observed by immunofluorescence; (E) Cell cycle of Huh7 cells; (F) The apoptosis levels of Huh7 treated as indicated using flow cytometry analysis. Data are represented as the mean ± standard deviation. The variation analysis was analyzed using an unpaired t-test. *p<0.05 vs the blank and the NC groups; The experiment was repeated 3 times independently. Abbreviations: HCC, hepatocellular carcinoma; RT-qPCR, reverse transcription-quantitative polymerase chain reaction; miR-519d, microRNA-519d; Bax, Bcl-2 associated X protein; Bcl-2, b-cell lymphoma-2; Atg5, autophagy-related gene 5; mTOR, mammalian target of rapamycin; GAPDH, glyceraldehyde-3-phosphate dehydrogenase. |
Rab10 Is Verified to Be a Target Gene of miR-519d
To further clarify the upstream regulatory mechanism of Rab10, an online analysis software was utilized, which displayed that specific binding areas exist between the Rab10 gene sequence and the miR-519d sequence, and Rab10 was a target gene of miR-519d (Figure 4A). After the dual-luciferase reporter gene assay on HEK-293T cells which were carrying the 3ʹ-UTR Rab10 luciferase reporter, it was found that induction of miR-519d would significantly inhibit the luciferase activity. However, there was no inhibition in the cells transfected with the mutant 3ʹ-UTR Rab10 luciferase reporter (Figure 4B), indicating that Rab10 (3ʹ-UTR) is a probable target of miR-519d.
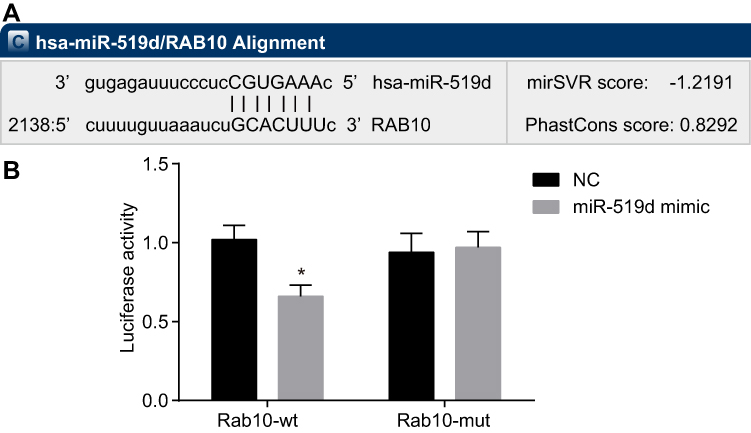 |
Figure 4 Rab10 is a direct target of miR-519d. (A) The putative binding sites of miR-519d in the Rab10 3ʹ-UTR (microRNA.org); (B) Binding relationship between miR-519d and Rab10 determined by dual-luciferase reporter gene assay; independent-sample t-test was used to analyze; the experiment was performed in triplicate; *p<0.05 vs the NC group. Abbreviations: UTR, untranslated regions; wt, wild-type; mut, mutant; miR-519d, microRNA-519d; NC, negative control. |
miR-519d Is Poorly Expressed in HCC Tissues and Cell Lines
We used RT-qPCR to detect the expression of miR-519d in HCC cells and tissues. The results showed that the expression of miR-519d was significantly lower in HCC tissues and cells than in paracancerous tissues and human normal hepatocyte L-02 cells (Figure 5A and B).
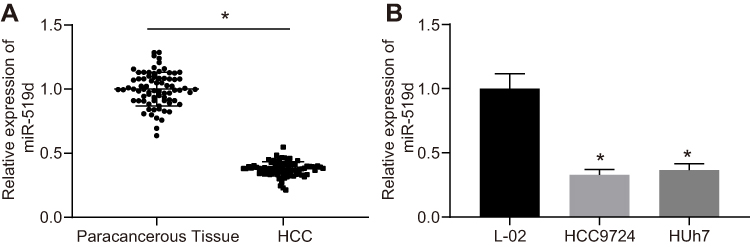 |
Figure 5 The downregulation of miR-519d is identified in HCC tissues and cells. (A) miR-519d expression in paracancerous tissues and HCC tissues determined by RT-qPCR (n=76); (B) miR-519d expression in human normal hepatocyte L-02 cells and human HCC cell lines HCC9724 and Huh7; the experiment was performed in triplicate; independent-sample t-test was used for the analysis; *p<0.05 vs paracancerous tissues or L-02 cells. Abbreviations: miR-519d, microRNA-519d; RT-qPCR, reverse transcription-quantitative polymerase chain reaction; NC, negative control; HCC, hepatocellular carcinoma. |
miR-519d Inhibits Cell Proliferation and Promotes Cell Autophagy and Apoptosis of HCC Cells via Binding to Rab10 Through the AMPK Signalling Pathway
To confirm whether miR-519d could regulate HCC cell properties by targeting Rab10, the HCC Huh7 cells were treated with miR-519d mimic, miR-519d inhibitor alone, or siRNA-Rab10, followed by RT-qPCR (Figure 6A) and Western blot analysis (Figure 6B). The results showed that, compared with the blank and the NC groups, the miR-519d mimic group presented elevated expression of miR-519d along with increased mRNA and protein expression of Bax, Beclin1, Atg5 and p53, the extent of AMPK phosphorylation as well as the ratio of LC3II/LC3I, while down-regulated the mRNA and protein expression of Rab10, mTOR and Bcl-2. Meanwhile, the miR-519d inhibitor group showed the opposite results when compared with the blank and NC groups. Also, compared with the miR-519d inhibitor group, the miR-519d inhibitor + siRNA-Rab10 group exhibited elevated mRNA and protein expression of Bax, Beclin1, Atg5 and p53, the extent of AMPK phosphorylation as well as the ratio of LC3II/LC3I, while presenting reduced mRNA and protein expression of Rab10, mTOR and Bcl-2 (p<0.05). Accordingly, compared with the blank and NC groups, the proliferation ability of cells in the miR-519d mimic group was significantly reduced (Figure 6C), the autophagy was increased significantly (Figure 6D), the number of cells in the G0/G1 phase was increased, the number of cells in S phase was reduced (Figure 6E), and the apoptosis rate was significantly enhanced (Figure 6F). However, the trend for the miR-519d inhibitor group was opposite to that of the miR-519d mimic group. As expected, siRNA-Rab10 treatment significantly reduced miR-519d inhibitor-induced cell proliferation, but triggered cell autophagy (Figure 6D), increased the number of cells in the G0/G1 phase (Figure 6E) and enhanced the apoptosis rate (Figure 6F). Altogether, these findings demonstrated that miR-519d can induce apoptosis and autophagy in HCC cells via activation of the AMPK signalling pathway through downregulation of Rab10. The same results were obtained in HCC cell line HCC9724 as shown in Supplementary Figure 2.
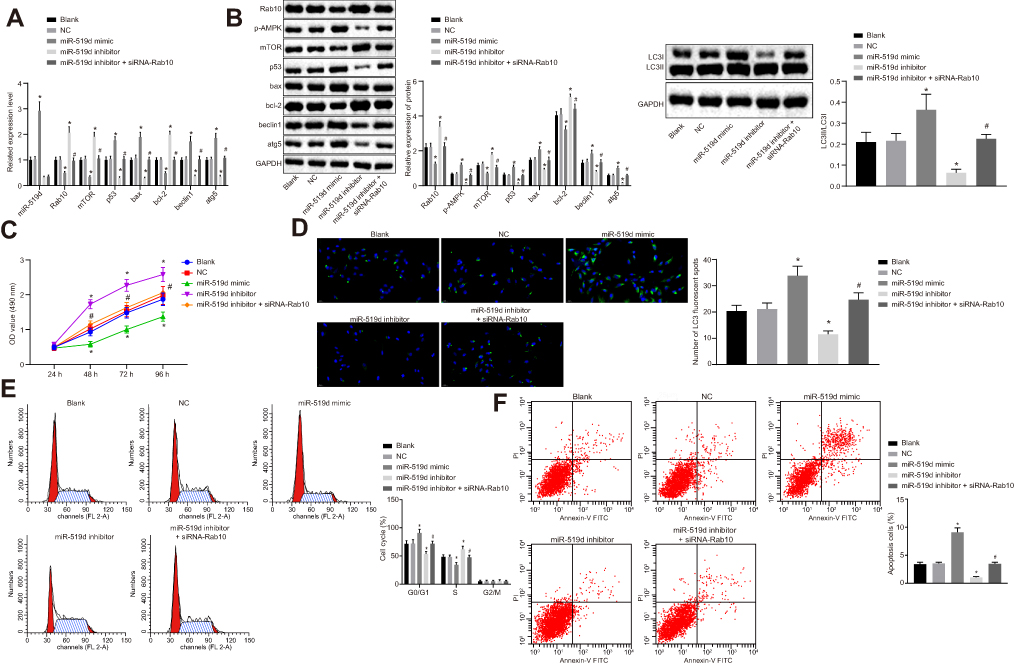 |
Figure 6 miR-519d overexpression and Rab10 gene silencing inhibit cell proliferation and promote Huh7 cell autophagy and apoptosis. The Huh7 cells were treated with miR-519d mimic, miR-519d inhibitor alone or in the presence of siRNA-Rab10. (A) miR-519d expression and mRNA expression of Rab10, Bax, Beclin1, Atg5, p53, mTOR and Bcl-2 in Huh7 cells detected by RT-qPCR; (B) Protein expression of Bax, Beclin1, Atg5, p53, Rab10, mTOR, and Bcl-2 and the extent of AMPK phosphorylation normalized to GAPDH, as well as the ratio of LC3II/LC3I in Huh7 cells detected by Western blot analysis; (C) OD value of Huh7 cells at the 24th, 48th, 72nd and 96th h assessed by MTT assay; (D) Huh7 cell autophagy observed by immunofluorescence; (E) Cell cycle of Huh7 cells; (F) The apoptosis levels of Huh7 treated as indicated using flow cytometry analysis. Data are represented as the mean ± standard deviation. Variation analysis was performed using an unpaired t-test. *p<0.05 vs the blank and NC groups; The experiment was repeated 3 times independently. *p<0.05 vs the blank and NC groups; #p<0.05 vs the miR-519d inhibitor group. Abbreviations: HCC, hepatocellular carcinoma; MTT, 3-(4,5-dimethylthiazol-2-yl)-2,5-diphenyltetrazolium bromide; miR-519d, microRNA-519d; NC, negative control; mTOR, mammalian target of rapamycin; Bax, Bcl-2 associated X protein; Bcl-2, b-cell lymphoma-2; Atg5, autophagy-related gene 5; GAPDH, glyceraldehyde-3-phosphate dehydrogenase. |
miR-519d Reduces Tumour Growth in the Mouse Xenograft Model in vivo
To calculate the anti-tumour role of miR-519d in vivo, a Huh7 xenograft model was established. As shown in Figure 7A–C, miR-519d showed significant anti-tumour role in the Huh7 xenograft model, as evidenced by a reduction in tumour volume and weight. RT-qPCR and Western blot assays showed that miR-519d agomir up-regulated miR-519d, Bax, Beclin1, Atg5 and p53, as well as the extent of AMPK phosphorylation whereas down-regulated Rab10, mTOR and Bcl-2 (Figure 7D and E). These findings confirmed the role of miR-519d against HCC tumour growth in vivo.
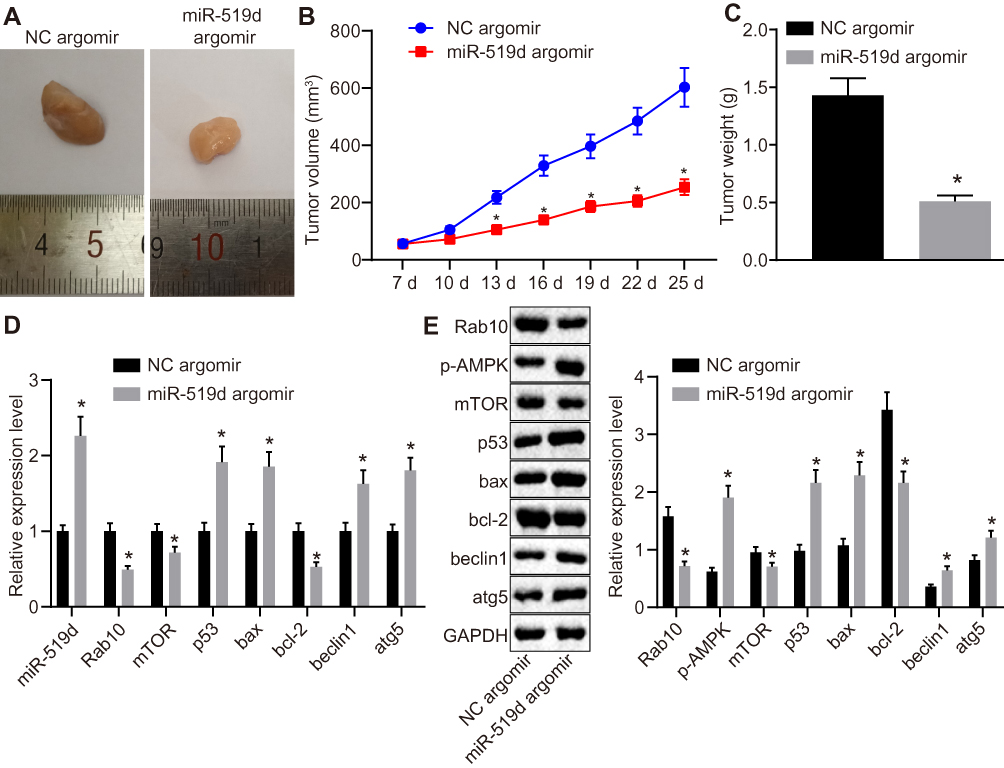 |
Figure 7 Overexpressed miR-519d delays HCC tumour growth in vivo. The Huh7 cells stably transfected with miR-519d agomir or NC agomir were injected into nude mice (n=6). (A) The representative images of tumour tissue samples; (B) The tumor volume at the 7th, 10th, 13th, 16th, 19th, 22nd and 25th d; (C) Tumor weight (g) of mice were recorded, (D) miR-519d expression and mRNA expression of Rab10, Bax, Beclin1, Atg5, p53, mTOR and Bcl-2 in tumour tissue sections isolated from each group of mice detected by RT-qPCR; (E) Protein expression of Bax, Beclin1, Atg5, p53, Rab10, mTOR, and Bcl-2 and the extent of AMPK phosphorylation normalized to GAPDH in tumour tissue sections isolated from each group of mice detected by Western blot analysis. Data are represented as the mean ± standard deviation. Variation analysis was performed using an unpaired t-test. *p<0.05 vs the NC agomir group. |
Discussion
Despite the progress made in the treatment and prognosis of HCC, this type of cancer remains one of the most commonly occurring and major causes of mortality worldwide.28 Moreover, miR-519d was found to be involved in HCC.27 However, the specific mechanism of miR-519 in HCC was still unclear. Therefore, this study explored the effects of miR-519d on HCC cell proliferation and autophagy through activation of the AMPK signaling pathway by binding to Rab10.
In this study, we found that compared to paracancerous tissues, Rab10 was up-regulated and miR-519d down-regulated in HCC tissues. A similar study also reported increased Rab10 expression in HCC tissues.12 Moreover, increased Rab10 expression has been linked to poor prognosis in HCC accompanied by pathological complications such as distant metastasis.29 Rab10 was also identified as an oncogene due to the evidence that shRNA-mediated knockdown of Rab10 resulted in a reduction of HCC cell proliferation and colony formation.29 Also, a recent study demonstrated that Rab10 was highly expressed in some liver cancer tissue samples.30 Furthermore, inhibition of Rab10 repressed osteosarcoma cell proliferation and metastasis, and its expression was negatively regulated by miR-329.16 In addition, previous studies have suggested the potential mechanisms of aberrant miRNA expression in genomic rearrangement, epigenetic modifications, enzymatic dysregulation of miRNA biosynthesis, and the presence of single-nucleotide polymorphisms in primary-microRNA sequences.31,32 In a study conducted by Tu et al, miR-519a was found to regulate HCC progression by targeting the PTEN/PI3K/AKT signaling pathway.33 Previous studies have demonstrated that miRNAs often show reduced levels in tumors due to epigenetic silencing, genetic loss, widespread transcriptional repression, or defects in the biogenesis of miRNAs.7,34
We further observed that restoration of miR-519d or silencing of Rab10 resulted in decreased Rab10, mTOR and Bcl-2 expression, as well as increased Bax, Beclin1, Atg5 and p53 expression, the extent of AMPK phosphorylation as well as the ratio of LC3II/LC3I. Previous studies have confirmed LKB1 as an upstream kinase on AMPK, and showed that mutation of LKB1 gene leads to the loss of the kinase activity in the LKB1 protein, failing to control cell growth and eventually promoting tumor growth.35,36 In HT1080, IEC16 and MEF cells, LKB1 also induced cell apoptosis whit the involvement of the p53 protein.37 Zhou et al found that from normal breast epithelium to hyperplasia, abnormal hyperplasia, and tumor invasion, the mTOR phosphorylation was enhanced progressively.38 mTOR was found to be able to phosphorylate p70S6k on its Threonine-389, and p70S6k was observed to be overexpressed in various human cancers.39,40 Autophagy is a lysosome-mediated catabolic function that is evolutionarily conserved and restores cellular homeostasis via degradation of nutrients and recycling of unnecessary cytoplasmic components; Beclin-1 is a major autophagy-related gene involved in the autophagy process.41 A previous study indicated that miRNAs play roles in the modulation of autophagy through regulation of some key proteins which affect various steps of the autophagy process, including upstream signaling pathways and autolysosome degradation.42 LC3I production starts with Atg7 being transferred to Atg3 and modified with a lipidic attachment to bind with the autophagosome membrane, thus generating the membrane-bound form of LC3II which is deemed as a hallmark of active autophagy.43
Moreover, we also found that the miR-519d overexpression or Rab10 silencing, decreased cell proliferation, arrested more cells at the G0/G1 stage but fewer at the S stage, and a higher apoptosis rate. He et al detected increased Rab10 in eight out of eleven HCC cell lines and it suggested that the increased expression of the Rab protein regulated tumor cell growth, although it showed no connection to tumor size and apoptosis.30 MiR-519a, miR-519b and miR-519c were reported to be able to target HuR, which encodes a proliferation-related protein, and miR-519 was suggested to be a suppressor of HuR translation.44 Hou et al found in their study that the malignant phenotype of HCC may be facilitated by the inhibition of miR-519d, which allowed MKi67 to be overexpressed.32
Conclusion
In conclusion, we found that Rab10 is a target of miR-519d and that miR-519d overexpression induces apoptosis and autophagy in human HCC cells through activation of the AMPK signalling pathway (Figure 8). Moreover, our in vivo study confirmed that miR-519d overexpression was capable of reducing tumour growth in xenograft tumor models. Our findings provide a novel therapeutic target for HCC treatment. However, further studies including a larger number of test subjects are still needed.
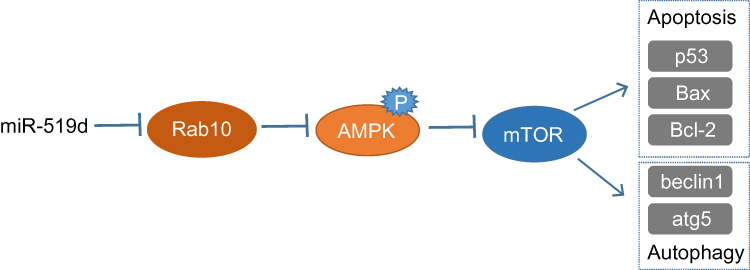 |
Figure 8 The possible mechanism of miR-519d overexpression in HCC. Overexpressed miR-519d suppresses Rab10 expression to inhibit the phosphorylation of AMPK and mTOR expression, thus enhancing cell apoptosis-related genes (Bax, Bcl-2 and p53), and autophagy-related genes (Beclin1 and Atg5). Abbreviations: miR-519d, microRNA-519d; HCC, hepatocellular carcinoma. |
Acknowledgment
We would like show sincere appreciation to the reviewers for critical comments on this article.
Disclosure
The authors report no conflicts of interest in this work.
References
1. Sherman M. Hepatocellular carcinoma: epidemiology, surveillance, and diagnosis. Semin Liver Dis. 2010;30(1):3–16. doi:10.1055/s-0030-1247128
2. Hu MH, Ma CY, Wang XM, et al. MicroRNA-126 inhibits tumor proliferation and angiogenesis of hepatocellular carcinoma by down-regulating EGFL7 expression. Oncotarget. 2016;7(41):66922–66934. doi:10.18632/oncotarget.11877
3. Ringelhan M, Heikenwalder M, Protzer U. Direct effects of hepatitis B virus-encoded proteins and chronic infection in liver cancer development. Dig Dis. 2013;31(1):138–151. doi:10.1159/000347209
4. Xu J, Wu C, Che X, et al. Circulating microRNAs, miR-21, miR-122, and miR-223, in patients with hepatocellular carcinoma or chronic hepatitis. Mol Carcinog. 2011;50(2):136–142. doi:10.1002/mc.20712
5. Villanueva A, Llovet JM. Targeted therapies for hepatocellular carcinoma. Gastroenterology. 2011;140(5):1410–1426. doi:10.1053/j.gastro.2011.03.006
6. Lencioni R, Crocetti L. Local-regional treatment of hepatocellular carcinoma. Radiology. 2012;262(1):43–58. doi:10.1148/radiol.11110144
7. Lu J, Getz G, Miska EA, et al. MicroRNA expression profiles classify human cancers. Nature. 2005;435(7043):834–838. doi:10.1038/nature03702
8. Ladeiro Y, Couchy G, Balabaud C, et al. MicroRNA profiling in hepatocellular tumors is associated with clinical features and oncogene/tumor suppressor gene mutations. Hepatology. 2008;47(6):1955–1963. doi:10.1002/(ISSN)1527-3350
9. Su H, Yang JR, Xu T, et al. MicroRNA-101, down-regulated in hepatocellular carcinoma, promotes apoptosis and suppresses tumorigenicity. Cancer Res. 2009;69(3):1135–1142. doi:10.1158/0008-5472.CAN-08-2886
10. Deng X, Zhao Y, Wang B. miR-519d-mediated downregulation of STAT3 suppresses breast cancer progression. Oncol Rep. 2015;34(4):2188–2194. doi:10.3892/or.2015.4160
11. Yu G, Zhang T, Jing Y, Bao Q, Tang Q, Zhang Y. miR-519 suppresses nasopharyngeal carcinoma cell proliferation by targeting oncogene URG4/URGCP. Life Sci. 2017;175:47–51. doi:10.1016/j.lfs.2017.03.010
12. Fornari F, Milazzo M, Chieco P, et al. In hepatocellular carcinoma miR-519d is up-regulated by p53 and DNA hypomethylation and targets CDKN1A/p21, PTEN, AKT3 and TIMP2. J Pathol. 2012;227(3):275–285. doi:10.1002/path.3995
13. Fuchs E, Haas AK, Spooner RA, Yoshimura S, Lord JM, Barr FA. Specific Rab GTPase-activating proteins define the Shiga toxin and epidermal growth factor uptake pathways. J Cell Biol. 2007;177(6):1133–1143. doi:10.1083/jcb.200612068
14. Stenmark H. Rab GTPases as coordinators of vesicle traffic. Nat Rev Mol Cell Biol. 2009;10(8):513–525. doi:10.1038/nrm2728
15. Srikanth S, Kim KD, Gao Y, et al. A large Rab GTPase encoded by CRACR2A is a component of subsynaptic vesicles that transmit T cell activation signals. Sci Signal. 2016;9(420):ra31. doi:10.1126/scisignal.aac9171
16. Jiang W, Liu J, Xu T, Yu X. MiR-329 suppresses osteosarcoma development by downregulating Rab10. FEBS Lett. 2016;590(17):2973–2981. doi:10.1002/1873-3468.12337
17. Mafakheri S, Florke RR, Kanngiesser S, et al. AKT and AMP-activated protein kinase regulate TBC1D1 through phosphorylation and its interaction with the cytosolic tail of insulin-regulated aminopeptidase IRAP. J Biol Chem. 2018;293(46):17853–17862.
18. Kohjima M, Higuchi N, Kato M, et al. SREBP-1c, regulated by the insulin and AMPK signaling pathways, plays a role in nonalcoholic fatty liver disease. Int J Mol Med. 2008;21(4):507–511.
19. Han D, Li SJ, Zhu YT, Liu L, Li MX. LKB1/AMPK/mTOR signaling pathway in non-small-cell lung cancer. Asian Pac J Cancer Prev. 2013;14(7):4033–4039. doi:10.7314/APJCP.2013.14.7.4033
20. Hou G, Chen L, Liu G, et al. Aldehyde dehydrogenase-2 (ALDH2) opposes hepatocellular carcinoma progression by regulating AMP-activated protein kinase signaling in mice. Hepatology. 2017;65(5):1628–1644. doi:10.1002/hep.29006
21. Ranieri R, Ciaglia E, Amodio G, et al. N6-isopentenyladenosine dual targeting of AMPK and Rab7 prenylation inhibits melanoma growth through the impairment of autophagic flux. Cell Death Differ. 2018;25(2):353–367. doi:10.1038/cdd.2017.165
22. Shi M, Chen MS, Sekar K, Tan CK, Ooi LL, Hui KM. A blood-based three-gene signature for the non-invasive detection of early human hepatocellular carcinoma. Eur J Cancer. 2014;50(5):928–936. doi:10.1016/j.ejca.2013.11.026
23. Kenmochi K, Sugihara S, Kojiro M. Relationship of histologic grade of hepatocellular carcinoma (HCC) to tumor size, and demonstration of tumor cells of multiple different grades in single small HCC. Liver. 1987;7(1):18–26. doi:10.1111/j.1600-0676.1987.tb00310.x
24. Lee JH, Lee HJ, Sim DY, Jung JH, Kim KR, Kim SH. Apoptotic effect of lambertianic acid through AMPK/FOXM1 signaling in MDA-MB231 breast cancer cells. Phytother Res. 2018;32:1755–1763. doi:10.1002/ptr.6105
25. Cui YQ, Liu YJ, Zhang F. The suppressive effects of Britannin (Bri) on human liver cancer through inducing apoptosis and autophagy via AMPK activation regulated by ROS. Biochem Biophys Res Commun. 2018;497(3):916–923. doi:10.1016/j.bbrc.2017.12.144
26. Liu F, Gong R, Lv X, Li H. The expression profiling and ontology analysis of non-coding RNAs in dexamethasone induced steatosis in hepatoma cell. Gene. 2018;650:19–26. doi:10.1016/j.gene.2018.01.089
27. Fornari F, Ferracin M, Trere D, et al. Circulating microRNAs, miR-939, miR-595, miR-519d and miR-494, identify cirrhotic patients with HCC. PLoS One. 2015;10(10):e0141448. doi:10.1371/journal.pone.0141448
28. Seror O, N’Kontchou G, Ganne N, Beaugrand M. A randomized trial comparing radiofrequency ablation and surgical resection for HCC conforming to the Milan criteria. Ann Surg. 2011;254(5):
29. Wang W, Jia WD, Hu B, Pan YY. RAB10 overexpression promotes tumor growth and indicates poor prognosis of hepatocellular carcinoma. Oncotarget. 2017;8(16):26434–26447. doi:10.18632/oncotarget.15507
30. He H, Dai F, Yu L, et al. Identification and characterization of nine novel human small GTPases showing variable expressions in liver cancer tissues. Gene Expr. 2002;10(5–6):231–242. doi:10.3727/000000002783992406
31. Pang Y, Mao H, Shen L, Zhao Z, Liu R, Liu P. MiR-519d represses ovarian cancer cell proliferation and enhances cisplatin-mediated cytotoxicity in vitro by targeting XIAP. Onco Targets Ther. 2014;7:587–597. doi:10.2147/OTT
32. Hou YY, Cao WW, Li L, et al. MicroRNA-519d targets MKi67 and suppresses cell growth in the hepatocellular carcinoma cell line QGY-7703. Cancer Lett. 2011;307(2):182–190. doi:10.1016/j.canlet.2011.04.002
33. Tu K, Liu Z, Yao B, Han S, Yang W. MicroRNA-519a promotes tumor growth by targeting PTEN/PI3K/AKT signaling in hepatocellular carcinoma. Int J Oncol. 2016;48(3):965–974. doi:10.3892/ijo.2015.3309
34. Chang TC, Yu D, Lee YS, et al. Widespread microRNA repression by Myc contributes to tumorigenesis. Nat Genet. 2008;40(1):43–50. doi:10.1038/ng.2007.30
35. Zhong D, Guo L, de Aguirre I, et al. LKB1 mutation in large cell carcinoma of the lung. Lung Cancer. 2006;53(3):285–294. doi:10.1016/j.lungcan.2006.05.018
36. Hawley SA, Boudeau J, Reid JL, et al. Complexes between the LKB1 tumor suppressor, STRAD alpha/beta and MO25 alpha/beta are upstream kinases in the AMP-activated protein kinase cascade. J Biol. 2003;2(4):28. doi:10.1186/1475-4924-2-28
37. Karuman P, Gozani O, Odze RD, et al. The Peutz-Jegher gene product LKB1 is a mediator of p53-dependent cell death. Mol Cell. 2001;7(6):1307–1319. doi:10.1016/S1097-2765(01)00258-1
38. Zhou X, Tan M, Stone Hawthorne V, et al. Activation of the Akt/mammalian target of rapamycin/4E-BP1 pathway by ErbB2 overexpression predicts tumor progression in breast cancers. Clin Cancer Res. 2004;10(20):6779–6788. doi:10.1158/1078-0432.CCR-04-0112
39. Burnett PE, Barrow RK, Cohen NA, Snyder SH, Sabatini DM. RAFT1 phosphorylation of the translational regulators p70 S6 kinase and 4E-BP1. Proc Natl Acad Sci U S A. 1998;95(4):1432–1437. doi:10.1073/pnas.95.4.1432
40. Grewe M, Gansauge F, Schmid RM, Adler G, Seufferlein T. Regulation of cell growth and cyclin D1 expression by the constitutively active FRAP-p70s6K pathway in human pancreatic cancer cells. Cancer Res. 1999;59(15):3581–3587.
41. Wu ZZ, Zhang JJ, Gao CC, et al. Expression of autophagy related genes mTOR, Becline-1, LC3 and p62 in the peripheral blood mononuclear cells of systemic lupus erythematosus. Am J Clin Exp Immunol. 2017;6(1):1–8.
42. Gozuacik D, Akkoc Y, Ozturk DG, Kocak M. Autophagy-Regulating microRNAs and Cancer. Front Oncol. 2017;7:65. doi:10.3389/fonc.2017.00065
43. Aburto MR, Hurle JM, Varela-Nieto I, Magarinos M. Autophagy during vertebrate development. Cells. 2012;1(3):428–448. doi:10.3390/cells1030428
44. Abdelmohsen K, Srikantan S, Kuwano Y, Gorospe M. miR-519 reduces cell proliferation by lowering RNA-binding protein HuR levels. Proc Natl Acad Sci U S A. 2008;105(51):20297–20302. doi:10.1073/pnas.0809376106
 © 2020 The Author(s). This work is published and licensed by Dove Medical Press Limited. The full terms of this license are available at https://www.dovepress.com/terms.php and incorporate the Creative Commons Attribution - Non Commercial (unported, v3.0) License.
By accessing the work you hereby accept the Terms. Non-commercial uses of the work are permitted without any further permission from Dove Medical Press Limited, provided the work is properly attributed. For permission for commercial use of this work, please see paragraphs 4.2 and 5 of our Terms.
© 2020 The Author(s). This work is published and licensed by Dove Medical Press Limited. The full terms of this license are available at https://www.dovepress.com/terms.php and incorporate the Creative Commons Attribution - Non Commercial (unported, v3.0) License.
By accessing the work you hereby accept the Terms. Non-commercial uses of the work are permitted without any further permission from Dove Medical Press Limited, provided the work is properly attributed. For permission for commercial use of this work, please see paragraphs 4.2 and 5 of our Terms.