")
Back to Journals » Cancer Management and Research » Volume 11
MicroRNA-34a suppresses aggressiveness of hepatocellular carcinoma by modulating E2F1, E2F3, and Caspase-3
Authors Han R, Chen X, Li Y, Zhang S, Li R , Lu L
Received 23 January 2019
Accepted for publication 4 March 2019
Published 10 April 2019 Volume 2019:11 Pages 2963—2976
DOI https://doi.org/10.2147/CMAR.S202664
Checked for plagiarism Yes
Review by Single anonymous peer review
Peer reviewer comments 3
Editor who approved publication: Dr Chien-Feng Li
Rui Han,1,2 Xinyi Chen,1 Ya Li,1,2 Shunjia Zhang,2 Ruibai Li,1 Lingeng Lu3,4
1Department of Oncology and Hematology, Dongzhimen Hospital, Beijing University of Chinese Medicine, Beijing, 100700 People’s Republic of China; 2Department of Epidemiology and Public Health, Yale University School of Medicine, New Haven, CT 06520, USA; 3Department of Chronic Disease Epidemiology, Yale School of Public Health, School of Medicine, Yale University, New Haven, CT, 06520-8034, USA; 4Center for Biomedical Data Science, Yale Cancer Center, Yale University, New Haven, CT, USA
Background: Accumulating evidence suggests an antineoplastic role of MicroRNA-34a (miR-34a) in human cancer. However, its precise biological functions stay largely elusive.
Purpose: Our study was aimed to investigate the impact of miR-34a on hepatocellular carcinoma (HCC) and its underlying apoptosis related mechanisms in vitro, as well as the association of miR-34a, E2F1 and E2F3 expression with patient survival of HCC using publicly accessed datasets.
Methods: The HBV-expressing Hep3B and SNU-449 cell lines with or without enforced expression of miR-34a were in vitro cultured for cell proliferation, colony formation, wound healing, cell invasion, and 3D spheroid formation. Quantitative reverse transcription PCR (RT-qPCR) was performed for E2F1, E2F3 expression. Caspase-3 (CASP3) activity was determined using a CaspACETM, Assay System. Kaplan–Meier survival curves were used to analyze the associations of miR-34a, E2F1 and E2F3 expression and overall survival in HCC. Meta-analysis was performed to examine the differential expression of E2F1 and E2F3 between primary HCC vs normal tissues.
Results: The results in vitro showed that enforced miR-34a expression significantly inhibited cell proliferation, migration, and invasion of both Hep3B and SNU-449. RT-qPCR results demonstrated that miR-34a could significantly suppress E2F1 and E2F3 expression, particularly in SNU-449. CASP3 activity in both Hep3B and SNU-449 increased in miR-34a treatment group. Overexpressed E2F1 and E2F3 were observed in primary HCC vs normal tissues. Survival analyses showed that HCC patients with either high miR-34a, or low E2F1, or low E2F3 expression had better survival than their opposite counterparts, respectively.
Conclusion: Our study suggested thatmiR-34a can modulate the expression of E2F1, E2F3, and CASP3 activity, thereby repressing tumor aggressiveness and expediting apoptosis in liver cancer cells
Keywords: hepatocellular carcinoma, microRNA-34a, E2Fs, Caspase-3, prognosis
Introduction
Liver cancer, one of the major cancer killers worldwide, ranks the top sixth of the most common malignant tumors and of cancer-caused death.1,2 In the past two decades, especially the Asia-Pacific region has become a severely afflicted area.3 Hepatocellular carcinoma (HCC) is a predominant type of liver cancer. The established risk factors for HCC include hepatitis virus (HBV and HCV) infection, fungal toxins (eg, aflatoxins), and non-alcohol fatty liver disease, and chronic HBV infection accounts for up to 54% of whole cases of HCC worldwide.4 Due to its occult onset and aggressiveness, HCC has a dismal mortality and poor prognosis.5 The currently available clinical treatments for patients with advanced HCC are still suboptimal. Patient who loses the opportunity of surgical resection or transplantation has only a few options for treatment, such as chemotherapy, radiotherapy, and immunotherapy. Taking chemotherapy for example, although extensive clinical trials have been tried to optimize chemotherapy regimens, the clinical benefit from the drugs, such as sorafenib, lenvatinib, and regorafenib, is still mediocre.6,7 Thus, the development of novel therapies is still imperative.
MicroRNA-34a (miR-34a) has been shown as a tumor suppressor in various malignant tumors.8 Reduced miR-34a expression is frequently exhibited in human cancer including HCC,9 and its inhibitory action has been observed in several human cancer cell lines including pancreas, prostate, brain, colon, breast, and liver (HuH7 and HCCLM3).5,9–12 Efforts have tried to develop miR-34a as an agent for the treatment of lymphoma, lung, and prostate cancer.11,13,14 The termination of MRX-34 Phase I clinical trial [NCT01829971] due to severe immune-related adverse effects (iREs) suggests that more investigation of the molecular mechanisms underlying the antitumor activities of miR-34a is still necessary.15
The transcription factor E2Fs family is grouped into three subcategories based on their functions and expression patterns: transcriptional activators (E2F1-3), transcriptional repressors (E2F4-6), and atypical repressors (E2F7 and E2F8).16–18 These transcription factors are involved in cell cycle and DNA synthesis by choreographing the expression of cell cycle-dependent genes in eukaryotic cells.19 Besides regulating cell cycle,20 E2F1 and E2F3 are also related to the maintenance and self-renewal of cancer stem cells (CSCs), and named as CSC-associated transcription factors.21 Furthermore, the deregulation of E2F transcriptional activators exists in many cancer types, including bladder, breast, ovarian, prostate, gastrointestinal, and lung.22–24 Abnormally upregulated expression levels of E2F1 and E2F3 were observed in HCC, leading to tumor cell proliferation and invasion.25
Caspase-3 (CASP3), a member of the cysteine aspartic acid-specific protease family, is a well-known executive effector interplaying with caspase-8 and 9 to trigger cell apoptosis by cleaving important cellular substrates.26,27 Thus, CASP3 plays a crucial role in cancer development and prognosis.28,29 Recent studies report that miR-34a can induce cell apoptosis by directly or indirectly modulating E2Fs pathway and CASP3 in several types of cancer cells.19,30 However, it is still unclear whether there is a similar mechanism in HCC.
Thus, in this study, we aimed to investigate the effect of miR-34a on transcription factors E2F1 and E2F3 expression, and CASP3 activity, as well as the cell proliferation and metastasis of HCC in two HCC cell lines of Hep3B and SNU-449, and to evaluate the associations of miR-34a, E2F1, and E2F3 expression levels and patient survival in HCC.
Materials and methods
Cell culture
Human HCC cell Hep3B and SNU-449 were both characterized by identity verification with STR (short tandem repeat) analysis for human cell lines in 2018 and purchased from American Type Culture Collection (ATCC, USA). Cells were cultured in Eagle’s Minimum Essential Medium (EMEM, ATCC, USA) and RPMI-1640 medium, respectively, with 10% heat-inactivated FBS (Gibco, USA) in a humidified incubator at 37°C with 5% CO2.
Transfection of miRNA oligonucleotides
Cultured cells (approximately 90% in confluence) were harvested and seeded into each well of 96-well plates at the concentration of 3,000 cells/100 μL, and mixed with 10 μL Opti-MEM, 0.3 μL Lipofectamine RNAiMAX (Thermofisher, USA), and 0.3 μL RNA sample of either miR-34a mimic or control mimic at the final concentration of 0.03 μM. Both miR-34a mimic (5ʹ-UGG CAG UGU CUU AGC UGG UUG U-3ʹ) and control mimic oligos were purchased from Integrated DNA Technologies (Integrated DNA Technologies, USA). The medium was changed for each well next day.
MTS cell proliferation assay
After the RNA transfection, we performed the cell proliferation MTS assay by adding 20 μL of MTS solution (Promega, USA) per well in a dark hood at the different incubation time points (48, 72, 96, and 120 hrs) and then incubated the plates at 37°C following the manufacturer’s instruction. The absorbance was determined at the wavelength of 490 nm by a microplate Spectrophotometer (Biotek, Winooski, USA). Triplicate were conducted for each condition at each time point. The proliferation inhibition rate was calculated using the formula as: inhibition rate=(1-Absorbance of treated sample/Absorbance of control (NC) sample)×100%.
Colony formation assay
Approximately 2,000 cells of either Hep3B or SNU-449 were seeded and scattered equally into each well of 6-well tissue culture plates, and were cultured in 2 mL of the completed medium, respectively. The cells were treated with either miR-34a (intervention group) or control mimic (control group). The medium was replaced with a fresh completed medium on the next day of the transfection, and then every other day. The plates were incubated in a humidified incubator at 37°C with 5% CO2 for 10 days. After each well was gently washed with 1X PBS, the cells were fixed by 4% paraformaldehyde and were dyed with crystal violet. The number of colonies with more than 30 cells was counted.
Wound healing assay
Approximately 1×10⁶ cells were added into each well of 6-well tissue culture plates, the plates were incubated in a humidified incubator at 37°C with 5% CO2, and the medium was refreshed for each well on the next day. When the cell monolayer reached about 90% confluence, a wound scratch in each well was gently made using a 100-μL pipette tip. Cells were then cultured in 2 mL EMEM or RPMI-1640 with 0.1% FBS at 37°C for another 48 hrs. The RNA transfection was carried out simultaneously as aforementioned in the different groups. Images were taken at 0, 12, and 24 hrs, respectively, for the average of wound closure measurement.
Transwell cell invasion assay
Transwell cell invasion assays were performed using the transwell system with 3.0 μm pore size (Falcon, USA). After the Hep3B and SNU-449 cells were transfected with the oligos for 72 hrs, 1×10⁴ cells were seeded in the upper layer of culture insert with the solution containing Matrigel (Corning, USA) and 0.1% FBS medium for each well. Below the cell permeable membrane, 600 μL of 10% FBS medium was added for each chamber. The incubation periods were 24 hrs for SNU-449 and 48 hrs for Hep3B, respectively.31 Cells migrating through the membrane were fixed by 4% paraformaldehyde and were dyed with crystal violet. The upper side of the membrane was cleared softly by neat cotton swab, and the cells in different fields of view on the surface were counted to get an average of cell counts by using an inverted microscope (Olympus, JPN).
Transduction of luciferase lentivirus
Both Hep3B and SNU-449 cells were first transfected CMV-Firefly luciferase-IRES-Puro lentivirus (Cellomics, USA). Briefly, cells were cultured in a 6-well plate at the concentration of 1×10⁵ cells with 2 mL medium containing 10% heat-inactivated FBS in each well. After 12-hr incubation, polybrene was gently mixed with cells at the concentration of 6 μg/mL for 8 hrs prior to the addition of five multiplicity of infection lentivirus in the fresh medium (EMEM or PRMI-1640) which contains 10% heat-inactivated FBS. Cell selection for both the cell lines was conducted for at least 12 days with puromycin. Stable fluorescence signal was analyzed using a 96 Microplate Luminometer (Promega, USA), and the cells were both characterized by identity verification with short tandem repeat analysis for human cell lines.
3D spheroid formation assay
After the transfection with either miR-34a mimic or control mimic into both cell lines carrying a luciferase reporter gene, respectively, we performed 3D spheroid formation by mixing approximately 500 cells with 30 μL of solution which contained phenol-red free matrigel (Corning, USA), and cultured in EMEM or PRMI-1640 medium. One set was used for capturing images from 24 to 96hr incubation time, and another set was used for in vitro bioluminescence signal determination by transferring to a 96-well plate in the presence of D-luciferin (150 μL/mL) (PerkinElmer, USA). Triplicate were conducted for each condition at each time point (24, 48, 72, and 96 hrs). The proliferation inhibition rate was calculated following the formula as: inhibition rate=(1-Absorbance of treated sample [or mock sample]/Absorbance of control sample [NC])×100%.
RNA extraction and quantitative RT-PCR
Total RNA was extracted from the cells of SNU-449 and Hep3B using the RNeasy mini kit (Qiagen, Germany) according to the manufacturer’s instructions. The Epoch microplate spectrophotometer (Biotek, USA) was used to determine the concentration and purity of total RNA. Total RNA was subsequently reverse-transcribed to cDNA using an AffinityScript multi-temperature cDNA synthesis kit (Agilent technologies, CA, USA) per the manufacturer’s instructions. The expression of E2F1, E2F3, and GAPDH genes was determined using the SYBR Green PCR Kit (Qiagen, Germany) on a 7,500 Fast Real-time PCR System (Life Technologies, USA). All the primer sequences used in this study are shown in Table S1. Each sample was analyzed in triplicate, and the qPCR reaction conditions include one cycle of 95°C for 15 mins, followed by 40 cycles of 95°C for 15 s and 60°C for 1 min. The dissociation curve was run after the PCR amplification in each assay. The relative expression levels of E2F1 and E2F3 mRNA are expressed as fold differences relative to GAPDH (as an internal control) using the 2−ΔΔCt method.
Differentiated expression and survival analysis
Two publicly accessed datasets were used to evaluate differentiated expression of E2F1 and E2F3 and the prognostic values of miR-34a, E2F1, and E2F3 in HCC. In Oncomine® dataset (Oncomine®,
Caspase-3 activity
The CaspACETM Assay System was performed in a total volume of 100 μL in 96-well plates following the manufacturer’s protocol. Briefly, for each group, 2×10⁶ cells in 2 mL of the medium were prepared. Induced apoptosis groups were treated with 10 μmol/L miR-34a or control mimic for 72 hrs. For inhibited apoptosis samples, 3 μL Z-VAD-FMK inhibitor was added at the 72 hrs of the transfection. The mock group cells were used as normal control (NC). The plate was incubated for 16 hrs at 37°C in a humidified incubator with 5% CO2. Cells then were harvested to prepare cell lysates. After the centrifugation, the cell supernatant fractions were collected for CASP3 activity measurement. sample was tested using a BCA protein assay kit (Thermofisher Scientific, USA), and the pNA Calibration Curves were also created by a colorimetric assay system. CASP3 Specific Activity (SA) was calculated as the following formulas:

Statistical analysis
Continuous variables are shown as mean±SD. Group comparisons were evaluated by one-way ANOVA. Spearman correlation analyses were performed for the correlation of miR-34a with E2F1/3, and CASP3 gene expression. Meta-analysis was performed for the fold-change of E2F1 and E2F3 using R package 3.5 (
Results
miR-34a suppresses proliferation, migration, and invasion of HCC cell lines in vitro
To investigate the biological relevance of miR-34a in liver cancer in vitro, we cultured both SNU-449 and Hep3B cells with the transfection of either miR-34a mimic or control mimic, respectively. The inhibition rate results showed that the miR-34a groups presented significantly reduced cellular viability (p<0.05) as compared to the mock groups, at each time point (72, 96, and 120 hrs) after the transfection in both Hep3B and SNU-449 cells. Hep3B cells treated by miR-34a reached up to 24.55±4.85% (p=0.001), and SNU-449 climbed to 17.34±5.06% at 120 hrs (p=0.009) (Figure 1A and B). The colony formation assay showed reduced cell colony formation ability in the miR-34a group (Figure 1C and D) with 44.42±6.64% (p=0.032) and 48.78±6.03% (p=0.015) relative colony formation efficiency in Hep3B and SNU-449, respectively, compared with the control groups (Figure 1E). Moreover, wound healing assay showed that cells moved much slower in the miR-34a group than the control and mock group (Figure 2A and C). For Hep3B, the average width of wound gaps in the control group shrunk to 42.15±3.03% of its initial width at 48 hrs, whereas the miR-34a group stayed in 65.35±9.31% of its initial width (p=0.032). Meanwhile, 37.94±9.57% of initial wound width in the control group compared to 61.49±8.24% of initial width in the miR-34a group of SNU-449 cell (p=0.015) (Figure 2B and D). Similarly, in transwell cell invasion assay, the cells treated with miR-34a displayed much weaker invasive ability than both the mock and control groups (Figure 2E and G). For SNU-449, the average migrating cell counts in the control group were 239.67±13.32 compared to 144±9.85 of the miR-34a group (p<0.001). For Hep3B, the invading cell numbers were 219.67±20.13 of the control group compared to 165.67±11.06 of the miR-34a group (p=0.025) (Figure 2F and H).
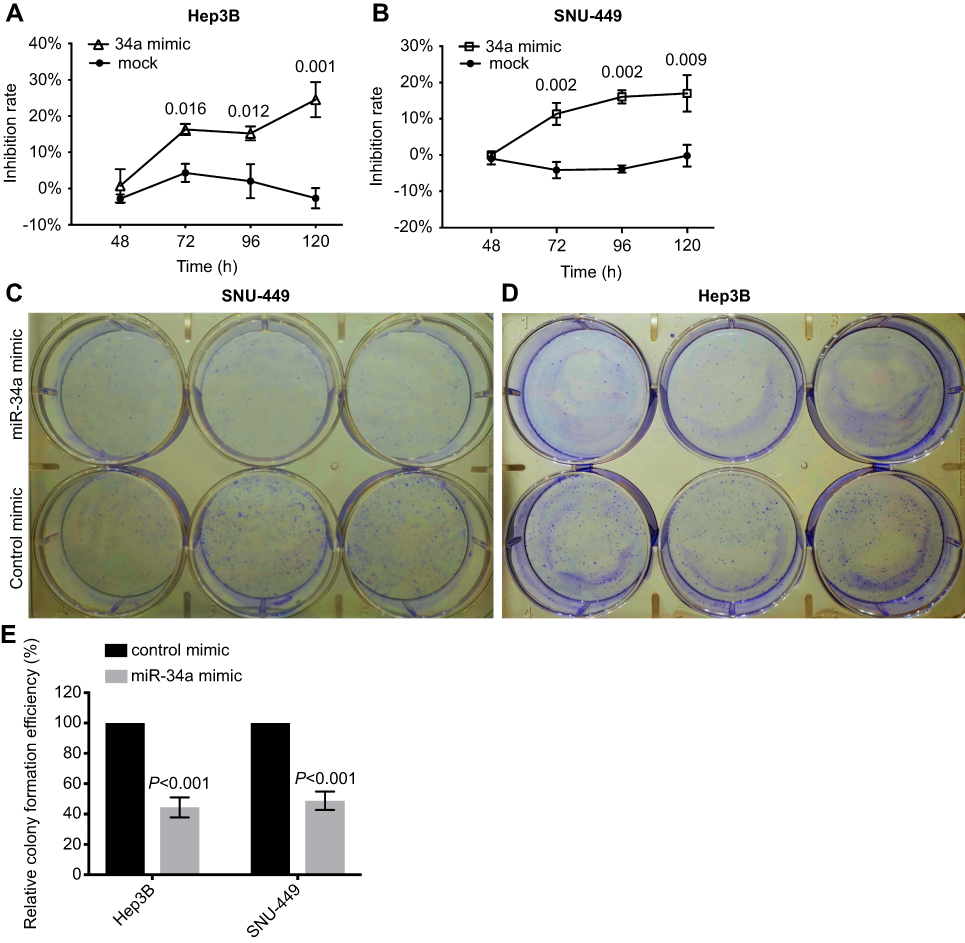 | Figure 1 miR-34a suppressed the proliferation and colony formation of Hep3B and SNU-449. Relative inhibition rates of Hep3B (A) and SNU-449 (B) in response to miR-34a, and mock group were calculated by comparing the OD value of miR-34a mimic or mock to NC, at 48, 72, 96, and 120 hrs, respectively. The representative colony formation of SNU-449 (C) and Hep3B (D) cells transfected by miR-34a and control mimics. The relative colony formation efficiency also showed significant reduction of amount of colonies of SNU-449 and Hep3B (E) in miR-34a mimic groups. Data are presented as the mean±SD (miR-34a mimic vs control mimic).Abbreviation: NS, non-significant. |
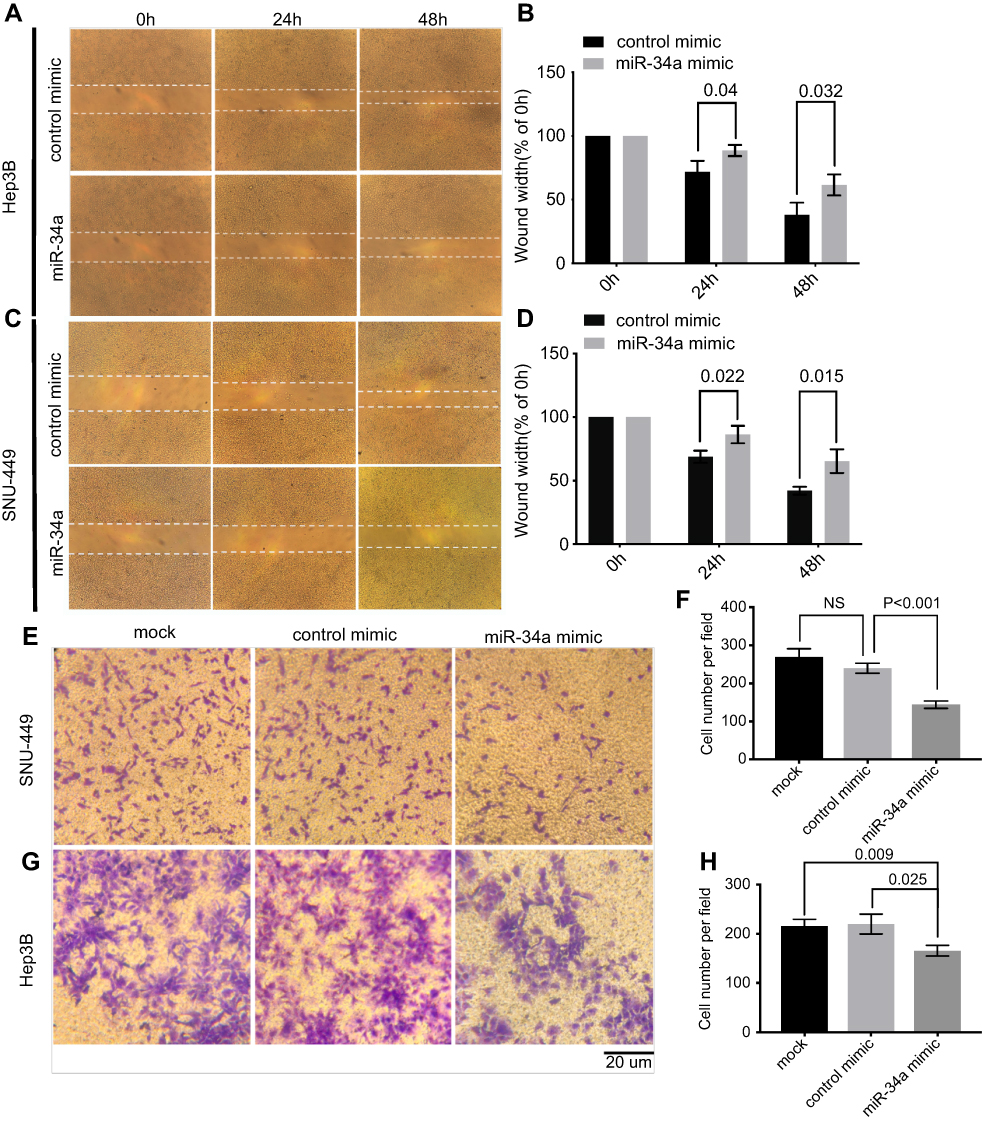 | Figure 2 miR-34a inhibited the migration and invasion ability of SNU-449 and Hep3B cells. The wound healing assay was made in Hep3B (A) and SNU-449 (C) transfected with miR-34a mimic or control mimic at 0, 24, and 48 hrs, respectively. The bar graphics present the percentage of wound recovery in Hep3B (B) and SNU-449 (D). We can observe that control mimic stimulated cells to close the wound faster than miR-34a. Transwell invasion assay for SNU-449 (E) and Hep3B (G) cells transfected by miR-34a, control mimic group and mock, and images were taken after 24 and 48-hr incubation, respectively. The average cell number was counted by three randomly chosen different fields in SNU-449 (F) and Hep3B cells (H). Values represent the mean±SD.Abbreviation: NS, non-significant. |
Inhibition of 3D spheroid formation by mir-34a
To investigate the inhibition of 3D spheroid formation by miR-34a, we cultured both Hep3B and SNU-449 cells, each of which carries the luciferase reporter gene, in Matrigel. The dynamic changes of cells spheroid formation are shown in Figure 3A and B. For Hep-3B, the relative cell cross-sectional area of the miR-34a group grew to 106.67±1.25%, and showed a significant difference compared to 192.67±9.53% (p<0.001) of the control group at 96 hrs. For SNU-449, a significant difference in the average spheroid area between the miR-34a group and the control group was shown from 48 to 96 hrs (Figure 3C and D).
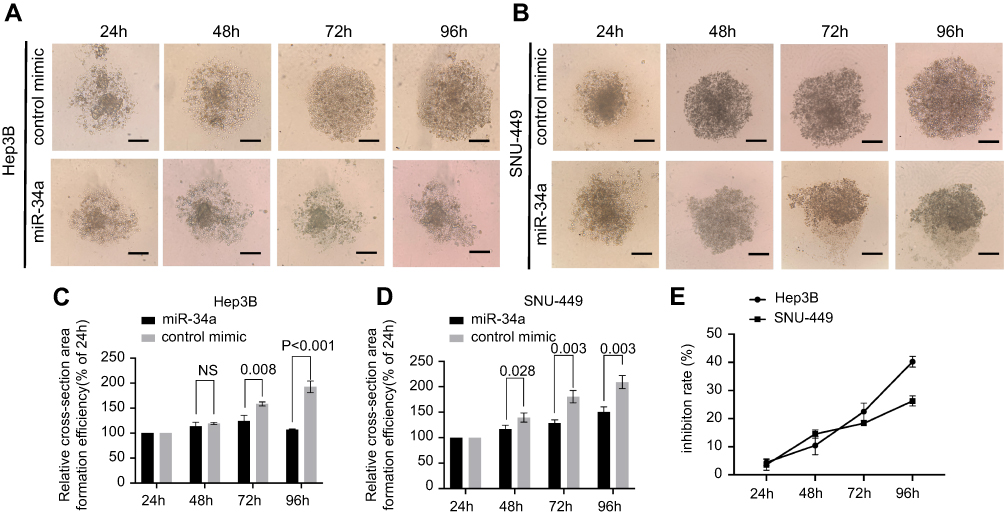 | Figure 3 miR-34a inhibited the spheroid formation of Hep3B and SNU-449 cells. The representative 3D spheroid models of Hep3B (A) and SNU-449 cells (B) transfected by miR-34a and control mimics. The relative cross-sectional area showed significant reduction of Hep3B (C) and SNU-449 spheroid (D) in miR-34a mimic groups. Relative inhibition rates of Hep3B and SNU-449 spheroid formation (E) in response to miR-34a were calculated by dividing the fluorescence value of miR-34a mimic by that of control mimic at 24, 48, 72, and 96 hrs, respectively.Abbreviation: NS, not-significant. |
Moreover, the luciferase reporter gene assays in 3D culture system showed that, for Hep3B cells, the inhibition rate increased from 4.44±1.03% (24 hrs) to 40.22±1.56% (96 hrs) and that for SNU-449 cell, the inhibition rate increased from 3.58±1.57% (24 hrs) to 26.28±1.45% (96 hrs) (Figure 3E).
miR-34a reduces the expression of E2F1 and E2F3
Based on the prediction algorithm of TargetScan (
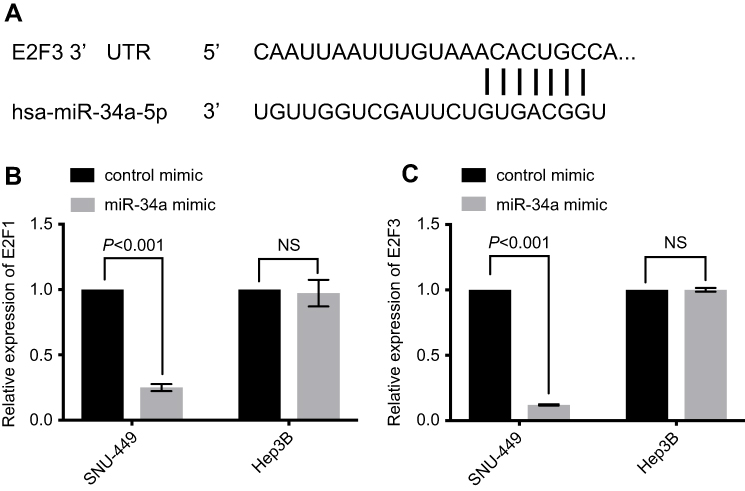 | Figure 4 E2F1 and E2F3 were downregulated by miR-34a overexpression. E2F3 3ʹ-UTR contains a predicted binding site of miR-34a (A). The relative expression level of E2F1 (B) and E2F3 (C) in HCC cells.Abbreviations: HCC, hepatocellular carcinoma; NS, non-significant. |
miR-34a promotes caspase-3 activity
As displayed by the results, the CASP3 activities of the miR-34a group was significantly higher than the inhibited apoptosis group or blank group, in both Hep3B and SNU-449 cells (Figure 5A and B) (p<0.05). The caspase-3 SA also showed a similar trend that the miR-34a group held a higher SA value than the control group (Figure 5C) (p<0.05).
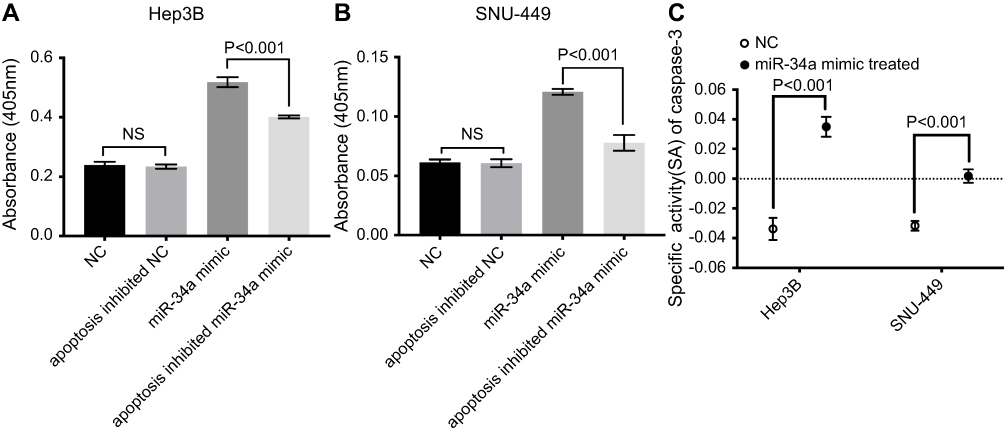 | Figure 5 miR-34a improved CASP3 activity. The absorbance was higher in the miR-34a group than NC, apoptosis inhibited NC and apoptosis inhibited miR-34a group in Hep3B (A) and SNU-449 (B), respectively. (C) CASP3-specific activities were significantly higher in miR-34a treated group compared to NC in both cell lines. Abbreviations: NC, negative control; NS, non-significant. |
E2F1 and E2F3 are overexpressed in primary HCC
To examine the expression of E2F1 and E2F3 in primary HCC compared to normal tissues, we retrieved the gene expression data published in literature that are archived in a publicly accessed database of Oncomine® and conducted a random-effects model for a pooled fold-change in log2 using meta-analysis. We found that in primary HCC compared to normal tissues, the expression of E2F3 was significantly upregulated (log2(fold-change)=0.95, 95% CI: 0.55–1.34, or fold-change =1.93, 95% CI: 1.46–2.53), whereas the expression of E2F1 was significantly but weaker upregulated (log2(fold-change)=0.38, 95% CI: 0.12–0.63, or fold-change =1.30, 95% CI: 1.09–1.54) (Figure 6A and B).
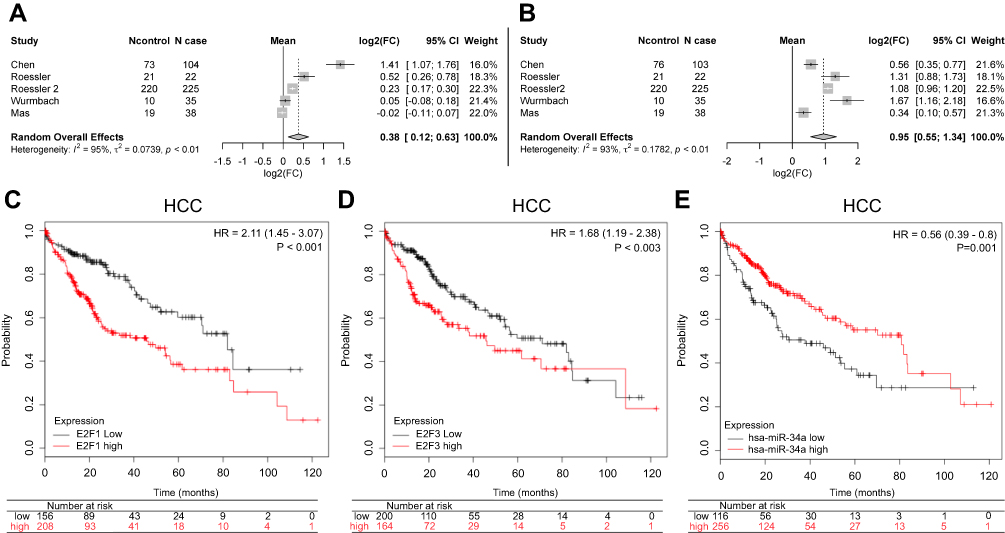 | Figure 6 Meta-analysis of the differential expression of E2F1 and E2F3, and the Kaplan–Meier survival curves of E2F1, E2F3, and miR-34a in HCC. Meta-analysis for the differential expression of E2F1 (A) and E2F3 (B) in primary HCC tissues (N cases) compared to normal tissues (N control), respectively, with a random-effects model (CI; I-squared measures the degree of heterogeneity in meta-analyses). HCC patients with either high E2F1 (C), or high E2F3 (D), or low miR-34a (E) had an inferior overall survival compared to those with either low E2F1, or low E2F3, or high miR-34a, respectively.Abbreviation: HCC, hepatocellular carcinoma. |
Prognostic values of mir-34a, E2F1, and E2F3 in HCC
The overall survival curves of HCC patients were generated by Kaplan-Meier plotter based on the binary category of either miR-34a, or E2F1 and E2F3, and the results are illustrated in Figure 6. Patients with a high level of E2F1 suffered worse prognosis than those with a low one (HR=2.11, 95% CI: 1.45–3.07, p<0.001) (Figure 6C). Similarly, a high E2F3 level was significantly positively associated with poor prognosis (HR=1.68, 95% CI: 1.19–2.38, p=0.003) (Figure 6D). Oppositely, patients with a high miR-34a level had a significantly reduced risk of death compared to those with a low one (HR=0.56, 95% CI: 0.39–0.80, p=0.001) (Figure 6E).
Correlation between miR-34a and E2F1/E2F3, and CASP3 expression in HCC
By combining miRNA and mRNA sequencing data in a HCC TCGA dataset, we performed Spearman correlation analyses. The results showed that there was a significantly negative correlation between miR-34a and E2F3 (correlation coefficient =−0.15, p=0.003), whereas no significant correlation between miR-34a and either E2F1 (correlation coefficient =−0.01, p=0.78) and CASP3 (correlation coefficient =−0.05, p=0.30) (Figures S1A–C).
Discussion
miRNAs are a potential tool in the treatment of tumors since the dysregulation of miRNA frequently occurs in human cancer.34 Overexpression of miR-34a was associated with better prognosis in breast cancer patients.35 The similar relevance has also been observed in HCC patients in recent studies.9,36 In the present study, we found that the enforced overexpression of miR-34a could significantly inhibit the progression of both HCC cell lines in 2D and 3D cell cultured systems, as expected. These findings of in vitro experiments are consistent with the patient survival analysis in this study, which showed that HCC patients with a high miR-34a expression level had better survival than those with a low one.
It has been shown that miR-34a could induce cell apoptosis by regulating the expression of p53, bcl-2, cyclin D1, or IL-2 in human cancer such as lymphoma, lung cancer, prostate cancer, and liver cancer cell lines (MIHA, Huh7, Bel-7404).4,11,13,37–39 In HCC, aberrant expression of miR-34a has been associated with cancer metastasis and invasion through regulating c-MET pathway, or cell cycle and p53 pathways.40 miR-34a/toll-like receptor 4 axis also contributes to the development of HCC.41 The involvement of miR-34a/β-catenin/CCND1 pathway has been shown in the processes of apoptosis.42 The E2Fs play an important role in cell cycle regulation and apoptosis.43 E2F1 and E2F3, especially, are transcriptional activators that can regulate DNA replication, mitosis, apoptosis, and centrosome duplication.44,45 Overexpression of E2Fs is frequently observed in advanced cancer diseases and aggravates chemoresistance.46 In this study, our results showed the upregulation of E2F1 or E2F3 in primary HCC compared to normal tissues. Moreover, our analysis also indicated that a high expression level of either E2F1 or E2F3 was significantly associated with poor prognosis in HCC patients. In line with these in vivo findings, the transfection of suppressor miR-34a could significantly downregulate E2F1 and E2F3 expression, particularly in SNU-449 cell line. Given that E2F3 is a target of miR-34a, the significant reduction of E2F3 by miR-34a is as expected and in line with the in vivo negative correlation between miR-34a and E2F3. Interestingly, although E2F1 is not a predicted target of miR-34a, the miR-34a-mediated E2F1 suppression was still observed in vitro. This finding suggests that there may have an indirect mechanism(s) underlying the miR-34a-mediated E2F1 inhibition.19,47 Moreover, these findings add evidence in the context of miR-34a suppression of tumor development and progression by regulating E2F1 and E2F3.25,30,48,49
Intriguingly, there are different response patterns in the change of E2F1 and E2F3 to the enforced overexpression of miR-34a between Hep3B and SNU-449 cell lines, although both cell lines showed similar miR-34a-mediated suppression phenotypes in 2D and 3D culture systems in this study. The discrepancy of miR-34a in targeting E2F1 and E2F3 between Hep3B and SNU-449 suggests that multiple pathways may be involved in the antitumor function of miR-34a.
CASP3 is a critical factor in cell apoptosis. Its activation as a result of the growth factor withdrawal or initiation of the Fas/Apo-1 receptor triggers the programmed cell death.50,51 Inactivation or low expression level of CASP3 often occurs in many kinds of cancer, and makes cells resistant to microenvironmental stress and treatments, thereby promoting tumorigenesis.52,53 The expression of CASP3 is regulated by miR-34a.54–56 miR-34a induces cellular apoptosis partly by provoking CASP3 activity in both ovarian cancer and PC12 cells.55 In line with these observations, we found that the enforced expression of miR-34a remarkably improved CASP3 activity in both Hep3B and SNU-449 cells, suggesting that miR-34a facilitates the activation of CASP3, thereby activating cell apoptosis. Given that these two cell lines are derived from different genetic backgrounds (Hep3B was from an African patient, and SNU-449 from an Asian patient), this unexpected but intriguing phenomenon that E2F1, E2F3, and CASP3 displayed different responses to the miR-34a overexpression suggested that the efficacy of miR-34a might be race-dependent with different mechanisms. The similar phenomenon of gefitinib was reported, which has different therapeutic effects on non-small-cell lung cancer patients with different genetic backgrounds.57 Moreover, no significant correlation results in vivo between miR-34a and either CASP3 or E2F1 suggest that more complex systems and heterogeneity in vivo exist than in vitro cell line experiments.
HBV-associated HCC has been reported to possess stronger stemness. The underlying mechanisms include that HBx (Hepatits B virusxprotein) functions as an oncogenic transactivator regulating cancer stem-related genes, such as MDM2, CXCR4, and OV690, increasing the activity of E2F1 via inhibiting pRb, and further inducing DNA methyltransferase 1 (DNMT1) activation.58–60 In addition, the downregulation of miR-34a in HBV-associated HCC might result from HBx-induced p53 inhibition. Therefore, the restoration of miR-34a may work more efficiently against HBV-associated HCC than other types.
The potential of tumor suppressor miR-34a prompted a Phase I clinical trial of MRX34 liposomal injection [NCT01829971] in patients with primary liver cancer or other solid malignancies several years ago. Due to severe iREs, unfortunately, the trial has been terminated.15 This suggests that miR-34a may directly or indirectly off-target other genes, eg, pro-inflammatory or antigen presentation-related molecules, besides those that are involved in tumorigenesis. However, the events of iRE prompt us to design novel approaches to target delivery of miR-34a (eg, encapsulated in nanoparticles), restricting iRE without sacrificing its therapeutic effect. Undoubtedly, more investigation of miR-34 against tumors from bench to bed is still necessary, including molecular mechanisms, delivery vehicles, and immune response. Better understanding of miR-34a pathway(s) may help us to design novel strategies in pharmaceutical targets. For example, E2Fs-based antibodies or RNA-targeting small molecules rather than the application of miR-34a mimic which has hundreds of molecule targets may minimize the potential adverse effects induced by MRX-34.
In conclusion, we demonstrated the associations of miR-34a, E2F1, and E2F3 with HCC patient survival in vivo. To our best knowledge, it is the first study that revealed the effects of miR-34a on the expression of E2F1 and E2F3, as well as CASP3 activity in HCC cells, as well as inhibitive effect of miR-34a on 3D spheroid formation. Our findings suggest that suppressor miR-34a could regulate E2F1, E2F3, and CASP3, thereby inhibiting HCC proliferation and metastasis.
Abbreviation list
SA, specific activity; CASP3, caspase-3; HCC, hepatocellular carcinoma; E2F1, E2 promoter-binding factor-1; E2F2, E2 promoter-binding factor-2; E2F3, E2 promoter-binding factor-3; miR-34a, microRNA-34a; HBx, hepatits B virus x; CSCs, cancer stem cells.
Availability of data and material
Data for survival analysis during the current study is available in KMplotter (
Acknowledgments
We thank Dr. Fengqin Shi for her technical support in vitro assays.
Author contributions
All authors contributed to data analysis, drafting and revising the article, gave final approval of the version to be published, and agree to be accountable for all aspects of the work.
Disclosure
The authors report no conflicts of interest in this work.
References
1. Park JW, Chen M, Colombo M, et al.Global patterns of hepatocellular carcinoma management from diagnosis to death: the BRIDGE Study. Liver Int. 2015;35(9):2155–2166. doi:10.1111/liv.12818
2. Torre LA, Bray F, Siegel RL, Ferlay J, Lortet-Tieulent J, Jemal A Global cancer statistics, 2012. CA Cancer J Clin. 2015;65(2):87–108. doi:10.3322/caac.21294
3. Lozano R, Naghavi M, Foreman K, et al. Global and regional mortality from 235 causes of death for 20 age groups in 1990 and 2010: a systematic analysis for the global burden of disease study 2010. Lancet. 2012;380(9859):2095–2128. doi:10.1016/S0140-6736(12)61728-0
4. Ringelhan M, O’Connor T, Protzer U, Heikenwalder M The direct and indirect roles of HBV in liver cancer: prospective markers for HCC screening and potential therapeutic targets. J Pathol. 2015;235(2):355–367. doi:10.1002/path.4434
5. Thorgeirsson SS, Stemness in Liver Cancer. Dig Dis, 2017. 35(4):
6. Han R, Li S Regorafenib delays the proliferation of hepatocellular carcinoma by inducing autophagy. Pharmazie. 2018;73(4):218–222.
7. Sim HW, Knox J Hepatocellular carcinoma in the era of immunotherapy. Curr Probl Cancer. 2018;42(1):40–48. doi:10.1016/j.currproblcancer.2017.10.007
8. Tryndyak VP, Ross SA, Beland FA, Pogribny IP Down-regulation of the microRNAs miR-34a, miR-127, and miR-200b in rat liver during hepatocarcinogenesis induced by a methyl-deficient diet. Mol Carcinog. 2009;48(6):479–487. doi:10.1002/mc.20484
9. Ren FH, Yang H, He RQ, et al.Analysis of microarrays of miR-34a and its identification of prospective target gene signature in hepatocellular carcinoma. BMC Cancer. 2018;18(1):12. doi:10.1186/s12885-018-4242-8
10. Chen Q, Li L, Tu Y, et al.MiR-34a regulates apoptosis in liver cells by targeting the KLF4 gene. Cell Mol Biol Lett. 2014;19(1):52–64. doi:10.2478/s11658-013-0115-y
11. Li J, Lam M. Reproducibility project: cancer B. Registered report: the microRNA miR-34a inhibits prostate cancer stem cells and metastasis by directly repressing CD44. Elife. 2015;4:e06434. doi:10.7554/eLife.06416
12. Li R, Shi X, Ling F, et al.MiR-34a suppresses ovarian cancer proliferation and motility by targeting AXL. Tumour Biol. 2015;36(9):7277–7283. doi:10.1007/s13277-015-3445-8
13. Craig VJ, Tzankov A, Flori M, Schmid CA, Bader AG, Muller A Systemic microRNA-34a delivery induces apoptosis and abrogates growth of diffuse large B-cell lymphoma in vivo. Leukemia. 2012;26(11):2421–2424. doi:10.1038/leu.2012.110
14. Wiggins JF, Ruffino L, Kelnar K, et al. Development of a lung cancer therapeutic based on the tumor suppressor microRNA-34. Cancer Res. 2010;70(14):5923–5930. doi:10.1158/0008-5472.CAN-10-0655
15. Beg MS, Brenner AJ, Sachdev J, et al. (2017). Phase I study of MRX34, a liposomal miR-34a mimic, administered twice weekly in patients with advanced solid tumors. Invest New Drugs. 35(2): 180–188. doi:10.1007/s10637-016-0407-y
16. Gaubatz S, Lindeman GJ, Ishida S, et al. E2F4 and E2F5 play an essential role in pocket protein-mediated G1 control. Mol Cell. 2000;6(3):729–735. doi:10.1016/S1097-2765(00)00071-X
17. Carr SM, Poppy Roworth A, Chan C, La Thangue NB Post-translational control of transcription factors: methylation ranks highly. FEBS J. 2015;282(23):4450–4465. doi:10.1111/febs.13524
18. Sun CC, Zhou Q, Hu W, et al. Transcriptional E2F1/2/5/8 as potential targets and transcriptional E2F3/6/7 as new biomarkers for the prognosis of human lung carcinoma. Aging (Albany NY). 2018;10(5):973–987. doi:10.18632/aging.101446
19. Tazawa H, Tsuchiya N, Izumiya M, Nakagama H Tumor-suppressive miR-34a induces senescence-like growth arrest through modulation of the E2F pathway in human colon cancer cells. Proc Natl Acad Sci USA 2007;104(39):15472–15477. doi:10.1073/pnas.0707351104
20. Tammali R, Saxena A, Srivastava SK, Ramana KV Aldose reductase regulates vascular smooth muscle cell proliferation by modulating G1/S phase transition of cell cycle. Endocrinology. 2010;151(5):2140–2150. doi:10.1210/en.2010-0412
21. Shan ZN, Tian R, Zhang M, et al.miR128-1 inhibits the growth of glioblastoma multiforme and glioma stem-like cells via targeting BMI1 and E2F3. Oncotarget. 2016;7(48):78813–78826. doi:10.18632/oncotarget.12385
22. Santos M, Martinez-Fernandez M, Duenas M, et al. In vivo disruption of an Rb-E2F-Ezh2 signaling loop causes bladder cancer. Cancer Res. 2014;74(22):6565–6577. doi:10.1158/0008-5472.CAN-13-3514
23. Suzuki T, Yasui W, Yokozaki H, Naka K, Ishikawa T, Tahara E Expression of the E2F family in human gastrointestinal carcinomas. Int J Cancer. 1999;81(4):535–538.
24. Huang CL, Liu D, Nakano J, et al. E2F1 overexpression correlates with thymidylate synthase and survivin gene expressions and tumor proliferation in non small-cell lung cancer. Clin Cancer Res. 2007;13(23):6938–6946. doi:10.1158/1078-0432.CCR-07-1539
25. Kent LN, Bae S, Tsai SY, et al. Dosage-dependent copy number gains in E2F1 and E2F3 drive hepatocellular carcinoma. J Clin Invest 2017;127(3):830–842. doi:10.1172/JCI87583
26. Zhang C, Wang M, Shi C, Shi F, Pei C Long non-coding RNA Linc00312 modulates the sensitivity of ovarian cancer to cisplatin via the Bcl-2/Caspase-3 signaling pathway. Biosci Trends. 2018;12(3):309–316. doi:10.5582/bst.2018.01052
27. Zhu J, Zhang W, Zhang Y, Wang Y, Liu M, Liu Y Effects of Spica prunellae on caspase-3-associated proliferation and apoptosis in human lung cancer cells in vitro. J Cancer Res Ther. 2018;14(4):760–763. doi:10.4103/jcrt.JCRT_1289_16
28. Cui R, Meng W, Sun HL, et al.MicroRNA-224 promotes tumor progression in nonsmall cell lung cancer. Proc Natl Acad Sci USA 2015;112(31):E4288–97. doi:10.1073/pnas.1502068112
29. Brown MF, Leibowitz BJ, Chen D, et al.Loss of caspase-3 sensitizes colon cancer cells to genotoxic stress via RIP1-dependent necrosis. Cell Death Dis. 2015;6:e1729.
30. Xiang W, Lin H, Wang Q, et al.miR34a suppresses proliferation and induces apoptosis of human lens epithelial cells by targeting E2F3. Mol Med Rep. 2016;14(6):5049–5056. doi:10.3892/mmr.2016.5901
31. Liu X, Wu X Utilizing matrigel transwell invasion assay to detect and enumerate circulating tumor cells. Methods Mol Biol. 2017;1634:277–282.
32. Lin M, Tang S, Zhang C, et al.Euphorbia factor L2 induces apoptosis in A549 cells through the mitochondrial pathway. Acta Pharm Sin B. 2017;7(1):59–64. doi:10.1016/j.apsb.2016.06.008
33. Pulikkan JA, Peramangalam PS, Dengler V, et al.C/EBPalpha regulated microRNA-34a targets E2F3 during granulopoiesis and is down-regulated in AML with CEBPA mutations. Blood. 2010;116(25):5638–5649. doi:10.1182/blood-2010-04-281600
34. Lewis BP, Burge CB, Bartel DP Conserved seed pairing, often flanked by adenosines, indicates that thousands of human genes are microRNA targets. Cell. 2005;120(1):15–20. doi:10.1016/j.cell.2004.12.035
35. Adams BD, Parsons C, Slack FJ The tumor-suppressive and potential therapeutic functions of miR-34a in epithelial carcinomas. Expert Opin Ther Targets. 2016;20(6):737–753. doi:10.1517/14728222.2016.1114102
36. Sun TY, Xie HJ, Li Z, et al.miR-34a regulates HDAC1 expression to affect the proliferation and apoptosis of hepatocellular carcinoma. Am J Transl Res. 2017;9(1):103–114.
37. Chen R, Zhu D, Ye X, Shen D, Lu R Establishment of three human liver carcinoma cell lines and some of their biological characteristics in vitro. Sci Sin. 1980;23(2):236–247.
38. Xiao Z, Li CH, Chan SL, et al.A small-molecule modulator of the tumor-suppressor miR34a inhibits the growth of hepatocellular carcinoma. Cancer Res. 2014;74(21):6236–6247. doi:10.1158/0008-5472.CAN-13-3514
39. Daige CL, Wiggins JF, Priddy L, Nelligan-Davis T, Zhao J, Brown D Systemic delivery of a miR34a mimic as a potential therapeutic for liver cancer. Mol Cancer Ther. 2014;13(10):2352–2360. doi:10.1158/1535-7163.MCT-14-0209
40. Xiao Z, Li CH, Chan SL, et al.A small-molecule modulator of the tumor-suppressor miR34a inhibits the growth of hepatocellular carcinoma. Cancer Res. 2014;74(21):6236–6247. doi:10.1158/0008-5472.CAN-13-3514
41. Jiang ZC, Tang XM, Zhao YR, Zheng L A functional variant at miR-34a binding site in toll-like receptor 4 gene alters susceptibility to hepatocellular carcinoma in a Chinese Han population. Tumour Biol. 2014;35(12):12345–12352. doi:10.1007/s13277-014-2547-z
42. Dang Y, Luo D, Rong M, Chen G Underexpression of miR-34a in hepatocellular carcinoma and its contribution towards enhancement of proliferating inhibitory effects of agents targeting c-MET. PLoS One. 2013;8(4):e61054. doi:10.1371/journal.pone.0061054
43. Tammali R, Saxena A, Srivastava SK, Ramana KV Aldose reductase regulates vascular smooth muscle cell proliferation by modulating G1/S phase transition of cell cycle. Endocrinology. 2010;151(5):2140–2150. doi:10.1210/en.2010-0412
44. Lee M, Oprea-Ilies G, Saavedra HI Silencing of E2F3 suppresses tumor growth of Her2+ breast cancer cells by restricting mitosis. Oncotarget. 2015;6(35):37316–37334. doi:10.18632/oncotarget.5686
45. Wei WY, Yan LH, Wang XT, et al.E2F-1 overexpression inhibits human gastric cancer MGC-803 cell growth in vivo. World J Gastroenterol. 2015;21(2):491–501. doi:10.3748/wjg.v21.i10.2937
46. Fang Z, Gong C, Liu H, et al.E2F1 promote the aggressiveness of human colorectal cancer by activating the ribonucleotide reductase small subunit M2. Biochem Biophys Res Commun. 2015;464(2):407–415. doi:10.1016/j.bbrc.2015.06.157
47. Polager S, Ginsberg D p53 and E2f: partners in life and death. Nat Rev Cancer. 2009;9(10):738–748. doi:10.1038/nrc2718
48. Gala S, Marreiros A, Stewart GJ, Williamson P Overexpression of E2F-1 leads to cytokine-independent proliferation and survival in the hematopoietic cell line BaF-B03. Blood. 2001;97(1):227–234.
49. Zauli G, Voltan R, Di Iasio MG, et al. miR-34a induces the downregulation of both E2F1 and B-Myb oncogenes in leukemic cells. Clin Cancer Res. 2011;17(9):2712–2724. doi:10.1158/1078-0432.CCR-10-3244
50. Atkinson EA, Barry M, Darmon AJ, et al. Cytotoxic T lymphocyte-assisted suicide. Caspase 3 activation is primarily the result of the direct action of granzyme B J Biol Chem. 1998;273(33):21261–21266. doi:10.1074/jbc.273.33.21261
51. Huang Q, Zheng Y, Ou Y, et al.miR-34a/Bcl-2 signaling pathway contributes to age-related hearing loss by modulating hair cell apoptosis. Neurosci Lett 2017;661:51–56. doi:10.1016/j.neulet.2017.07.044
52. Noble P, Vyas M, Al-Attar A, Durrant S, Scholefield J, Durrant L High levels of cleaved caspase-3 in colorectal tumour stroma predict good survival. Br J Cancer. 2013;108(10):2097–2105. doi:10.1038/bjc.2012.494
53. Jakubowska K, Guzinska-Ustymowicz K, Famulski W, Cepowicz D, Jagodzinska D, Pryczynicz A Reduced expression of caspase-8 and cleaved caspase-3 in pancreatic ductal adenocarcinoma cells. Oncol Lett. 2016;11(3):1879–1884. doi:10.3892/ol.2016.4099
54. Zhou Y, Xiong M, Niu J, et al.Secreted fibroblast-derived miR-34a induces tubular cell apoptosis in fibrotic kidney. J Cell Sci. 2014;127(Pt 20):4494–4506. doi:10.1242/jcs.154054
55. Ding N, Wu H, Tao T, Peng E NEAT1 regulates cell proliferation and apoptosis of ovarian cancer by miR-34a-5p/BCL2. Onco Targets Ther. 2017;10:4905–4915. doi:10.2147/OTT.S142446
56. Li LH, Tu QY, Deng XH, et al.Mutant presenilin2 promotes apoptosis through the p53/miR-34a axis in neuronal cells. Brain Res. 2017;1662:57–64. doi:10.1016/j.brainres.2017.01.034
57. Kaneda H, Tamura K, Kurata T, Uejima H, Nakagawa K, Fukuoka M Retrospective analysis of the predictive factors associated with the response and survival benefit of gefitinib in patients with advanced non-small-cell lung cancer. Lung Cancer. 2004;46(2):247–254. doi:10.1016/j.lungcan.2004.04.032
58. Wang C, Wang MD, Cheng P, et al.Hepatitis B virus X protein promotes the stem-like properties of OV6(+) cancer cells in hepatocellular carcinoma. Cell Death Dis. 2017;8(1):e2560. doi:10.1038/cddis.2017.518
59. Choi BH, Choi M, Jeon HY, Rho HM Hepatitis B viral X protein overcomes inhibition of E2F1 activity by pRb on the human Rb gene promoter. DNA Cell Biol. 2001;20(2):75–80. doi:10.1089/104454901750070274
60. Jung JK, Arora P, Pagano JS, Jang KL Expression of DNA methyltransferase 1 is activated by hepatitis B virus X protein via a regulatory circuit involving the p16INK4a-cyclin D1-CDK 4/6-pRb-E2F1 pathway. Cancer Res. 2007;67(12):5771–5778. doi:10.1158/0008-5472.CAN-07-0529
61. Chen X, Cheung ST, So S, et al. Gene expression patterns in human liver cancers. Mol Biol Cell. 2002;13(6):1929–1939. doi:10.1091/mbc.e02-03-0157
62. Roessler S, Jia HL, Budhu A, et al. A unique metastasis gene signature enables prediction of tumor relapse in early-stage hepatocellular carcinoma patients. Cancer Res. 2010;70(24):10202–10212. doi:10.1158/0008-5472.CAN-10-2607
63. Wurmbach E, Chen YB, Khitrov G, et al. Genome wide molecular profiles of HCV-induced dysplasia and hepatocellular carcinoma. Hepatology. 2007;45(4):938–947. doi:10.1002/hep.21622
64. Mas VR, Maluf DG, Archer KJ, et al. Genes involved in viral carcinogenesis and tumor initiation in hepatitis C virus-induced hepatocellular carcinoma. Mol Med. 2009;15(3–4):85–94. doi:10.2119/molmed.2008.00110
Supplementary materials
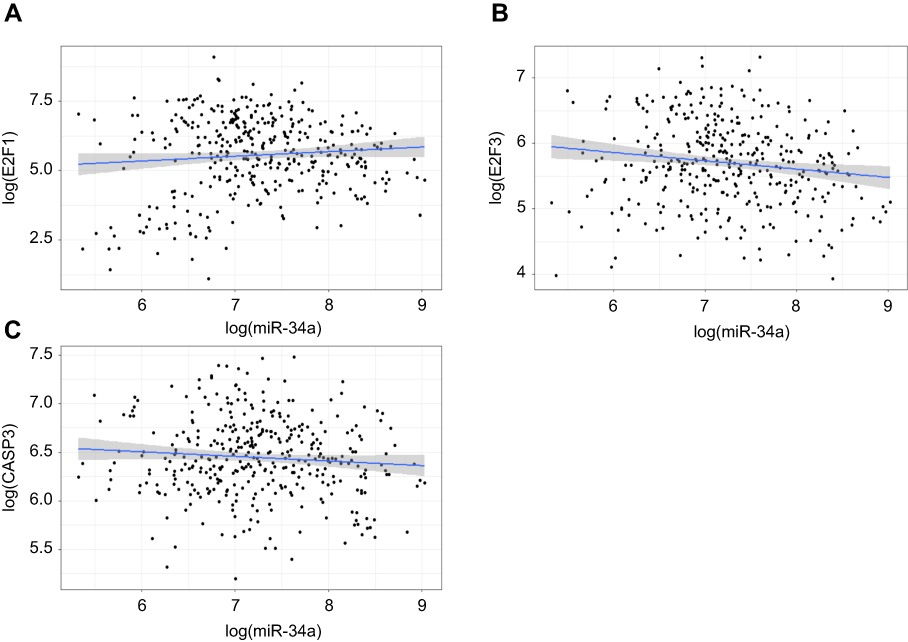 | Figure S1 Correlation analyses of the associations between miR-34a and E2F1/3, CASP3. The results show a significantly negative correlation between miR-34a and E2F3 (correlation coefficient =−0.15, p-value=0.003) (B), whereas no significant correlation between miR-34a and either E2F1 (correlation coefficient =−0.01, p-value=0.78) (A) and CASP3 (correlation coefficient =−0.05, p-value=0.30) (C). |
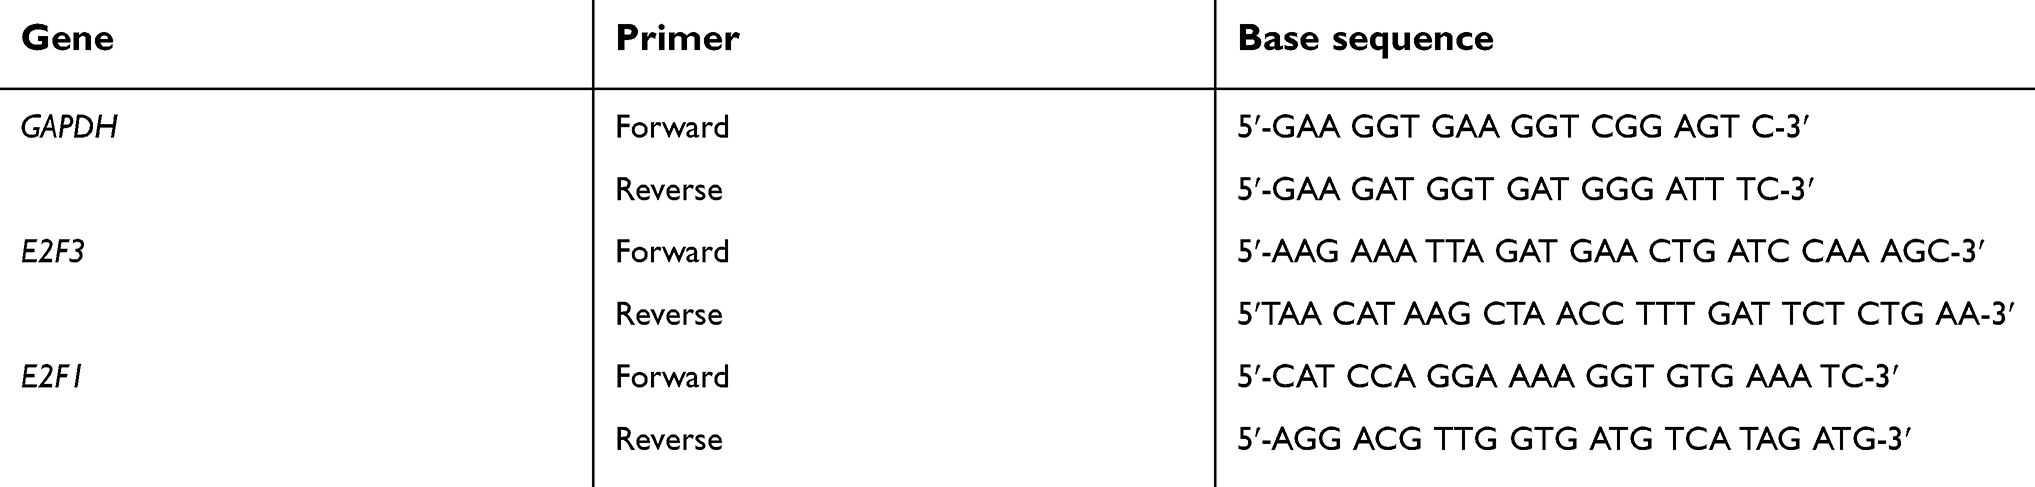 | Table S1 Oligo primer sequences of genes in this study |
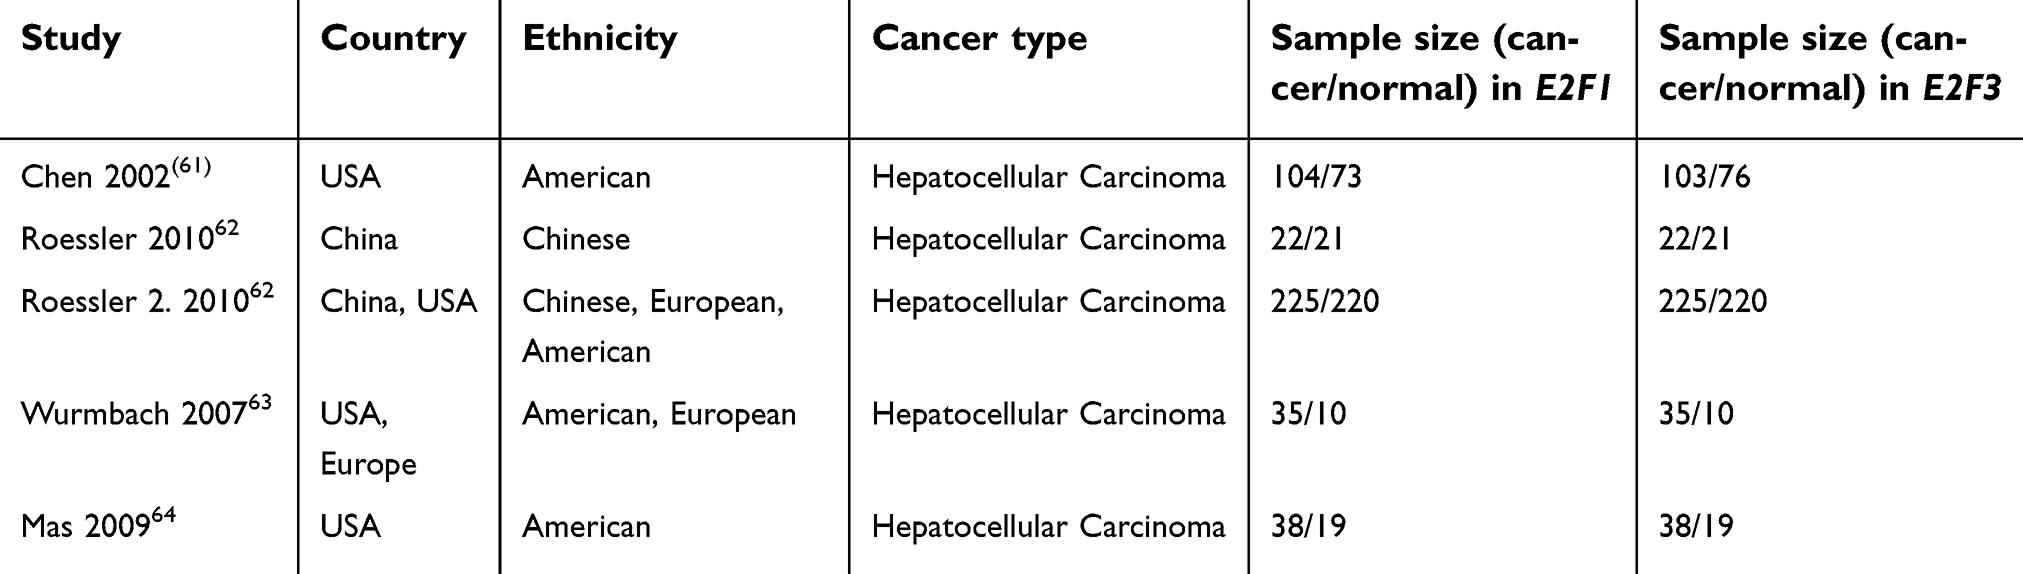 | Table S2 Characteristics of populations and cancer types of the studies included in the meta-analysis |
 © 2019 The Author(s). This work is published and licensed by Dove Medical Press Limited. The full terms of this license are available at https://www.dovepress.com/terms.php and incorporate the Creative Commons Attribution - Non Commercial (unported, v3.0) License.
By accessing the work you hereby accept the Terms. Non-commercial uses of the work are permitted without any further permission from Dove Medical Press Limited, provided the work is properly attributed. For permission for commercial use of this work, please see paragraphs 4.2 and 5 of our Terms.
© 2019 The Author(s). This work is published and licensed by Dove Medical Press Limited. The full terms of this license are available at https://www.dovepress.com/terms.php and incorporate the Creative Commons Attribution - Non Commercial (unported, v3.0) License.
By accessing the work you hereby accept the Terms. Non-commercial uses of the work are permitted without any further permission from Dove Medical Press Limited, provided the work is properly attributed. For permission for commercial use of this work, please see paragraphs 4.2 and 5 of our Terms.