")
Back to Journals » OncoTargets and Therapy » Volume 10
MicroRNA-145 inhibits the activation of the mTOR signaling pathway to suppress the proliferation and invasion of invasive pituitary adenoma cells by targeting AKT3 in vivo and in vitro
Authors Zhou K, Fan Y, Wu P, Duysenbi S, Feng Z, Du G, Zhang T
Received 28 July 2016
Accepted for publication 7 December 2016
Published 16 March 2017 Volume 2017:10 Pages 1625—1635
DOI https://doi.org/10.2147/OTT.S118391
Checked for plagiarism Yes
Review by Single anonymous peer review
Peer reviewer comments 3
Editor who approved publication: Dr Tohru Yamada
This paper has been retracted
Kai Zhou, Yan-Dong Fan, Peng-Fei Wu, Serick Duysenbi, Zhao-Hai Feng, Guo-Jia Du, Ting-Rong Zhang
Department of Neurosurgery, The First Affiliated Hospital of Xinjiang Medical University, Urumqi, People’s Republic of China
Purpose: This study was designed to explore how miR-145 regulates the mTOR signaling pathway in invasive pituitary adenoma (IPA) by targeting AKT3.
Methods: A total of 71 cases of IPA tissues and 66 cases of non-IPA tissues were obtained in this study. In vitro, the IPA cells were assigned into blank control, empty plasmid, miR-145 mimic, miR-145 inhibitor, miR-145 mimic + rapamycin, miR-145 inhibitor + rapamycin and rapamycin groups. Quantitative real-time polymerase chain reaction (qRT-PCR) and Western blotting were performed to detect the protein expressions of PI3K, AKT3, mTOR mRNA and the mRNA expression of miR-145 both in vivo and in vitro. Additionally, the S6K and RPS6 mRNA and protein expressions as well as the relative phosphorylation levels were determined in vitro. MTT assay, flow cytometry and transwell assay were used to testify the cell proliferation, apoptosis and invasion ability, respectively.
Results: The IPA tissues exhibited significantly lower expression of miR-145 but higher PI3K, AKT3 and mTOR mRNA and protein expressions when compared with the non-IPA tissues. Compared with the blank control and empty plasmid groups, the miR-145 mimic group showed significantly decreased PI3K, AKT3, mTOR, S6K and RPS6 mRNA and protein expressions as well as phosphorylation levels; besides, the IPA cell proliferation, migration and invasion ability were strongly inhibited, accompanied with the increased number of apoptotic cells. In the miR-145 inhibitor group, the PI3K, AKT3, mTOR, S6K and RPS6 mRNA and protein expressions as well as the phosphorylation levels were significantly increased; cell proliferation, migration and invasion ability were remarkably elevated, accompanied with reduced apoptotic cell number.
Conclusion: The study demonstrates that miR-145 inhibits the mTOR signaling pathway to suppress the IPA cell proliferation and invasion and promotes its apoptosis by targeting AKT3.
Keywords: invasive pituitary adenoma, microRNA-145, mTOR signaling pathway, proliferation, invasion, AKT3
Introduction
Pituitary adenomas are common benign neoplasms and account for 15%–20% of primary brain tumors. Although they do not metastasize in most cases, tumor invasion into adjacent tissue is detected at initial diagnosis,1 which is invasive pituitary adenoma (IPA). IPA infiltrates adjacent tissues and grows in several directions: superiorly, permeating the diaphragma sellae and reaching the suprasellar cistern; laterally, disrupting the medial wall of the cavernous sinus, obliterating the venous structures or even encasing the internal carotid artery; inferiorly, extending into the sphenoid sinus and eroding the sellar floor; posteriorly, destroying the clivus and reaching the brain stem.2 Notoriously, IPA is difficult to manage because of its size, speed of growth, invasiveness and high frequency of recurrence.3 Despite multimodal therapeutic options, including radiotherapy, alternative medical therapies and repeated surgeries, a large number of cases are refractory to the conventional therapies and tend to quickly recur after initial treatment.4 Therefore, these IPAs are associated with poor prognosis and can even be fatal.5 Although several factors, such as gene mutations, locally produced growth factors and hypothalamic dysregulation, are controversial and appear to be involved in the transformation of pituitary cells,6 the identification of molecular pathway mechanism resulting in pituitary tumorigenesis is one of the major challenges in endocrine oncology.7
miRs are small, noncoding RNA molecules regulating the protein-coding gene expression at the translational expression.8 miR-145 is highly expressed in mesoderm-derived tissues and germ line, such as ovary, uterus, spleen, heart, testis and prostate,9 and it plays important roles in the differentiation of vascular smooth muscle cells and stem cells.10,11 As a well-known tumor suppressor (miR), miR-145 is downregulated in several human cancers, including breast cancer, lung cancer, bladder cancer and ovarian cancer.12–15 mTOR is a key player to integrate different biochemical and growth factor signals, including glucose, adenosine triphosphate (ATP), amino acids and insulin.16 Receiving input from multiple signals, such as growth factors, nutrients, hormones and other mitogens or stimulants, the mTOR pathway stimulates protein synthesis by phosphorylating key translation regulators.17 The pathway regulates cell growth, and increasing studies have demonstrated its dysregulation in many cancers, including breast cancer, prostate cancer and renal cell cancer.18–20 In addition, hyperactivation of the AKT/mTOR pathway is also involved in IPA, especially the invasive type.21 As an isoform of AKT, AKT3 is proved to be increased in tumors.22 Moreover, Boufraqech et al23 have reported that overexpressed miR-145 may inhibit the PI3K/AKT pathway and target AKT3 directly in suppressing the development and metastasis of thyroid cancer. However, there are few studies or reports discussing the relationship of miR-145, AKT3 and the mTOR pathway in IPA. In this study, the functions and mechanism of miR-145 regulating the mTOR signaling pathway in proliferation and invasion by targeting AKT3 are discussed to figure out the relevant molecular mechanism and to lay a theoretical foundation for molecular targeted therapy for IPA.
Materials and methods
Ethics statement
This study was approved by the regional committees for medical and health research ethics of the First Affiliated Hospital of Xinjiang Medical University. All participants provided and signed the informed consent.
Study subjects
The pituitary tissues were collected from 137 patients with pituitary adenomas treated in the Department of Neurosurgery at the First Affiliated Hospital of Xinjiang Medical University from March 2013 to September 2015, among whom 53 were male and 84 were female with the average age of 41.6±0.4 years. The diagnostic criteria of IPA were as follows:24 first, according to Wilson–Hardy classification standard, pituitary adenomas at III–IV grades or C, D and E stages were classified into the IPA group; second, damages in adjacent tissues including cavernous sinus, parasellar and hypothalamus were observed through preoperative imaging examination, computed tomography (CT) and magnetic resonance imaging (MRI); third, the bones at the bottom of sellar and adjacent endocranium taken during the surgery were verified with the invasion of tumor cells on the basis of pathology; fourth, it was observed during the surgery that the bones at the bottom of sellar and endocranium were invaded and destroyed, and tumors protruded into sphenoid sinus cavity or nerve and vessels around parasellar. Conforming to any one of the abovementioned criteria, the patients were assigned into the IPA group; otherwise, they were classified into the non-IPA group. Based on the abovementioned criteria, there were 71 cases in the IPA group and 66 cases in the non-IPA group, which was further definitely diagnosed according to pathology.
In vivo and in vitro grouping
In the in vivo experiment, all the 137 patients were divided into the non-IPA group and the IPA group. In the in vitro experiment, samples were assigned into the blank control group (without treatment), the empty plasmid group, the miR-145 mimic group, the miR-145 inhibitor group, the miR-145 mimic + rapamycin group, the miR-145 inhibitor + rapamycin group and the rapamycin group.
Cell culture
After rinsing with normal saline, the tissues were placed into serum-free Dulbecco’s Minimum Essential Medium (DMEM) under sterile conditions and immediately sent to the laboratory. Then, the tissues were rinsed with phosphate-buffered saline (PBS) on a clean bench under sterile conditions to remove connective tissues, necrotic tissues and blood clots. Afterward, the tissues were cut into tissue blocks with a size of 1 mm3 using ophthalmic scissors. After preheating to 37°C, 2.5 g/L trypsase (5–6 times the volume of the tissues) was added, and then the tissues were digested for 30–50 min at 37°C, during which they were dispersed using straw every 5 min until being well dispersed. Then, as much as five times of DMEM culture solution (containing 105 U/L penicillin, 0.1 g/L streptomycin, 2.2 g/L NaHCO3, 2.0 g/L HEPES and 15% fetal calf serum) was added to terminate the digestion for 5 min. After being filtered by a 100-mesh cell strainer, the tissues were centrifuged at 1,000 rpm (r=15 cm) for 10 min and the supernatant was aspirated. DMEM culture solution, containing 105 U/L penicillin, 0.1 g/L streptomycin, 2.2 g/L NaHCO3, 2.0 g/L HEPES and 15% fetal calf serum, was added to resuspend and disperse the cells. The number of cells was counted using Japan Olympus microscope, and the concentration of cells was adjusted to 1.0×10⁶/mL. Trypan blue staining was performed to detect cell viability. The cells were inoculated in a 24-well plate, which was pre-surrounded by polylysine with 1 mL/well, and the culture solution was changed every 2 days.
Cell transfection
Cells at the logarithmic growth phase were inoculated in a 96-well plate (100 μL/well). Corresponding plasmid and lentiviral packaging were co-transfected into IPA cells, 24 h before which cells were laid on the plate for conventional incubation. One hour before the transfection, cell culture fluid was changed. The transfection mixture was produced using Lipofectamine 2000 (Invitrogen Inc., Carlsbad, CA, USA). Serum-free and double-antibodies-free medium (Invitrogen Inc.), containing oligonucleotide fragment (with the final concentration of 300 pmol/well) embedded in liposome, was added to each group. The transfected cells were cultured with serum-free medium in a 5% CO2 incubator at 37°C for 4 h, after which 10% fetal bovine serum (FBS) was added for further culture in incubator with 5% CO2 at 37°C. After 24 h transfection, the cells with miR-145 mimic plasmid, miR-145 inhibitor plasmid and blank plasmid were collected. In each group, cells were diluted at 10-4, 10-5, 10-6, 10-7 and 10-8/mL and incubated in a 96-well plate, with three repeated wells in each group. After being cultured in 5% CO2 incubator for 18 h at 37°C, the cells were counted under inverted fluorescence microscope (Nikon Corporation, Tokyo, Japan), and viral titer was calculated using computer. Viral titer (pfu/mL) = (10× mean fluorescence)/corresponding dilution degree. After 48 h, the cells were collected to extract the total RNA by RNA extraction kit (Invitrogen Inc.). Quantitative real-time polymerase chain reaction (qRT-PCR) was used to detect the mRNA expressions of PI3K, AKT3, mTOR and miR-145. In Dual-luciferase reporter gene assay system, the IPA cells at the logarithmic growth phase were incubated into a 96-well plate and the cells were transfected using Lipofectamine 2000 when the cell density reached 70%. AKT3-3′ untranslated region (UTR)-wild-type (WT) plasmid and miR-145 mimic plasmid were fully mixed to transfect the 293T cells. Meanwhile, the control groups (AKT3-3′UTR-WT + negative control [NC] and AKT3-3′UT R-mutant type [MUT] + miR-145 mimic) were established. After culturing for 6 h, 10% culture medium was replaced by 10% FBS, which was followed by continuous culture for 48 h. Telomerase activity was detected by chemiluminescence.
qRT-PCR
According to the specification of Trizol kit, the total RNA of IPA tissues and cells was extracted and preserved at −80°C. The content of extracted RNA was determined by the optical density (OD) at 260 nm measured by ultraviolet spectrophotometer (type: 752), and the RNA yield was defined in the way of a single OD260 equaling to 40 μg RNA, with OD260 ranging from 1.8 to 2.0 deemed as high RNA purity. In the experiment, a two-step qRT-PCR was conducted. First, the extracted RNA was reverse transcribed to cDNA with RT kit (Takara Biotechnology Ltd., Dalian, People’s Republic of China; the specific surgery was performed according to the specification). The conditions for the amplification of reverse transcription were as follows: at 37°C for 15 min and at 85°C for 5 s. The cDNA products were amplified by PCR in the following conditions: pre-denaturation for 5 min at 94°C; 30 cycles of 30 s at 94°C, 30 s at 55°C, 1 min at 72°C; extension for 10 min at 72°C. Reaction system included 2 μL PCR upstream primer, 2 μL PCR downstream primer, 4 μL template DNA, 1 μL ROX Reference Dye (50×), 25 μL SYBR Premix Ex TaqII and 16 μL dH2O. With GAPDH as the internal reference, mRNA expressions of PI3K, AKT3, mTOR and miR-145 were calculated by 2−ΔΔCt (Table 1).
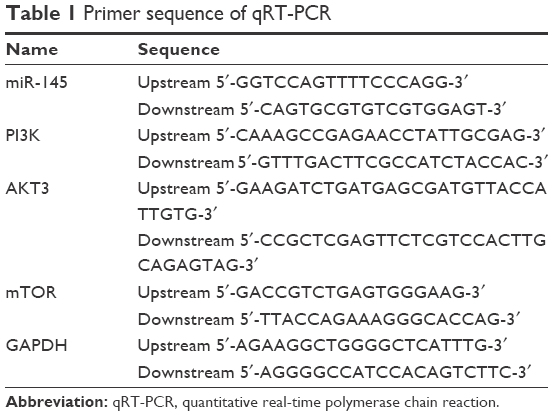 | Table 1 Primer sequence of qRT-PCR |
Western blotting
After digesting with pancreatin, the cells were collected and rinsed with PBS precooled to 4°C for three times. Radioimmunoprecipitation assay (RIPA) lysis buffer was added to extracted total protein of the transfected cells, and the protein quantification was measured by bicinchoninic acid (BCA). Approximately 20 μg of total protein of the sample was collected and separated by sodium dodecyl sulfate polyacrylamide gel electrophoresis (SDS-PAGE); after which the upper sample was transferred onto polyvinylidene fluoride (PVDF) membrane and blocked for 1 h by blocking buffer with the addition of corresponding antibodies (diluted 1:1,000) for incubation at 4°C overnight, including p-PI3K (ab182651), PI3K (ab123752), p-mTOR (ab84400), mTOR (ab2732), p-AKT3 (ab138365), AKT3 (ab112002), p-S6K (ab126818), S6K (ab139438), p-RPS6 (ab131535) and RPS6 (ab59261). All the antibodies were purchased from Abcam Inc. (Cambridge, MA, USA). After being rinsed with TBST, goat anti-rabbit Immunoglobulin G (IgG) labeled with horseradish peroxidase and diluted at 1:5,000 was added to the protein sample and incubated for 45 min at room temperature. Afterward, the sample was rinsed with TBST again, colored and exposed by electrochemiluminescence (ECL). Gray value was examined, with the gray value of β-actin as internal reference. The experiment was repeated for three times.
Dual-luciferase reporter gene assay
miR-145 mimic was synthesized according to the mature miR-145 sequence (miRBase accession no: MIMAT0000437). miR-145 inhibitor was the reverse complementary sequence of mature miR-145. AKT3 was silenced according to the siRNA design principle, and homological analysis was conducted for alternative target sequence. NC sequence of double-stranded RNA had no homology with mammalian genome. When both ends of oligonucleotide were synthesized, restriction enzyme sites, Bam HI and Xho I, were added. The entire DNA sequence synthesis was performed by Shanghai GenePharma, Co., Ltd (Shanghai, People’s Republic of China; Table 2). DNA fragments were cloned into pRNA-Lenti-enhanced green fluorescent protein (EGFP) lentivirus vector to construct corresponding expression vectors pRNA-Lenti-miR-145 mimic-EGFP (miR-145 mimic plasmid), pRNA-Lenti-miR-145 inhibitor-EGFP (miR-145 inhibitor plasmid) and pRNA-Lenti-vector-EGFP (empty plasmid). Meanwhile, a fragment of targeted gene was inserted into AKT3-3′UTR-WT plasmid and AKT3-3′UTR-MUT plasmid to construct dual-luciferase reporter gene plasmid of AKT3. All the abovementioned plasmids were identified by PCR, double enzyme digestion and DNA sequencing technique.
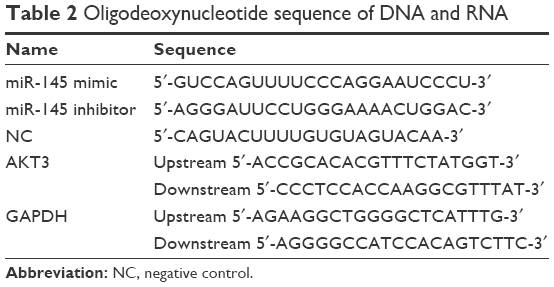 | Table 2 Oligodeoxynucleotide sequence of DNA and RNA |
Bioinformatics software on http://www.targetscan.org was adopted to predict the targeted correlation between miR-145 and AKT3, which was further verified by dual-luciferase reporter gene assay system. According to the specification of luciferase assay kit, PBS was used to rinse the 96-well plate, with 100 μL passive lysis buffer (PLB) added to each well, and the 96-well plate was shaken at a low speed for the collection of cell lysis buffer. In addition, 20 μL cell lysis buffer and 100 μL luciferase detection reagent II were well mixed, followed by luminometer reading (TD20/20; Turner Designs, Sunnyvale, CA, USA), and the renilla luciferase activity was obtained. Afterward, 100 μL of 1× Stop&Glo reagents was added and fully mixed to obtain renilla luciferase activity value. The expression of reporter gene was presented by the activity ratio of firefly luciferase and renilla luciferase.
MTT assay
Cells in each group were collected and incubated in a 96-well plate with 5×10³ cells per well, and three repeated wells were set up. When the cells adhered to the wall, 15 μL MTT (5 g/L, G3582; Promega Corporation, Madison, WI, USA) was added to culture the cells for 4 h in incubator with 5% CO2 at 37°C. In addition, 150 μL dimethyl sulfoxide (DMSO) was added and the 96-well plate was shaken for 10 min. Microplate reader (SpectraMax M5; Molecular Devices, Sunnyvale, CA, USA) was selected to detect the absorbance (A value) of each well at 490 nm, and cell proliferation in 72 h of each group was also detected.
Detection of IPA cell invasion ability
After 48 h transfection, the cells were digested. In each transwell chamber, 80 μL 1:8 Matrigel was spread and 1×10⁵ cells were incubated in it, with the addition of 100 μL serum-free DMEM. Then, the complete medium was added to the lower chamber for 24 h incubation, after cells in the upper chamber were wiped out using cotton bud. Afterward, the cells were fixed with 4% paraformaldehyde for 15 min and stained with crystal violet for 10 min. Under microscope, five fields were randomly selected to be photographed and the cells were thereof counted. In transwell assay, Matrigel spreading was not needed and the incubation lasted for 16 h.
Annexin V-fluorescein isothiocyanate (FITC)-propidium iodide (PI)
Cells in each group were digested with pancreatin, rinsed by PBS and resuspended. In addition, 10 μL Annexin V-FITC and 5 μL PI staining solution were added and mixed up with the cells for a 15 min dark incubation at room temperature. With cells resuspended by 300 μL binding buffer, the flow cytometry was selected to detect cell apoptosis.
Statistical analysis
Data were presented as mean ± standard deviation (SD;  ±s), and the SPSS17.0 software (SPSS Inc., Chicago, IL, USA) was used to process the data. Comparison between two groups was conducted by independent sample t-test, while comparisons among three or more groups were analyzed by one-way analysis of variance (ANOVA). The enumeration data among groups were compared by χ2 test. P<0.05 referred to statistical significance.
Results
Comparisons of miR-145, PI3K, AKT3 and mTOR mRNA and protein expressions between the IPA and non-IPA tissues
The results of qRT-PCR and Western blotting showed that the miR-145 expression strongly decreased while PI3K, AKT3 and mTOR mRNA and protein expressions significantly increased in the IPA tissues as compared with those in the non-IPA tissues (all P<0.05; Figures 1–2).
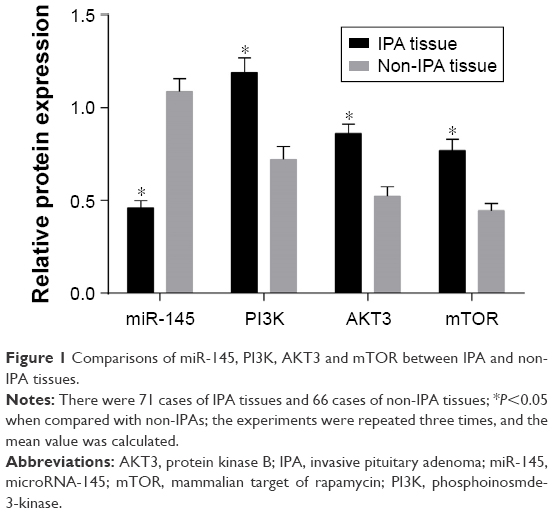 | Figure 1 Comparisons of miR-145, PI3K, AKT3 and mTOR between IPA and non-IPA tissues. |
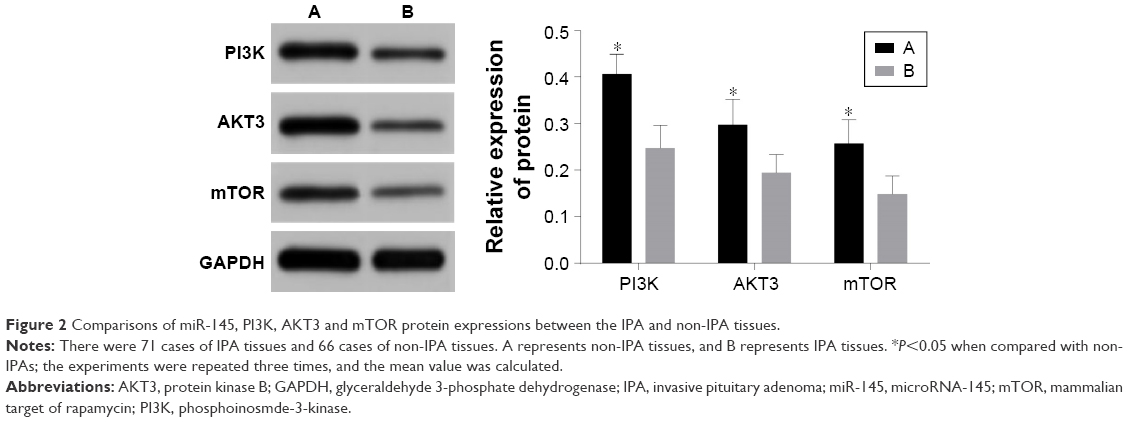 | Figure 2 Comparisons of miR-145, PI3K, AKT3 and mTOR protein expressions between the IPA and non-IPA tissues. |
Comparisons of miR-145, PI3K, AKT3 and mTOR mRNA and protein expressions in IPA cells among seven groups
According to the detection of miR-145, PI3K, AKT3 and mTOR mRNA and protein expressions in each group, no significant difference was observed between the blank control and empty plasmid groups (all P>0.05). Compared with the blank control and empty plasmid groups, the miR-145 mimic group exhibited increased expression of miR-145, but decreased PI3K, AKT3 and mTOR mRNA and protein expressions as well as the phosphorylation levels of p-S6K and p-RPS6 (all P<0.05); in the miR-145 inhibitor group, miR-145 was significantly downregulated but PI3K, AKT3 and mTOR mRNA and protein expressions as well as the phosphorylation levels of p-S6K and p-RPS6 strongly increased (all P<0.05); the miR-145 mimic + rapamycin group exhibited upregulated miR-145 but significantly decreased PI3K, AKT3 and mTOR mRNA and protein expressions as well as the phosphorylation levels of p-S6K and p-RPS6 (all P<0.05); in the miR-145 inhibitor + rapamycin group, downregulated miR-145 but strongly elevated PI3K and AKT3 mRNA and protein expressions were observed (all P<0.05), while no difference in the phosphorylation levels of p-S6K and p-RPS6 was noted (all P>0.05); the rapamycin group exhibited significantly decreased mTOR mRNA and protein expression as well as the phosphorylation levels of p-S6K and p-RPS6 (all P<0.05). There was no significant difference in PI3K and AKT3 mRNA and protein expressions between the miR-145 mimic and miR-145 mimic + rapamycin groups (all P>0.05). But the miR-145 mimic + rapamycin group had significantly lower mTOR mRNA and protein expression as well as the phosphorylation levels of p-S6K and p-RPS6 (all P<0.05; Figures 3–4).
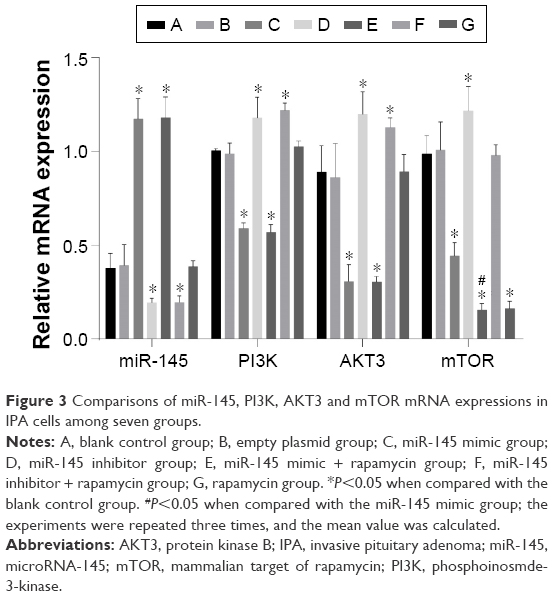 | Figure 3 Comparisons of miR-145, PI3K, AKT3 and mTOR mRNA expressions in IPA cells among seven groups. |
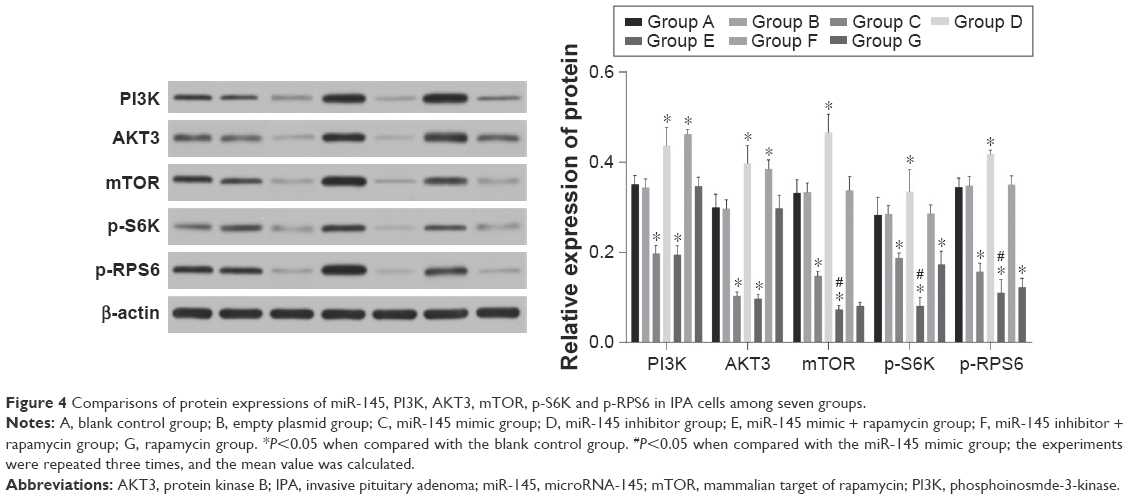 | Figure 4 Comparisons of protein expressions of miR-145, PI3K, AKT3, mTOR, p-S6K and p-RPS6 in IPA cells among seven groups. |
miR-145 regulates the mTOR signaling pathway to suppress IPA cell proliferation
Compared with the blank control and empty plasmid groups, the IPA cell proliferation was significantly inhibited in the miR-145 mimic group, but it was significantly elevated in the miR-145 inhibitor group (both P<0.05), indicating that over-expressed miR-145 could inhibit IPA cell proliferation. IPA cell proliferation in the miR-145 inhibitor + rapamycin group was significantly decreased as compared with that in the miR-145 inhibitor group, implying that the inhibited mTOR pathway by rapamycin could reverse the promotion of IPA cell proliferation caused by miR-145 inhibitor (Figure 5).
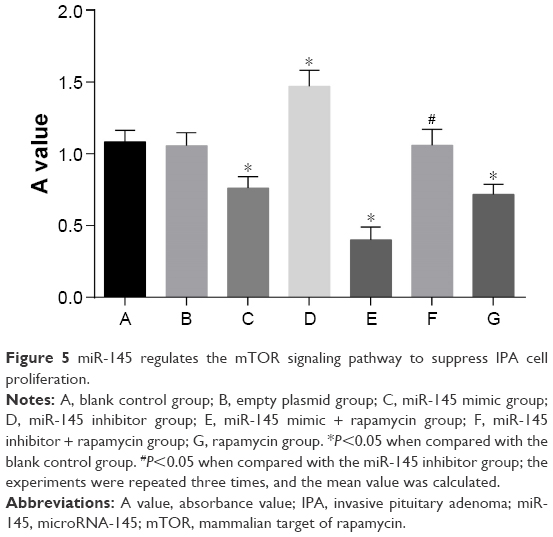 | Figure 5 miR-145 regulates the mTOR signaling pathway to suppress IPA cell proliferation. |
miR-145 regulates the mTOR signaling pathway to promote IPA cell apoptosis
Compared with the blank control and blank empty groups, the IPA cell apoptosis rate significantly increased in the miR-145 mimic group while it strongly decreased in the miR-145 inhibitor group (both P<0.05), indicating that overexpressed miR-145 could promote IPA cell apoptosis. When compared with the miR-145 inhibitor group, the IPA cell apoptosis rate remarkably elevated in the miR-145 inhibitor + rapamycin group, suggesting that rapamycin could inhibit the mTOR pathway to reverse the inhibition of IPA cell apoptosis caused by miR-145 inhibitor. These results further demonstrated that miR-145 promotes IPA cell apoptosis by targeting the mTOR signaling pathway (Figure 6).
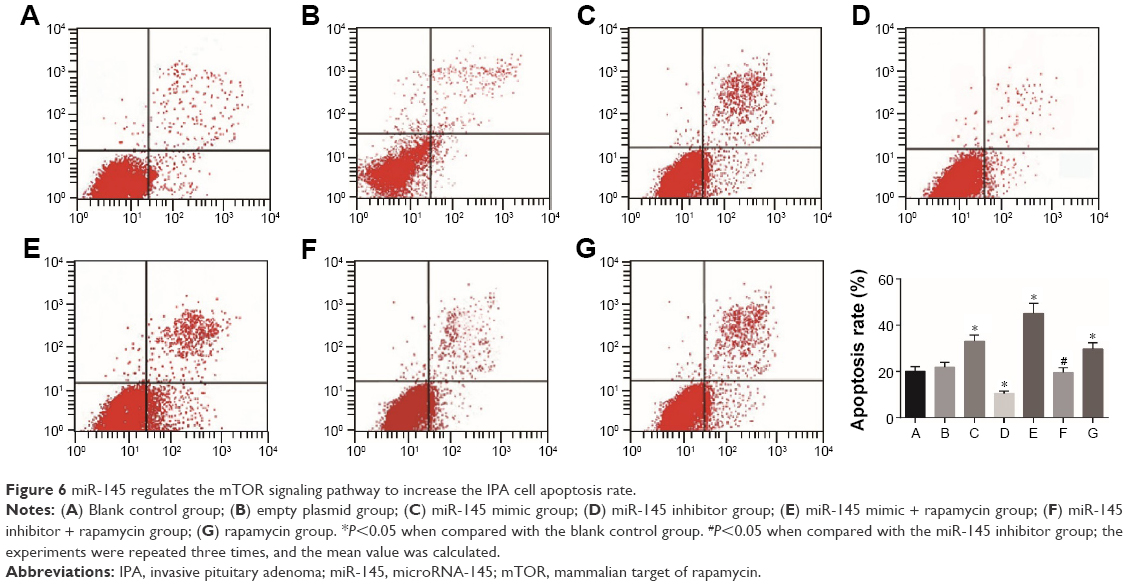 | Figure 6 miR-145 regulates the mTOR signaling pathway to increase the IPA cell apoptosis rate. |
miR-145 regulates the mTOR signaling pathway to suppress IPA cell migration
Compared with the blank control and empty plasmid groups, IPA cell migration ability significantly decreased in the miR-145 mimic group but it remarkably increased in the miR-145 inhibitor group (both P<0.05), indicating that IPA cell migration ability could be inhibited by overexpressed miR-145. The miR-145 inhibitor + rapamycin group showed significantly decreased IPA cell migration ability when compared with that in the miR-145 inhibitor group, suggesting that the inhibition of the mTOR pathway by rapamycin could reverse the promoted IPA cell migration caused by miR-145. Therefore, miR-145 inhibits IPA cell migration via mTOR signaling pathway (Figure 7).
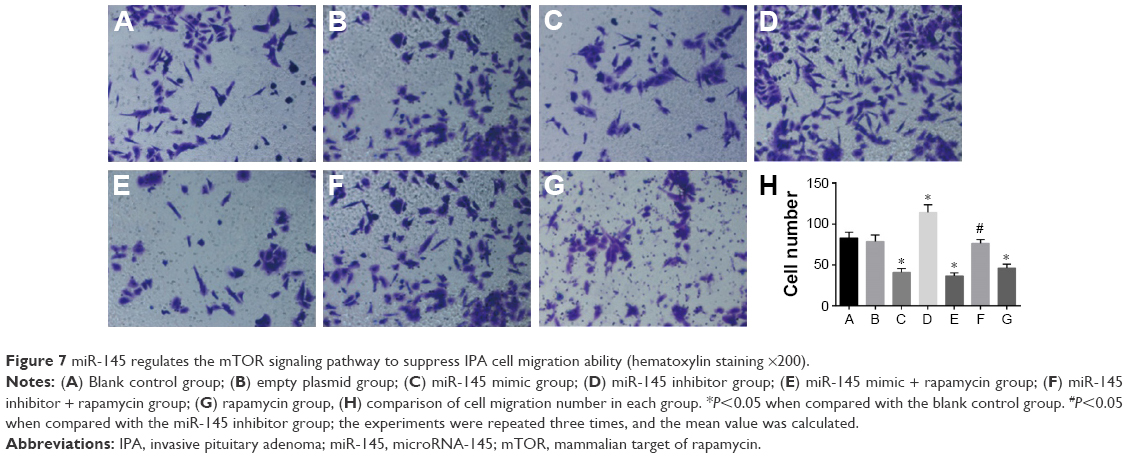 | Figure 7 miR-145 regulates the mTOR signaling pathway to suppress IPA cell migration ability (hematoxylin staining ×200). |
miR-145 regulates the mTOR signaling pathway to suppress IPA cell invasion ability
The IPA cell invasion ability declined in the miR-145 mimic group but it elevated in the miR-145 inhibitor group when compared with the blank control and empty plasmid groups (both P<0.05). This indicated that overexpressed miR-145 could inhibit IPA cell invasion. The IPA cell invasion ability in the miR-145 inhibitor + rapamycin group significantly decreased as compared with that in the miR-145 inhibitor group, which suggested that inhibited mTOR pathway by rapamycin could reverse the promoted IPA cell invasion ability caused by miR-145 inhibitor (Figure 8).
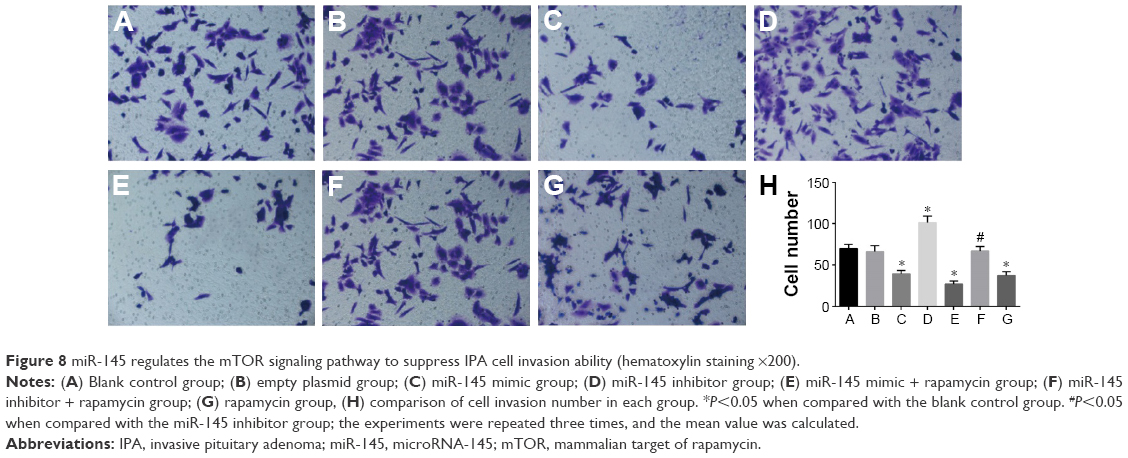 | Figure 8 miR-145 regulates the mTOR signaling pathway to suppress IPA cell invasion ability (hematoxylin staining ×200). |
miR-145 targets AKT3
AKT3 was predicted to be the target gene of miR-145 by bioinformatics software http://www.targetscan.org (Figure 9A). After co-transfection of AKT3-3′UTR-WT plasmid and miR-145 mimic plasmid in IPA cells, analyzed by SPASS 21.0 software, luciferase activity was found to be significantly decreased when compared with the AKT3-3′UTR-WT + NC group (P<0.05). However, the co-transfection of AKT3-3′UTR-MUT + miR-145 mimic plasmid showed no significant difference with the AKT3-3′UTR-WT + NC group (P<0.05; Figure 9B).
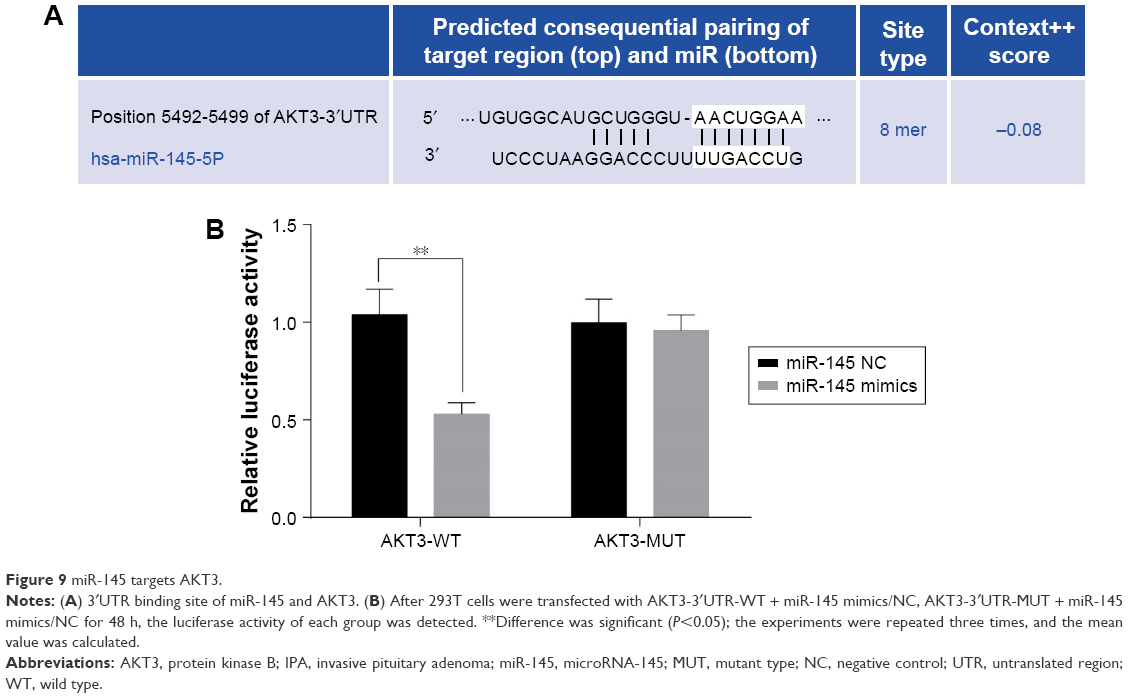 | Figure 9 miR-145 targets AKT3. |
Discussion
IPA is characterized by rapid growth, postoperative recurrence and poor prognosis.25 At the same time, it is hard to have complete resection surgery of IPA due to the wide range of invasion, as a result of which, it has lower recovery rate and is one of the greatest challenges of clinical treatment.26 In recent years, both tumor suppressor genes and oncogenes have been reported to be potential for genetic therapy of pituitary tumors.27 Therefore, finding the possible gene target of improving treatment and promoting prognosis in IPA, and seeking the regulation mechanism of that, is one of the major subjects in the study.
The study found that miR-145 expression in the IPA tissues was much lower than in the non-IPA tissues, while the PI3K, AKT3 and mTOR mRNA and protein expressions were higher in IPA tissues than that in non-IPA tissues. Based on the results, miR-145 played an inhibitor role of PI3K and AKT3 in IPA. miR-145, as one of the suppressor mRNAs, has been found to be downregulated in many cancer cells.28 Decreased expression of miR-145 is observed both in vivo and in vitro, which is important for the development and progression of prostate cancer.29 A previous study has demonstrated that the AKT pathway is overexpressed and activated in pituitary tumors.30 AKT3, identified as a kinase which might activate anti-apoptotic proteins, may be involved in the target molecule of cell metabolism in cancers.31 PI3K, a heterodimer, includes both catalytic subunit (p110) and regulatory subunit (p85).32 The AKT/PI3K pathway is stated to be oncogenic, which influences cell proliferation and cell apoptosis in cancers, and has been found to be downregulated by overexpressed miR-145 to inhibit cell growth and promote cell apoptosis in tumor development.33 This study found that with increased miR-145 in IPA, there were decreased mRNA and protein expressions of PI3K and AKT3, where IPA cell proliferation, migration and invasion were inhibited while cell apoptosis was promoted. Besides, AKT3 was demonstrated to be a target gene of miR-145 by dual luciferase report gene assay system. Therefore, miR-145 might inhibit proliferation, migration and invasion of IPA by inhibiting PI3K and AKT3.
In addition, the results of this study showed that miR-145 downregulates the mTOR pathway to inhibit the proliferation, migration and invasion of IPA. The mTOR, a serine/threonine kinase, could regulate cell functions, growth and transcription, and was also considered as one of the significant signaling pathways of tumorigenesis.34 The PI3K/AKT/mTOR pathway is involved in human malignancies, where AKT might regulate PI3K-inhibited signaling and mTOR phosphorylation; thus, mTOR inhibitor is considered to be a potential therapy of IPA treatment.35 Hahn-Windgassen et al36 reported that Akt regulates the activation of mTOR through growth factors and it plays as a positive modulator of mTOR. Moreover, PI3K/AKT pathway is indicated to be another upstream stimulating factor of mTOR pathway.37 Mitogenic signaling caused by receptor tyrosine kinases could elevate the activity of PI3K, resulting in the activation of Akt; thereof, it stimulates thyroid tumor cell proliferation and invasion.30 Few studies mentioned the relationship between miR-145 and mTOR pathway, but this study has found that the mTOR pathway might be the mediator of miR-145 to suppress IPA. In this study, with increased miR-145 in IPA, there were decreased mRNA and protein expressions of mTOR. Furthermore, the inhibited mTOR pathway by rapamycin could reverse the function of miR-145 inhibitor in IPA. Therefore, it was demonstrated that overexpressed miR-145 can inactivate mTOR pathway to inhibit the proliferation, migration and invasion of IPA.
Conclusion
miR-145 can not only suppress IPA cell proliferation, migration and invasion but also promote IPA cell apoptosis by mTOR pathway. This finding would be beneficial for further clinical treatment of IPA patients in the field of molecular biology. However, further analysis and larger samples are worth doing for IPA theoretical study.
Acknowledgments
This study was supported by a grant from the Nature Science Fund Project of The Xinjiang Uygur Autonomous Region of China (no: 2013211A078). We acknowledge the helpful comments on this article received from our reviewers.
Disclosure
The authors report no conflicts of interest in this work.
References
Zhang YC, Gao J, Xin T, Zheng ZM, Teng LZ. Expression of survivin in invasive pituitary adenoma. Saudi Med J. 2008;29(11):1589–1592. | ||
Gong J, Zhao Y, Abdel-Fattah R, et al. Matrix metalloproteinase-9, a potential biological marker in invasive pituitary adenomas. Pituitary. 2008;11(1):37–48. | ||
Li ZQ, Quan Z, Tian HL, Cheng M. Preoperative lanreotide treatment improves outcome in patients with acromegaly resulting from invasive pituitary macroadenoma. J Int Med Res. 2012;40(2):517–524. | ||
Hornyak M, Couldwell WT. Multimodality treatment for invasive pituitary adenomas. Postgrad Med. 2009;121(2):168–176. | ||
Buchfelder M. Management of aggressive pituitary adenomas: current treatment strategies. Pituitary. 2009;12(3):256–260. | ||
Ezzat S, Asa SL. Mechanisms of disease: the pathogenesis of pituitary tumors. Nat Clin Pract Endocrinol Metab. 2006;2(4):220–230. | ||
Qian ZR, Asa SL, Siomi H, et al. Overexpression of hmga2 relates to reduction of the let-7 and its relationship to clinicopathological features in pituitary adenomas. Mod Pathol. 2009;22(3):431–441. | ||
Suh SO, Chen Y, Zaman MS, et al. Microrna-145 is regulated by DNA methylation and p53 gene mutation in prostate cancer. Carcinogenesis. 2011;32(5):772–778. | ||
Lakshmipathy U, Love B, Adams C, Thyagarajan B, Chesnut JD. Micro RNA profiling: an easy and rapid method to screen and characterize stem cell populations. Methods Mol Biol. 2007;407:97–114. | ||
Cordes KR, Sheehy NT, White MP, et al. Mir-145 and mir-143 regulate smooth muscle cell fate and plasticity. Nature. 2009;460(7256):705–710. | ||
Xu N, Papagiannakopoulos T, Pan G, Thomson JA, Kosik KS. Microrna-145 regulates oct4, sox2, and klf4 and represses pluripotency in human embryonic stem cells. Cell. 2009;137(4):647–658. | ||
Iorio MV, Ferracin M, Liu CG, et al. MicroRNA gene expression deregulation in human breast cancer. Cancer Res. 2005;65(16):7065–7070. | ||
Liu X, Sempere LF, Galimberti F, et al. Uncovering growth-suppressive microRNAs in lung cancer. Clin Cancer Res. 2009;15(4):1177–1183. | ||
Ichimi T, Enokida H, Okuno Y, et al. Identification of novel microRNA targets based on microRNA signatures in bladder cancer. Int J Cancer. 2009;125(2):345–352. | ||
Iorio MV, Visone R, Di Leva G, et al. MicroRNA signatures in human ovarian cancer. Cancer Res. 2007;67(18):8699–8707. | ||
Dann SG, Selvaraj A, Thomas G. mTOR complex1-s6k1 signaling: at the crossroads of obesity, diabetes and cancer. Trends Mol Med. 2007;13(6):252–259. | ||
Pantuck AJ, Seligson DB, Klatte T, et al. Prognostic relevance of the mTOR pathway in renal cell carcinoma: implications for molecular patient selection for targeted therapy. Cancer. 2007;109(11):2257–2267. | ||
Chan S, Scheulen ME, Johnston S, et al. Phase II study of temsirolimus (cci-779), a novel inhibitor of mTOR, in heavily pretreated patients with locally advanced or metastatic breast cancer. J Clin Oncol. 2005;23(23):5314–5322. | ||
Kinkade CW, Castillo-Martin M, Puzio-Kuter A, et al. Targeting AKT/mTOR and ERK MAPK signaling inhibits hormone-refractory prostate cancer in a preclinical mouse model. J Clin Invest. 2008;118(9):3051–3064. | ||
Amato RJ, Jac J, Giessinger S, Saxena S, Willis JP. A phase 2 study with a daily regimen of the oral mTOR inhibitor rad001 (everolimus) in patients with metastatic clear cell renal cell cancer. Cancer. 2009;115(11):2438–2446. | ||
Dai C, Zhang B, Liu X, et al. Inhibition of PI3K/AKT/mTOR pathway enhances temozolomide-induced cytotoxicity in pituitary adenoma cell lines in vitro and xenografted pituitary adenoma in female nude mice. Endocrinology. 2013;154(3):1247–1259. | ||
Davies MA, Stemke-Hale K, Tellez C, et al. A novel akt3 mutation in melanoma tumours and cell lines. Br J Cancer. 2008;99(8):1265–1268. | ||
Boufraqech M, Zhang L, Jain M, et al. Mir-145 suppresses thyroid cancer growth and metastasis and targets akt3. Endocr Relat Cancer. 2014;21(4):517–531. | ||
Izycka-Swieszewska E, Drozynska E, Rzepko R, et al. Analysis of PI3K/AKT/mTOR signalling pathway in high risk neuroblastic tumours. Pol J Pathol. 2010;61(4):192–198. | ||
Hui P, Xu X, Xu L, Hui G, Wu S, Lan Q. Expression of mmp14 in invasive pituitary adenomas: relationship to invasion and angiogenesis. Int J Clin Exp Pathol. 2015;8(4):3556–3567. | ||
Qu X, Yang W, Jiang M, et al. Cd147 expression in pituitary adenomas and its significance for clinical outcome. Hum Pathol. 2010;41(8):1165–1171. | ||
Sav A, Rotondo F, Syro LV, Di Ieva A, Cusimano MD, Kovacs K. Invasive, atypical and aggressive pituitary adenomas and carcinomas. Endocrinol Metab Clin North Am. 2015;44(1):99–104. | ||
Ferreira AC, Robaina MC, Rezende LM, Severino P, Klumb CE. Histone deacetylase inhibitor prevents cell growth in Burkitt’s lymphoma by regulating PI3K/Akt pathways and leads to upregulation of mir-143, mir-145, and mir-101. Ann Hematol. 2014;93(6):983–993. | ||
Zaman MS, Chen Y, Deng G, et al. The functional significance of microrna-145 in prostate cancer. Br J Cancer. 2010;103(2):256–264. | ||
Musat M, Korbonits M, Kola B, et al. Enhanced protein kinase b/Akt signalling in pituitary tumours. Endocr Relat Cancer. 2005;12(2):423–433. | ||
Wang B, Sun F, Dong N, et al. Microrna-7 directly targets insulin-like growth factor 1 receptor to inhibit cellular growth and glucose metabolism in gliomas. Diagn Pathol. 2014;9:211. | ||
Bertacchini J, Heidari N, Mediani L, et al. Targeting PI3K/AKT/mTOR network for treatment of leukemia. Cell Mol Life Sci. 2015;72(12):2337–2347. | ||
Zhang Q, Yan W, Bai Y, et al. Synthetic mir-145 mimic inhibits multiple myeloma cell growth in vitro and in vivo. Oncol Rep. 2015;33(1):448–456. | ||
Kuo HP, Lee DF, Chen CT, et al. Ard1 stabilization of tsc2 suppresses tumorigenesis through the mTOR signaling pathway. Sci Signal. 2010;3(108):ra9. | ||
Lee M, Theodoropoulou M, Graw J, Roncaroli F, Zatelli MC, Pellegata NS. Levels of p27 sensitize to dual PI3K/mTOR inhibition. Mol Cancer Ther. 2011;10(8):1450–1459. | ||
Hahn-Windgassen A, Nogueira V, Chen CC, Skeen JE, Sonenberg N, Hay N. Akt activates the mammalian target of rapamycin by regulating cellular ATP level and AMPK activity. J Biol Chem. 2005;280(37):32081–32089. | ||
Zhang B, Wong M. Pentylenetetrazole-induced seizures cause acute, but not chronic, mtor pathway activation in rat. Epilepsia. 2012;53(3):506–511. |
 © 2017 The Author(s). This work is published and licensed by Dove Medical Press Limited. The full terms of this license are available at https://www.dovepress.com/terms.php and incorporate the Creative Commons Attribution - Non Commercial (unported, v3.0) License.
By accessing the work you hereby accept the Terms. Non-commercial uses of the work are permitted without any further permission from Dove Medical Press Limited, provided the work is properly attributed. For permission for commercial use of this work, please see paragraphs 4.2 and 5 of our Terms.
© 2017 The Author(s). This work is published and licensed by Dove Medical Press Limited. The full terms of this license are available at https://www.dovepress.com/terms.php and incorporate the Creative Commons Attribution - Non Commercial (unported, v3.0) License.
By accessing the work you hereby accept the Terms. Non-commercial uses of the work are permitted without any further permission from Dove Medical Press Limited, provided the work is properly attributed. For permission for commercial use of this work, please see paragraphs 4.2 and 5 of our Terms.