")
Back to Journals » Cancer Management and Research » Volume 13
Microbial Characteristics of Locally Advanced Rectal Cancer Patients After Neoadjuvant Chemoradiation Therapy According to Pathologic Response
Authors Fan Q, Shang F , Chen C , Zhou H, Fan J , Yang M, Nie X, Liu L, Cai K, Liu H
Received 1 December 2020
Accepted for publication 20 February 2021
Published 19 March 2021 Volume 2021:13 Pages 2655—2667
DOI https://doi.org/10.2147/CMAR.S294936
Checked for plagiarism Yes
Review by Single anonymous peer review
Peer reviewer comments 3
Editor who approved publication: Dr Chien-Feng Li
Qilin Fan,1,* Fumei Shang,1,* Chen Chen,1 Hongxia Zhou,1 Jun Fan,2 Ming Yang,2 Xiu Nie,2 Li Liu,3 Kailin Cai,4 Hongli Liu1
1Cancer Center, Union Hospital, Tongji Medical College, Huazhong University of Science and Technology, Wuhan, 430022, People’s Republic of China; 2Department of Pathology, Union Hospital, Tongji Medical College, Huazhong University of Science and Technology, Wuhan, 430022, People’s Republic of China; 3Department of Epidemiology and Biostatistics, The Ministry of Education Key Laboratory of Environment and Health, School of Public Health, Huazhong University of Science and Technology, Wuhan, People’s Republic of China; 4Department of Gastrointestinal Surgery, Union Hospital, Tongji Medical College, Huazhong University of Science and Technology, Wuhan, 430022, People’s Republic of China
*These authors contributed equally to this work
Correspondence: Hongli Liu
Cancer Center, Union Hospital, Tongji Medical College, Huazhong University of Science and Technology, Wuhan, 430022, People’s Republic of China
Tel +86-27-85871962
Fax +86-27-65650733
Email [email protected]
Kailin Cai
Department of Gastrointestinal Surgery, Union Hospital, Tongji Medical College, Huazhong University of Science and Technology, Wuhan, 430022, People’s Republic of China
Tel +86-27-85871962
Fax +86-27-65650733
Email [email protected]
Background: Intestinal microbiota play a critical role in the development of colorectal cancer. However, little is known about the structure and characteristics of gut microbial in colorectal cancer, especially in locally advanced rectal cancer after neoadjuvant chemoradiation therapy.
Methods: Here, we performed this study to evaluate microbial characteristics between pathologic complete response (pCR) (n=12) and non-pathological complete response (Non-pCR) (n=45) tumor tissues from patients with locally advanced rectal cancer after neoadjuvant chemoradiation therapy. In this study, 16S rRNA gene sequencing was used to detect the microbial diversity including Alpha diversity and Beta diversity. Moreover, we used PICRUSt from the Kyoto Encyclopedia of Genes and Genomes (KEGG) database to predict the microbial metabolism functions.
Results: There was significant statistical difference in PFS between pCR and Non-pCR group (p < 0.05). However, there was no significant difference in OS between pCR and Non-pCR group. The microbial compositions in the both groups were Proteobacteria, Actinobacteria, Firmicutes and Thermi and Bacteroidetes at the phylum level. The five most predominant genera in both pCR and Non-pCR tissue groups were Sphingobium, Acinetobacter, Cupriavidus, Thermi and Sphingomonas at the genus level. The key taxa identified in the pCR and Non-pCR tissues were Thermi and Sphingomonadaceae respectively. In addition, a series of human disease-related genes were also significantly different between pCR and Non-pCR group.
Conclusion: In summary, we demonstrated the characteristic differences in microbial communities between pCR tissues and Non-pCR tumor tissues from locally advanced rectal cancer patients after neoadjuvant chemoradiation therapy. Our results present new alterations in the microbiome in locally advanced rectal cancer after neoadjuvant chemoradiation therapy, suggesting that it will provide a new perspective for the precise treatment of neoadjuvant rectal cancer by targeting specific microbial species in the future.
Keywords: intestinal microbial, 16S rRNA gene sequencing, pathologic complete response, neoadjuvant chemoradiation therapy, colorectal cancer
Introduction
Colorectal cancer (CRC), the third leading cause of cancer death, is one of the most malignant cancer at home and abroad in the past few years.1 Local advanced rectal cancer patients are usually treated with neoadjuvant chemoradiation therapy. Neoadjuvant chemoradiation therapy can not only reduce the local recurrence rate and increase the surgical resection rate, but also abate the tumor staging of some rectal cancer patients' pathologic complete response (pCR). The pathologic complete response rates of local advanced rectal cancer patients after Neoadjuvant chemoradiation therapy is approximately 15–30%. However, 30–80% of local advanced rectal cancer patients experience a non-pathological complete response (Non-pCR). A various and abundant community of microorganisms (archaea, fungi, protozoa and viruses) inhabit in human intestinal tract.2 The human digestive tract is colonised with about 1014 bacteria, which mostly present in the colon and rectal.3 A great amount of microbial cells from over several hundreds of different species, which genomes can entail, globally, over three million genes, formed the typical gut microbiome.4 According to previous research, some bacterial species have been directly related with CRC carcinogenesis, such as Streptococcus bovis, Enterococcus faecalis, Bacteroides fragilis, Escherichia coli and Fusobacterium spp.5 This complex ecosystem interacts with the host in some special ways, facilitating various processes such as human metabolism, immune response, tissue damage and tumorigenesis.6,7
We hypothesized that the outcomes between pCR and Non-pCR rectal cancer patients after neoadjuvant chemoradiation therapy might differ by the contents of microorganisms in tumor tissue.
To test our hypothesis, we analyzed the tumor microbial diversity and compositional differences between pCR and Non-pCR rectal cancer patients' tumor tissue after neoadjuvant chemoradiation therapy in a clinical cohort, using 16S rRNA gene sequencing technology. We examined outcomes between pCR and Non-pCR rectal cancer patients by the contents of microorganisms in tumor tissue.
Materials and Methods
Study Population
A total of 57 colorectal cancer samples were included from our hospital, from January 2015 to November 2017. The patients were followed up regularly, and the last time was August 31, 2019. Antimicrobial agents were not used 2 weeks before operation or during operation, and no antimicrobial components were found in intestinal preparations, and patients who had received steroids or immunosuppressants within 6 months prior to enrolment were not included in the study.8 The clinical stage before neoadjuvant chemoradiotherapy in enrollments patients is cT3/4N+M0 according to the 2015 NCCN Guidelines according to the clinical trial recruitment of time. We used the Mandard’s version of tumor regression grade (TRG)9 in the method. TRG was quantitated in five grades: TRG 1 showed absence of residual cancer; TRG 2 was characterized by the presence of rare residual cancer cells scattered through the fibrosis; TRG 3 was characterized by an increase in the number of residual cancer cells, but fibrosis still predominated; TRG 4 showed residual cancer outgrowing fibrosis; and TRG 5 was characterized by absence of regressive changes. The regimen for neoadjuvant chemoradiotherapy used was Capecitabine and long-course radiotherapy in our study. The radiotherapy regimen used by the researchers was PTV with a total dose of 50.4Gy for 28 times, 1.8Gy each time, 5 times a week.
Tumor tissue samples were divided into two groups: pathologic complete response (pCR, n=12) and Non-pathological complete response (Non-pCR, n=45) after neoadjuvant chemoradiation therapy with colorectal cancer. No patients in two groups had personal or familial history of colorectal cancer or colitis (either ulcerative, Crohn’s, radiation or infectious colitis, chronic inflammatory illnesses), previous colonic or small bowel resection, nor previous colon adenomas or familial polyposis syndrome. Patients who were diagnosed with rectal cancer have undergone neoadjuvant therapy and received tumors surgically resection. Extra samples were macrodissected by an experienced pathologist and used for DNA extraction and bacterial community profiling.
Total DNA Extraction from Microbiome and 16S rRNA Gene Sequencing
We extracted total microbiome DNA from tissue samples of 57 patients utilizing the Omega Mag-Bind Soil DNA Kit (Omega Bio-Tek, Norcross, GA, USA) and used 0.8% agarose gel electrophoresis to detect DNA extraction quality. Ultraviolet spectrophotometer (Thermo Fisher Scientific, Waltham, MA, USA) was used to quantify DNA. Then, we stored all obtained DNA samples immediately at −80°C until further processing.
The V3V4 Variable Region of Genomic 16S rRNA Gene Was Amplified by PCR
Illumina sequencing method was used to amplify the V3V4 variable region of 16S rRNA of bacterial genome by PCR. Primers were designed according to the V3V4 region of the 16S rRNA gene of standard bacteria. The upper and lower primer sequences were 5ʹ-ACTCCTACGGGAGGCAGCA-3ʹ and 5ʹ-GGACTACHVGGGTWCTAAT-3ʹ respectively. In order to identify different samples, specific Barcode was added to the sample sequence, and 16S rRNA V3V4 variable region PCR was amplified using Q5 high-fidelity DNA polymerase. As far as possible, low cycle number was used for amplification, and the amplification conditions of each sample were consistent. PCR amplification was carried out on Applied Biosystems® 2720 PCR amplification device, and the amplification system was 25living L. The amplification process was as follows: pre-denaturation at 98°C for 2min, denaturation at 98°C for 15 s, annealing at 55°C for 30 s, and extension at 72°C for 30 s. 25cycles were performed for each of the above steps. PCR amplification products were detected by 2% agarose gel electrophoresis and the target fragments were recovered. Using the Microplate reader Assay Kit and the quant-it PicoGreen dsDNA Assay Kit, the recovered products of PCR amplification were assayed for fluorescence quantification. Finally, according to the fluorescence assay results, the samples were mixed according to the corresponding ratio.
Construction of Sequencing Library and High Throughput Sequencing
We used the TruSeq Nano DNA LT Library Prep Kit to construct the high-throughput sequencing Library. Then, we perform high-throughput measurements on Illumina MiSeq PE 250 platform sequence. According to the specificity of the primer and Barcode, we matched the selected sequences with the samples one by one, and removed the question sequences. We processed the sequencing data according to the method previously described. Just to be brief, USEARCH software through the UPARSE-OUT algorithm was utilized to choose paired sequences at a 97% identity match to operational taxonomic units (OTUs). We used QIIME software to assign the representative sequence taxonomically by searching against the Greengenes database10 with default parameters. And then, we created an original OTU composition table to record the OTU abundance for each sample and the taxonomic classification for each OUT. We discarded these OTUs with abundance <0.001% of the total sequences in all samples.11
Community Metabolic Modeling
We compared the 16S rRNA gene sequence of each OTU from our dataset with the genes identified in the genomes. All subjects provided written informed consent before they participated in the study.
Microbial Diversity and Taxonomic Analysis
Microbial alpha diversity was analyzed by sampling-based OUT table and presented by Chao1, ACE, Shannon and Simpson’s diversity indices,12 which was calculated using the Wilcoxon rank sum test. A ranked abundance curve represented the richness and evenness of species, which was performed by R software. Beta diversity was assessed according to the difference of microbial community structures among groups using Principal Coordinates Analysis (PCoA) conducted by weighted UniFrac and unweighted UniFrac. Microbial taxonomic analyses and comparison at the level of phylum and genus were performed between two groups, using the statistical method of Metastats13 conducted by Mothur software. Furthermore, linear discriminant analysis (LDA) effect size (LEfSe) was applied to analyze microbial characterisation, by the Galaxy analysis platform online. The Spearman rank correlation coefficient between the dominant genera with the abundance of the top 50 was calculated by Mothur software. Network analysis of the dominant genus with rho > 0.6 and P < 0.01 was conducted by Cytoscape.14 We used PICRUSt from the Kyoto Encyclopedia of Genes and Genomes (KEGG) database to predict the microbial metabolism functions.14
Statistical Analysis
We analyzed the data by GraphPad Prism 7.0 and SPSS Statistics 19.0. One-way analysis of variance (ANOVA) was used to analyze differences among three or more conditions, while Permutational Multivariate Analysis of Variance (PERMANOVA) was used to analyze the statistical test of differences of both groups. Student’s t-test was used to analyze the two-condition. Kaplan–Meier survival analysis was used to compare progression-free survival (PFS) and over survival (OS) between pCR and Non-pCR groups. OS was calculated from the date of surgery to the date of death by any cause or the last follow-up visit. Significance was established at the p<0.05 level.
Results
Demographic Characteristics of Patients with pCR and Non-pCR
A total of 57 CRC tumor tissue samples were collected. After a rigorous pathological diagnosis, 12 pCR and 45 Non-pCR samples were included. The microbial diversity of all tissue samples was detected by 16S rRNA Illumina MiSeq sequencing (Figure 1). The clinical characteristics of patients with pCR and Non-pCR are presented in Table 1A and B and Figure 2. Statistical analysis showed no significant differences in primary site, TRG classification after neoadjuvant therapy, OS(M) and differentiation state after neoadjuvant therapy between the two groups (all p > 0.05). Significant differences were observed in gender (p < 0.001), treatment strategies (p = 0.016) and PFS(M) (p = 0.049).
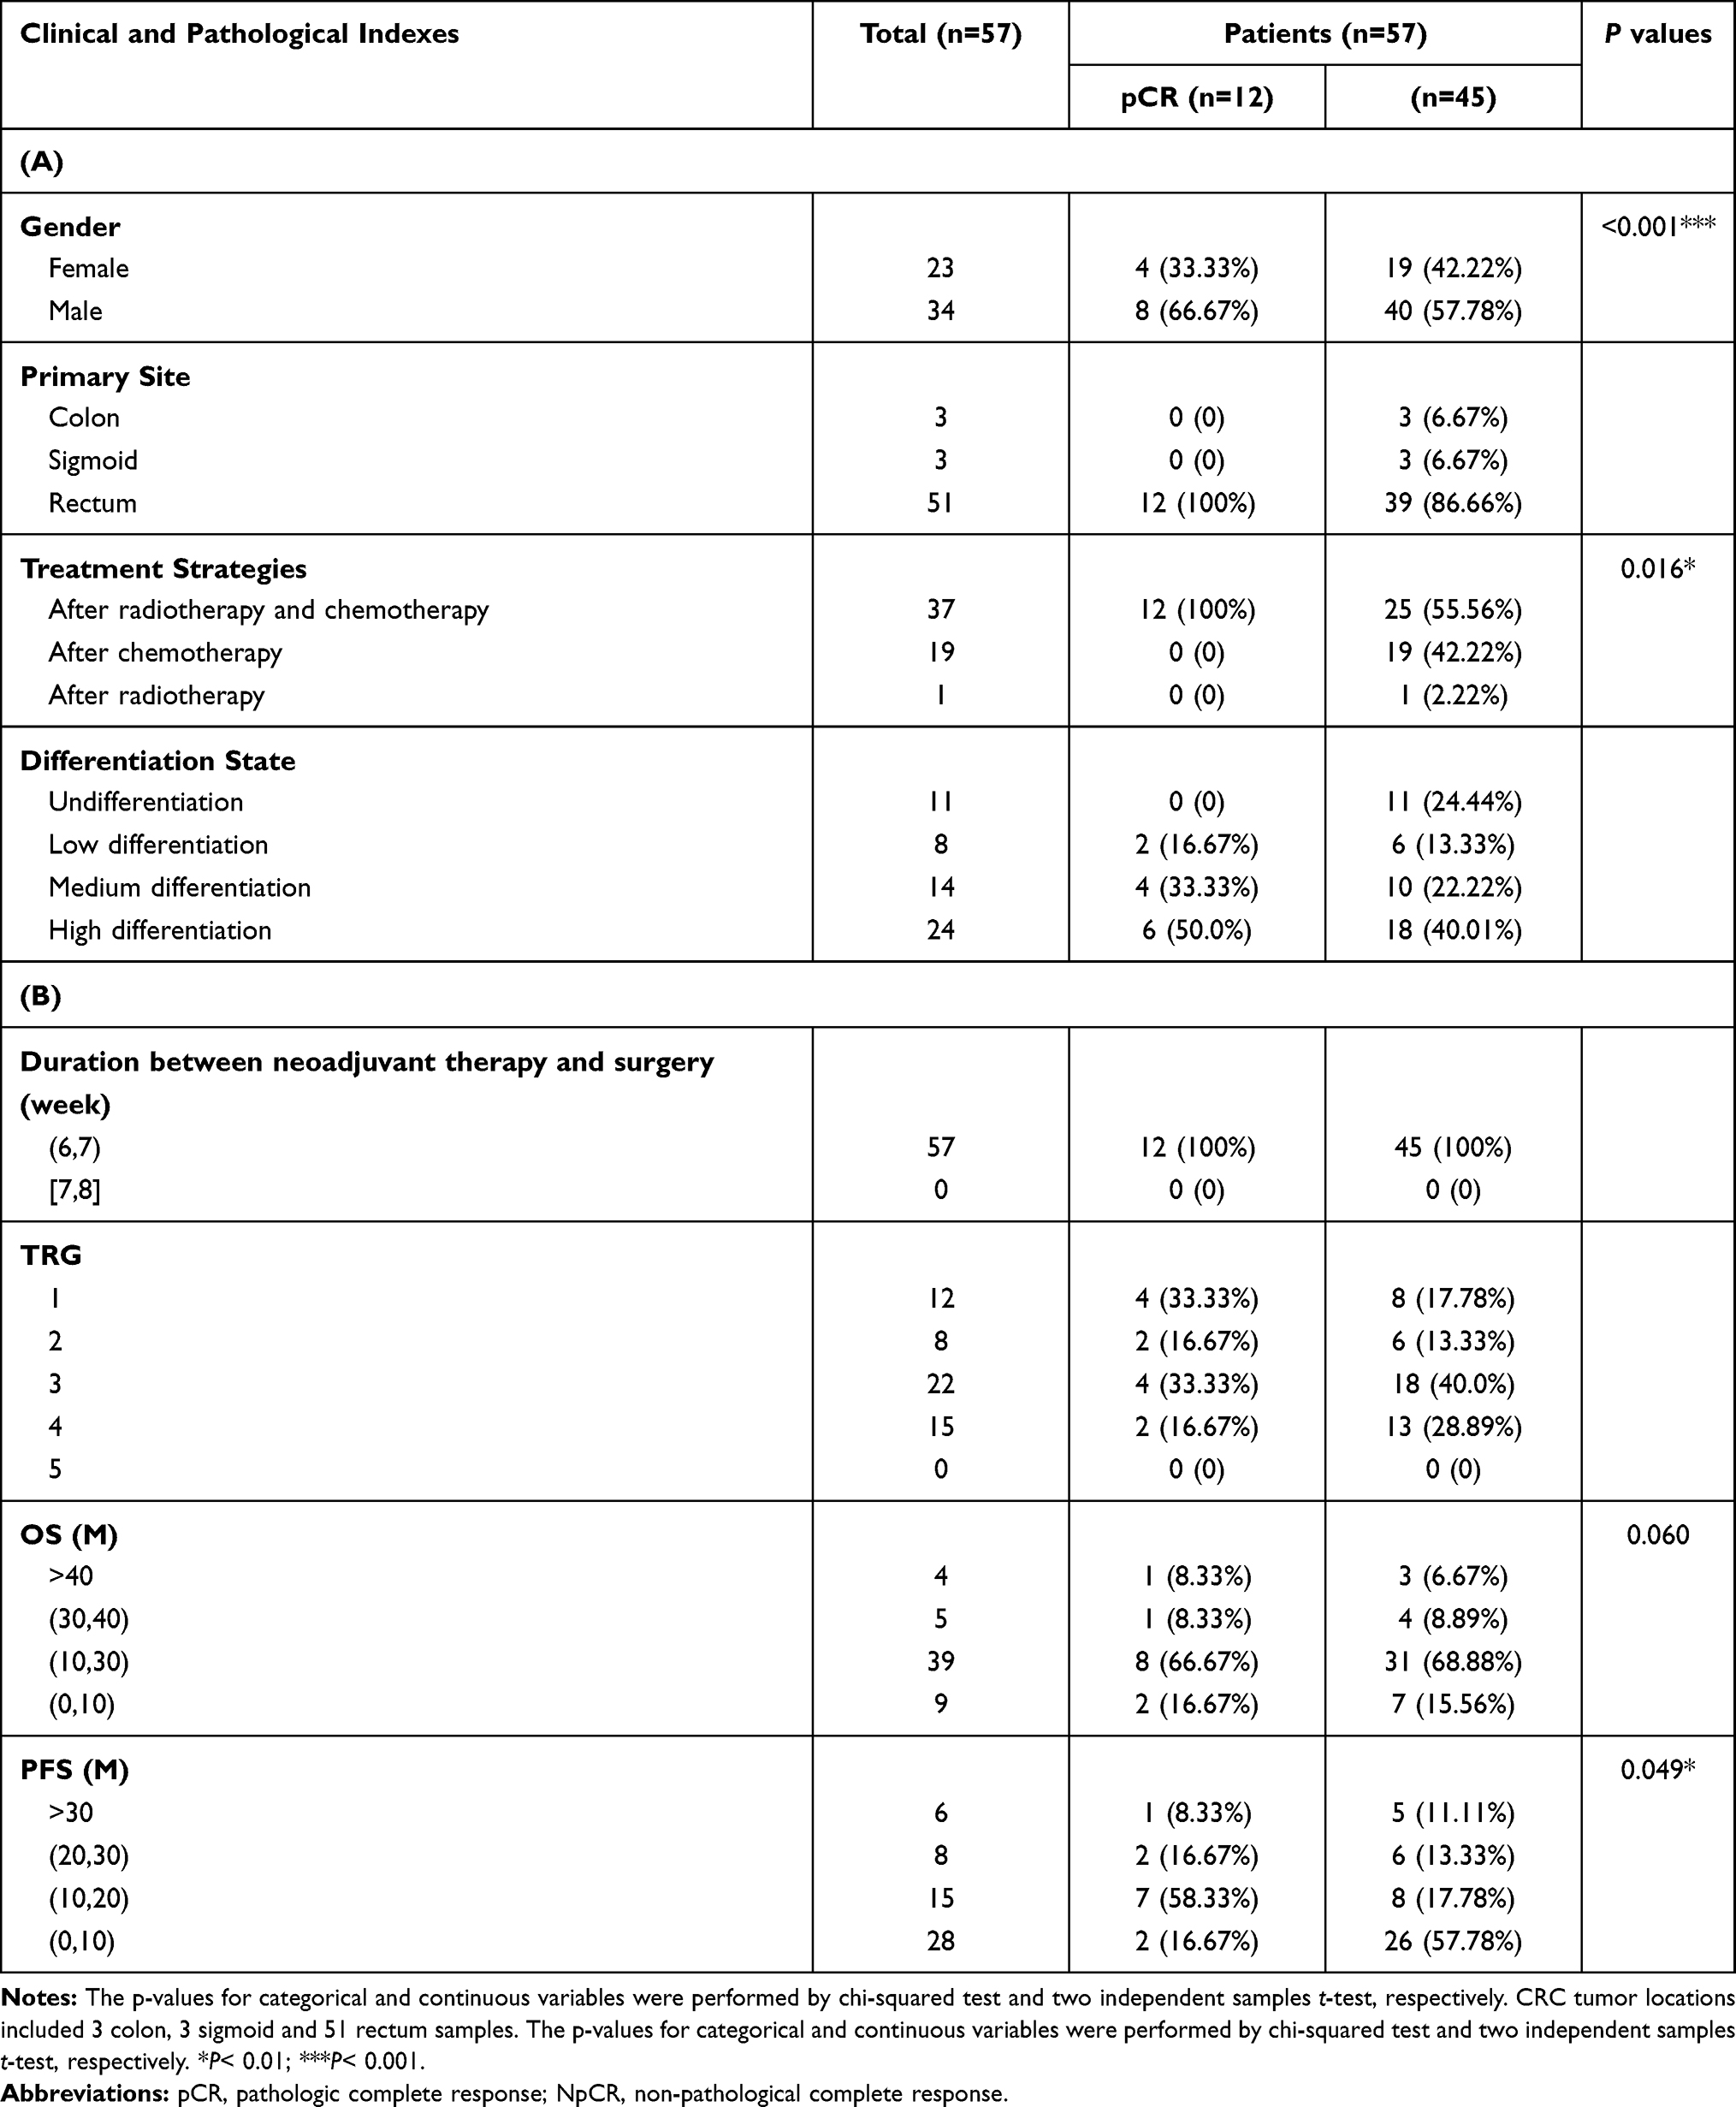 |
Table 1 Clinical Characteristics of the Enrolled Participants in Discovery Phase |
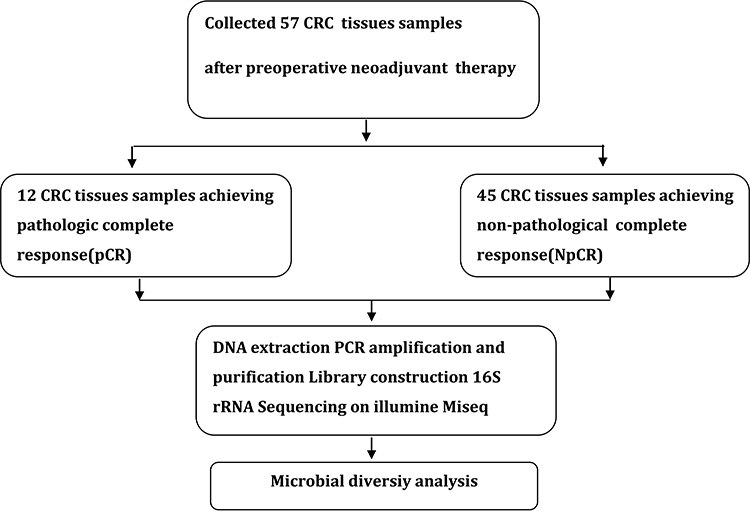 |
Figure 1 Study design and flow diagram. |
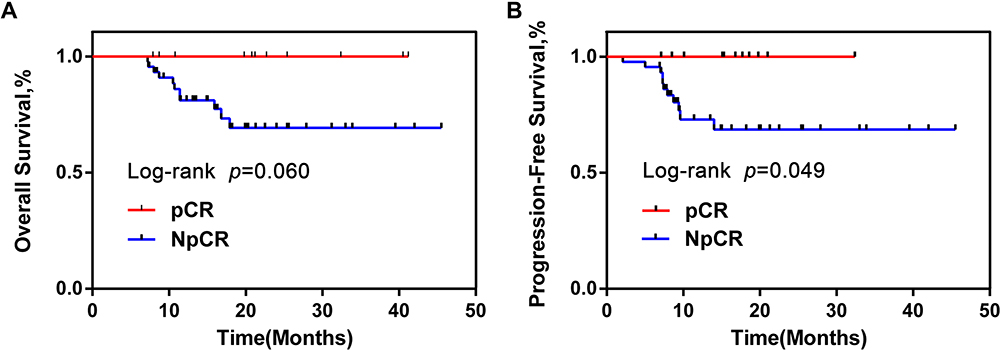 |
Figure 2 OS and PFS of pCR group were obviously longer than NpCR group. Kaplan–Meier curves for colorectal cancer-progression-free survival (A). Kaplan–Meier curves for colorectal cancer-overall survival (B). Abbreviations: OS, overall survival; PFS, progression-free survival; pCR, pathologic complete response; NpCR, non-pathological complete response. |
Microbial Richness and Diversity in the Tissue Samples
In this study, there were 647 OTUs obtained in all, 152 OTUs in the pCR tissues, 64 OTUs in the Non-pCR tissues and 431 OTUs shared in both groups. Venn diagram showed the distribution of OTUs detected in tissues of colorectal cancer patients with pCR or Non-pCR after neoadjuvant therapy (Figure 3A). Alpha diversity indices, which included ACE, Chao1, Shannon and Simpson indices, and they were used to estimate the richness and diversity of bacterial communities in the pCR and Non-pCR tissue groups. Alpha diversity was used to estimate the richness of the microbiome and its heterogeneity or proportion distribution. ACE indices for the pCR (190.28) and Non-pCR (132.24) differed significantly from each other (p < 0.001). Chao1 indices for the pCR and Non-pCR were 0.87 and 0.77, respectively (p < 0.001). Shannon indices for the pCR and Non-pCR were 0.87 and 0.78, respectively (p < 0.001). Simpson indices for the pCR and Non-pCR tissues were 4.12 and 3.27, respectively (p < 0.001) (Figure 3B–E).
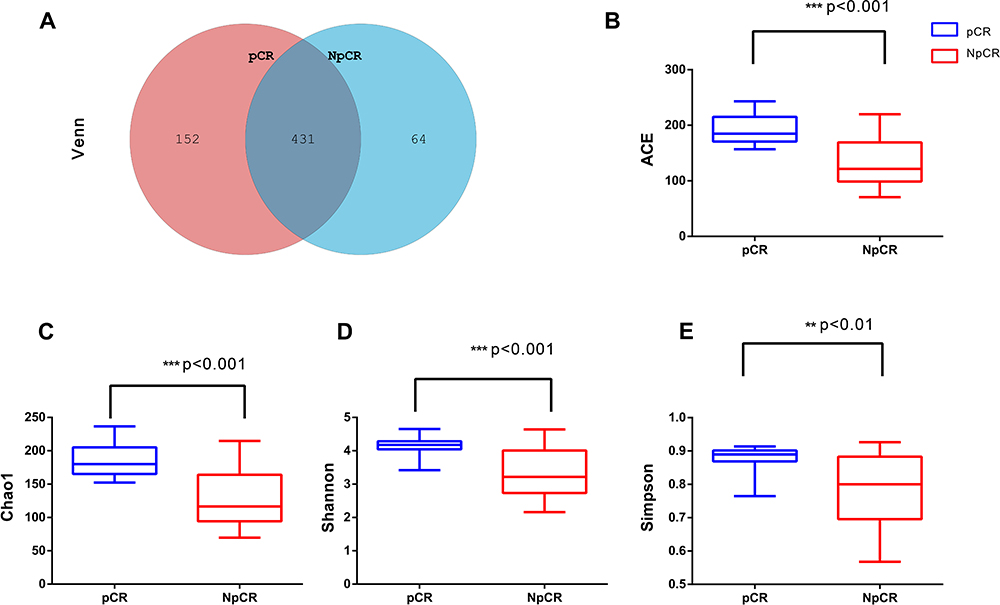 |
Figure 3 Microbial community richness and Alpha diversity in pCR and NpCR tumor tissues. (A) Venn diagrams. The Venn diagrams represent the shared and unique taxa among the different tissues. The microbial diversity, as estimated by the ACE index (B), Chao1 index (C), Shannon index (D) and Simpson index (E), in the both groups was significant. **p < 0.01; ***p < 0.001. Abbreviations: pCR, pathologic complete response; NpCR, non-pathological complete response. |
Difference in Bacterial Compositions Between the pCR or Non-pCR Groups
Beta indices were also a key index, which included principal component analysis (PCoA), non-metric multidimensional scaling (NMDS) and Clustering analysis with weighted and unweighted UniFrac distance made up Beta indices, showing that samples cluster strongly by individual, Beta indices were used to estimate sample cluster strongly by individual, with marked separation between individuals. NMDS showed highly significant difference in bacterial community between pCR and Non-pCR groups (p < 0.05) (Figure 4). PERMANOVA analyses showed a high significant difference between the microbiome composition of pCR and NpCR tumor tissues (both weighted and unweighted p < 0.001) (Table 2).
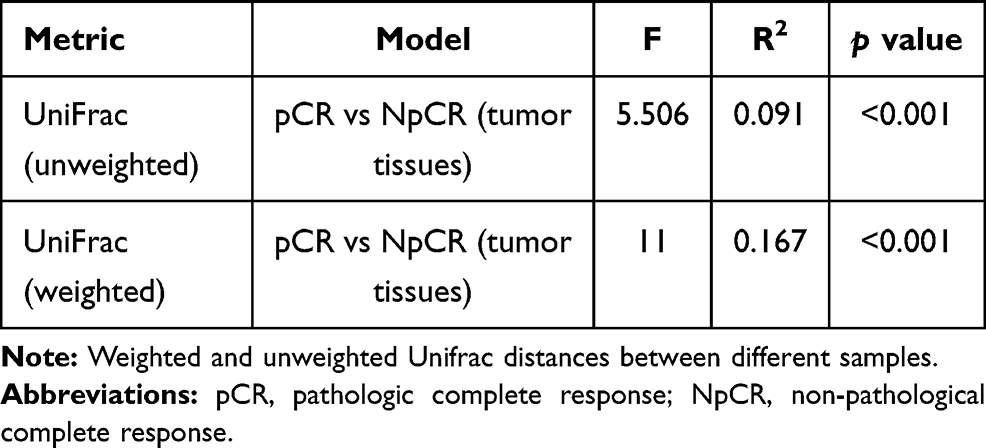 |
Table 2 Beta Diversity Assessed by Weighted and Unweighted UniFrac Distances |
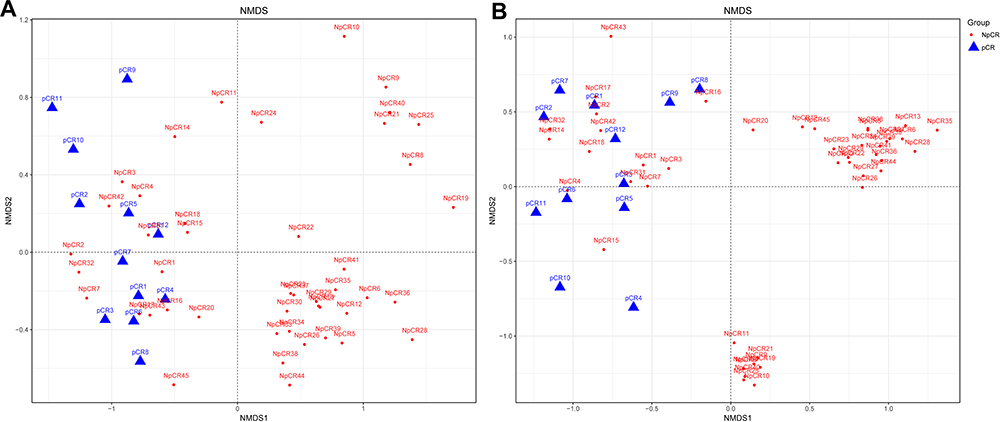 |
Figure 4 Beta diversity assessed by NMDS analysis in pCR and NpCR tissues. NMDS analysis (non-metric multi-dimensional scale) analysis. The dots represent individual samples. The distance of the sample point represents the similarity of the microbial community in the sample. The closer the distance is, the higher the similarity. (A) Unweighted UniFrac PCoA plots; (B) weighted UniFrac PCoA plots. NpCR group (red dots); pCR group (blue dots). |
Microbiota Composition at the Phylum and Genus Levels
The relative proportions of dominant taxa at the phylum level were evaluated through microbial taxon assignment in both groups. The most abundant phyla in pCR and Non-pCR tumor tissues were Proteobacteria, Thermi, Actinobacteria, Firmicutes and Bacteroidetes at the phylum level, accounting for 98% of the total community. Proteobacteria (6.75% versus 1.06%) was enriched in the Non-pCR group compared to the pCR group, whereas Actinobacteria, Bacteroidetes, Deferribacteres, Firmicutes, Planctomycetes, Fusobacteria were enriched in the pCR group (Figures 5A and 6A). The five most predominant genera in both pCR and Non-pCR tissue groups were Sphingobium, Acinetobacter, Cupriavidus, Sphingomonas and Thermus at the genus level. In the pCR groups, the distribution was Thermus (8.12%), Sphingobium (5.18%) and Sphingomonas (0.30%). In the Non-pCR tissues, the distribution was Sphingobium (7.00%), Thermus (4.59%), Arthrobacter (1.76%) and Ochrobactrum (0.33%). Sphingobium was significantly higher in the pCR tissues (p < 0.001) than Non-pCR tumor tissues among these predominant genera (Figures 5B and 6B).
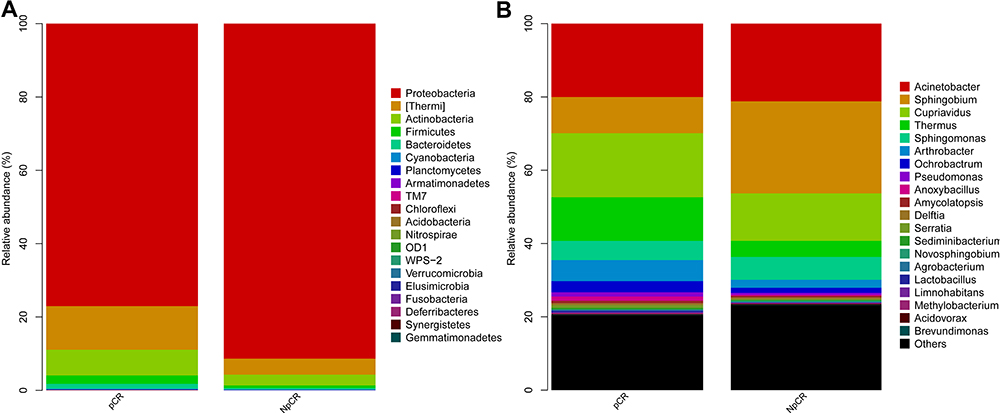 |
Figure 5 Profiles of microbial taxonomic composition at the phylum and genus levels. Compositions of tissue microbiota at the phylum level (A) and genus level (B) between pCR and NpCR tumor tissues. Abbreviations: pCR, pathologic complete response; NpCR, non-pathological complete response. |
 |
Figure 6 Profiles of differential microbial communities at the phylum and genus levels. The increased microbial communities at the phylum level in pCR tumor tissues versus NpCR tumor tissues (A). The increased microbial communities at the genus level in pCR tumor tissues versus NpCR tumor tissues (B). *p < 0.05; **p < 0.01; ***p < 0.001. Abbreviations: pCR, pathologic complete response; NpCR, non-pathological complete response. |
To compare the significant differences in the microbial taxa between pCR and Non-pCR tumor tissues, the Metastats method and LEfSe analysis were conducted, and the top 20 taxa were analyzed. The abundance of the phyla, including Thermi, Actinobacteria, Bacteroidetes, Firmicutes, Planctomycetes and Fusobacteria increased in pCR tumor tissues compared with Non-pCR tumor tissues (p < 0.05, Figure 7A), while Proteobacteria decreased in pCR tumor tissues compared with Non-pCR tumor tissues (p < 0.05) (Figure 7A). Correspondingly, the abundances of the genera, including Actinomyces, Anoxybacillus, Arthrobacter, Burkholderia, Halomonas, Methylobacterium, Mucispirillum, Neisseria, Nitriliruptor, Ochrobactrum, Prevotella, Sediminibacterium and Serratia were higher in pCR than in Non-pCR tumor tissues (p < 0.05) (Figure 7A). In addition, key taxa were identified in the Non-pCR and pCR tissues with LEfSe analysis respectively. The key taxa in the pCR tissues were Thermi (LDA score 4.59, p < 0.001) (Figure 7C). While the key taxa in the Non-pCR tissues were Sphingomonadaceae (LDA score 4.98, p < 0.001) (Figure 7C).
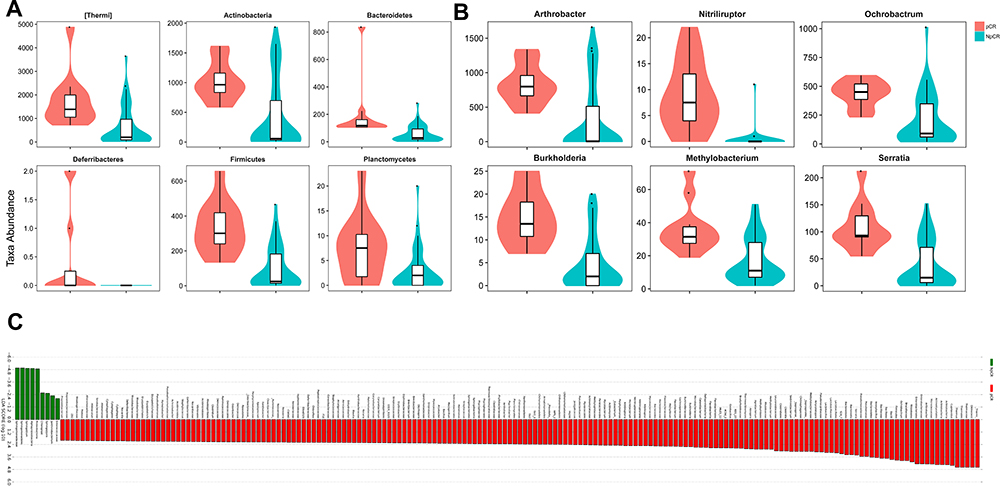 |
Figure 7 The microbial taxa between pCR and Non-pCR tumor tissues at the phylum and genus levels and the distribution bar chart of LDA values. The distribution bar chart of LDA values shows the species with LDA scores greater than the set value and the species with significantly different abundances in different groups. The length of the histogram represents the size of the impact of significantly different species (A–C). Abbreviations: pCR, pathologic complete response; NpCR, non-pathological complete response. |
Discussion
Microbiota plays a critical part in the CRC carcinogenesis. Our study first reported the microbial compositions in rectal cancer after new adjuvant chemoradiotherapy. We found the microbial compositions in both groups were Firmicutes, Bacteroidetes, Proteobacteria, Actinobacteria and Thermi at the phylum level. This result was consistent with the following study.15 Gagnière et al reported that the human intestinal flora mainly consisted of the following three phylum: Firmicutes, Bacteroidetes and Actinobacteria.15 Moreover, we revealed that alpha diversity and richness of the pCR groups were obviously higher than Non-pCR groups, and the differences between the two groups were markedly significant. According to our study, we can infer the group with high alpha diversity or richness may be conducive to achieving pathological complete remission after neoadjuvant therapy for rectal cancer patients. Riquelme et al16 analysed the higher alpha diversity of tumor tissue in patients with pancreatic cancer be more likely to earn longer survival for them, which is consistent with our results. In addition, Yu et al17 believed that a depressed microbial richness in the upper gastrointestinal tract was connected with cancer-predisposing conditions of the stomach and esophagus. In other words, the level of alpha diversity may be associated with patient’s prognosis.
From the relative abundance of species analysis at the phylum level, we found that pCR group had a superior proportion of Firmicutes, Actinobacteria, Thermi and a lower scale of Proteobacteria than Non-pCR tissue groups. Liu et al18 analyzed Firmicutes showed a relatively high abundance in the ESCC group, while Proteobacteria showed a decreasing relative abundance compared to the healthy control group, which is consistent with our analysis. Another research reported that the abundance of Actinobacteria in bladder cancer patients was higher than that in control group according to comparing the microbiota.19 Yachida et al20 analysed the changes of microbiota in patients with colorectal cancer and noted that Actinobacteria was significantly increased in polypoid adenomas and intramucosal carcinomas. This indicates that increasing abundance of Firmicutes and Actinobacteria are associated with cancer. Combined with our research, we can deduce that the rising abundance of Fusobacteria, Bacteroidetes, Firmicutes and Actinobacteria may be more conducive to achieving a complete pathological response for rectal cancer patients after neoadjuvant chemoradiation therapy and more associated with patient prognosis.
Previous studies have found that some bacterial species, including Streptococcus bovis,21–23 H.pylori,24,25 Bacteroides fragilis,21,26–28 Enterococcus faecalis,26 Clostridium septicum,29–31 Fusobacterium,32–34 Escherichia coli35–37 have been suspected to play a critical part in the colorectal carcinogenesis.38,39 Fusobacteria nucleatum may arouse the development of CRC and is identified as an underlying risk threat for CRC progression in several reports.34,40 Researchers have testified that a higher abundance of Fusobacterium nucleatum is associated with a shorter survival time in CRC patients.41 A recent study showed that Fusobacterium was enriched in patients, suffering from chemoresistance and relapsed after chemotherapy of 5-FU and its enrichment is an independent indicator of tumor cell aggressiveness.42 Apart from the primary tumor site, Fusobacterium is also enriched in distant metastatic tumors, indicating the relative stability between paired primary and distant metastatic tumor sites.5 Our findings showed that Fusobacteria were enriched in our both groups, which is consistent with previous studies. However, the richness of Fusobacteria was higher in pCR tissues than Non-pCR tissues. Based on this result, we can deduce that low relative richness of Fusobacterium might have guiding significance to identify whether rectal cancer was more advantageous to PCR after neoadjuvant chemoradiation therapy. In other words, Fusobacterium would be a promising microbial identification marker or microbial target bacteria, contributing to improving the pathological pCR rate and prolong the PFS and OS of CRC patients after neoadjuvant chemoradiation therapy.
In addition, our research found that the key taxa identified in the pCR and Non-pCR tissues were Thermi and Sphingomonadaceae respectively. However, it has rarely been studied or reported about them in colorectal cancer, especially Thermi. Hu et al43 observed that species Sphingobium yanoikuyae and genus Sphingobium had significant enrichment and high relative abundance in superficial gastritis. Sphingomonadaceae has a higher detection rate in gastric cancer biopsies.44 Additionally, Sphingobium yanoikuyae has been reported to be negatively associated with breast cancer.45 Hu et al43 observed that bacteria corresponding to family Sphingomonadaceae, especially genus Sphingobium and species Sphingobium yanoikuyae, are negatively associated with advanced gastric adenocarcinoma. Mei et al46 reported that Sphingobium were more abundant in the duodenal mucosa of pancreatic cancer patients.
The mechanism of the gut microbiota affecting the host response to radiotherapy is rarely known. Recently, researchers have noticed that gut microbiota is closely related to the response to radiotherapy.47 A recent study assessed the fecal microbial composition of 5 mice that had undergone radiation by 16S rRNA gene sequencing and found that radiation increased the level of Alistipes and decreased the Prevotella in colon at the phylum level.48 Radiation may lead to significant alterations in gut microbiota and detailed mechanisms underlying how the gut microbiota influences responses to radiotherapy need further study.
Abundant evidence indicates that the microbiome and its metabolome precipitate tumorigenesis in CRC tissue.49 To predict the metabolic functions of the microbial community related to human diseases between pCR and Non-pCR tumor tissues, PICRUSt was used. The dysbiosis of human microbiota has been linked to a wide range of diseases including cancer. The relative abundance of neurodegenerative disease, metabolic disease, infectious disease, immune system disease and cardiovascular disease were significantly lower in pCR group than in Non-pCR group (Figure 8).
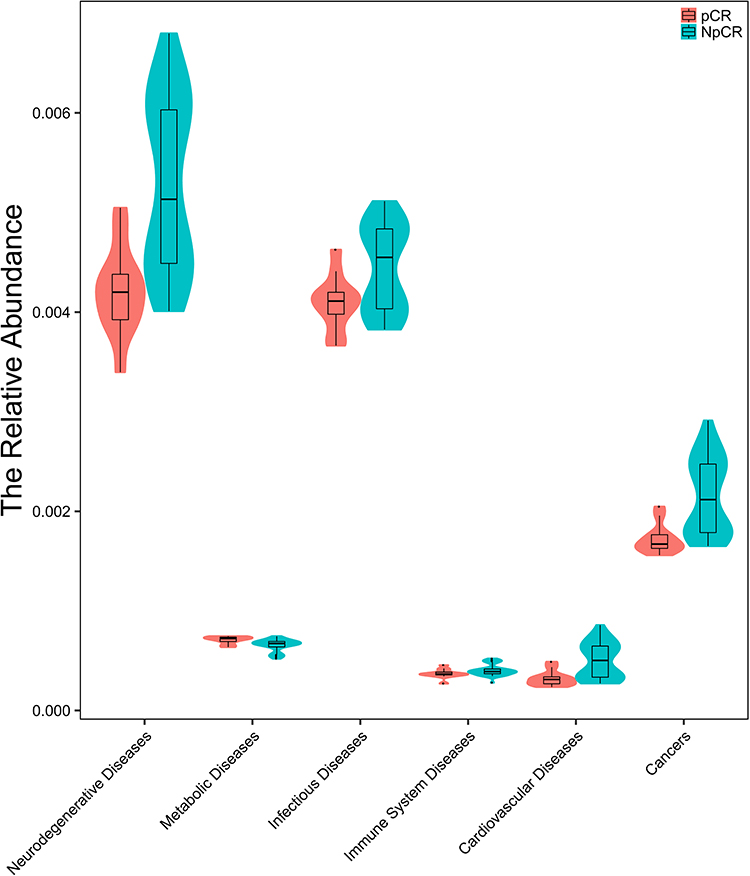 |
Figure 8 Microbiota correlation network analysis. The relative abundance of neurodegenerative disease, metabolic disease, infectious disease, immune system disease, cardiovascular disease and cancer were significantly lower in pCR group than in non-pCR group. |
This study includes noteworthy strengths and limitations. It is the first and largest study about the microbial characteristics between pCR tissues and Non-pCR tumor tissues from locally advanced rectal cancer patients after neoadjuvant chemoradiation therapy to date. Moreover, we use uniform operating procedures to obtain uniform tissue samples. Also, we analyzed the common clinical variables in detail and comprehensively. Furthermore, we chose tissue samples rather than faecal samples because tissue specimens are better and more powerful for the identification of microbiota in the initiation and development of CRC. Most importantly, We also analyzed the relationship between microbial differences after neoadjuvant therapy and clinical prognosis.
Our research also exists several obvious drawbacks. The small sample capacity is the main disadvantage so that the difference of OS was not statistically significant. Another limitation is the potential lack of typicality and representativeness of existing datasets, which only focused on our single center character. In addition, the samples were paraffin tissue samples, which might affect the microbiota profiles. More importantly, our research is not deep enough and we need to go further combine metabolomics and metatranscriptomics with metagenomics to help us move from descriptive studies to deductive mechanism research.
In summary, we demonstrated the characteristic differences in microbial communities between pCR tissues and Non-pCR tumor tissues from locally advanced rectal cancer patients after neoadjuvant chemoradiation therapy. We deduce that targeting specific species, a new direction for the precise treatment of CRC, may improve overall survival in patients with colorectal cancer.
Ethics Statement
All subjects provided written informed consent before they participated in the study. This study was approved by the Ethics Committee of Tongji Medical College of Huazhong University of Science and Technology (No.2014-041, No.2018-S377). We confirm that this study was conducted in accordance with the Declaration of Helsinki.
Acknowledgments
We thank Dr. Hongxia Zhou and Chen Chen for their help in collecting sample data. We also thank Dr. Yang Ming and Jun Fan for their technical guidance. And we also thank Profesor Li Liu for her statistical analysis guidance. Qilin Fan and Fumei Shang are co-first authors for this study.
Funding
This work was supported by the National Key R&D Program of China (2018YFC1313300), the National Natural Science Foundation of China (No.81472707) and Chinese South Western Oncology Group (CSWOG-CCET005).
Disclosure
The authors state that the research was implemented in the absence of any commercial or financial relationships that could be construed as a latent conflict of interest.
References
1. WHO. Cancer; 2018. Available from: http://www.who.int/news-room/fact-sheets/detail/cancer.
2. Costello EK, Stagaman K, Dethlefsen L, et al. The application of ecological theory toward an understanding of the human microbiome. Science. 2012;336:1255–1262. doi:10.1126/science.1224203
3. Proctor LM. The human microbiome project in 2011 and beyond. Cell Host Microbe. 2011;10:287–291. doi:10.1016/j.chom.2011.10.001
4. Sender R, Fuchs S, Milo R. Revised estimates for the number of human and bacteria cells in the body. PLoS Biol. 2016;14:e1002533. doi:10.1371/journal.pbio.1002533
5. Chen W, Liu F, Ling Z, et al. Human intestinal lumen and mucosa-associated microbiota in patients with colorectal cancer. PLoS One. 2012;7:e39743. doi:10.1371/journal.pone.0039743
6. Bosch TCG, McFall-Ngai MJ. Metaorganisms as the new frontier. Zoology (Jena). 2011;114(11):185–190. doi:10.1016/j.zool.2011.04.001
7. Dzutsev A, Goldszmid RS, Viaud S, et al. The role of the microbiota in inflammation, carcinogenesis, and cancer therapy. Eur J Immunol. 2015;45(1):17–31. doi:10.1002/eji.201444972
8. Shi W, Shen L, Zou W, et al. The Gut microbiome is associated with therapeutic responses and toxicities of neoadjuvant chemoradiotherapy in rectal cancer patients - a pilot study. Front Cell Infect Microbiol. 2020;10:562463. doi:10.3389/fcimb.2020.562463
9. Mandard AM, Dalibard F, Mandard JC, et al. Pathologic assessment of tumor regression after preoperative chemoradiotherapy of esophageal carcinoma. Clinicopathologic correlations. Cancer. 1994;73(11):2680–2686. doi:10.1002/1097-0142(19940601)73:11<2680::AID-CNCR2820731105>3.0.CO;2-C
10. DeSantis TZ, Hugenholtz P, Larsen N, et al. Greengenes, a chimera-checked 16S rRNA gene database and workbench compatible with ARB. Appl Environ Microbiol. 2006;72:5069–5072. doi:10.1128/aem.03006-05
11. Bokulich NA, Subramanian S, Faith JJ, et al. Quality-filtering vastly improves diversity estimates from Illumina amplicon sequencing. Nat Methods. 2013;10:57–59. doi:10.1038/nmeth.2276
12. Paul D, Kumbhare SV, Mhatre SS, et al. Exploration of microbial diversity and community structure of Lonar Lake: the only hypersaline meteorite Crater Lake within Basalt Rock. Front Microbiol. 2015;6:1553. doi:10.3389/fmicb.2015.01553
13. White JR, Nagarajan N, Pop M, et al. Statistical methods for detecting differentially abundant features in clinical metagenomic samples. PLoS Comput Biol. 2009;5:e1000352. doi:10.1371/journal.pcbi.1000352
14. Paul S, Andrew M, Owen O, et al. Cytoscape: a software environment for integrated models of biomolecular interaction networks. Genome Res. 2003;13:2498–2504. doi:10.1101/gr.1239303
15. Gagnière J, Raisch J, Veziant J, et al. Gut microbiota imbalance and colorectal cancer. World J Gastroenterol. 2016;22:501–518. doi:10.3748/wjg.v22.i2.501
16. Riquelme E, Zhang Y, Zhang L, et al. Tumor microbiome diversity and composition influence pancreatic cancer outcomes. Cell. 2019;178(4):795–806.e12. doi:10.1016/j.cell.2019.07.008
17. Yu G, Gail MH, Shi J, et al. Association between upper digestive tract microbiota and cancer-predisposing states in the esophagus and stomach. Cancer Epidemiol Biomarkers Prev. 2014;23:735–741. doi:10.1158/1055-9965.EPI-13-0855
18. Liu Y, Lin Z, Lin Y, et al. Streptococcus and prevotella are associated with the prognosis of oesophageal squamous cell carcinoma. Med Microbiol. 2018;67:1058–1068. doi:10.1099/jmm.0.000754
19. Bi H, Tian Y, Song C, et al. Urinary microbiota - a potential biomarker and therapeutic target for bladder cancer. Med Microbiol. 2019;68:1471–1478. doi:10.1099/jmm.0.001058
20. Yachida S, Mizutani S, Shiroma H, et al. Metagenomic and metabolomic analyses reveal distinct stage-specific phenotypes of the gut microbiota in colorectal cancer. Nat Med. 2019;25:968–976. doi:10.1038/s41591-019-0458-7
21. Wang T, Cai G, Qiu Y, et al. Structural segregation of gut microbiota between colorectal cancer patients and healthy volunteers. ISME J. 2012;6:320–329. doi:10.1038/ismej.2011.109
22. Abdulamir AS, Hafidh RR, Bakar FA, et al. The association of Streptococcus bovis/gallolyticus with colorectal tumors: the nature and the underlying mechanisms of its etiological role. J Exp Clin Cancer Res. 2011;30:11. doi:10.1186/1756-9966-30-11
23. Klein RS, Recco RA, Catalano MT, et al. Association of Streptococcus bovis with carcinoma of the colon. N Engl J Med. 1977;297:800–802. doi:10.1056/NEJM197710132971503
24. Grahn N, Hmani-Aifa M, Fransén K, et al. Molecular identification of Helicobacter DNA present in human colorectal adenocarcinomas by 16S rDNA PCR amplification and pyrosequencing analysis. J Med Microbiol. 2005;54:1031–1035. doi:10.1099/jmm.0.46122-0
25. Zumkeller N, Brenner H, Zwahlen M, et al. Helicobacter pylori infection and colorectal cancer risk: a meta-analysis. Helicobacter. 2006;11:75–80. doi:10.1111/j.1523-5378.2006.00381.x
26. Housseau F, Sears CL. Enterotoxigenic Bacteroides fragilis (ETBF)-mediated colitis in Min (Apc±) mice: a human commensal-based murine model of colon carcinogenesis. Cell Cycle. 2010;9:3–5. doi:10.4161/cc.9.1.10352
27. Toprak NU, Yagci A, Gulluoglu BM, et al. A possible role of Bacteroides fragilis enterotoxin in the aetiology of colorectal cancer. Clin Microbiol Infect. 2006;12:782–786. doi:10.1111/j.1469-0691.2006.01494.x
28. Wu S, Morin PJ, Maouyo D, et al. Bacteroides fragilis enterotoxin induces c-Myc expression and cellular proliferation. Gastroenterology. 2003;124:392–400. doi:10.1053/gast.2003.50047
29. Chew SS, Lubowski DZ. Clostridium septicum and malignancy. ANZ J Surg. 2001;71:647–649. doi:10.1046/j.1445-1433.2001.02231.x
30. Hermsen JL, Schurr MJ, Kudsk KA, et al. Phenotyping Clostridium septicum infection: a surgeon’s infectious disease. J Surg Res. 2008;148(1):67–76. doi:10.1016/j.jss.2008.02.027
31. Mirza NN, McCloud JM, Cheetham MJ, et al. Clostridium septicum sepsis and colorectal cancer - a reminder. World J Surg Oncol. 2009;7:73. doi:10.1186/1477-7819-7-73
32. Kostic AD, Chun E, Robertson L, et al. Fusobacterium nucleatum potentiates intestinal tumorigenesis and modulates the tumor-immune microenvironment. Cell Host Microbe. 2013;14:207–215. doi:10.1016/j.chom.2013.07.007
33. McCoy AN, Araújo-Pérez F, Azcárate-Peril A, et al. Fusobacterium is associated with colorectal adenomas. PLoS One. 2013;8:e53653. doi:10.1371/journal.pone.0053653
34. Rubinstein MR, Wang X, Liu W, et al. Fusobacterium nucleatum promotes colorectal carcinogenesis by modulating E-cadherin/β-catenin signaling via its FadA adhesin. Cell Host Microbe. 2013;14(2):195–206. PMID: 23954158. doi:10.1016/j.chom.2013.07.012
35. Martin HM, Campbell BJ, Hart CA, et al. Enhanced Escherichia coli adherence and invasion in Crohn’s disease and colon cancer. Gastroenterology. 2004;127:80–93. doi:10.1053/j.gastro.2004.03.054
36. Swidsinski A, Khilkin M, Kerjaschki D, et al. Association between intraepithelial Escherichia coli and colorectal cancer. Gastroenterology. 1998;115:281–286. doi:10.1016/S0016-5085(98)70194-5
37. Arthur JC, Perez-Chanona E, Mühlbauer M, et al. Intestinal inflammation targets cancer-inducing activity of the microbiota. Science. 2012;338(6103):120–123. doi:10.1126/science.1224820
38. Boleij A, Tjalsma H. Gut bacteria in health and disease: a survey on the interface between intestinal microbiology and colorectal cancer. Biol Rev Camb Philos Soc. 2012;87:701–730
39. Tjalsma H, Boleij A, Marchesi JR, et al. A bacterial driver-passenger model for colorectal cancer: beyond the usual suspects. Nat Rev Microbiol. 2012;10:575–582. doi:10.1038/nrmicro2819
40. Flanagan L, Schmid J, Ebert M, et al. Fusobacterium nucleatum associates with stages of colorectal neoplasia development, colorectal cancer and disease outcome. Eur J Clin Microbiol Infect Dis. 2014;33:1381–1390. PMID: 24599709. doi:10.1007/s10096-014-2081-3
41. Mima K, Nishihara R, Qian ZR, et al. Fusobacterium nucleatum in colorectal carcinoma tissue and patient prognosis. Gut. 2016;65:1973–1980. PMID: 26311717. doi:10.1136/gutjnl-2015-310101
42. Yu T, Guo F, Yu Y, et al. Fusobacterium nucleatum promotes chemoresistance to colorectal cancer by modulating autophagy. Cell. 2017;170:548–563.
43. Hu Y-L, Pang W, Huang Y, et al. The gastric microbiome is perturbed in advanced gastric adenocarcinoma identified through shotgun metagenomics. Front Cell Infect Microbiol. 2018;8:433. doi:10.3389/fcimb.2018.00433
44. Yang I, Woltemate S, Piazuelo MB, et al. Different gastric microbiota compositions in two human populations with high and low gastric cancer risk in Colombia. Sci Rep. 2016;6:18594. doi:10.1038/srep18594
45. Chan AA, Bashir M, Rivas MN, et al. Characterization of the microbiome of nipple aspirate fluid of breast cancer survivors. Sci Rep. 2016;6:28061. doi:10.1038/srep28061
46. Mei Q-X, Huang C-L, Luo S-Z, et al. Characterization of the duodenal bacterial microbiota in patients with pancreatic head cancer vs. healthy controls. Pancreatology. 2018;18(4):438–445. doi:10.1016/j.pan.2018.03.005
47. Yu T, Guo F, Yu Y, et al. Fusobacterium nucleatum promotes chemoresistance to colorectal cancer by modulating autophagy. Cell. 2017;170(3):548–563.e16. doi:10.1016/j.cell.2017.07.008
48. Kim YS, Kim J, Park S-J, et al. High-throughput 16SrRNA gene sequencing reveals alterations of mouse intestinal microbiota after radiotherapy. Anaerobe. 2015;33:1–7. doi:10.1016/j.anaerobe.2015.01.004
49. Yang Y, Misra BB, Liang L, et al. Integrated microbiome and metabolome analysis reveals a novel interplay between commensal bacteria and metabolites in colorectal cancer. Theranostics. 2019;9(14):4101–4114. doi:10.7150/thno.35186
 © 2021 The Author(s). This work is published and licensed by Dove Medical Press Limited. The full terms of this license are available at https://www.dovepress.com/terms.php and incorporate the Creative Commons Attribution - Non Commercial (unported, v3.0) License.
By accessing the work you hereby accept the Terms. Non-commercial uses of the work are permitted without any further permission from Dove Medical Press Limited, provided the work is properly attributed. For permission for commercial use of this work, please see paragraphs 4.2 and 5 of our Terms.
© 2021 The Author(s). This work is published and licensed by Dove Medical Press Limited. The full terms of this license are available at https://www.dovepress.com/terms.php and incorporate the Creative Commons Attribution - Non Commercial (unported, v3.0) License.
By accessing the work you hereby accept the Terms. Non-commercial uses of the work are permitted without any further permission from Dove Medical Press Limited, provided the work is properly attributed. For permission for commercial use of this work, please see paragraphs 4.2 and 5 of our Terms.