")
Back to Journals » OncoTargets and Therapy » Volume 12
Methotrexate-induced apoptosis in human ovarian adenocarcinoma SKOV-3 cells via ROS-mediated bax/bcl-2-cyt-c release cascading
Authors AlBasher G, AlKahtane AA, Alarifi S , Ali D , Alessia MS, Almeer RS, Abdel-Daim MM, Al-Sultan NK, Al-Qahtani AA , Ali H , Alkahtani S
Received 27 June 2018
Accepted for publication 3 October 2018
Published 17 December 2018 Volume 2019:12 Pages 21—30
DOI https://doi.org/10.2147/OTT.S178510
Checked for plagiarism Yes
Review by Single anonymous peer review
Peer reviewer comments 1
Editor who approved publication: Prof. Dr. Takuya Aoki
Gadah AlBasher,1 Abdullah A AlKahtane,1 Saud Alarifi,1 Daoud Ali,1 Mohammed S Alessia,2 Rafa S Almeer,1 Mohamed M Abdel-Daim,3 Nouf K Al-Sultan,1 Ahmed A Al-Qahtani,4,5 Huma Ali,6 Saad Alkahtani1
1Department of Zoology, College of Science, King Saud University, Riyadh, Saudi Arabia; 2Department of Biology, Science College, Al-Imam Muhammad Ibn Saud, Islamic University, Riyadh, Saudi Arabia; 3Department of Pharmacology, Faculty of Veterinary Medicine, Suez Canal University, Ismailia, Egypt; 4Department of Infection and Immunity, Research Center, King Faisal Specialist Hospital and Research Center, Riyadh, Saudi Arabia; 5Department of Microbiology and Immunology, Alfaisal University School of Medicine, Riyadh, Saudi Arabia; 6Department of Chemistry Maulana Azad National Institute of Technology, Bhopal, India
Introduction: The communication between a substance and a cell may depend on whether the cell is normal or pathological. The disease cells and drug interaction may occasionally overcome beneficial action of the drug; subsequently, it is important to investigate the effect of the drug in both the normal and target cells. This study aimed to evaluate the methotrexate (MTX) antiproliferative effect and explore the mechanistic approach to investigate the cell death index in SKOV-3 ovarian cells during treatment with MTX.
Methods: In vitro studies of SKOV-3 cells were examined by tetrazolium assay after exposure to various concentrations of MTX. Moreover, reactive oxygen species (ROS) generation, mitochondrial membrane potential, DNA damage, and AO/EtBr staining morphological analysis of necrotic/apoptotic cells were detected; cellular impairment in mitochondria and DNA was confirmed by JC-1 mitotracker/DAPI, respectively, and cell death pathway markers; bax/bcl-2 were analyzed.
Results: A dose-dependent antiproliferative effect of MTX treatment was observed in SKOV-3 cells; the prominent inhibitory concentration was 40 µM of MTX (P<0.01). The growth inhibition rates of the cancer cells reached 24.07% in MTX. The MTX showed increase in ROS generation and mitochondrial depolarization, and DNA integrity cells collectively advocated the apoptotic cell death at higher concentration. In addition, the results of reverse transcription polymerase chain reaction also supported the apoptosis by upregulating the bax and downregulating the bcl-2 (P<0.01). Thus the MTX moderately provokes apoptosis.
Conclusion: Our findings suggest that MTX acts on SKOV-3 cancer cells by increasing intracellular ROS levels, leading to DNA damage and altering the MMP along with apoptotic gene upregulation. This mechanism may provide new therapeutic targets to improve tumor treatment.
Keywords: methotrexate, MMP, apoptosis, ROS, SKOV-3 cells
Introduction
Ovarian carcinoma demonstrates a consistently increasing occurrence rate, making it the deadliest female reproductive issue. The disease is complicated by various issues including the non-appearance of specific side effects, a lack of specific screening, and chemoresistance.1 Chemotherapy is the main treatment option for ovarian cancer that is diagnosed at stage 3 or 4 and has a poor prognosis.2,3 At the beginning of chemotherapy, ovarian carcinoma is generally responsive, but the reduced effectiveness of chemotherapy over time is caused by increased resistance to programmed cell death in cancer cells and/or the discontinuation of therapy.4 The toxicity of anticancer drugs involves the destruction of rapidly dividing cells.5 The side effects of such drugs often result in a decrease in dose or a delay/cessation in treatment. To date, methotrexate (MTX) has been used in the treatment of various malignancies including Hodgkin’s lymphoma, childhood acute lymphocytic leukemia, osteosarcoma, head and neck cancer, and ovarian, prostate, lung and breast malignancies.6 MTX is an antimetabolic drug and can successfully deactivate cell metabolism through apoptosis.7 It hinders intracellular folate metabolism and obstructs the synthesis of thymine and purines, prompting the hindrance of tumor development and the initiation of cell death through possible genotoxic effects or apoptosis.8
MTX has a narrow therapeutic index, and its toxicity has been reported in various organ systems. It demonstrates nephrotoxicity, leukemic toxicity, and central nervous system toxicity.9 Therefore, established therapeutic ranges for MTX account for its functional amino acid group to protect against genotoxic damage. MTX can stimulate reactive oxygen species (ROS) generation, which may be a possible mechanism underlying its apoptotic induction.10 ROS levels can affect cell proliferation. When intracellular ROS levels are greater than a specific limit, ROS hinders the cell cycle and induces DNA damage, prompting cell apoptosis.
Mitochondria assume a major role in cell apoptosis. The mitochondrial pathway prompts ROS aggregation on membrane phospholipids and a reduction in mitochondrial membrane potential (MMP). Depolarization of mitochondria, along with fragmented nuclei,11 modulates the bax/bcl-2 ratio, leading to mitochondrial permeabilization. Apoptosis-mediated DNA damage stimulates the upregulation of bax, which translocates to mitochondria and suppresses the action of bcl-2.12 Moreover, the release of cytochrome-c (cyt-c) results from the opening of the mitochondrial permeability transition pore. Overexpression of bax triggers a release of cyt-c from mitochondria.13 In the current study, we investigated the following: 1) the antiproliferative potential of MTX, 2) ROS generation and DNA damage induced by MTX, and 3) the role of bax/bcl-2-cyt-c levels in apoptotic cell death.
Materials and methods
Reagents and cell culture
Human ovarian adenocarcinoma (SKOV-3) cell line was procured from American Type Culture Collection (Manassas, VA, USA). McCoy’s 5a media, fetal bovine serum (FBS), 0.05% trypsin-EDTA solution (1×), antibiotic-antimycotic solution (100×), and 3-(4,5-dimethylthiazol-2-yl)-2,5-diphenyl-2H-tetrazolium bromide were purchased from Thermo Fisher Scientific (Waltham, MA, USA). Phosphate and carbonate buffers, acridine orange (AO), ethidium bromide (EtBr), JC-1 stain (Enzo Life Sciences. Lausen, Switzerland), mitotracker (Thermo Fisher Scientific).
The cells were maintained in McCoy 5A culture medium supplemented with 10% FBS, antibiotics, and antimycotic solution in a humidified atmosphere containing 5% CO2 at room temperature and then subcultured 48 hours before use. Exponentially growing cells (1×10⁴) were plated per well in 96-well microtiter plates (each 100 μL) and incubated for 24 hours for MTT assay. MTX (1 mM) stock solutions were prepared in dimethyl sulfoxide and mixed with fresh McCoy 5A culture medium.
Morphology of SKOV-3 cells and cell proliferation assay
The morphology of SKOV-3 cells after MTX exposure was observed using phase-contrast microscopy (Nikon Eclipse TE 2000; Nikon Corporation, Tokyo, Japan). The anti-proliferation and cytotoxic effects of MTX on SKOV-3 cells were assessed using the MTT dye uptake technique.14 Briefly, 1×10⁵ cells/well were seeded in a 96-well plate for 24 hours at 37°C. Then, MTT solution (5 mg/mL) was added to each well. After reaching 80% confluency, the cells were treated using various doses of MTX (1, 5, 10, 15, 20, 25, and 50 μM). The OD value of the MTT-stained culture plate was measured using a Bio-Rad microplate reader (Model 550) at 570 nm. The median maximal inhibitory concentration (IC50) value (ie, the concentration of MTX needed to inhibit half of the maximum biological response) was estimated using the plot of these OD values.
Determination of intracellular ROS generation
An estimation of intracellular ROS in SKOV-3 cells treated using MTX was performed using the 2′,7′-dichlorofluorescin diacetate dye method.15 The SKOV-3 cells (1×10⁵ cells/well) were seeded in six-well plates and dark 96-well plates and incubated overnight to attach. After reaching 70% confluency, cells were treated using MTX (15, 25, and 50 μM) for 24 hours. Carboxy 2′,7′-Dichlorofluorescin diacetate (H2-DCFDA) (5 μM) in Hanks’ Balanced Salt Solution (HBSS) was added for 30 minutes at room temperature. The level of intracellular ROS was validated through the administration of N-acetyl cysteine (NAC) (10 μM) as a specific quencher. The ROS generation results were assessed using a fluorescence microplate reader (FLUO star Omega; BMG Labtech, Ortenberg, Germany) at 485 nm excitation and 520 nm emission. Qualitative ROS images were captured through fluorescence microscopy at 485 nm excitation and 520 nm emission.15
MMP assay
To investigate the MMP, the fluorescent JC-1 dye was used by following Saeed et al’s protocol.16 There was a decrease in red/green fluorescence intensity ratio, an indication of mitochondrial depolarization by a fluorescence emission shift from green (529 nm) to red (590 nm). Healthy cells are in red while apoptotic cells are in green.
Cells were grown in six-well plates (1.5×10⁵ cells/well) and treated with MTX (15, 25, and 50 μM). After 24 hours incubation, 5 mM JC-1 stain was added to each well and incubated at room temperature for 30 minutes, and images were visualized by fluorescence microscope (Nikon Eclipse 80i with Nikon DS-Ri1 12.7-megapixel camera; Nikon Corporation).
The quantitative result was examined by using a fluorescence microplate reader (FLUO star Omega; BMG Labtech) at 529 nm excitation and 590 nm emission.
Mitotracker/DAPI staining
The integrity of mitochondria was examined by using mitotracker fluorescent dye following the protocol.17 In brief, after exposure to MTX (15, 25, and 50 μM) for 24 hours, SKOV-3 cells were incubated with mitotracker (100 mM) at room temperature for 15 minutes. The cells were then fixed in 4% paraformaldehyde for 20 minutes, permeabilized in Triton X-100 (0.1%) for 20 minutes, and stained with DAPI (0.1 μg/mL) for 5 minutes at room temperature, that is, targeting DNA in the cell nucleus, photographs were taken by fluorescence microscope (Nikon Eclipse 80i with Nikon DS-Ri1 12.7 megapixel camera).
Morphological assessment of apoptotic cells by AO/EtBr staining
The SKOV-3 cell death induced by MTX was determined by AO and EtBr staining followed by Kitazumi et al protocol.18 SKOV-3 cells were exposed to MTX (15, 25, and 50 μM) for 24 hours. After incubation, the treated cells were trypsinized and centrifuged at 1,500 rpm for 5 minutes. The cells were then re-suspended in cold PBS and again centrifuged at 1,500 rpm for 5 minutes to obtain fresh clean pellets. The pellets were mixed with fluorescent dye staining solution, that is, cocktail of AO/EtBr (1:1). The freshly stained cell suspension was dropped onto a glass slide and observed under a fluorescence microscope (Nikon Eclipse 80i with Nikon DS-Ri1 12.7 megapixel camera). The morphological criteria used for the classification of healthy, apoptotic, and necrotic cells are according to the recommendations from the INHAND Apoptosis/Necrosis Working Group.19
Assessment of DNA damage using single-cell gel electrophoresis
The cells treated with MTX (15, 25, and 50 μM) were harvested with 0.06% trypsin.20 Single-strand DNA damage was determined by a three-layer procedure. In brief, 1.5×10⁵ cells/well were seeded in a six-well plate. After 70%–80% confluency, cells were treated with MTX. The cells were then scored using an image analysis system (Komet-5.0; Kinetic Imaging, Liverpool, UK) connected to a fluorescent microscope (DMLB; Leica Microsystems, Wetzlar, Germany). About 100 cells per concentration (50 cells per slide) were analyzed. The DNA lesion in the cells was quantified as % tail DNA (head DNA) and olive tail moment (OTM).
RNA isolation, cDNA synthesis, and reverse transcription polymerase chain reaction (RT-PCR) analysis
Total RNA was isolated by using phenol-chloroform by TRIzol (Thermo Fisher Scientific) method. Concentration and purity of the RNA were determined by nano-drop spectrophotometer at 260 nm (DS-11; Bio-Rad Laboratories Inc., Hercules, CA, USA). For real-time PCR, cDNA was synthesized by high-capacity cDNA reverse transcription kit (RevertAid First Strand cDNA Synthesis Kit; Thermo Fisher Scientific). The quantitative real-time PCR analysis was done for bax, bcl-2, and cyt-c mRNA using ABI-sequence detection system (PE Applied Biosystems, Foster City, CA, USA).
Primer sequences of apoptotic genes are listed in Table 1. Real-time PCR conditions such as initial denaturing for 5 minutes at 95°C followed by 30 cycles, 95°C for 10 second and 50°C for 1 minute, and the cycle threshold (Ct) values were standardized to the housekeeping gene (GAPDH), and the fold change was calculated by using ΔΔCt method.21 Each sample was assayed in duplicates.22
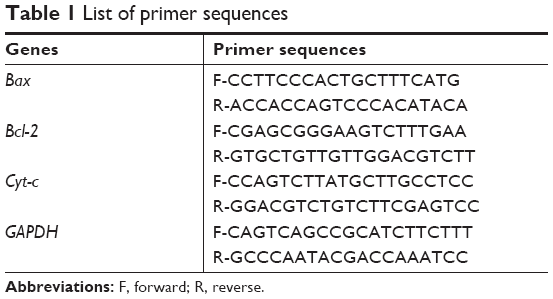 | Table 1 List of primer sequences |
Statistical analysis
All data are presented as mean ± standard errors (mean ± SE). Statistical analysis of the results was performed by one-way analysis of variance followed by post hoc as significance analysis. P-value <0.01 was considered significant. All the analyses were carried out on the SPSS 16.0 version (SPSS Inc., Chicago, IL, USA).
Results
MTX reduces the cell viability of the SKOV-3 cell
After exposure to MTX, the morphology of SKOV-3 cell lines did not change at lower concentration but at 25 μM and at 50 μM, MTX exposure cells become round shape and detached from the surface of the culture plates (Figure 1A–C).
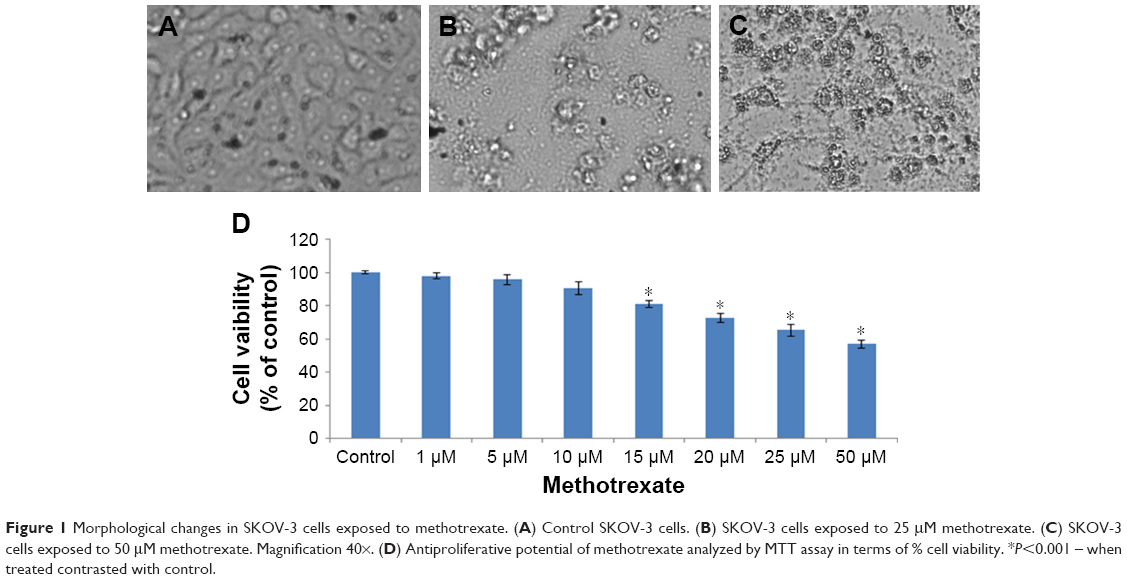 | Figure 1 Morphological changes in SKOV-3 cells exposed to methotrexate. (A) Control SKOV-3 cells. (B) SKOV-3 cells exposed to 25 μM methotrexate. (C) SKOV-3 cells exposed to 50 μM methotrexate. Magnification 40×. (D) Antiproliferative potential of methotrexate analyzed by MTT assay in terms of % cell viability. *P<0.001 – when treated contrasted with control. |
To evaluate the anticancer effect of MTX in SKOV-3 cell lines, the cell viability assays were performed in SKOV-3 cell lines. The antiproliferative effect of MTX at various concentrations on the SKOV-3 cell was determined by using MTT assay. MTT attributed no significant reduction in cellular proliferation till the 25 μM but at 50 μM it showed IC50 in SKOV-3 cells (Figure 1D).
MTX treatment induces ROS generation in SKOV-3 cells
SKOV-3 showed a significant concentration increase in the generation of ROS in terms of 2′,7′-dichlorofluorescein (DCF) fluorescence intensity, fluorescence intensity increase to 50% in MTX (50 μM)-treated group after 24 hours exposure compared to control. We predicted that the anticancer effects of different concentration of MTX might be due to the production of ROS in SKOV-3 cells (Figure 2A–C). The results corroborated that MTX-induced ROS was a critical factor for human ovarian adenocarcinoma SKOV-3 cell death.
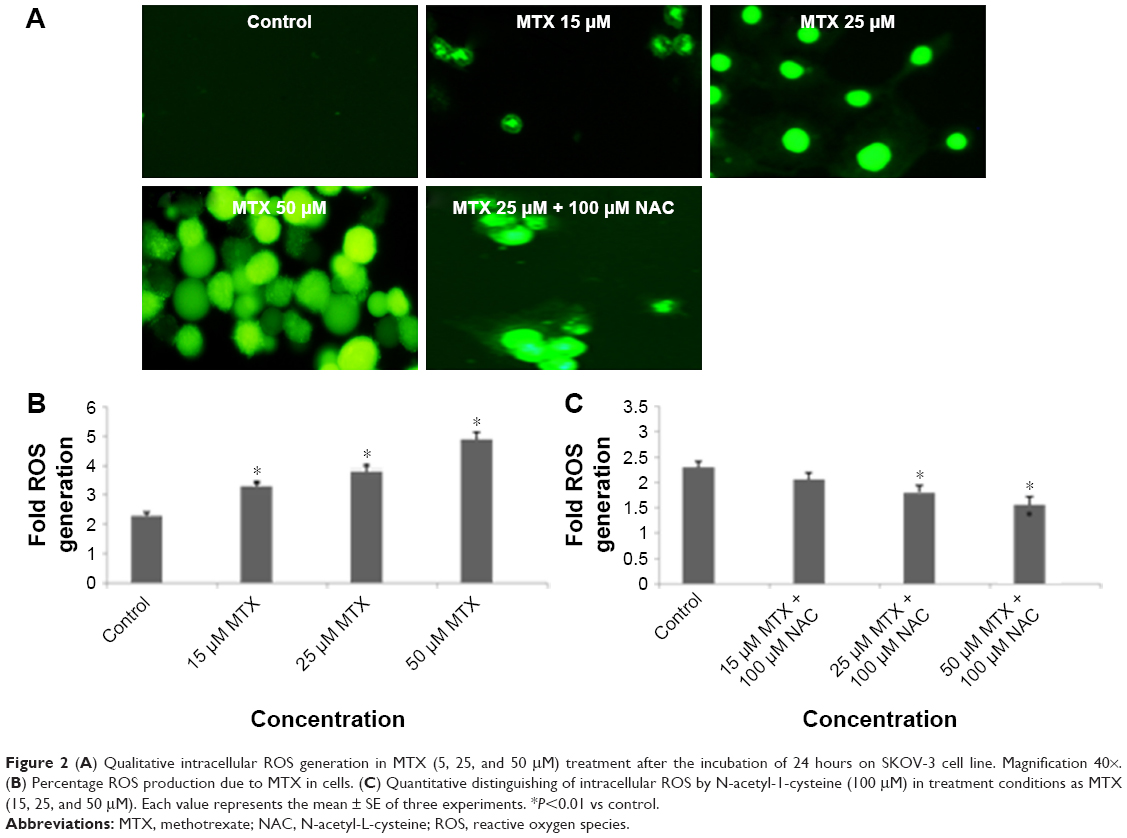 | Figure 2 (A) Qualitative intracellular ROS generation in MTX (5, 25, and 50 μM) treatment after the incubation of 24 hours on SKOV-3 cell line. Magnification 40×. (B) Percentage ROS production due to MTX in cells. (C) Quantitative distinguishing of intracellular ROS by N-acetyl-1-cysteine (100 μM) in treatment conditions as MTX (15, 25, and 50 μM). Each value represents the mean ± SE of three experiments. *P<0.01 vs control. |
MTX treatment causes mitochondrial membrane depolarization in SKOV-3 cells
We explored the subcellular localization of mitochondria by mitotracker Red CMX-Ros and DNA by DAPI. The fluorescent microscopy results demonstrated that loss of MMP (green intensity) in parallel to DNA fragmentation (blue intensity) (Figure 3A and B) in MTX (50 μM) concentration. For further confirmation of MMP, the SKOV-3 cells were stained with mitotracker/DAPI staining. In control, the mitochondrial membrane intact while in MTX exposure (15, 25, and 50 μM) showed loss of membrane integrity in a dose-dependent manner, and it confirms the release of cyt-c from the mitochondria (Figure 4A–D).
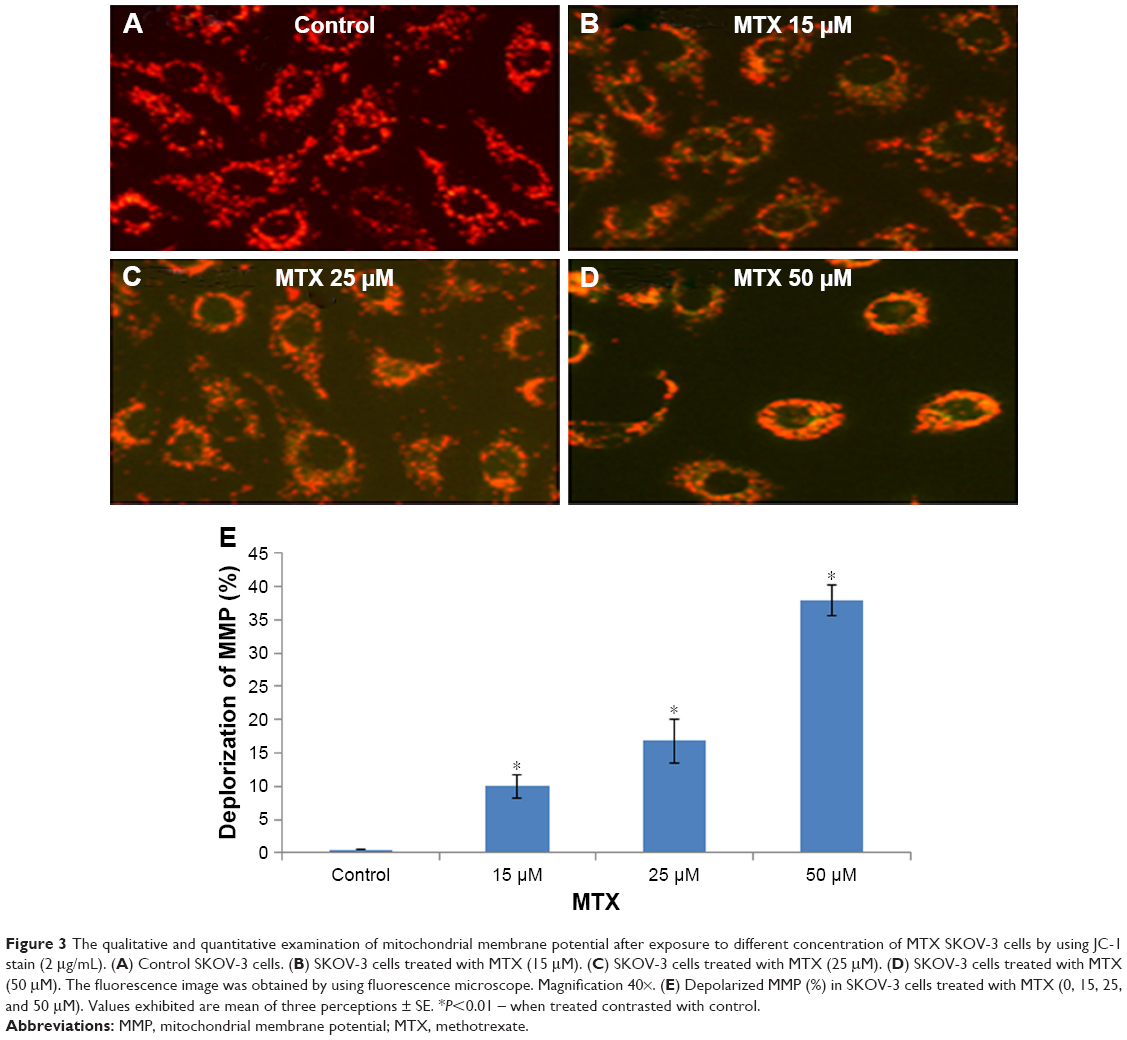 | Figure 3 The qualitative and quantitative examination of mitochondrial membrane potential after exposure to different concentration of MTX SKOV-3 cells by using JC-1 stain (2 μg/mL). (A) Control SKOV-3 cells. (B) SKOV-3 cells treated with MTX (15 μM). (C) SKOV-3 cells treated with MTX (25 μM). (D) SKOV-3 cells treated with MTX (50 μM). The fluorescence image was obtained by using fluorescence microscope. Magnification 40×. (E) Depolarized MMP (%) in SKOV-3 cells treated with MTX (0, 15, 25, and 50 μM). Values exhibited are mean of three perceptions ± SE. *P<0.01 – when treated contrasted with control. |
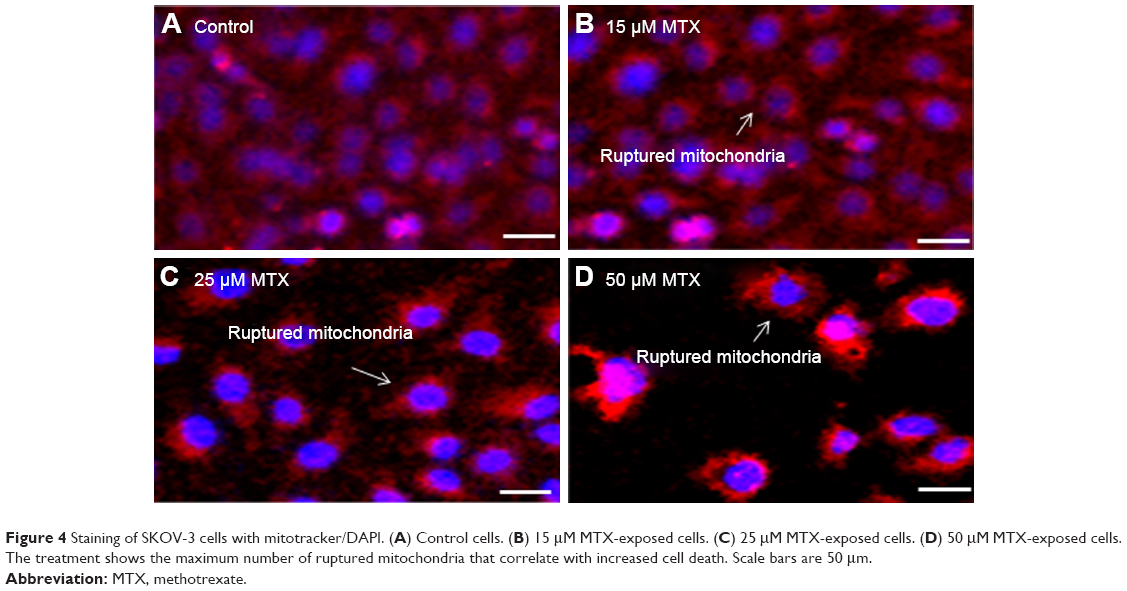 | Figure 4 Staining of SKOV-3 cells with mitotracker/DAPI. (A) Control cells. (B) 15 μM MTX-exposed cells. (C) 25 μM MTX-exposed cells. (D) 50 μM MTX-exposed cells. The treatment shows the maximum number of ruptured mitochondria that correlate with increased cell death. Scale bars are 50 μm. |
MTX induces apoptosis in SKOV-3 cells
The measure depends on nuclear morphology, particularly for apoptosis. The live cells showed typical nuclear chromatin with green fluorescence while apoptotic cells contain divided DNA (orange shading). Control cells showed typical morphology while MTX represented apoptotic cells (Figure 5A). The impact of MTX treatment indicated upgraded apoptosis which was estimated by EtBr/AO morphological analysis in SKOV-3 cells (Figure 5B).
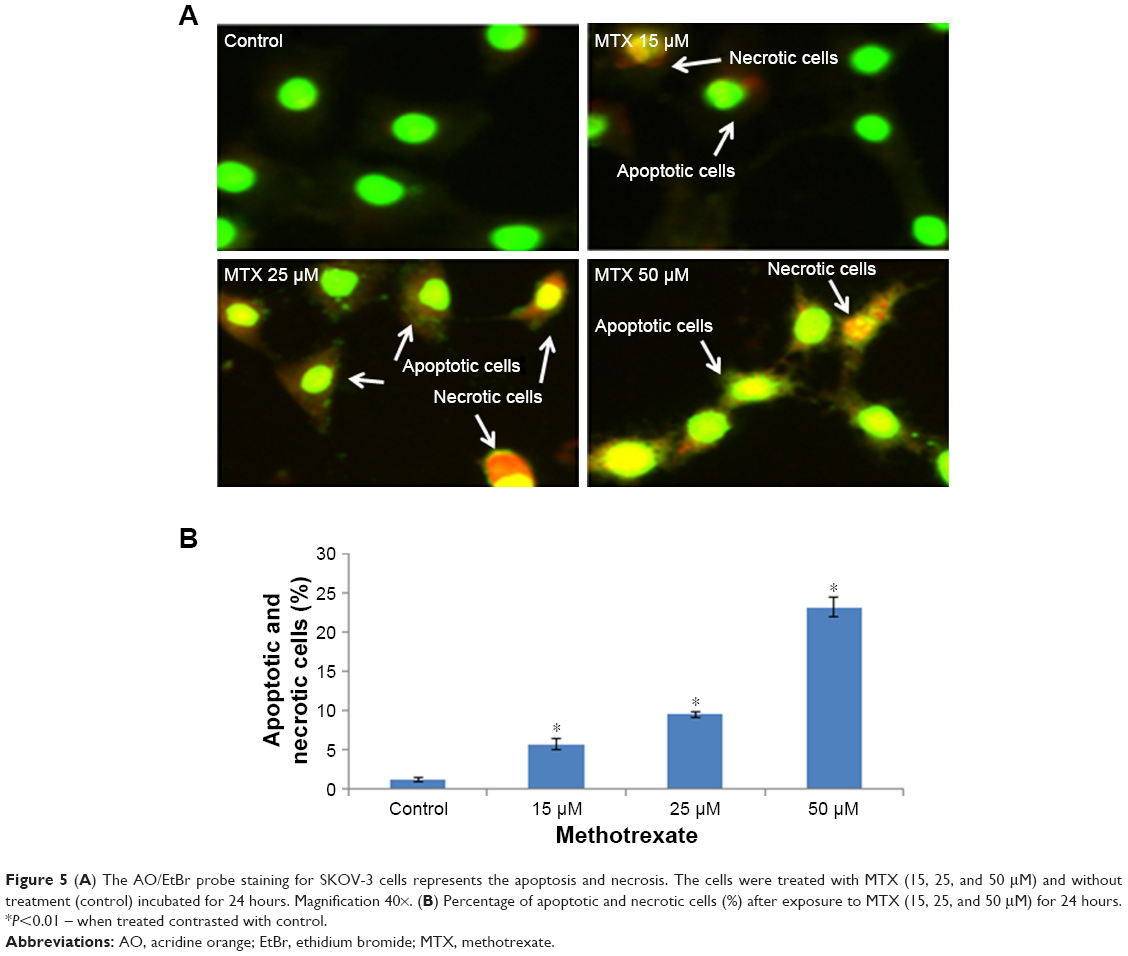 | Figure 5 (A) The AO/EtBr probe staining for SKOV-3 cells represents the apoptosis and necrosis. The cells were treated with MTX (15, 25, and 50 μM) and without treatment (control) incubated for 24 hours. Magnification 40×. (B) Percentage of apoptotic and necrotic cells (%) after exposure to MTX (15, 25, and 50 μM) for 24 hours. *P<0.01 – when treated contrasted with control. |
MTX-induced DNA damage in SKOV-3 cells
DNA damage was examined as % tail DNA and OTM in MTX-treated and control cells. It separates the dense in the core DNA head and dispersed in fragmented pieces framing the DNA tail. The results showed significant increment (12.1) fold in the formation of % tail DNA and OTM in MTX in contrast with control MTX (Figure 6A and B).
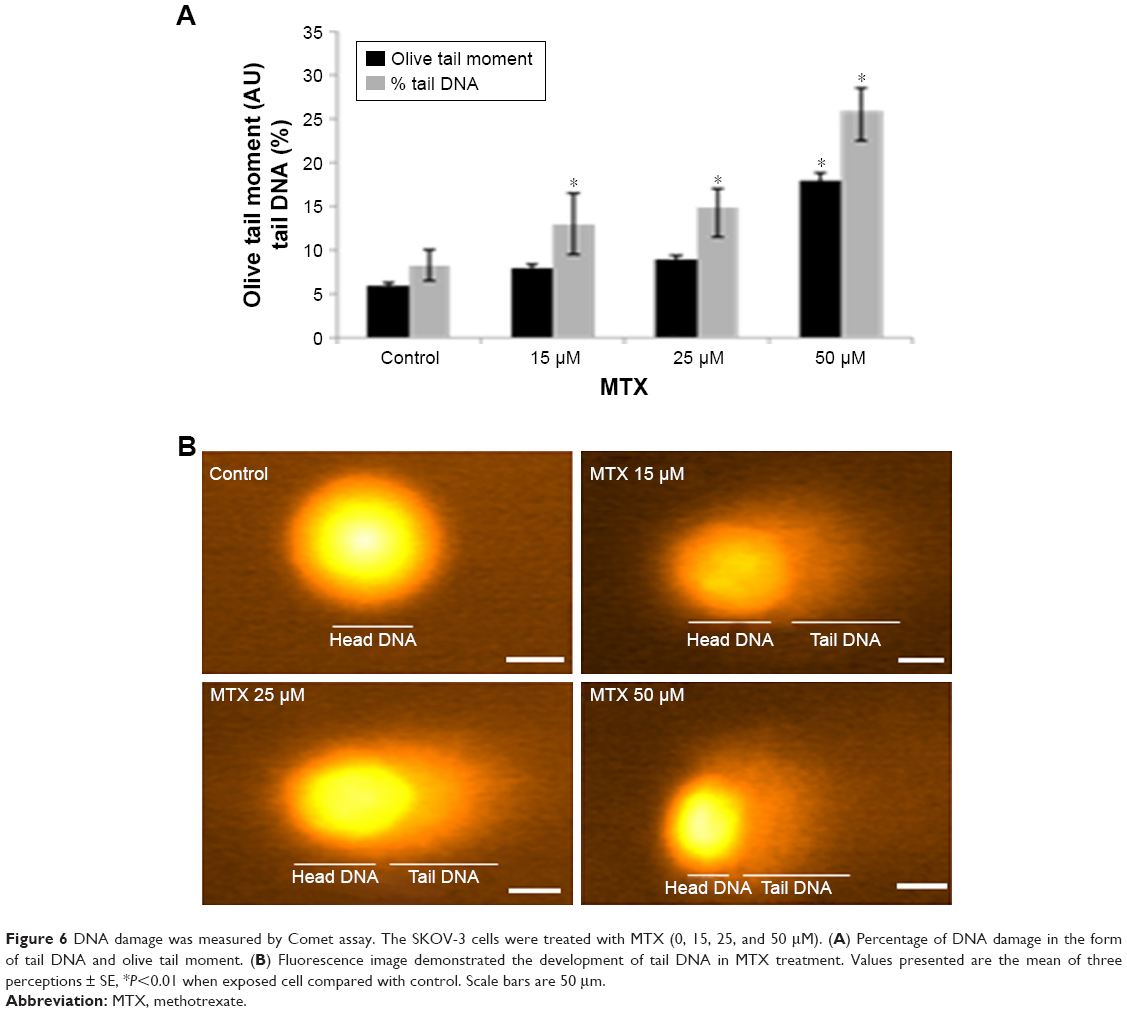 | Figure 6 DNA damage was measured by Comet assay. The SKOV-3 cells were treated with MTX (0, 15, 25, and 50 μM). (A) Percentage of DNA damage in the form of tail DNA and olive tail moment. (B) Fluorescence image demonstrated the development of tail DNA in MTX treatment. Values presented are the mean of three perceptions ± SE, *P<0.01 when exposed cell compared with control. Scale bars are 50 μm. |
Alteration in bax, bcl-2, and cyt-c release in MTX-treated SKOV-3 cells
The apoptotic marker genes such as bax, bcl-2, and cyt-c were observed by RT-PCR in MTX-treated and control cells. The pro-apoptotic mRNA bax showed considerable (P<0.01) change in MTX-exposed compare to control cells (Figure 7A). However, an insignificant (P<0.01) change was observed in antiapoptotic bcl-2 mRNA (Figure 7B) and a significant (P<0.01) upregulation of cyt-c in treated SKOV-3 cells than control (Figure 7C). This change in gene expression was reasonably connected with ROS actuated DNA damage and apoptosis in SKOV-3 cells after 24 hours incubation. As shown in MTT, the capability of MTX to inhibit SKOV-3 cell growth suggests that this MTX has a selective program cell death activity toward SKOV-3 cells.
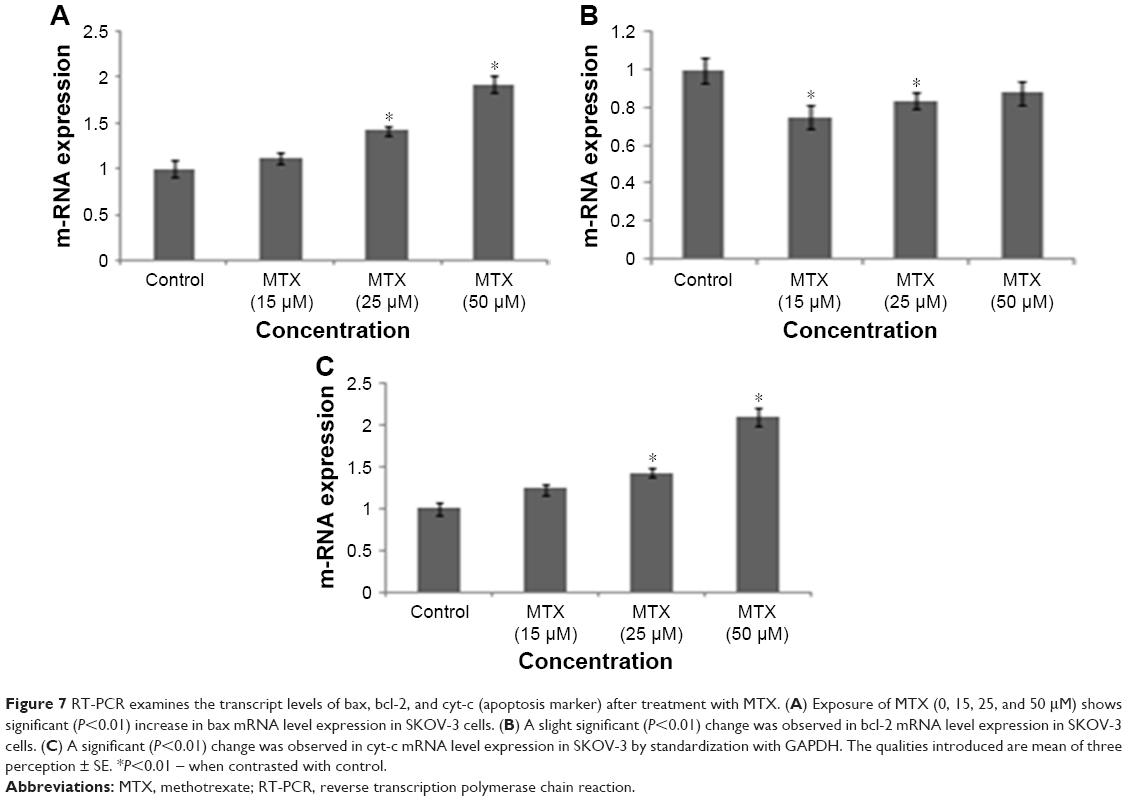 | Figure 7 RT-PCR examines the transcript levels of bax, bcl-2, and cyt-c (apoptosis marker) after treatment with MTX. (A) Exposure of MTX (0, 15, 25, and 50 μM) shows significant (P<0.01) increase in bax mRNA level expression in SKOV-3 cells. (B) A slight significant (P<0.01) change was observed in bcl-2 mRNA level expression in SKOV-3 cells. (C) A significant (P<0.01) change was observed in cyt-c mRNA level expression in SKOV-3 by standardization with GAPDH. The qualities introduced are mean of three perception ± SE. *P<0.01 – when contrasted with control. |
Discussion
Ovarian carcinoma can be treated using classical cytotoxic drugs, which makes it an attractive model cancer. MTX is a primary chemotherapeutic drug and can be used alone or in combination with other anticancer drugs. It was reported that the MTX-treated choriocarcinoma reaction response was 90%.23 The cytotoxicity and apoptotic mechanism of MTX in SKOV-3 cells were investigated in the current study. MTX affected the viability of SKOV-3 cells, and the IC50 value was found to be 50 μM. Moreover, no correlation between the IC50 values and the cellular doubling times was observed (data not shown). A perfect anticancer drug must be cytotoxic to growing cells and specific for cancer cells.24 Our MTT assay revealed that the proliferation of SKOV-3 cells was repressed by MTX.
ROS and mitochondria have lately attracted extensive scientific interest because of their fundamental role in apoptosis in many diseases. ROS is an intrinsic stimulus that instantly or in an indirect way activates the mitochondrial pathway through cyt-c discharge and the development of the apoptosome.25 MTX is involved in nucleotide metabolism and thereby exerts its cytotoxic effects,26 for example, by elevating ROS production resulting in DNA damage and impaired MMP and initiating the apoptotic (bax, bcl-2, and cyt-c release) cascade. Elevated levels of ROS contribute to stress sensing, and ROS accumulates on the phospholipid membrane and is ultimately oxidized. The mitochondrial membrane may induce disturbance of the MMP, which is an early sign of mitochondrial changes. The moderately, albeit significantly, increased levels of intracellular ROS in MTX-treated SKOV-3 cells are closely associated with MTX-mediated apoptosis. These increased ROS levels resulted in cell permeability, DNA damage, and cyt-c release from the mitochondria into the cytosol, as shown using DAPI and a mitotracker dye, and RT-PCR analysis showed an upregulation of bax and a downregulation of bcl-2. A previous study demonstrated that following exogenous and endogenous signals, mitochondria open the mitochondrial permeability transition pore, and this has been associated with increased mitochondrial permeability and loss of MMP.27
Therefore, the role of mitochondria in early apoptosis events was examined in SKOV-3 cells by investigating MMP in the context of mitochondrial apoptotic factors such as the release of cyt-c. We used JC-1, which is a pH subordinate dye indicator of MMP, and which emits red fluorescence (aggregate form) in healthy mitochondria and green fluorescence (monomeric form) in injured mitochondria. JC-1 staining in the SKOV-3 cell line demonstrated the MMP decay produced by MTX (Figure 3). Nuclear condensation and DNA fragmentation are characteristics of apoptosis. An AO/EtBr staining assessment depends on nuclear morphology and is specific for apoptosis and necrosis. AO/EtBr staining showed that live cells demonstrated ordinary nuclear staining and green chromatin with organized structures; however, apoptotic cells contained fragmented chromatin (orange).28 Our results are in excellent agreement with those suggesting that MTX could influence MMP, resulting in cell death (Figure 4). The collapse of MMP is a catastrophic process. It leads to the opening of the mitochondrial permeability transition pores in the mitochondrial membrane and the subsequent release of cyt-c in the cytosol, which in turn triggers other downstream events in the apoptotic cascade.
Moreover, the mechanism of mitochondrial permeabilization involves a family of pro-bax and antiapoptotic bcl-2 genes. The release of cyt-c induces caspase activation, ultimately resulting in programmed cell death.29 Our transcriptional study showed that increasing the bax/bcl-2 ratio favored apoptosis via the release of cyt-c. The mechanism underlying MTX-mediated apoptosis in SKOV-3 cells was demonstrated in the current study, which involves an ROS-dependent mitochondrial pathway. We conclude that MTX increases ROS levels twofold compared with a control, causing DNA damage and altering cyt-c release and the expression of bax and bcl-2. These data demonstrate that MTX elevates ROS levels, and the resultant DNA damage triggers apoptosis via mitochondrial membrane depolarization and the subsequent release of cyt-c and bax/bcl-2 activation. The bcl-2 family plays an important role in programmed cell death. Changes in the quantitative relationship between bax and bcl-2 (proapoptotic/antiapoptotic) activate the mitochondrial apoptotic pathway.30 Our RT-PCR analysis showed that MTX treatment resulted in a significant (P<0.01) increase in the expression of pro-apoptotic bax and insignificant (P<0.01) expression of bcl-2, stimulating a significant (P<0.01) release of cyt-c (Figure 6).
Our findings suggest that MTX acts on SKOV-3 cancer cells by increasing intracellular ROS levels, leading to DNA damage and altering the MMP along with apoptotic gene upregulation. This mechanism may provide new therapeutic targets to improve tumor treatment.
Acknowledgment
The authors extend their appreciation to the Deanship of Scientific Research at King Saud University for funding this work through Research Group number RGP-018.
Disclosure
The authors report no conflicts of interest in this work.
References
Tan M, Zhu L, Zhuang H, et al. Lewis Y antigen modified CD47 is an independent risk factor for poor prognosis and promotes early ovarian cancer metastasis. Am J Cancer Res. 2015;5(9):2777–2787. | ||
Lengyel E. Ovarian cancer development and metastasis. Am J Pathol. 2010;177(3):1053–1064. | ||
Jelovac D, Armstrong DK. Recent progress in the diagnosis and treatment of ovarian cancer. CA Cancer J Clin. 2011;61(3):183–203. | ||
Liu H, Lv L, Yang K. Chemotherapy targeting cancer stem cells. Am J Cancer Res. 2015;5(3):880–893. | ||
Farrand L, Oh SW, Song YS, Tsang BK. Phytochemicals: a multitargeted approach to gynecologic cancer therapy. Biomed Res Int. 2014;2014(6):1–10. | ||
Shen S, O’Brien T, Yap LM, Prince HM, McCormack CJ. The use of methotrexate in dermatology: a review. Australas J Dermatol. 2012;53(1):1–18. | ||
Khan ZA, Tripathi R, Mishra B. Methotrexate: a detailed review on drug delivery and clinical aspects. Expert Opin Drug Deliv. 2012;9(2):151–169. | ||
Chen Y, Sha X, Zhang W, et al. Pluronic mixed micelles overcoming methotrexate multidrug resistance: in vitro and in vivo evaluation. Int J Nanomedicine. 2013;8:1463–1476. | ||
Green JM. Glucarpidase to combat toxic levels of methotrexate in patients. Ther Clin Risk Manag. 2012;8:403–413. | ||
Herman S, Zurgil N, Deutsch M. Low dose methotrexate induces apoptosis with reactive oxygen species involvement in T lymphocytic cell lines to a greater extent than in monocytic lines. Inflamm Res. 2005;54(7):273–280. | ||
Celsi F, Pizzo P, Brini M, et al. Mitochondria, calcium and cell death: a deadly triad in neurodegeneration. Biochim Biophys Acta. 2009;1787(5):335–344. | ||
Shi MD, Shiao CK, Lee YC, Shih YW. Apigenin, a dietary flavonoid, inhibits proliferation of human bladder cancer T-24 cells via blocking cell cycle progression and inducing apoptosis. Cancer Cell Int. 2015;15:33. | ||
Eskes R, Antonsson B, Osen-Sand A, et al. Bax-induced cytochrome C release from mitochondria is independent of the permeability transition pore but highly dependent on Mg2+ ions. J Cell Biol. 1998;143(1):217–224. | ||
Mosmann T. Rapid colorimetric assay for cellular growth and survival: application to proliferation and cytotoxicity assays. J Immunol Methods. 1983;65(1–2):55–63. | ||
Valencia A, Kochevar IE. Ultraviolet A induces apoptosis via reactive oxygen species in a model for Smith-Lemli-Opitz syndrome. Free Radic Biol Med. 2006;40(4):641–650. | ||
Saeed U, Durgadoss L, Valli RK, Joshi DC, Joshi PG, Ravindranath V. Knockdown of cytosolic glutaredoxin 1 leads to loss of mitochondrial membrane potential: implication in neurodegenerative diseases. PLoS One. 2008;3(6):e2459. | ||
Pal MK, Jaiswar SP, Srivastav AK, et al. Synergistic effect of piperine and paclitaxel on cell fate via cyt-c, Bax/Bcl-2-caspase-3 pathway in ovarian adenocarcinomas SKOV-3 cells. Eur J Pharmacol. 2016;791:751–762. | ||
Kitazumi I, Tsukahara M. Regulation of DNA fragmentation: the role of caspases and phosphorylation. FEBS J. 2011;278(3):427–441. | ||
Elmore SA, Dixon D, Hailey JR, et al. Recommendations from the INHAND Apoptosis/Necrosis Working Group. Toxicol Pathol. 2016;44(2):173–188. | ||
Olive PL, Banáth JP. The comet assay: a method to measure DNA damage in individual cells. Nat Protoc Electron. 2006;1:23–29. | ||
Livak KJ, Schmittgen TD. Analysis of relative gene expression data using real-time quantitative PCR and the 2(-Delta Delta C(T)) Method. Methods. 2001;25(4):402–408. | ||
Shah PP, Saurabh K, Pant MC, Mathur N, Parmar D. Evidence for increased cytochrome P450 1A1 expression in blood lymphocytes of lung cancer patients. Mutat Res. 2009;670(1–2):74–78. | ||
Xie L, Zhao T, Cai J, Su Y, Wang Z, Dong W. Methotrexate induces DNA damage and inhibits homologous recombination repair in choriocarcinoma cells. Onco Targets Ther. 2016;9:7115–7122. | ||
Blagosklonny MV. Analysis of FDA approved anticancer drugs reveals the future of cancer therapy. Cell Cycle. 2004;3(8):1033–1040. | ||
Liou GY, Storz P. Reactive oxygen species in cancer. Free Radic Res. 2010;44(5):479–496. | ||
Chaudhari AA, Seol JW, Kim SJ, et al. Reactive oxygen species regulate Bax translocation and mitochondrial transmembrane potential, a possible mechanism for enhanced TRAIL-induced apoptosis by CCCP. Oncol Rep. 2007;18(1):71–76. | ||
Rahman MA, Ramli F, Karimian H, et al. Artonin E Induces Apoptosis via Mitochondrial Dysregulation in SKOV-3 Ovarian Cancer Cells. PLoS One. 2016;11(3):e0151466. | ||
Stulpinas A, Imbrasaitė A, Krestnikova N, Šarlauskas J, Čėnas N, Kalvelytė AV. Study of bioreductive anticancer agent RH-1-induced signals leading the wild-type p53-bearing lung cancer A549 cells to apoptosis. Chem Res Toxicol. 2016;29(1):26–39. | ||
Repnik U, Česen MH, Turk B. The endolysosomal system in cell death and survival. Cold Spring Harb Perspect Biol. 2013;5(1):a008755. | ||
Bagci EZ, Vodovotz Y, Billiar TR, Ermentrout GB, Bahar I. Bistability in apoptosis: roles of bax, bcl-2, and mitochondrial permeability transition pores. Biophys J. 2006;90(5):1546–1559. |
 © 2018 The Author(s). This work is published and licensed by Dove Medical Press Limited. The full terms of this license are available at https://www.dovepress.com/terms.php and incorporate the Creative Commons Attribution - Non Commercial (unported, v3.0) License.
By accessing the work you hereby accept the Terms. Non-commercial uses of the work are permitted without any further permission from Dove Medical Press Limited, provided the work is properly attributed. For permission for commercial use of this work, please see paragraphs 4.2 and 5 of our Terms.
© 2018 The Author(s). This work is published and licensed by Dove Medical Press Limited. The full terms of this license are available at https://www.dovepress.com/terms.php and incorporate the Creative Commons Attribution - Non Commercial (unported, v3.0) License.
By accessing the work you hereby accept the Terms. Non-commercial uses of the work are permitted without any further permission from Dove Medical Press Limited, provided the work is properly attributed. For permission for commercial use of this work, please see paragraphs 4.2 and 5 of our Terms.