")
Back to Journals » International Journal of Nanomedicine » Volume 12
Methotrexate carried in lipid core nanoparticles reduces myocardial infarction size and improves cardiac function in rats
Authors Maranhão RC, Guido MC, de Lima AD, Tavares ER, Marques AF, Tavares de Melo MD, Nicolau JC, Salemi VMC, Kalil-Filho R
Received 3 December 2016
Accepted for publication 17 February 2017
Published 17 May 2017 Volume 2017:12 Pages 3767—3784
DOI https://doi.org/10.2147/IJN.S129324
Checked for plagiarism Yes
Review by Single anonymous peer review
Peer reviewer comments 3
Editor who approved publication: Dr Thomas Webster
Raul C Maranhão,1,2 Maria C Guido,1 Aline D de Lima,1 Elaine R Tavares,1 Alyne F Marques,1 Marcelo D Tavares de Melo,3 Jose C Nicolau,3 Vera MC Salemi,3 Roberto Kalil-Filho3
1Laboratory of Metabolism and Lipids, 2Faculty of Pharmaceutical Sciences, 3Heart Failure Unit, Clinical Cardiology Division, Heart Institute (InCor), Medical School Hospital, University of São Paulo, São Paulo, Brazil
Purpose: Acute myocardial infarction (MI) is accompanied by myocardial inflammation, fibrosis, and ventricular remodeling that, when excessive or not properly regulated, may lead to heart failure. Previously, lipid core nanoparticles (LDE) used as carriers of the anti-inflammatory drug methotrexate (MTX) produced an 80-fold increase in the cell uptake of MTX. LDE-MTX treatment reduced vessel inflammation and atheromatous lesions induced in rabbits by cholesterol feeding. The aim of the study was to investigate the effects of LDE-MTX on rats with MI, compared with commercial MTX treatment.
Materials and methods: Thirty-eight Wistar rats underwent left coronary artery ligation and were treated with LDE-MTX, or with MTX (1 mg/kg intraperitoneally, once/week, starting 24 hours after surgery) or with LDE without drug (MI-controls). A sham-surgery group (n=12) was also included. Echocardiography was performed 24 hours and 6 weeks after surgery. The animals were euthanized and their hearts were analyzed for morphometry, protein expression, and confocal microscopy.
Results: LDE-MTX treatment achieved a 40% improvement in left ventricular (LV) systolic function and reduced cardiac dilation and LV mass, as shown by echocardiography. LDE-MTX reduced the infarction size, myocyte hypertrophy and necrosis, number of inflammatory cells, and myocardial fibrosis, as shown by morphometric analysis. LDE-MTX increased antioxidant enzymes; decreased apoptosis, macrophages, reactive oxygen species production; and tissue hypoxia in non-infarcted myocardium. LDE-MTX increased adenosine bioavailability in the LV by increasing adenosine receptors and modulating adenosine catabolic enzymes. LDE-MTX increased the expression of myocardial vascular endothelium growth factor (VEGF) associated with adenosine release; this correlated not only with an increase in angiogenesis, but also with other parameters improved by LDE-MTX, suggesting that VEGF increase played an important role in the beneficial effects of LDE-MTX. Overall effects of commercial MTX were minor, and did not improve LV function or infarction size. Both treatments did not induce any toxicity.
Conclusion: The remarkable improvement in heart function and reduction in infarction size achieved by LDE-MTX supports future clinical trials.
Keywords: lipid particle, drug delivery, adenosine, VEGF, myocardial infarction
Introduction
Acute myocardial infarction (MI) is the main cause of heart failure and one of the most frequent causes of death worldwide. MI elicits an early inflammatory response with recruitment of mononuclear cells and neutrophils, and production of pro-inflammatory cytokines in the myocardium.1 These factors signal the start of the processes of scar formation and tissue repair that result in the restoration of normal cardiac function.2 However, when excessive and prolonged inflammation is present during the post-MI period, the infarction size may increase and deleterious cardiac remodeling may occur, leading to chronic heart failure.3 Thus, finding medications that can influence the post-MI chain of events toward a virtuous route is a major goal of cardiology therapeutics.
Our laboratory has pioneered the use of lipid core nanoparticles (LDE) as drug carriers with the ability to concentrate chemotherapeutic agents in malignant neoplastic tissues4–6 and atherosclerotic lesions.7 This drug-targeting system, termed LDE, is based on the finding that, in contact with the plasma, nanoparticles that resemble the lipid composition and structure of low-density lipoprotein (LDL) acquire apolipoprotein E (Apo E). Apo E is recognized by the LDL receptors on the cell membrane, and LDE can thereby be internalized via the LDL receptor-mediated endocytic pathway.8,9 The nanoparticles concentrate in inflamed, neoplastic, and other rapidly proliferating tissues; because in this, there is an overexpression of LDL receptors.10,11 Use of LDE as a vehicle for methotrexate (MTX) increased cell uptake of the drug severalfold.12 Treatment of rabbits with atherosclerosis induced by cholesterol intake with MTX associated with LDE resulted in a marked reduction in the atheromatous plaques in the aorta and the local inflammatory process.13 In a rabbit model of rheumatoid arthritis, it has also been shown that inflammation in the joints is reduced by LDE-MTX.14,15
MTX belongs to the anti-folate class of compounds that are inhibitors of dihydrofolate reductase, a key enzyme in folate metabolism. MTX can therefore interfere with the synthesis of thymidylate, purine nucleotides, and some amino acids.16 MTX also inhibits the activity of AICAR (5-aminoimidazole-4-carboxamide ribonucleotide) transformylase and thereby promotes the release of adenosine by a variety of cell types and tissues.17 Adenosine inhibits the activation of leukocytes and platelets and also decreases cytokine production and may have protective actions against ischemic injury.18 All these previous findings led us to hypothesize that LDE-MTX might have a favorable impact on events ensuing MI. The results from rats with MI induced by ligation of the left coronary artery and treated with LDE-MTX were compared with those from rats with MI treated with free MTX or with controls treated with LDE only.
Materials and methods
Animals, groups, and treatment of animals
Male Wistar rats weighing 300–400 g were used in this experiment. Animals were maintained on standard rat chow and water ad libitum in rooms with controlled temperature and light cycle.
Fifty rats were used in the study, 38 with MI and 12 with a sham operation. MI animals were randomly allocated to three groups:
- MI-LDE-MTX (n=13): treated with 1 mg/kg/week MTX associated with LDE.
- MI-MTX (n=12): treated with 1 mg/kg/week of commercial MTX.
- MI-control (n=13): treated with LDE only.
The 12 sham animals received 0.9% saline solution/week at 100 μL volume. All treatments were administered intraperitoneally and began 24 hours after the surgical procedures (sham or MI) and once a week for 6 weeks.
All procedures were performed in accordance with the Guidelines of the Brazilian College of Animal Research and conform to the National Institutes of Health guidelines. The study protocol was approved by the Ethics Committee of the University of São Paulo Medical School Hospital (271/12).
Induction of MI
The MI induction procedure was performed as previously described.19,20 Briefly, with the rats under ketamine (Cristália, Itapira, Brazil) (50 mg/kg) and xylazine (CEVA, Paulínia, Brazil) (10 mg/kg) anesthesia, and positive pressure ventilation (rodent ventilator model 683, Harvard, Holliston, MA, USA), a left thoracotomy was performed. The left coronary artery was occluded, and the thoracic incision was sutured. Sham rats underwent the same surgical procedure but without occlusion of the left coronary artery.
Transthoracic echocardiography
Transthoracic echocardiography was performed 24 hours and 6 weeks after the sham and MI procedures using a Sequoia 512 machine (Siemens, Mountain View, CA, USA) equipped with a 10–13 MHz linear transducer, as previously described.21 Rats were anesthetized, and the following morphometric and functional parameters were obtained from short-axis view at the level of the papillary muscles by M-mode echocardiography.22 A modified Simpson method was used to calculate left ventricular (LV) ejection fraction. LV mass was calculated by using the following formula: LV mass =0.8×{1.04[(LVID + PWTh + IVSTh)3−LVID3]}+0.6.
The sequence of echocardiographic examination was two-dimensional, color Doppler and pulsed-wave Doppler of the following variables were measured from aortic valve closure to the onset of mitral inflow, and LV outflow velocity was measured just below the aortic valve. The average of three consecutive cardiac cycles was used in all echocardiographic parameters.
It is important to highlight that only MI rats with ejection fraction <40%, which was diagnostic for LV dysfunction and large infarcted area size, were selected for inclusion in the experimental groups.
LDE preparation and association with MTX
MTX sodium salt (2 g, 4.1 mmol) was diluted in 120 mL of dimethylsulfoxide; to this was added cesium carbonate (1.43 g, 4.4 mmol) and dodecyl bromide (2.5 g, 10 mmol). The mixture was stirred for 24 hours at room temperature and 100 mL of water was added to quench the reaction. The product was extracted with chloroform (5×50 mL). The organic phase was washed with a saturated sodium chloride solution (3×100 mL), dried with magnesium sulfate, filtered, and concentrated. The product was purified by liquid chromatography using silica gel (230–400 mesh) with methanol/chloroform, from 2.5% to 100% of methanol. Melting point 122°C–124°C. Yield was 98% (Figure 1).12
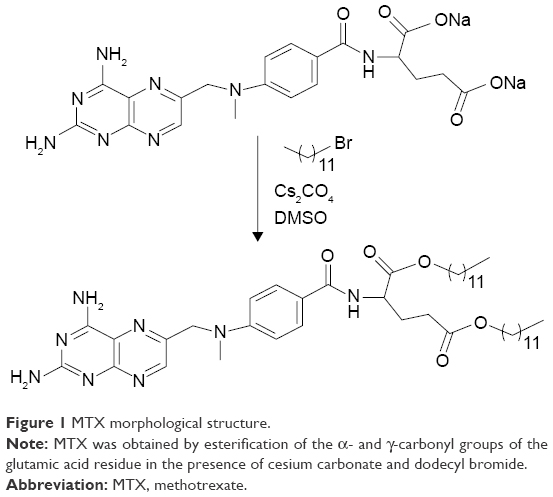 | Figure 1 MTX morphological structure. |
LDE-MTX was prepared from a lipid mixture composed of 100 mg of cholesteryl oleate, 200 mg of egg phosphatidylcholine (Lipoid GMBH, Ludwigshafen, Germany), 10 mg of triglycerides, 12 mg of cholesterol, and 60 mg of MTX.14–16 The aqueous phase consisting of 100 mg of polysorbate 80 Tween 80 (Merck, Hohenbrum, Germany) and 10 mL of Tris-HCl buffer pH 8.05 was kept at room temperature. The pre-emulsion was obtained by adding the hydrophilic phase to the oil phase by ultrasonic radiation until complete dissolution of the drug. Emulsification of all lipids, MTX, and the aqueous phase was obtained by high-pressure homogenization using an Emulsiflex C5 homogenizer (Avestin Inc, Ottawa, Canada). After 30–40 minutes of homogenization at a constant temperature, the nanoemulsion was centrifuged at 1,800× g for 15 minutes to separate the unbound MTX that precipitates upon centrifugation. The nanoemulsion was sterilized by passing through a 0.22 μm pore polycarbonate filter (EMD Millipore Corporation, Billerica, MA, USA) and kept at 4°C until it was used. The incorporation of MTX to LDE was measured before its injection into animals by high-performance liquid chromatography. The average drug load was 4 mg/mL. Prepared as described, the average diameter of the LDE-MTX particle was 60 nm, as measured by the laser light scattering method performed using the ZetaPALS Zeta Potential Analyzer (Brookhaven Instruments Corporation, Holtsville, NY, USA).13,14
Uptake of radioactively labeled LDE by the LV
Fourteen rats were used in this experiment, eight with MI and six with a sham operation. The animals were maintained for 6 weeks. Thereafter, they were injected at 100 μL volume into the tail vein of the rats with LDE labeled with [3H]-cholesteryloleate ether (Perkin Elmer, Boston, MA, USA) and euthanized 24 hours later for tissue analysis.
In MI animals, the LV non-infarcted area was excised for determination of the uptake of radioactive LDE by those tissues. In sham animals, fragments of the LV were excised for the same purpose.
Tissue samples were collected and kept in cold saline solution prior to lipid extraction with chloroform/methanol (2:1 v/v). After extraction, the solvent was evaporated under N2 flow and resuspended with 500 μL of chloroform/methanol (2:1 v/v), and the suspension was placed into vials with 5 mL scintillation solution (Packard BioScience, Groeningen, the Netherlands). Radioactivity was measured with a Packard 1600 TR liquid scintillation spectrometer (Packard BioScience, Palo Alto, CA, USA).23,24
Blood biochemistry and blood cell count
Promptly after the final echocardiography study, the animals were euthanized using an overdose (100 mg/kg) of sodium thiopental (Cristália, Itapira, Brazil). Blood samples were taken from the superior vena cava for determination of total, HDL, and non-HDL cholesterol, triglycerides, alanine aminotransferase, aspartate aminotransferase, and for blood cell count. The analyses were performed using a COBAS c111 (Roche, Basel, Switzerland) and a hematology analyzer Poch 100iV Diff Sysmex-Roche (Roche, Basel, Switzerland).
Morphometry
Hearts were weighed and the relative weight index of the heart was determined. A coronal slice of the heart was obtained at the equatorial plane and cut into 5 μm sections. Tissue sections stained with hematoxylin and eosin (HE) and Masson’s trichrome underwent morphometric studies using an image analysis system (Leica Q500 iW; Leica Imaging Systems, Cambridge, UK). Three areas of the LV were analyzed separately: MI area, subendocardium (SEN) area, and interstitium (INT) area. The SEN area was defined as the inner third of the non-infarcted LV area and the INT area as the remaining outer two-thirds.20,25
The ratios of endocardial infarct surface length to total LV endocardial circumference, and between epicardial infarct surface length to total LV epicardial circumference were averaged to calculate the MI size.
To measure LV hypertrophy, HE-stained sections were examined under 400× magnification. The myocyte diameter was measured across oval and central nuclei of longitudinally displayed myocytes.
Inflammatory cells were counted in HE-stained sections under 400× magnification. The cells were identified according to nuclear and cytoplasmic morphological aspects.
Myocyte necrosis was identified in HE-stained sections under 400× magnification by nuclear pyknosis and karyolysis as well as cytoplasmic changes, including vacuolization, contraction bands, and hypereosinophilia.
To measure LV fibrosis, collagen volume fraction was determined in Masson’s-stained sections under 200× magnification. The fibrosis was calculated as the percentage of blue-stained connective tissue areas per total myocardium.
Western blot analysis
Non-infarcted LV was homogenized in radioimmunoprecipitation assay lysis buffer (Thermo Fisher Scientific, Waltham, MA, USA). The proteins were size-fractionated on polyacrylamide/sodium dodecyl sulphate (SDS) gel; the separated proteins were then electrophoretically transferred to a nitrocellulose membrane. The membranes were blocked with 5% non-fat milk. After the primary antibodies (Table 1) were incubated overnight, the blots were washed and incubated with horseradish peroxidase-conjugated secondary antibodies (Calbiochem, San Diego, CA, USA). Bands were visualized using enhanced chemiluminescence (Amersham; GE, Fairfield, CT, USA), and exposed and analyzed using an image analyzer (Amersham Imager 600; GE, Fairfield, CT, USA). Values were normalized for expression of glyceraldehyde 3-phosphate dehydrogenase, and results were expressed as a percentage of sham group mean.
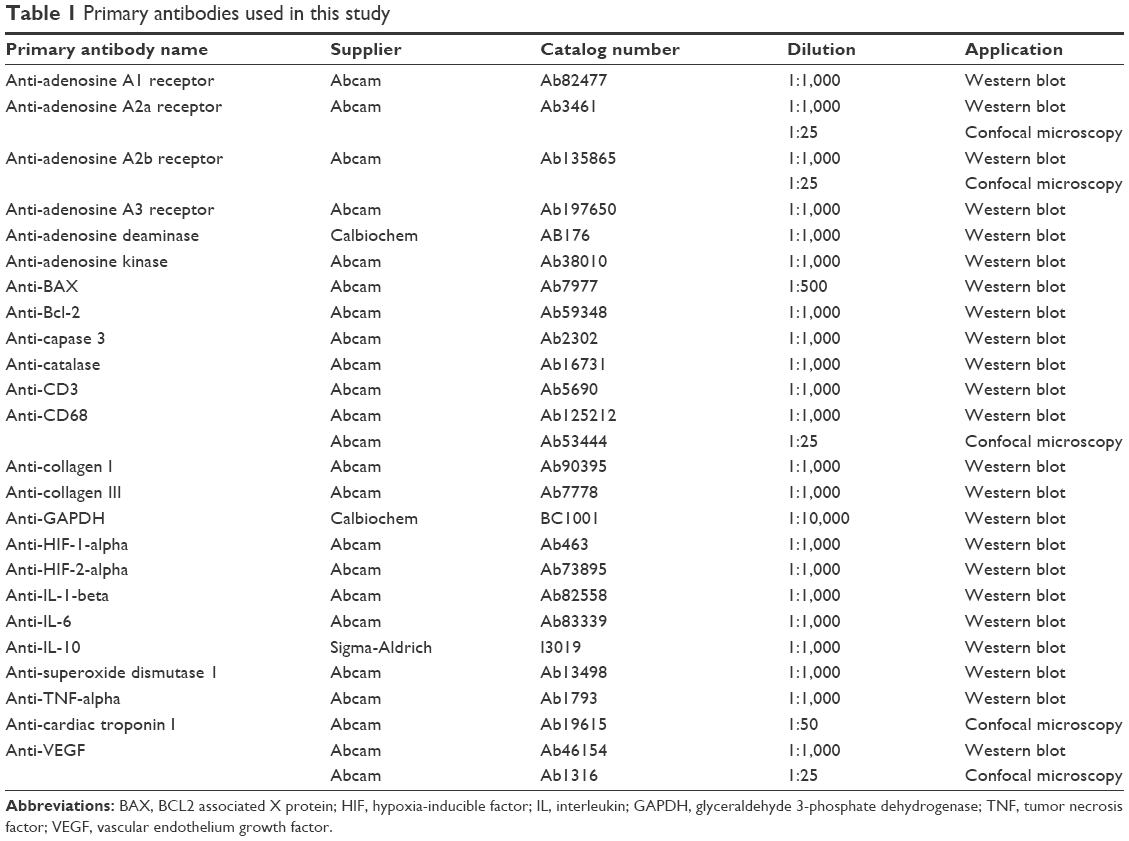 | Table 1 Primary antibodies used in this study |
In situ reactive oxygen species (ROS) generation
In situ ROS microfluorotopography of the LV was performed with dihydroethidium (DHE; Invitrogen, Carlsbad, CA, USA). LV paraffin sections were deparaffinized and incubated in phosphate-buffered saline Tween 1% for 30 minutes at room temperature. Sections were incubated with 5 μM DHE for 30 minutes at 37°C. Images were detected in a Zeiss Axiovert 100 M scanning confocal microscope and AxioVision software (Carl Zeiss, Jena, Germany). Parallel reading of images was performed with identical laser acquisition settings. Quantitative analysis of fluorescent images of MI, SEN, and INT areas was performed with an image analysis system (Leica Q500 iW) under 400× magnification.26
Confocal immunofluorescence
LV paraffin sections were deparaffinized, and antigen retrieval was performed with a Pascal antigen retrieval high-pressure chamber (Dako, Glostrup, Denmark) with Tris/ethylenediaminetetraacetic acid (1 mM/0.1 mM) buffer. Nonspecific reaction was blocked by incubation in 1% bovine albumin (Sigma-Aldrich, Saint Louis, MO, USA). The primary antibody anti-vascular endothelium growth factor (anti-VEGF) was incubated overnight at 4°C with anti-troponin I labeling myocytes, anti-CD68 labeling macrophages, anti-A2a or anti-A2b adenosine receptors (Abcam, Cambridge, UK) (Table 1). Fluorescent secondary antibodies Alexa Fluor 488 and 546 (Invitrogen, Carlsbad, CA, USA) were incubated for 150 minutes at 37°C. Nuclei were stained with Hoechst (Invitrogen). MI, SEN, and INT areas were observed under 400× magnification on a Zeiss Axiovert 100 M scanning confocal microscope and AxioVision software (Carl Zeiss).
Statistical analysis
Data are expressed as means ± standard error of mean (SEM). Data were analyzed using the appropriate one-way analysis of variance (ANOVA) or repeated-measures ANOVA complemented by Bonferroni’s post-test, or Kruskal–Wallis with Dunn’s post-test. Pearson’s linear correlation was used to test potential correlations between VEGF and ejection fraction, MI size, and the following LV parameters: myocyte diameter, inflammatory cells, myocardial fibrosis, hypoxia, adenosine receptors, adenosine deaminase, and adenosine kinase. In all analyses, P<0.05 was considered statistically significant. Statistical analyses were carried out using GraphPad Prism v.5 statistical software (GraphPad Software, Inc, La Jolla, CA, USA). The data collection and analysis of the echocardiographic study were performed by a single examiner (VMS) who was blinded to the animal groups and treatments.
Results
Uptake of LDE by tissues of the LV
Figure 2A shows the uptake of LDE labeled with 3H-cholesteryl oleate ether by the myocardial tissues of the LV of the sham and non-infarcted area of MI group animals. LDE uptake by the non-infarcted area was 38% higher (P=0.04) than that of the myocardium of sham animals.
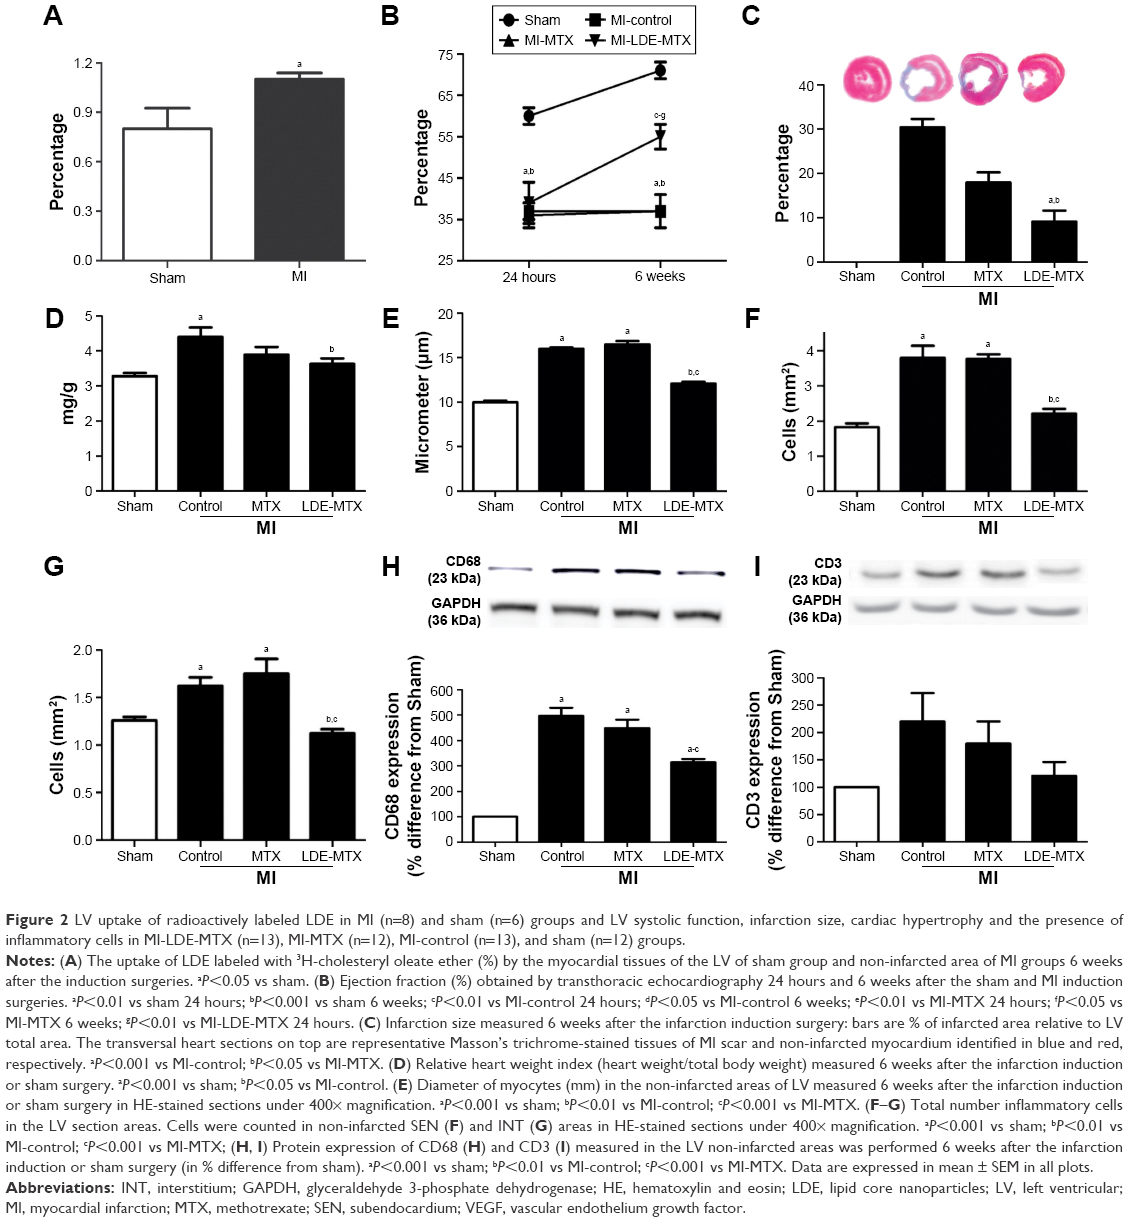 | Figure 2 LV uptake of radioactively labeled LDE in MI (n=8) and sham (n=6) groups and LV systolic function, infarction size, cardiac hypertrophy and the presence of inflammatory cells in MI-LDE-MTX (n=13), MI-MTX (n=12), MI-control (n=13), and sham (n=12) groups. |
LV structure and function
Table 2 shows the values of the echocardiographic study performed at 24 hours and 6 weeks after the induction of MI or sham surgery. Compared with the sham group, the three MI groups had an increase in systolic and diastolic diameters and volumes (P<0.05) measured 24 hours after infarction induction. After the treatments, 6 weeks after the surgical procedures, the systolic and diastolic diameters and volumes (P<0.05) were not changed in the MI-control and MI-MTX groups, but those of the MI-LDE-MTX group were diminished, approaching the values measured in the sham group.
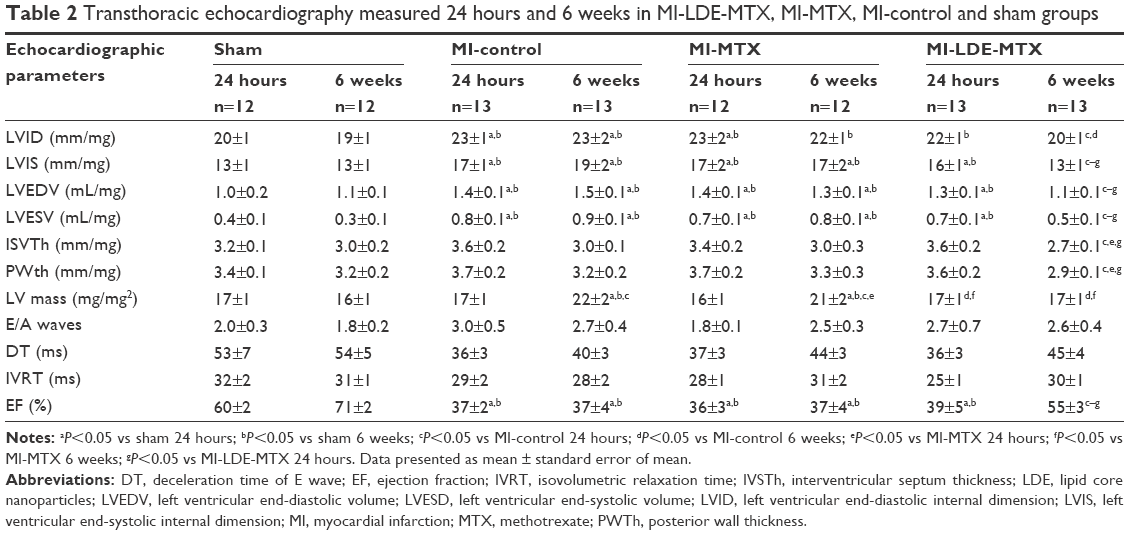 | Table 2 Transthoracic echocardiography measured 24 hours and 6 weeks in MI-LDE-MTX, MI-MTX, MI-control and sham groups |
Although the interventricular septum thickness and the LV posterior wall thickness were not statistically increased in all three infarcted groups at 24 hours; 6 weeks after the surgery, the MI-LDE-MTX group had a significant reduction in those parameters compared with MI-control and MI-MTX groups (P<0.05). Compared with the sham group, LV mass was unchanged when measured 24 hours after surgery. After 6 weeks, the LV mass had increased in the MI-control and MI-MTX groups, but the LDE-MTX treatment had the ability to prevent the increase (P<0.05; Table 2).
Table 2 also shows echocardiographic LV functional parameters. The infarction induction did not affect diastolic function, as indicated by the fact that E/A ratio (P=0.09), deceleration time (P=0.11), and isovolumetric relaxation (P=0.06) time 24 hours and 6 weeks after surgery were not statistically different from the parameters acquired in the sham group.
Table 2 and Figure 2B show LV systolic function evaluated according to the ejection fraction values. Twenty-four hours after the surgery, the ejection fraction in all three infarcted groups was diminished compared with that in the sham group, but the LDE-MTX treatment succeeded in improving the LV systolic function (40% increase in ejection fraction [P<0.05]). MTX treatment had no effect (Figure 2B).
MI size and cardiac hypertrophy
Table 3 and Figure 2C show the ratio of the infarcted areas relative to the total myocardial areas calculated from the microscopy images of slices of hearts stained with Masson’s trichrome obtained 6 weeks after the infarction induction surgery. The MI size was smaller in the MI-LDE-MTX group than in either the MI-control (P<0.001) or the MI-MTX (P<0.05) animals. Regarding cardiac hypertrophy that usually follows MI induction, the relative heart weight (Table 3; Figure 2D) and the myocyte diameter (Table 3; Figure 2E) were reduced in the LDE-MTX treatment group compared with the MI-control (P<0.05 and P<0.01, respectively) and MI-MTX (P<0.01 and P<0.01, respectively) groups.
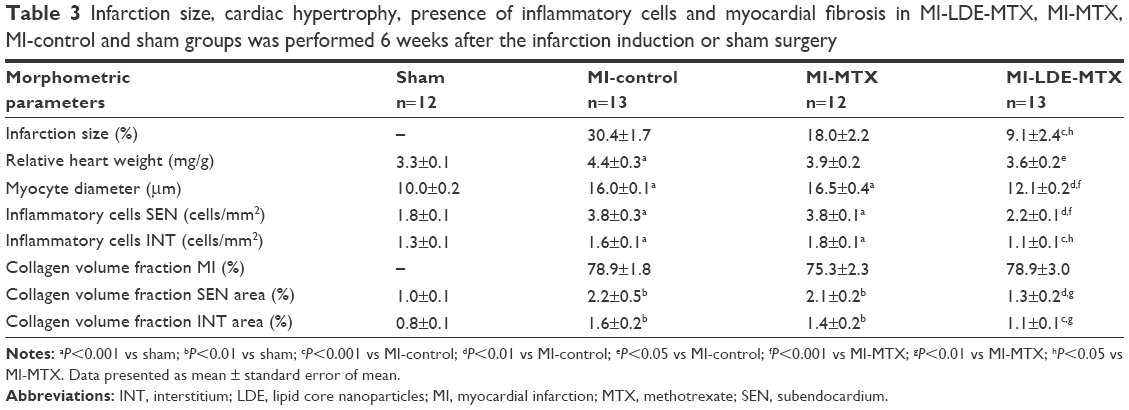 | Table 3 Infarction size, cardiac hypertrophy, presence of inflammatory cells and myocardial fibrosis in MI-LDE-MTX, MI-MTX, MI-control and sham groups was performed 6 weeks after the infarction induction or sham surgery |
Inflammatory cells in the non-infarcted myocardium
Table 3 and Figure 2F and G show the number of inflammatory cells quantified from micrographs of non-infarcted LV myocardium at both SEN (Table 3; Figure 2F) and INT (Table 3; Figure 2G) areas. Upon comparison with the MI-control group, it was clear that LDE-MTX had the ability to diminish the inflammation process in both SEN and INT (P<0.01) areas, whereas the MTX treatment had no effect. In the MI-LDE-MTX group, the number of inflammatory cells approached that of the sham group.
Table 3 and Figure 2H and I also reveal the presence in the non-infarcted myocardium of macrophages and lymphocytes represented, respectively, by the protein expression of CD68 and CD3. Compared with MI-controls, LDE-MTX decreased macrophage-associated CD68 expression (P<0.01), an effect that was not achieved by MTX treatment (Table 3; Figure 2H). In Table 3 and Figure 2I, CD3 expression in the three infarcted groups was not significantly different (P=0.64).
Figure 3 also shows that protein expression in the non-infarcted myocardium of pro-inflammatory factors tumor necrosis factor (TNF)-α (Figure 3A), interleukin (IL)-1β (Figure 3B), and IL-6 (Figure 3C) were not different among the infarcted groups. In contrast, the MI-MTX group had a lower expression of anti-inflammatory cytokine IL-10 (Figure 3D) compared with MI-control, MI-LDE-MTX, and sham groups (P<0.01).
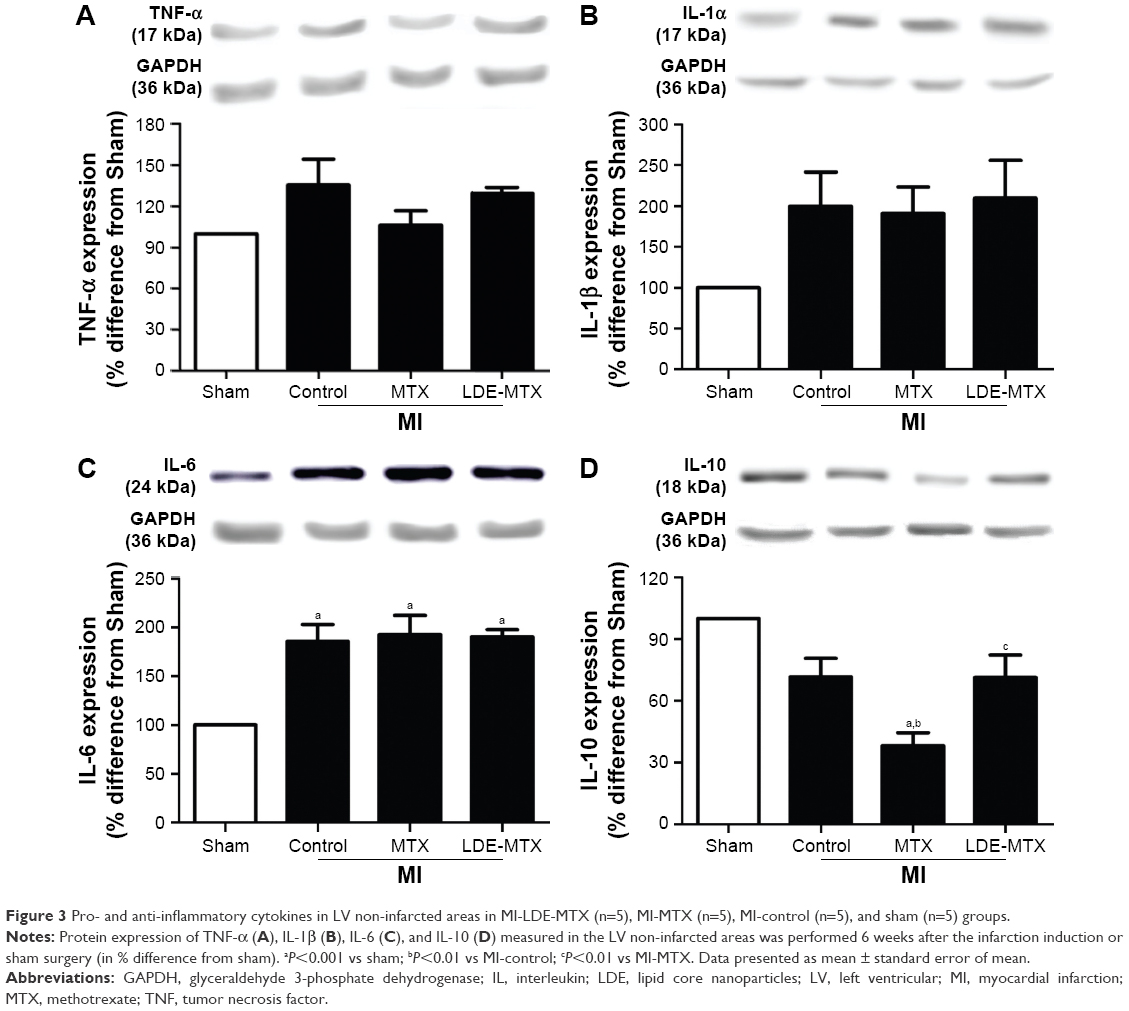 | Figure 3 Pro- and anti-inflammatory cytokines in LV non-infarcted areas in MI-LDE-MTX (n=5), MI-MTX (n=5), MI-control (n=5), and sham (n=5) groups. |
Cell death in the non-infarcted myocardium
Figure 4A shows cell death by necrosis as observed in typical microscopic images in SEN and INT areas of non-infarcted LV myocardium. In MI-LDE-MTX animals, the presence of necrotic myocytes in SEN and INT areas was apparently diminished compared with that in the MI-controls. In the MI-MTX group, necrotic myocytes were also apparently diminished compared with necrotic myocytes in the MI-control group.
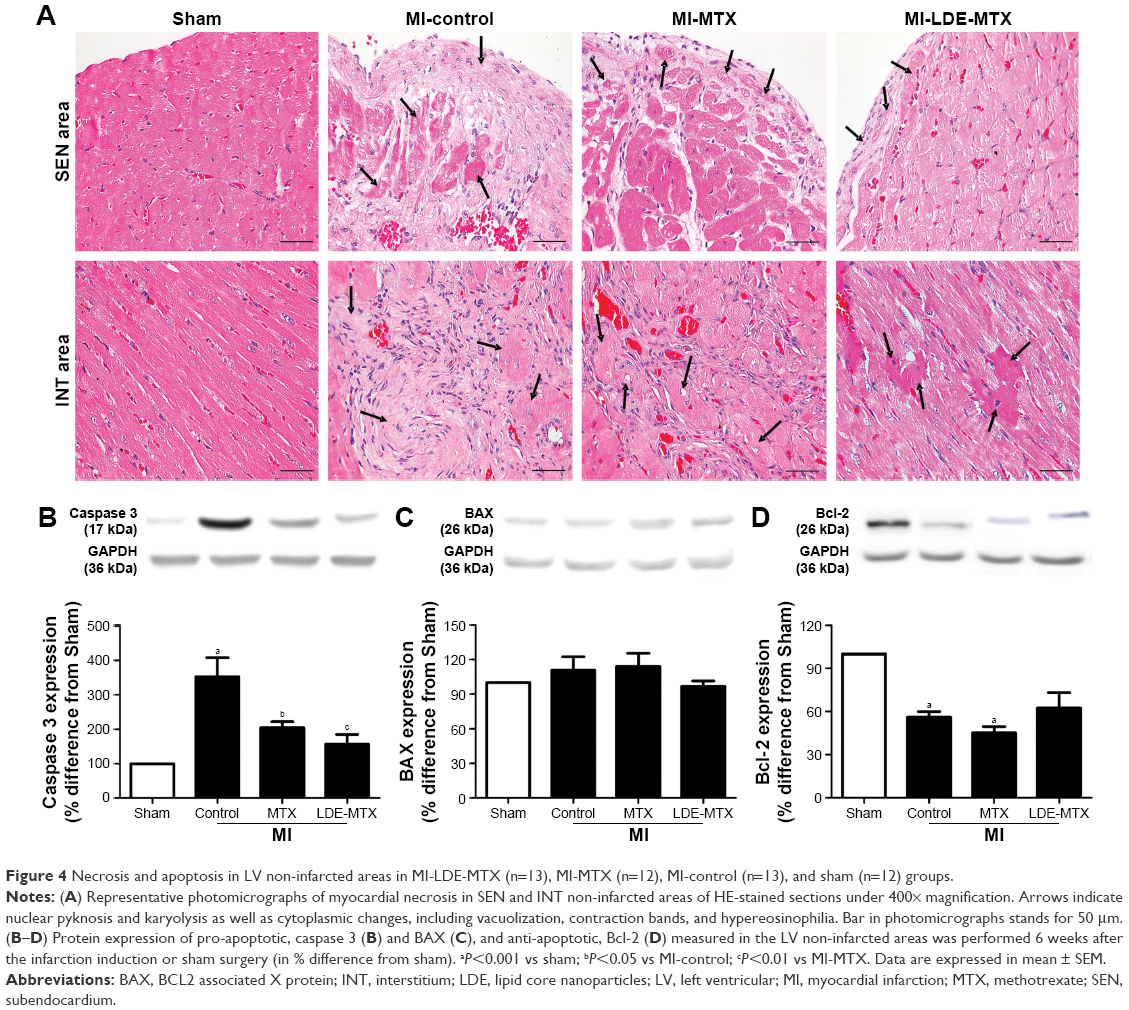 | Figure 4 Necrosis and apoptosis in LV non-infarcted areas in MI-LDE-MTX (n=13), MI-MTX (n=12), MI-control (n=13), and sham (n=12) groups. |
Figure 4B and D shows the protein expression of pro-apoptotic (caspase 3 and BAX) and anti-apoptotic (Bcl-2) factors by western blot analysis. Compared with the MI-control group, the expression of caspase 3 was decreased (Figure 4B), in both MI-LDE-MTX (P<0.01) and MI-MTX groups (P<0.05), but BAX expression was not different among the four groups (P=0.57; Figure 4C). In the MI-control and MI-MTX groups, the expression of the anti-apoptotic factor Bcl-2 was decreased, compared with that in the sham group (P<0.01). LDE-MTX, but not MTX, treatment had the ability to maintain Bcl-2 expression (Figure 4D).
Oxidative stress in the infarcted and non-infarcted myocardium
As shown in Figure 5A, the amount of superoxide in the infarcted area of LV was similar in the three MI groups (P=0.79). However, LDE-MTX reduced the superoxide content to normal levels, in either SEN or INT areas (P<0.05), as indicated by comparison with that in the sham group (Figure 5B and C). Treatment with MTX did not reduce superoxide at the SEN area and had little effect at the INT area (Figure 5B and C). When sections were incubated with polyethylene glycol-superoxide dismutase (PEG-SOD), there was no reactivity, confirming that the signal obtained with DHE incubation was specifically from labeled superoxide. Figure 5D shows the data from typical images of the superoxide acquired by in situ microfluorotopography from confocal microscopy.
 | Figure 5 Oxidative stress and antioxidant enzymes in LV non-infarcted areas in MI-LDE-MTX (n=5), MI-MTX (n=5), MI-control (n=5) and sham (n=5) groups. |
Protein expression in the non-infarcted myocardium of the antioxidant enzymes SOD1 and catalase is shown in Figure 5E and F. Treatment with both LDE-MTX and MTX increased SOD1 expression compared with the sham group (P<0.05), but only the MI-LDE-MTX group had an expression higher than the MI-control group (P<0.05; Figure 5E). In respect to catalase, only LDE-MTX treatment increased the expression of this enzyme (P<0.05); MTX had no effect (Figure 5F).
LV fibrosis in infarcted and non-infarcted myocardium
Figure 6 shows the microscopic images of typical findings and the parameters of image analysis and protein expression related to the fibrosis process.
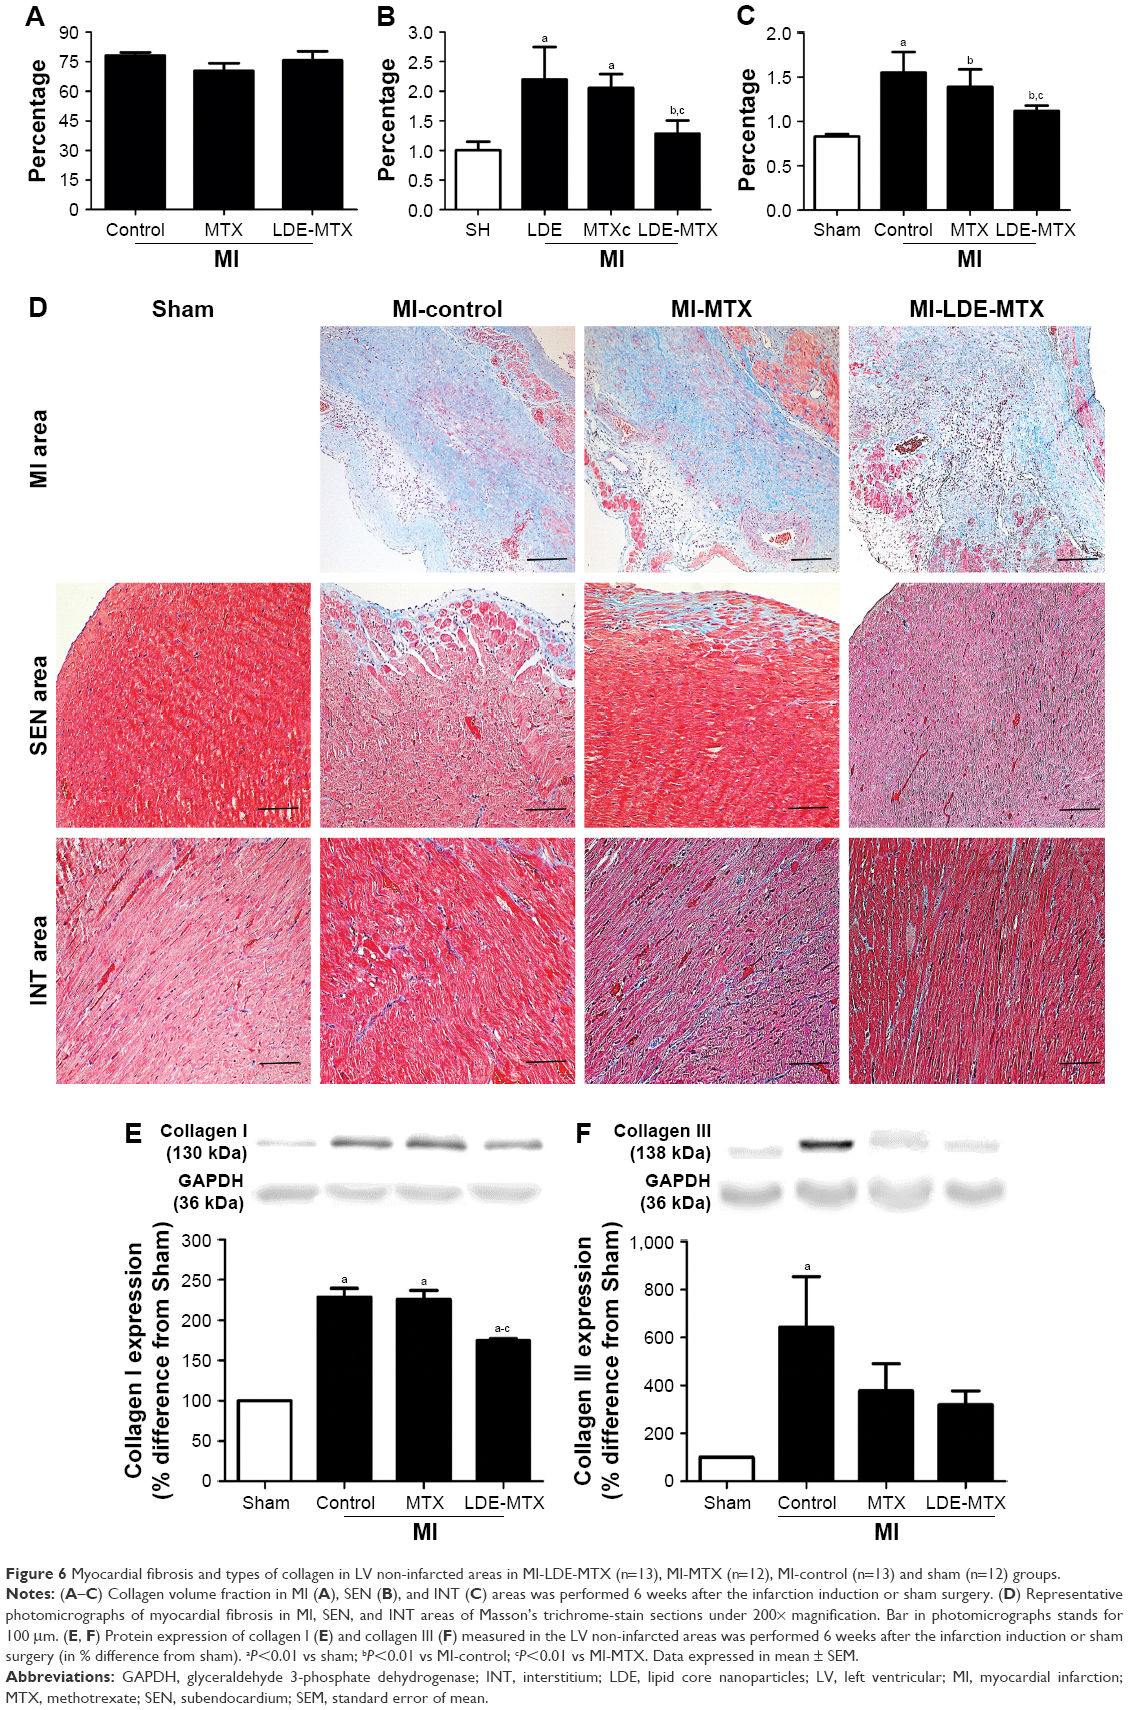 | Figure 6 Myocardial fibrosis and types of collagen in LV non-infarcted areas in MI-LDE-MTX (n=13), MI-MTX (n=12), MI-control (n=13) and sham (n=12) groups. |
The collagen volume fraction was not different in infarcted areas in all MI groups (P=0.29; Table 3; Figure 6A). Treatment with LDE-MTX, however, reduced fibrosis in the SEN and INT areas (P<0.01). This was not attained by the MTX treatment, as collagen volume was equal in MI-MTX and MI-controls (Table 3; Figure 6B and C). Figure 6D shows typical LV images of fibrotic tissues.
In the non-infarcted myocardium, the expression of type I collagen was increased in all three infarcted groups compared with that in the sham group (P<0.01; Figure 6E). However, LDE-MTX, but not MTX treatment, reduced the expression of type I collagen, as inferred by comparison with the MI-controls (P<0.01). Type III collagen was increased in MI-control (P<0.01) and both LDE-MTX and MTX treatments had the ability to reduce the expression of this protein (Figure 6F).
Hypoxia, angiogenesis, and adenosine in the non-infarcted myocardium
Figure 7 shows the protein expression of hipoxia inducible factor (HIF)-1α, HIF-2α, and VEGF; adenosine receptors A1, A2a, A2b, and A3; and deaminase and kinase adenosine as analyzed in the non-infarcted myocardium.
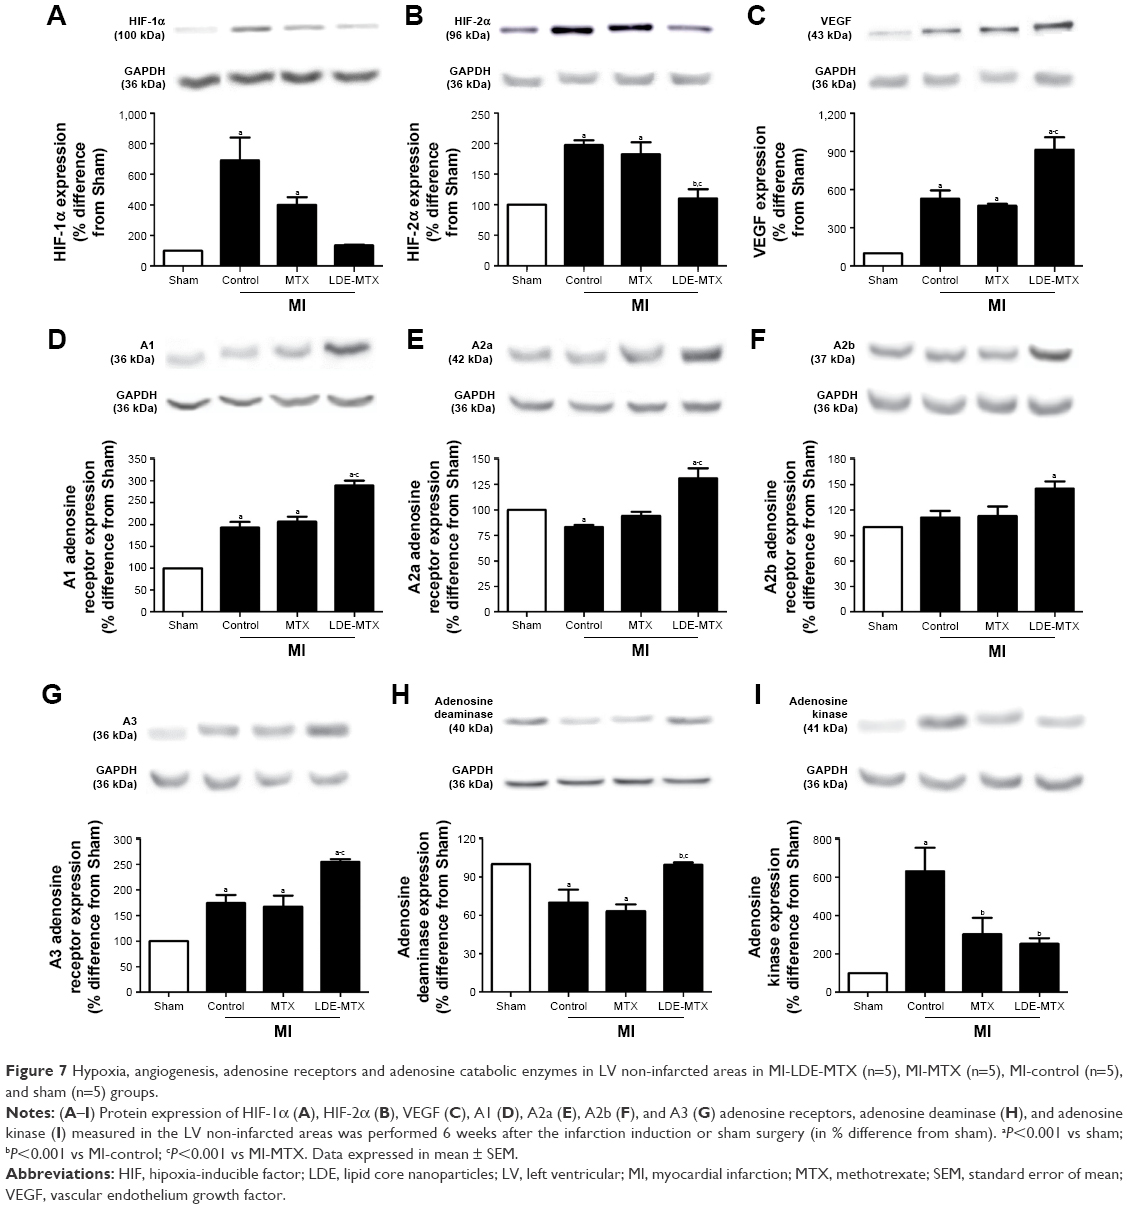 | Figure 7 Hypoxia, angiogenesis, adenosine receptors and adenosine catabolic enzymes in LV non-infarcted areas in MI-LDE-MTX (n=5), MI-MTX (n=5), MI-control (n=5), and sham (n=5) groups. |
LDE-MTX had the ability to reduce either HIF-1α or HIF-2α expression compared with MI-control and MI-MTX groups (P<0.001; Figure 7A and B). VEGF expression was increased in all MI groups, but was further increased by the LDE-MTX treatment (P<0.001; Figure 7C).
Treatment with LDE-MTX increased the expression of all four adenosine receptors and modulated adenosine deaminase and kinase enzymes, indirectly indicating the increase in the bioavailability of adenosine in the non-infarcted myocardium. A1 and A3 adenosine receptor expression in the MI-LDE-MTX group was higher than the sham, MI-control, and MI-MTX groups (P<0.001). A2a adenosine receptor expression was higher than that in the MI-control and MI-MTX groups (P<0.001). A2b adenosine receptor in the MI-LDE-MTX group was higher than that in the sham group (P<0.001). In contrast, MTX did not change the expression of the adenosine receptors compared with the MI-controls (Figure 7D–G). LDE-MTX had the ability to increase the expression of adenosine deaminase to normal values (P<0.001), which was diminished by the infarction induction, an effect that was not observed with MTX treatment (Figure 7H). In respect to adenosine kinase, its expression was increased adenosine by the infarction induction, but was diminished by both LDE-MTX and MTX treatments (P<0.001; Figure 7I).
Correlation and colocalization between VEGF and LV structural and functional parameters
To determine the possible mechanisms involved in the improvement of ejection fraction and decreased infarct size in the MI-LDE-MTX group, Pearson correlation was carried out vs CD68 expression, myocardial fibrosis, inflammatory cells, in situ ROS generation, and VEGF. Only VEGF correlated positively with ejection fraction and negatively with infarct size. Furthermore, VEGF expression also correlated negatively with myocyte diameter, CD68 expression, HIF-1α and HIF-2α, and positively correlated with the expression of the A2a and A2b adenosine receptors (Table 4).
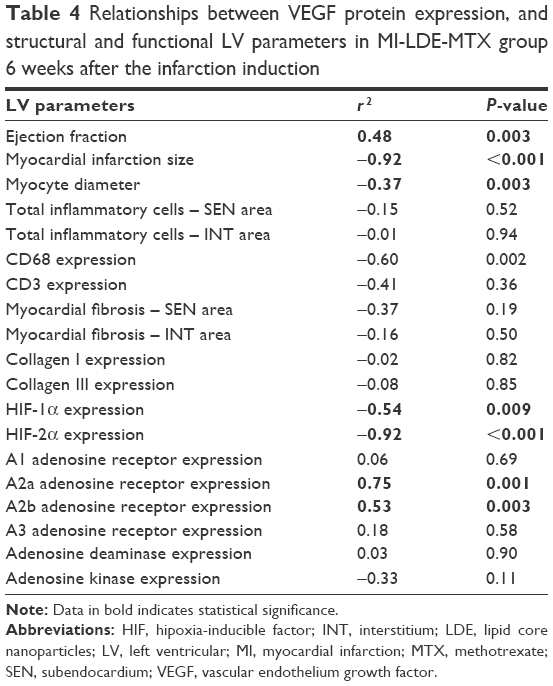 | Table 4 Relationships between VEGF protein expression, and structural and functional LV parameters in MI-LDE-MTX group 6 weeks after the infarction induction |
Confocal microscopy was performed to confirm the correlations and demonstrate colocalization between VEGF, A2a and A2b adenosine receptors, macrophages, and myocytes. Colocalization between VEGF and A2a adenosine receptor was observed both in SEN and INT areas in the MI-LDE-MTX group (Figure 8A). In contrast, A2b adenosine receptor (Figure 8B), macrophages (Figure 8C), and myocytes (Figure 8D) had colocalization with VEGF, predominantly in the SEN area of the MI-LDE-MTX group.
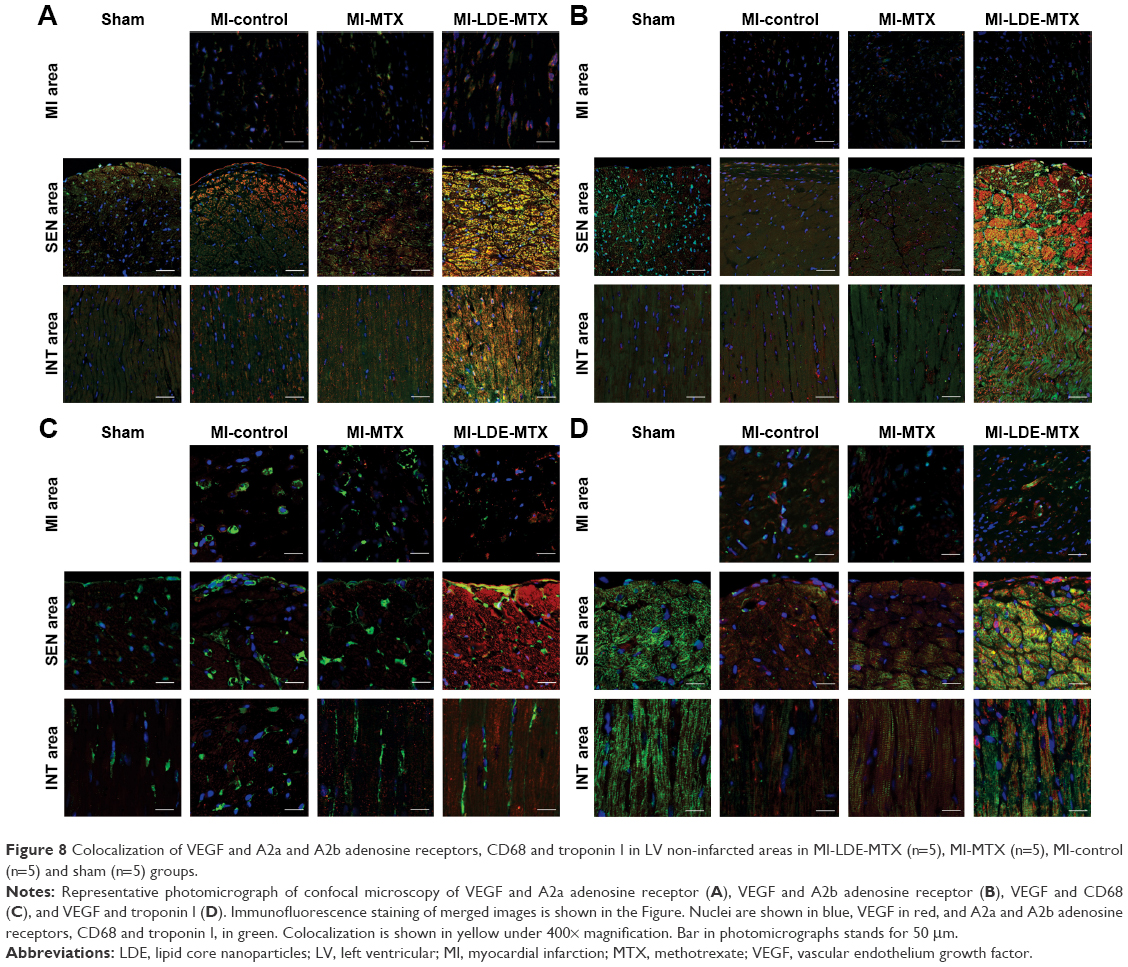 | Figure 8 Colocalization of VEGF and A2a and A2b adenosine receptors, CD68 and troponin I in LV non-infarcted areas in MI-LDE-MTX (n=5), MI-MTX (n=5), MI-control (n=5) and sham (n=5) groups. |
Toxicity evaluation of LDE-MTX and MTX treatments
Over the 6 weeks of observation of the animal groups, fur or skin changes, diarrhea, cachexia, respiratory distress, bleeding, or other clinical signs were not observed. There was no difference between initial and final body weight in all four animal groups. On the day the animals were euthanized, there were no differences among the four groups with regard to erythrocyte (P=0.17), leukocyte (P=0.31) and platelet counts (P=0.45), alanine aminotransferase (P=0.54), aspartate aminotransferase (P=0.79), total and HDL cholesterol (P=0.07, P=0.65, respectively), and triglycerides (P=0.51). Therefore, neither LDE-MTX nor MTX treatments caused clinical or laboratory toxicity in the animals (Table 5).
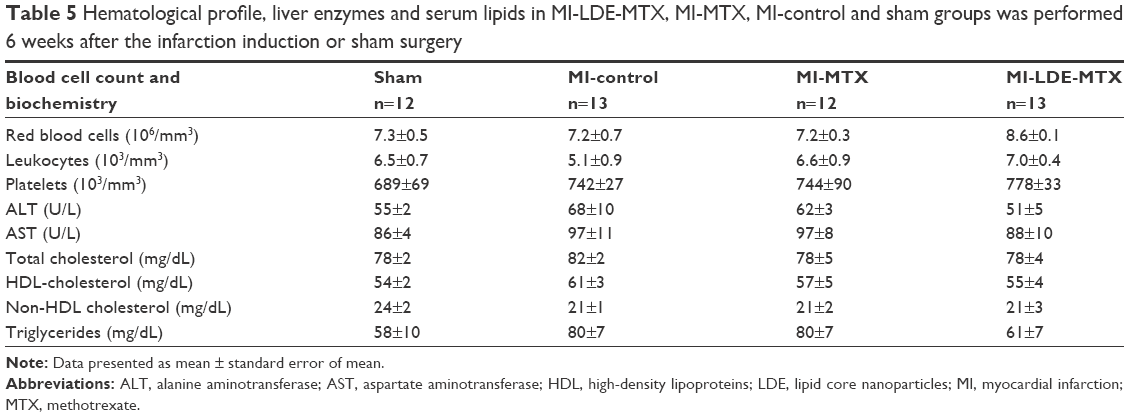 | Table 5 Hematological profile, liver enzymes and serum lipids in MI-LDE-MTX, MI-MTX, MI-control and sham groups was performed 6 weeks after the infarction induction or sham surgery |
Discussion
In this study, as documented by echocardiography and morphometry, LDE-MTX treatment decreased the infarction size and promoted marked improvement of LV systolic function, whereas treatment with commercial MTX had little effect. LDE-MTX largely prevented post-MI cardiac dilation, wall thickening, and the increase in LV mass.
In both the infarcted and non-infarcted LV areas, several factors involved in the post-MI pathophysiology were examined to determine the effects of the treatments. These factors included hypoxia and cell death, oxidative stress and antioxidant defenses, the inflammatory process, angiogenesis, and myocardial fibrosis.
Continuing hypoxia in the non-infarcted area is a major determinant of the rates of cell death and the consequent expansion of the infarcted area,27 but treatment with LDE-MTX was remarkable for amelioration of the local tissue hypoxia, decreasing necrosis and apoptosis, mainly in the subendocardial area. SEN is more vulnerable than INT to the effects of hypoxia due to differences in blood flow between the two areas.28,29 The effects on hypoxia observed under LDE-MTX were probably linked to the ability of the preparation to stimulate VEGF, as documented by western blot and confocal microscopy. VEGF increase conceivably promoted angiogenesis that, in turn, ameliorated the hypoxia condition of the non-infarcted areas of the LV. The improvement in perfusion may have contributed to attenuate the post-MI chain of events that progressively damaged the LV in the MI control group.
MI increased the generation in situ of ROS, measured by DHE, not only in the infarcted area, but also in the non-infarcted area, both subendocardial and interstitial, as observed 6 weeks after MI induction. The reduction in ROS generation by LDE-MTX had probably contributed to the reduction of ischemia in the non-infarcted area achieved by this treatment. Increase in the expression of antioxidant enzymes, SOD1 and catalase may have also been elicited by vasodilation consequent to adenosine release by MTX.30 Diminished ROS generation could also be ascribed to the attenuation of the inflammatory process with the decrease in ROS release by cytokines.31
The inflammatory process ensuing MI is crucial for the adaptive anatomical and functional changes that ultimately lead to successful recovery from MI. However, when unbalanced and excessive inflammation occurs, it becomes a chief cause of post-MI heart failure.32
The role of macrophages and T cells in MI pathophysiology has been extensively explored.33,34 The fact that LDE-MTX treatment decreased macrophages and T-cells in the non-infarcted myocardium can be attributed to the effect of LDE-MTX to abbreviate the duration of the inflammatory process. 6 weeks post-MI, the inflammation had resolved in the LDE-MTX group but, in contrast, animals from the MI control and the MTX-treated groups were still experiencing an ongoing acute inflammatory process.
The fact that TNF-α was not increased in MI after 6 weeks was expected, because this factor is preferentially involved in the earlier phases of the inflammation occurring in MI.35 The fact that the high post-MI levels of pro-inflammatory IL-1β and IL-6 and the low level of anti-inflammatory IL-10 in the MI groups did not change after LDE-MTX treatment was unexpected in view of the observed reduction in local inflammatory cells. Nonetheless, the post-MI activation of other mechanisms, such as the renin-angiotensin-aldosterone system or metalloproteinase may have been at play in the cytokine response and were not affected by LDE-MTX.36,37
Fibrosis has a major role in repairing the damaged myocardium, but excess and deregulated fibrosis may contribute to pathological cardiac remodeling.38 In this respect, LDE-MTX treatment led to a reduction in fibrosis in both subendocardial and interstitial areas, as documented by the local reduction of collagen I and III. Because fibrosis is stimulated by hypoxia and cell death,39 the reduction of both by LDE-MTX accounted for the decrease in subendocardial fibrosis. Increase in VEGF expression by LDE-MTX was presumably involved in this effect. On the other hand, post-MI fibrosis of the interstitial area has been mainly attributed to the action of inflammatory cells and mediators such as cytokines, ILs, and the neurohumoral system40 that incidentally were attenuated by the LDE-MTX treatment.
MTX pharmacological actions are related to the release of adenosine by this drug.41,42 In MI, the release of adenosine to tissues is involved in the reduction of hypoxia, infarct size, cell death, ROS, inflammation, cardiac hypertrophy, myocardial fibrosis, and increases in angiogenesis.17
LDE-MTX treatment increased the expression of the four G-protein-coupled A1, A2a, A2b, and A3 adenosine receptor subtypes, which increased adenosine uptake by the cells. On the other hand, adenosine kinase and adenosine deaminase are adenosine catabolic enzymes that catalyze rapid phosphorylation of adenosine to 5′-mono-phosphate (AMP) and inosine, respectively. LDE-MTX increased the expression of adenosine deaminase and decreased adenosine kinase expression in the non-infarcted area, which conceivably led to an increase in adenosine bioavailability.
Adenosine induces the release of VEGF from myocytes and macrophages via A2a and A2b adenosine receptors43,44 and VEGF increases angiogenesis, which results in a reduction of ischemia, hypoxia, and cell death. Thus, crucial findings in this study were the correlations, either positive or negative, between VEGF expression values and several parameters of post-MI LV status, such as infarct size, LV ejection fraction, myocyte hypertrophy, macrophage presence, and A2a and A2b adenosine receptors. By confocal microscopy, it was also evident that VEGF was colocalized by myocyte marker troponin I, macrophages, and A2a and A2b adenosine receptors. Those correlations may support the increase in VEGF expression by LDE-MTX as pivotal for the achievement of the several benefits to the heart of this treatment.
The uptake of free MTX is mediated by folate receptors, which is a slow internalization mechanism. The substitution of the LDL receptor endocytic pathway by the folate receptor, as a consequence of the association of MTX to LDE, results in a several-fold increase in cell uptake, as shown in a previous study by our group.12–15 On the other hand, as shown here, the uptake of LDE by the non-infarcted area of the heart was increased compared with the hearts of the sham group, and this further increases the bioavailability of MTX. This fact conceivably accounts for the remarkable increase in the actions of MTX when associated with LDE observed in the current study. Although MTX has improved parameters of apoptosis, antioxidant enzymes and oxidative stress, interstitial fibrosis and adenosine kinase, these effects were considerably less than those attained by LDE-MTX and were not sufficient to decrease the MI size and LV function.
Treatment with both LDE-MTX and MTX had no observable clinical or laboratory toxicity. In our previous studies, association with LDE was shown to markedly decrease the toxicity of drugs, such as carmustine, paclitaxel, etoposide, and MTX.4–15
For a long time, MTX has been used at high doses in cancer chemotherapy as an antiproliferative agent, and at low doses in the treatment of rheumatoid arthritis and other autoimmune diseases. As an antiproliferative agent, MTX inhibits pyrimidine and purine synthesis, and as an immune modulator, MTX stimulates the release of adenosine, thereby having adenosine-dependent anti-inflammatory mechanisms.42,45 Previously, it was reported that MTX had an anti-inflammatory action via ecto-5′-nucleotidase, which increases the adenosine intracellular content and had a potent cardioprotective effect against ischemia–reperfusion injury.46 By increasing MTX uptake by cells and non-infarcted tissues of the heart that undergo coronary artery ligation, LDE enhanced the effects of MTX, presumably by increasing the bioavailability or release of adenosine. Thereby, the decreased hypoxia, cell death, oxidative stress, inflammatory cells, fibrosis, and cardiac hypertrophy, and increased antioxidant enzymes and angiogenesis were attained. The conjunction of all these mechanisms led to a decrease in MI size and improvement in LV function by LDE-MTX.
As a limitation of the study, in view of the short half-life of adenosine of ~10 seconds, whereas the required separation of the non-infarcted and infarcted myocardial areas takes several minutes, it was not feasible to reliably measure the tissue concentration of adenosine in this study. Instead, the adenosine bioavailability was estimated here by the quantification of the adenosine receptors and the enzymes involved in the catabolism of this compound, which has been widely validated and described in previous studies.17,47–50
In conclusion, the remarkable improvement in post-infarction condition was probably related to the ability of LDE-MTX to efficiently improve the bioavailability or release of adenosine and thereby increase angiogenesis. These findings indicate that LDE-MTX may be a candidate for future clinical trials.
Acknowledgments
The authors thank Debora F Deus, Deborah L Bispo, and Wanderley SM Gomes for help with the experiments and Dr Ana L Garippo for assistance with confocal microscopy imaging. The authors declare no competing financial interests.
This work was supported by a grant from the State of São Paulo Research Support Foundation (FAPESP, São Paulo, Brazil). Drs Maranhao and Salemi have Research Career Awards from the National Council for Scientific and Technological Development (CNPq, Brasília, Brazil).
Disclosure
The authors report no conflicts of interest in this work.
References
Pasqui AL, Di Renzo M, Maffei S, et al. Pro/Anti-inflammatory cytokine imbalance in postischemic left ventricular remodeling. Mediators Inflamm. 2010;2010:974694. | ||
Francis Stuart SD, De Jesus NM, Lindsey ML, Ripplinger CM. The crossroads of inflammation, fibrosis, and arrhythmia following myocardial infarction. J Mol Cell Cardiol. 2016;91:114–122. | ||
Gao XM, Ming Z, Su Y, et al. Infarct size and post-infarct inflammation determine the risk of cardiacrupture in mice. Int J Cardiol. 2010: 143(1):20–28. | ||
Teixeira RS, Curi R, Maranhão RC. Effects on Walker 256 tumour of carmustine associated with a cholesterol-rich microemulsion (LDE). J Pharm Pharmacol. 2004;56(7):909–914. | ||
Pinheiro KV, Hungria VT, Ficker ES, Valduga CJ, Mesquita CH, Maranhão RC. Plasma kinetics of a cholesterol-rich microemulsion (LDE) in patients with Hodgkin’s and non-Hodgkin’s lymphoma and a preliminary study on the toxicity of etoposide associated with LDE. Cancer Chemother Pharmacol. 2006;57(5):624–630. | ||
Kretzer IF, Maria DA, Guido MC, Contente TC, Maranhão RC. Simvastatin increases the antineoplastic actions of paclitaxel carried in lipid nanoemulsions in melanoma-bearing mice. Int J Nanomedicine. 2016;11:885–904. | ||
Maranhão RC, Tavares ER, Padoveze AF, Valduga CJ, Rodrigues DG, Pereira MD. Paclitaxel associated with cholesterol-rich nanoemulsions promotes atherosclerosis regression in the rabbit. Atherosclerosis. 2008;197(2):959–966. | ||
Maranhão RC, Garicochea B, Silva EL, Llacer PD, Pileggi FJ, Chamone DA. Increased plasma removal of microemulsions resembling the lipid phase of low-density lipoproteins (LDL) in patients with acute myeloid leukemia: a possible new strategy for the treatment of the disease. Braz J Med Biol Res. 1992;25(10):1003–1007. | ||
Hungria VT, Latrilha MC, Rodrigues DG, Bydlowski SP, Chiattone CS, Maranhão RC. Metabolism of a cholesterol-rich microemulsion (LDE) in patients with multiple myeloma and a preliminary clinical study of LDE as a drug vehicle for the treatment of the disease. Cancer Chemother Pharmacol. 2004;53(1):51–60. | ||
Valduga CJ, Fernandes DC, Lo Prete AC, Azevedo CH, Rodrigues DG, Maranhão RC. Use of a cholesterol-rich microemulsion that binds to low-density lipoprotein receptors as vehicle for etoposide. J Pharm Pharmacol. 2003;55(12):1615–1622. | ||
Teixeira RS, Valduga CJ, Benvenutti LA, Schreier S, Maranhão RC. Delivery of daunorubicin to cancer cells with decreased toxicity by association with a lipidic nanoemulsion that binds to LDL receptors. J Pharm Pharmacol. 2003;55(12):1615–1622. | ||
Moura JA, Valduga CJ, Tavares ER, Kretzer IF, Maria DA, Maranhão RC. Novel formulation of a methotrexate derivative with a lipid nanoemulsion. Int J Nanomedicine. 2011;6:2285–2295. | ||
Bulgarelli A, Leite AC Jr, Dias AA, Maranhão RC. Anti-atherogenic effects of methotrexate carried by a lipid nanoemulsion that binds to LDL receptors in cholesterol-fed rabbits. Cardiovasc Drugs Ther. 2013;27(6):531–539. | ||
Mello SB, Tavares ER, Bulgarelli A, Bonfá E, Maranhão RC. Intra-articular methotrexate associated to lipid nanoemulsions: anti-inflammatory effect upon antigen-induced arthritis. Int J Nanomedicine. 2013;8:443–449. | ||
Mello SB, Tavares ER, Guido MC, Bonfá E, Maranhão RC. Anti-inflammatory effects of intravenous methotrexate associated with lipid nanoemulsions on antigen-induced arthritis. Clinics. 2016;71(1): 54–58. | ||
Chan ES, Cronstein BN. Methotrexate–how does it really work? Nat Rev Rheumatol. 2010;6(3):175–178. | ||
Headrick JP, Ashton KJ, Rose’meyer RB, Peart JN. Cardio vascular adenosine receptors: expression, actions and interactions. Pharmacol Ther. 2013;140(1):92–111. | ||
Haskó G, Cronstein B. Regulation of inflammation by adenosine. Front Immunol. 2013;4:85. | ||
Selye H. Bajusz E, Grasso S, Mendell P. Simple techniques for the surgical occlusion of coronary vessels in the rat. Angiology. 1960;11:398–407. | ||
Koike MK, Frimm C de C, Cúri M. Low coronary driving pressure early in the course of myocardial infarction is associated with subendocardial remodelling and left ventricular dysfunction. Int J Exp Pathol. 2007;88(4):279–290. | ||
Sirvente RA, Irigoyen MC, Souza LE, et al. Cardiac impairment evaluated by transesophageal echocardiography and invasive measurements in rats undergoing sinoaortic denervation. PLoS One. 2014;9(5):e87935. | ||
Salemi VM, Bilate AM, Ramires FJ, et al. Reference values from M-mode and Doppler echocardiography for normal Syrian hamsters.Eur J Echocardiogr. 2005;6(1):41–46. | ||
Folch J, Lees M, Sloane Stanley GH. A simple method for the isolation and purification of total lipides from animal tissues. J Biol Chem. 1957;226(1):497–509. | ||
Padoveze AF, Maniero F, Oliveira TV, Vitorio TS, Couto RD, Maranhão RC. Effect of a cholesterol-rich diet on the metabolism of the free and esterified cholesterol components of a nanoemulsion that resembles LDL in rabbits. Braz J Med Biol Res. 2009;42(2):172–178. | ||
Guido MC, de Carvalho Frimm C, Koike MK, Cordeiro FF, Moretti AI, Godoy LC. Low coronary driving pressure is associated with subendocardialremodelling and left ventricular dysfunction in aortocaval fistula. Clin Exp Pharmacol Physiol. 2007;34(11):1165–1172. | ||
Liberman M, Bassi E, Martinatti MK, et al. Oxidant generation predominates around calcifying foci and enhances progression of aortic valve calcification. Arterioscler Thromb Vasc Biol. 2008;28(3):463–470. | ||
Kajstura J, Cheng W, Reiss K, et al. Apoptotic and necrotic myocytecelldeaths are independent contributing variables of infarctsizein rats. Lab Invest. 1996;74(1):86–107. | ||
de Carvalho Frimm C, Koike MK, Cúri M. Subendocardial fibrosis in remote myocardium results from reduction of coronary driving pressure during acute infarction in rats. Arq Bras Cardiol. 2003;80(5):509–520. Portuguese. | ||
Toyota E, Ogasawara Y, Hiramatsu O, et al. Dynamics of flow velocities in endocardial and epicardial coronary arterioles. Am J Physiol Heart Circ Physiol. 2005;288(4):H1598–H1603. | ||
Gebremedhin D, Weinberger B, Lourim D, Harder DR. Adenosinecan mediate its actions through generation of reactive oxygen species. J Cereb Blood Flow Metab. 2010;30(10):1777–1790. | ||
Hori M, Nishida K. Oxidative stress and left ventricular remodelling after myocardial infarction. Cardiovasc Res. 2009;81(3):457–464. | ||
Frangogiannis NG. The inflammatory response inmyocardial injury, repair, and remodelling. Nat Rev Cardiol. 2014;11(5):255–265. | ||
Hofmann U, Frantz S. Role of lymphocytes in myocardial injury, healing, and remodeling after myocardial infarction. Circ Res. 2015;116(2):354–367. | ||
Hulsmans M, Sam F, Nahrendorf M. Monocyte and macrophage contributions to cardiac remodeling. J Mol Cell Cardiol. 2016;93:149–155. | ||
Jacobs M, Staufenberger S, Gergs U, et al. Tumor necrosis factor-alpha at acute myocardial infarction inratsand effects on cardiac fibroblasts. J Mol Cell Cardiol. 1999;31(11):1949–1959. | ||
Montecucco F, Pende A, Mach F. Therenin-angiotensin system modulates inflammatory processes in atherosclerosis: evidence from basic research and clinical studies. Mediators Inflamm. 2009;2009:752406. | ||
Lindsey ML, Iyer RP, Jung M, DeLeon-Pennell KY, Ma Y. Matrix metalloproteinases as input and output signals for post-myocardial infarction remodeling. J Mol Cell Cardiol. 2016;91:134–140. | ||
Passino C, Barison A, Vergaro G, et al. Markers offibrosis, inflammation, and remodeling pathways in heart failure. Clin Chim Acta. 2015; 443:29–38. | ||
Talman V, Ruskoaho H. Cardiacfibrosisin myocardial infarction-from repair and remodeling to regeneration. Cell Tissue Res. 2016; 365(3):563–581. | ||
Yu CM, Tipoe GL, Wing-Hon Lai K, Lau CP. Effects of combination of angiotensin-converting enzyme inhibitor and angiotensin receptor antagonist on inflammatory cellular infiltration and myocardial interstitial fibrosis after acute myocardial infarction. J Am Coll Cardiol. 2001;38(4):1207–1215. | ||
Chan ES, Cronstein BN. Molecular action of methotrexate in inflammatory diseases. Arthritis Res. 2002;4(4):266–273. | ||
Cronstein B. How does methotrexate suppress inflammation? Clin Exp Rheumatol. 2010;28(5 Suppl 61):S21–S23. | ||
Ernens I, Bousquenaud M, Lenoir B, Devaux Y, Wagner DR. Adenosine stimulates angiogenesis by up-regulating production of thrombospondin-1 by macrophages. J Leukoc Biol. 2015;97(1):9–18. | ||
Zhao X, Balaji P, Pachon R, et al. Over expression of cardio myocyteα1A-adrenergic receptors attenuates postinfarct remodeling by inducing angiogenesis through heterocellular signaling. Arterioscler Thromb Vasc Biol. 2015;35(11):2451–2459. | ||
Treon SP, Chabner BA. Concepts in use of high-dosemethotrexate therapy. Clin Chem. 1996;42(8):1322–1329. | ||
Asanuma H, Sanada S, Ogai A, et al. Methotrexate and MX-68, a new derivative of methotrexate, limit infarct size via adenosine-dependent mechanisms in canine hearts. J Cardiovasc Pharmacol. 2004; 43(4):574–579. | ||
Kis A, Baxter GF, Yellon DM. Limitation of myocardial reperfusion injury by AMP579, an adenosineA1/A2A receptor agonist: role of A2A receptor and Erk1/2. Cardiovasc Drugs Ther. 2003;17(5–6):415–425. | ||
Peart JN, Gross GJ. Cardio protection following adenosine kinase inhibition inrathearts. Basic Res Cardiol. 2005;100(4):328–336. | ||
Wakeno M, Minamino T, Seguchi O, et al. Long-term stimulation of adenosine A2b receptors begun after myocardial infarction prevents cardiac remodeling in rats. Circulation. 2006;114(18):1923–1932. | ||
Kaul A, Sethi R, Misra MK. Erythrocyticadenosinedeaminase in post myocardial infarction angina patients. Indian J Clin Biochem. 2009; 24(1):49–51. |
 © 2017 The Author(s). This work is published and licensed by Dove Medical Press Limited. The full terms of this license are available at https://www.dovepress.com/terms.php and incorporate the Creative Commons Attribution - Non Commercial (unported, v3.0) License.
By accessing the work you hereby accept the Terms. Non-commercial uses of the work are permitted without any further permission from Dove Medical Press Limited, provided the work is properly attributed. For permission for commercial use of this work, please see paragraphs 4.2 and 5 of our Terms.
© 2017 The Author(s). This work is published and licensed by Dove Medical Press Limited. The full terms of this license are available at https://www.dovepress.com/terms.php and incorporate the Creative Commons Attribution - Non Commercial (unported, v3.0) License.
By accessing the work you hereby accept the Terms. Non-commercial uses of the work are permitted without any further permission from Dove Medical Press Limited, provided the work is properly attributed. For permission for commercial use of this work, please see paragraphs 4.2 and 5 of our Terms.