")
Back to Journals » Clinical Pharmacology: Advances and Applications » Volume 11
Method development and validation of ursodiol and its major metabolites in human plasma by HPLC-tandem mass spectrometry
Authors Pinto MC, Chorfi Berton D , Cavenatti de Oliveira A, Lazaro CM , Aparecida Calafatti Carandina S
Received 14 September 2018
Accepted for publication 19 November 2018
Published 4 January 2019 Volume 2019:11 Pages 1—13
DOI https://doi.org/10.2147/CPAA.S187519
Checked for plagiarism Yes
Review by Single anonymous peer review
Peer reviewer comments 3
Editor who approved publication: Professor Arthur E. Frankel
Márcio Cardoso Pinto, Danilo Chorfi Berton, Alexandre Cavenatti de Oliveira, Carolina Martins Lazaro, Silvana Aparecida Calafatti Carandina
Pharmacology Department (UNIFAG), Universidade São Francisco, Bragança Paulista, SP, Brazil
Background: Ursodeoxycholic acid (UDCA) and its metabolites tauroursodeoxycholic acid (TUDCA) and glycoursodeoxycholic acid (GUDCA) have been the subject of several pharmacological studies. The objective of this study was to develop an innovative method of quantification by HPL-tandem mass spectrometry (LC-MS/MS), with a lower cost and suitable, for application in bioequivalence studies.
Methods: The procedure involved liquid–liquid extraction for quantification of UDCA/GUDCA and precipitation extraction for TUDCA, using deuterated substances as internal standards (ISs) and Phenomenex Luna 250×4.6 mm 5μ C18 100A column. The mobile phase used was acetonitrile/ammonium acetate 30 mM (420: 580 v/v pH 7) for UDCA, acetonitrile/ammonium acetate 10 mM/ammonium hydroxide (400:600: 0.5 v/v/v pH 9) for GUDCA, and acetonitrile/ammonium acetate 10 mM (570: 430 v/v pH 7) for TUDCA. Ions were monitored by the electrospray ion source (ESI) mass spectrometer, operating in a negative ionization mode. Compound determination was performed by LC-MS/MS system using a calibration curve of 15–10,000 ng/mL for UDCA/GUDCA and 5–500 ng/mL for TUDCA. The method was developed and validated according to the Brazilian National Health Surveillance Agency (ANVISA) of Brazil norms harmonized with the main international guidelines as a prerequisite for conducting in vivo study in human volunteers.
Results: The method did not present matrix effect and residual effect, showing to be selective for studied molecules, with adequate accuracy and precision. In addition, the method was considered sensitive presenting a coefficient of variation less than 20% for the lower limit of quantification of each compound.
Conclusion: This method can be applied in bioequivalence studies to determine ursodiol and its metabolites reproducibly, simply, and effectively with the use of readily accessible analytical materials and instrumentation.
Keywords: ursodeoxycholic acid, glicoursodeoxycholic acid, tauroursodeoxycholic acid, bioequivalence, LC-MS/MS
Introduction
Ursodeoxycholic acid or ursodiol (3α, 7-β-dihydroxy-5-β-cholanic acid [UDCA]) is a bile acid that naturally occurs in small amounts in human plasma. It acts physiologically in the regulation of cholesterol, reducing the rate at which the intestine absorbs and synthesizes these molecules.1,2 For this reason, UDCA is used pharmacologically in pathologies where there is dysfunction of that regulation, such as for the treatment of gallstones formed by cholesterol, postcholecystectomy syndrome, primary biliary cirrhosis, dyskinesias, hypercholesterolemia and hypertriglyceridemia, cholestasis, and chronic hepatitis, among others.3–6
After ingestion, UDCA passes through the liver where, by amidation processes, it is conjugated with glycine or taurine, originating from its main metabolites glycoursodeoxycholic acid ((N-[(3α,5β,7β)-3,7-dihydroxy-24-oxocholan-24-yl]-glycine [GUDCA]) and tauroursodeoxycholic acid (2-[[(3α,N-(3α,7β-dihydroxy-5β-cholan-24-oyl)-taurine [TUDCA]). After being secreted into the hepatic bile ducts, these conjugates are concentrated in the gallbladder and expelled into the duodenum, where their pharmacological functions will be performed.4,5,7 Therefore, it is necessary to quantify both the unaltered drug (UDCA) and its metabolites (TUDCA and GUDCA) in bioequivalence studies.8 The chemical structures of these compounds are presented in Figure 1.
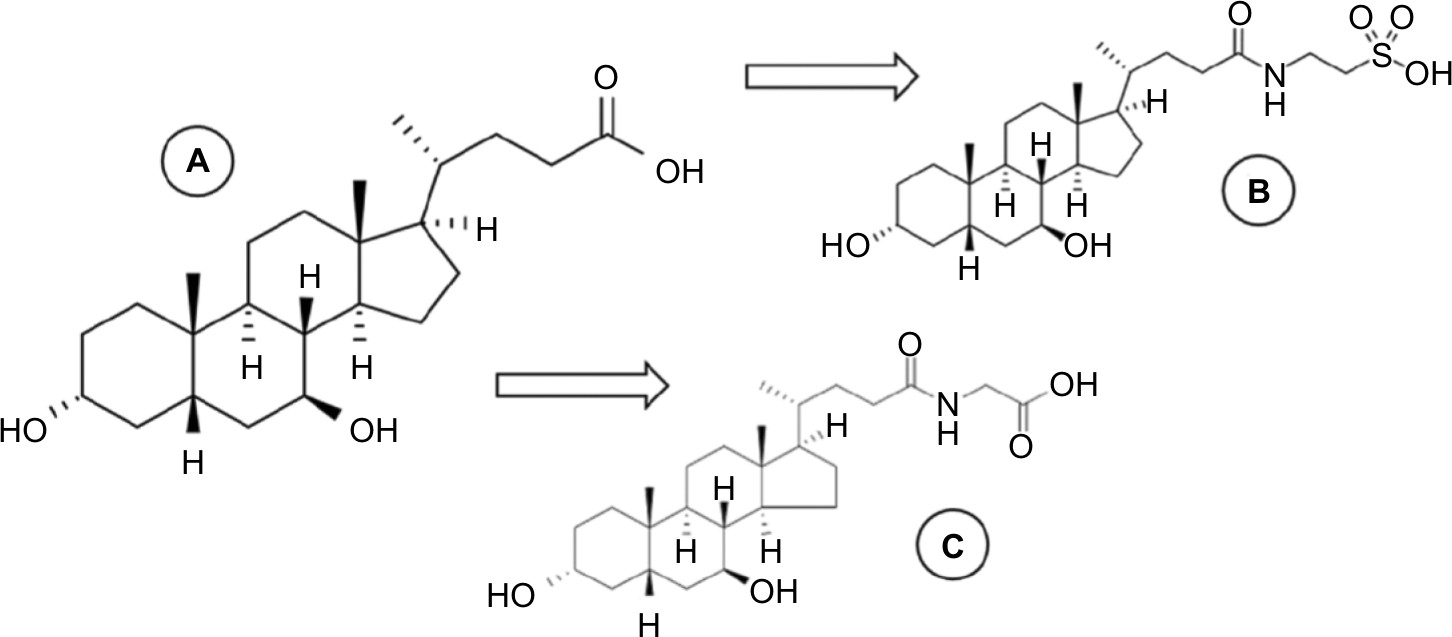 | Figure 1 Chemical structure of UDCA (A) and its main metabolites, GUDCA (B) and TUDCA (C). Abbreviations: GUDCA, glycoursodeoxycholic acid; TUDCA, tauroursodeoxycholic acid; UDCA, ursodeoxycholic acid. |
There are countless researches on new applications of UDCA nowadays, and so far, results have demonstrated that this drug is able to delay the progression of cataract in rats with diabetes induced by hyperglycemia due to its potential antioxidant action;9 the UDCA has also been shown to promote healing in the epithelium of the colonic mucosa of rats and has been identified as a natural regulator of that process;10 the previous studies have also shown that the ursodiol metabolite TUDCA promotes decreased insulin resistance in the liver, skeletal muscle, and adipose tissue in obese rats, and similar results have been obtained in humans;11 UDCA has shown anti-inflammatory effects and promoted functional recovery in rats with spinal cord injury;6 male rats with cholestasis were treated with UDCA and it led to the prevention of the development of obesity associated with hypertension in their male litters,11 among several other studies. The existence of recent research for treatment and control of several pathologies either associated with or not associated with liver problems shows that UDCA has broad therapeutic potential and could well become the target of pharmacological discoveries. This makes the development of generic UDCA drugs especially attractive because it brings with it the possibility of new drug therapies at a lower cost to the population.
Several analytical methods have been developed for determining bile acids in biological fluids, among them the UCDA and its metabolites, each one with its own particularities.3,8,13 The development of a suitable and simple method in LC-MS/MS (HPLC-tandem mass spectrometry) for UDCA, GUDCA, and TUDCA determination could be useful in enabling an understanding of the original compound’s metabolism as well as in obtaining new generic drugs that are more accessible and less costly for the population and the pharmaceutical industry.
This study aimed to develop a new, efficient, and simple methodology for quantification of ursodiol and its main metabolites in low concentrations in human plasma through the use of LC-MS/MS methodology, thereby enabling its application in bioequivalence/bioavailability studies. In addition, a full validation of the method was performed in accordance with the guidelines of the Brazilian National Health Surveillance Agency (ANVISA), which are harmonized with the main international guidelines and are a prerequisite for conducting an in vivo study in human volunteers.14
Materials and methods
Materials
The UDCA reference standard was purchased from British Pharmacopeia (Queen’s Road, Teddington, UK), and its metabolites, TUDCA sodium salt and GUDCA, were purchased from Synfine Research (Ontario, Canada), while their respective deuterated internal standards (ISs) were purchased from IsoSciences (Pennsylvania, Ambler, USA). Human plasma was obtained from UNIFAG (Bragança Paulista, SP, Brazil). The type I water HPLC grade was obtained internally using a Millipore Academic purification system. Acetonitrile and methanol (MeOH) were purchased from J.T. Baker-Avantor (Xalostoc, Mexico), and ammonium acetate, hydrochloric acid (HCl), diethyl ether, dichloromethane, ammonium hydroxide, and ethyl acetate were purchased from EMD Millipore (Billerica, MA, USA).
Stock solutions and standards
The stock solutions of analytes (UDCA, GUDCA, and TUDCA) and their respective deuterated IS were prepared by mixing appropriate amounts of the standards with MeOH to obtain solutions at the respective concentrations: 100.0 µg/mL for TUDCA, TUDCA D4, and GUDCA D4; 200.0 µg/mL for UDCA D4, and 500.0 µg/mL for UDCA and GUDCA. The stock solutions were stored in a refrigerator with controlled temperature in a range of 2°C–8°C±2°C.
From these solutions, the respective working solutions were prepared and used to obtain the calibration curve composed of eight points in the range of 15–10,000 ng/mL for UDCA/GUDCA and 5–500 ng/mL for TUDCA. Spiking was performed on human plasma with an appropriate amount of each analyte. Quality controls (QCs) were spiked similarly to calibration curve points at the concentration of 45, 5,000, and 8,000 ng/mL for UDCA/GUDCA and 15, 250, and 400 ng/mL for TUDCA.
Sample preparation
UDCA
The UDCA samples were prepared by liquid–liquid extraction done by shaking 450 µL of UDCA spiked plasma samples with 50 µL of 9.0 µg/mL UDCA D4 solution prepared in MeOH, 50 µL of 1M HCl solution, and 1,250 µL diethyl ether/dichloromethane (70:30 v/v) for 5 minutes on a shaker table and then centrifuged for 10 minutes (relative centrifugal force [RCF]: 18,506× g, 4°C). 850 µL of the supernatant was transferred to another microtube and reserved. 1,250 µL of diethyl ether/dichloromethane (70:30 v/v) was added to the remaining plasma; it was shaken for 5 minutes and then centrifuged for 10 minutes (RCF: 18,506× g, 4°C). 850 µL of supernatant was transferred to the reserved microtube and was dried under nitrogen flow and resuspended in 150 µL of acetonitrile/ammonium acetate 10 mM/ammonium hydroxide (70:30:0.1 v/v/v), was shaken for 2 minutes, and then 30 µL was injected for analysis.
GUDCA
Like the UDCA samples, the GUDCA samples were prepared by liquid–liquid extraction, shaking 300 µL of GUDCA spiked plasma with 50 µL of 3.0 µg/mL glycosodeoxycholic D4 solution in MeOH and 50 µL of 1M HCl solution for 1 minute on a shaker table. Then, 1,250 µL of diethyl ether/dichloromethane (70:30 v/v) was added, and the sample was shaken again for 5 minutes and then centrifuged for 10 minutes (RCF: 18,506× g, 4°C). 900 µL of the supernatant was transferred to another microtube. This was dried under nitrogen flow and resuspended in 150 µL of acetonitrile/ammonium acetate 10 mM/ammonium hydroxide (70:30:0.1 v/v/v), shaken for 2 minutes and then 15 µL were inject for analysis.
TUDCA
TUDCA samples were prepared by deproteinization extraction (precipitation), shaking 400 µL of TUDCA spiked plasma with 50 µL of 2.0 µg/mL TUDCA D4 solution in acetonitrile (MeCN) and 1,250 µL of ethyl acetate for 3 minutes on a shaker table and then centrifuged for 5 minutes (RCF: 18,506× g, 4°C). Samples were frozen for 10 minutes in a –70°C freezer, the supernatant was discarded, and after complete thawing of the residual sample, 600 µL of acetonitrile was added. The mixture was shaken for 5 minutes and centrifuged for 10 minutes (RCF: 18,506× g, 4°C). 500 µL of supernatant was transferred to another microtube, 150 µL of Milli-Q ultrapure water was added and shaken for 2 minutes, and then 20 µL was injected for analysis.
Chromatography and quantification
The chromatographic systems used were HPLC (Shimadzu, Japan) coupled to a Quattro Micro/Quattro Premier mass spectrometer (Waters, Milford, MA, USA) for each of the three analytes. The chromatographic separation was done through a Phenomenex Luna 5μ C18 100A 250 × 4.6 mm (Torrence, USA) column for the three analytes, with a mobile phase consisting of acetonitrile/ammonium acetate 30 mM (420:580, v/v), pH 7.0, for the UDCA; acetonitrile/ammonium acetate 10 mM/ammonium hydroxide (400:600:0.5, v/v/v), pH 9.0, for the GUDCA; and acetonitrile/ammonium acetate 10 mM (570:430, v/v), pH 7.0, for the TUDCA. The mobile phase flows were set at 0.450 mL/min for UDCA (with gradient: 0.01–0.51 minute, 0.45 mL/min – 50 kgf; 0.52–1.90 minutes, 2.00 mL/min – 200 Kgf; 1.91 minute, 0,45 mL/min – 50 kgf), 0.700 mL/min for GUDCA (with gradient: 0.01–2.50 minutes, 0.700 mL/min – 85 kgf; 2.51–4.75 minutes, 0.35 mL/min – 44 kgf; 4.76 minute, 0.700 mL/min – 85 kgf), and 0.200 mL/min for TUDCA (with gradient: 0.01–0.1 minute/1.21–5.5 minutes and 7.51 minutes, 0.200 mL/min – 20 kgf; 0.11–1.2 minutes and 5.51–7.5 minutes,1.5 mL/min – 130 kgf).
The use of a splitter was not necessary. Under the described conditions, the UDCA, GUDCA, and TUDCA elution times are of 3.47, 3.34, and 3.19 with a total run time of 6.50, 5.00, and 8.00, respectively. Ions were monitored by an electrospray ion source (ESI) mass spectrometer, operating in a negative ionization mode, and the transitions measured were m/z 391.30 > m/z 373.41 for UDCA, m/z 395.42 > m/z 377.15 UDCA D4, m/z 448.46 > m/z 73.70 for GUDCA, m/z 451.92 > m/z 73.70 for GUDCA D4, m/z 498.00 > m/z 79.63 for TUDCA, and m/z 502.44 > m/z 79.54 for TUDCA D4, as shown in Figures 2–7. The quantification of analytes in human plasma was based on the peak area ratio of the analytes by the IS. The determination of the concentration of analytes in human plasma was determined from calibration curves that were analyzed by linear regression using the least squares method (linear correlation coefficient 1/x2).
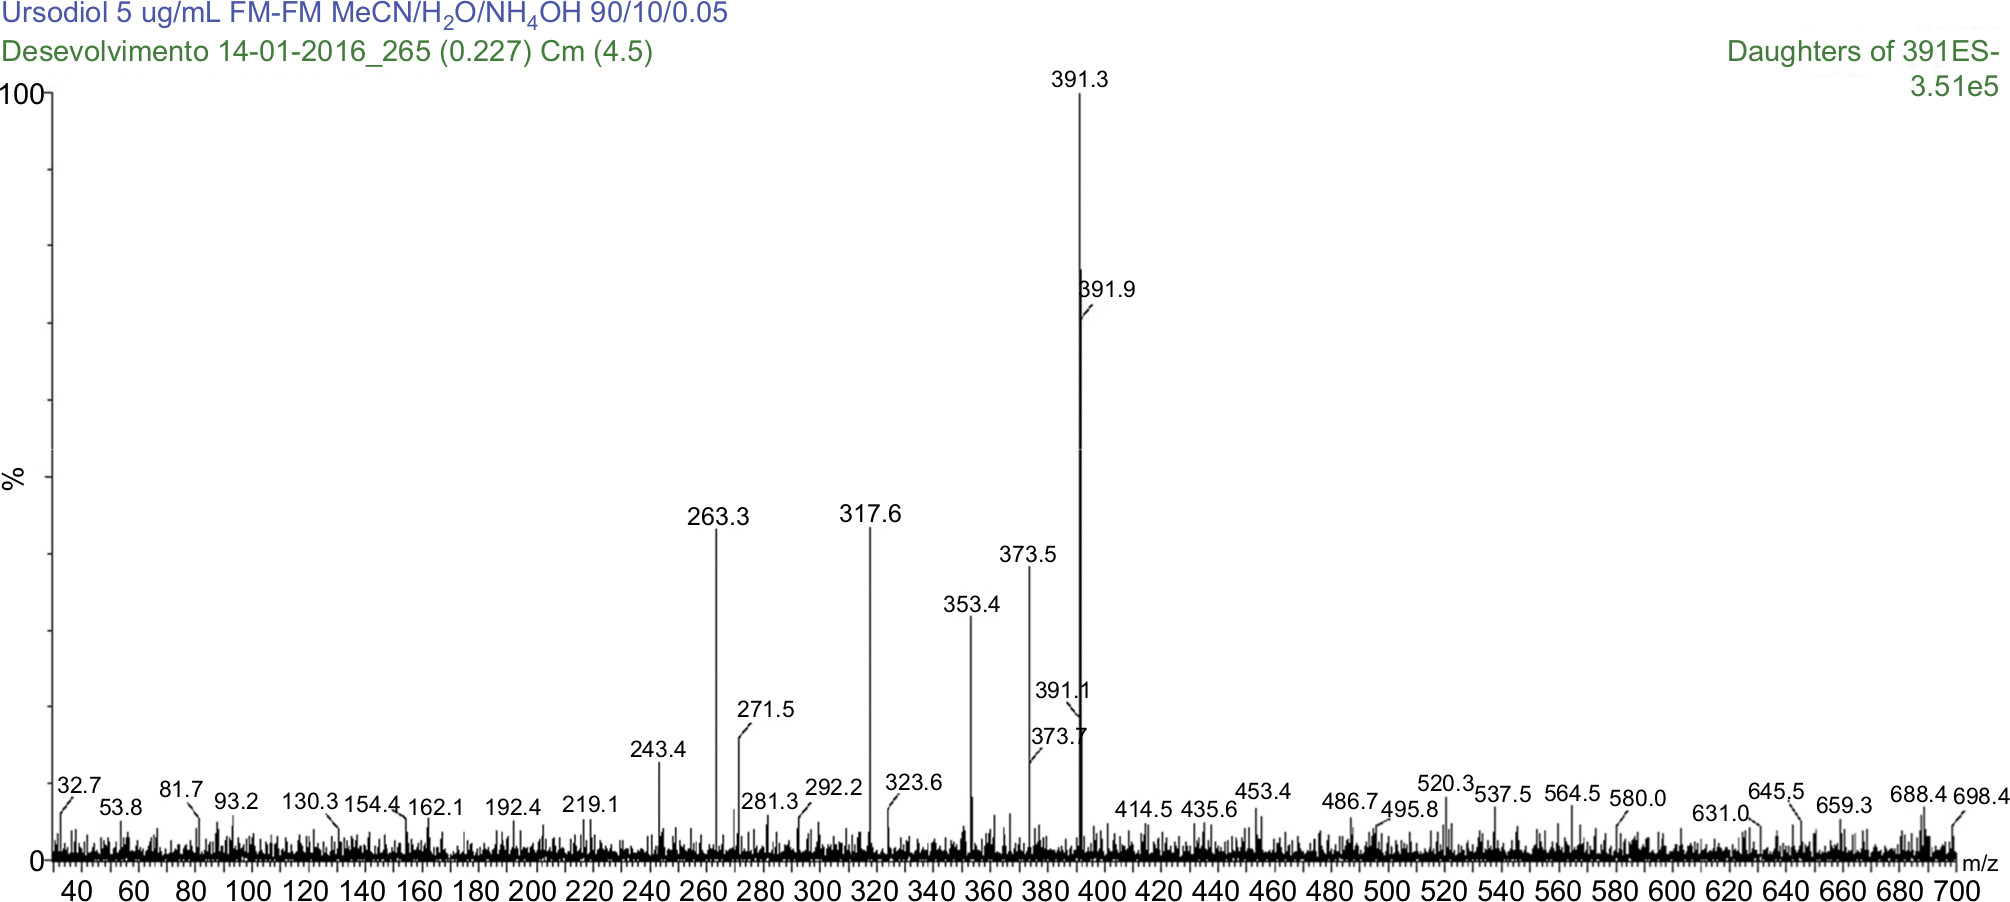 | Figure 2 MS/MS spectrum of ursodeoxycholic acid: precursor ion m/z 391.3 Da product ion, used to form the monitoring channel, m/z 373.5 Da. Abbreviation: MS/MS, tandem mass spectrometry. |
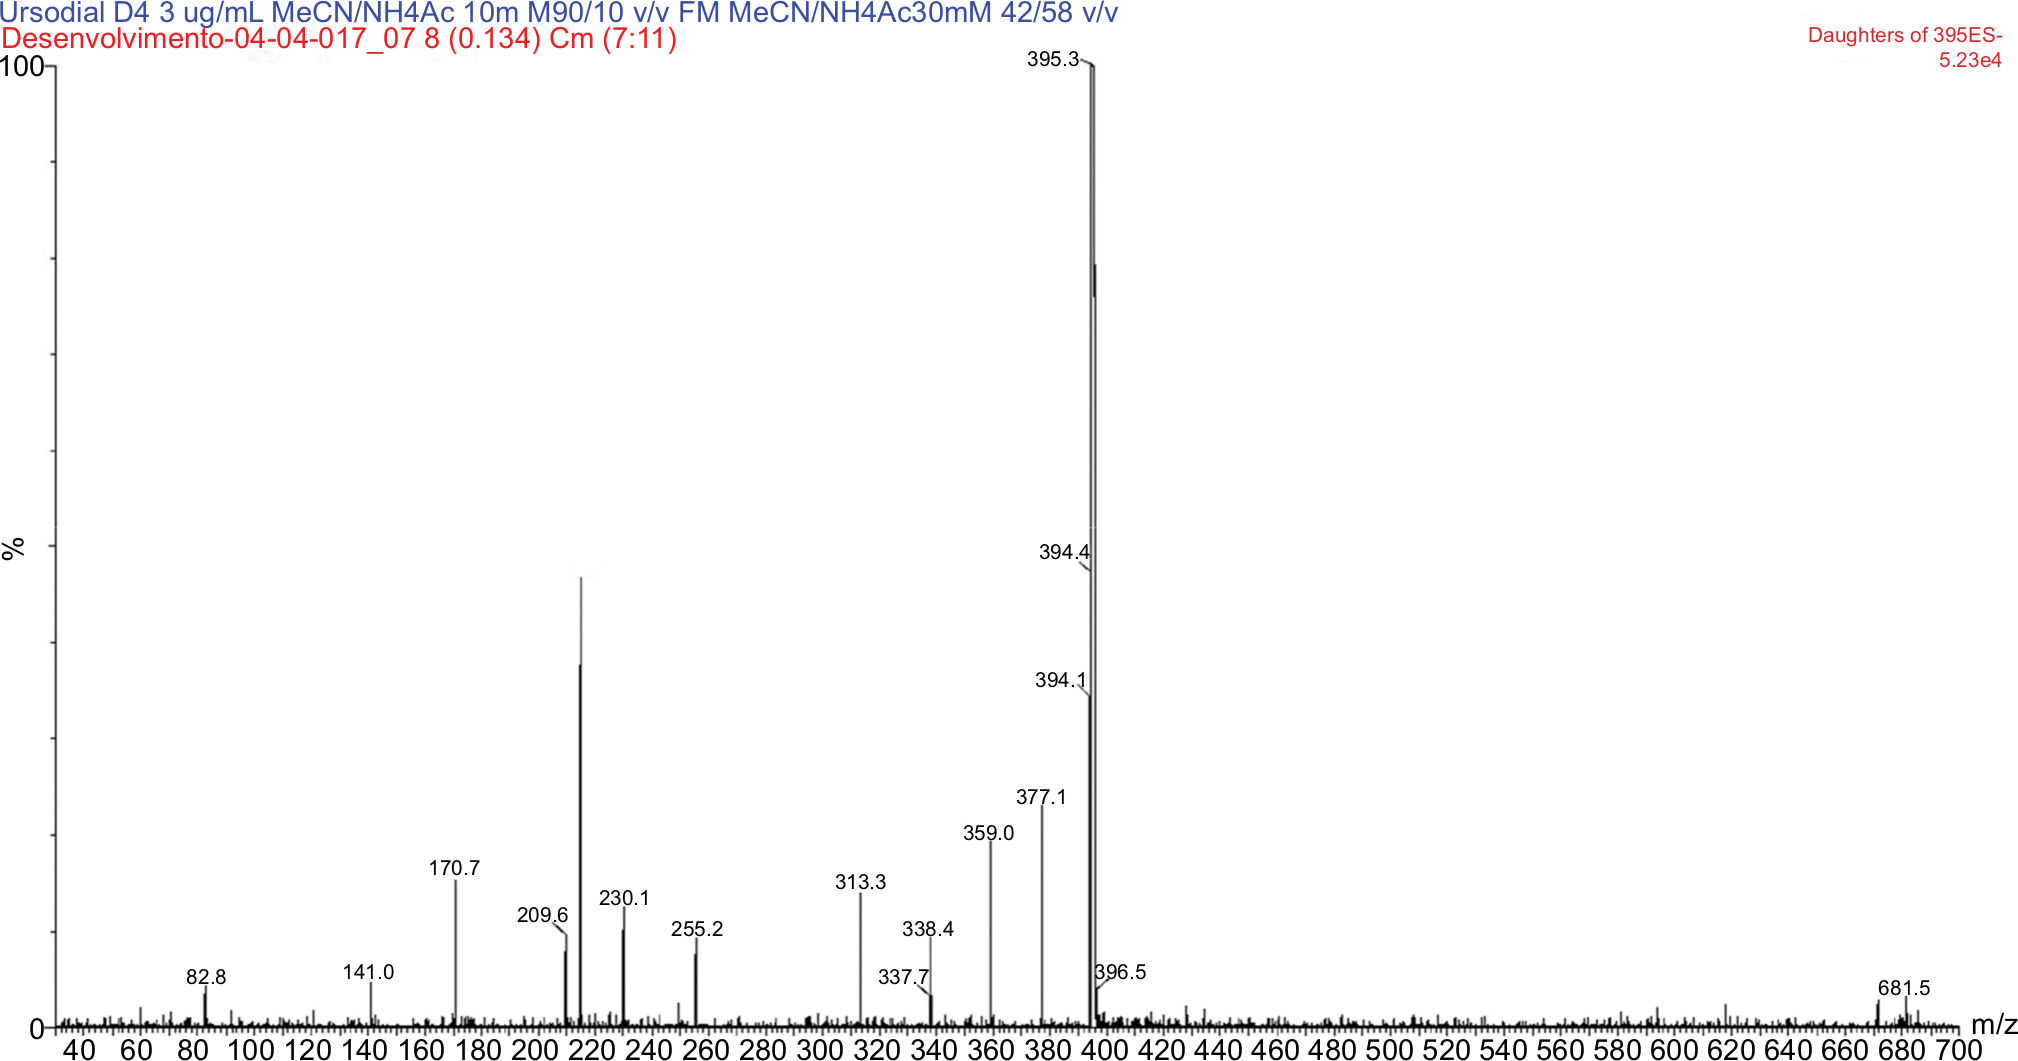 | Figure 3 MS/MS spectrum of ursodeoxycholic acid D4: precursor ion m/z 395.3 Da product ion, used to form the monitoring channel, m/z 377.1 Da. Abbreviation: MS/MS, tandem mass spectrometry. |
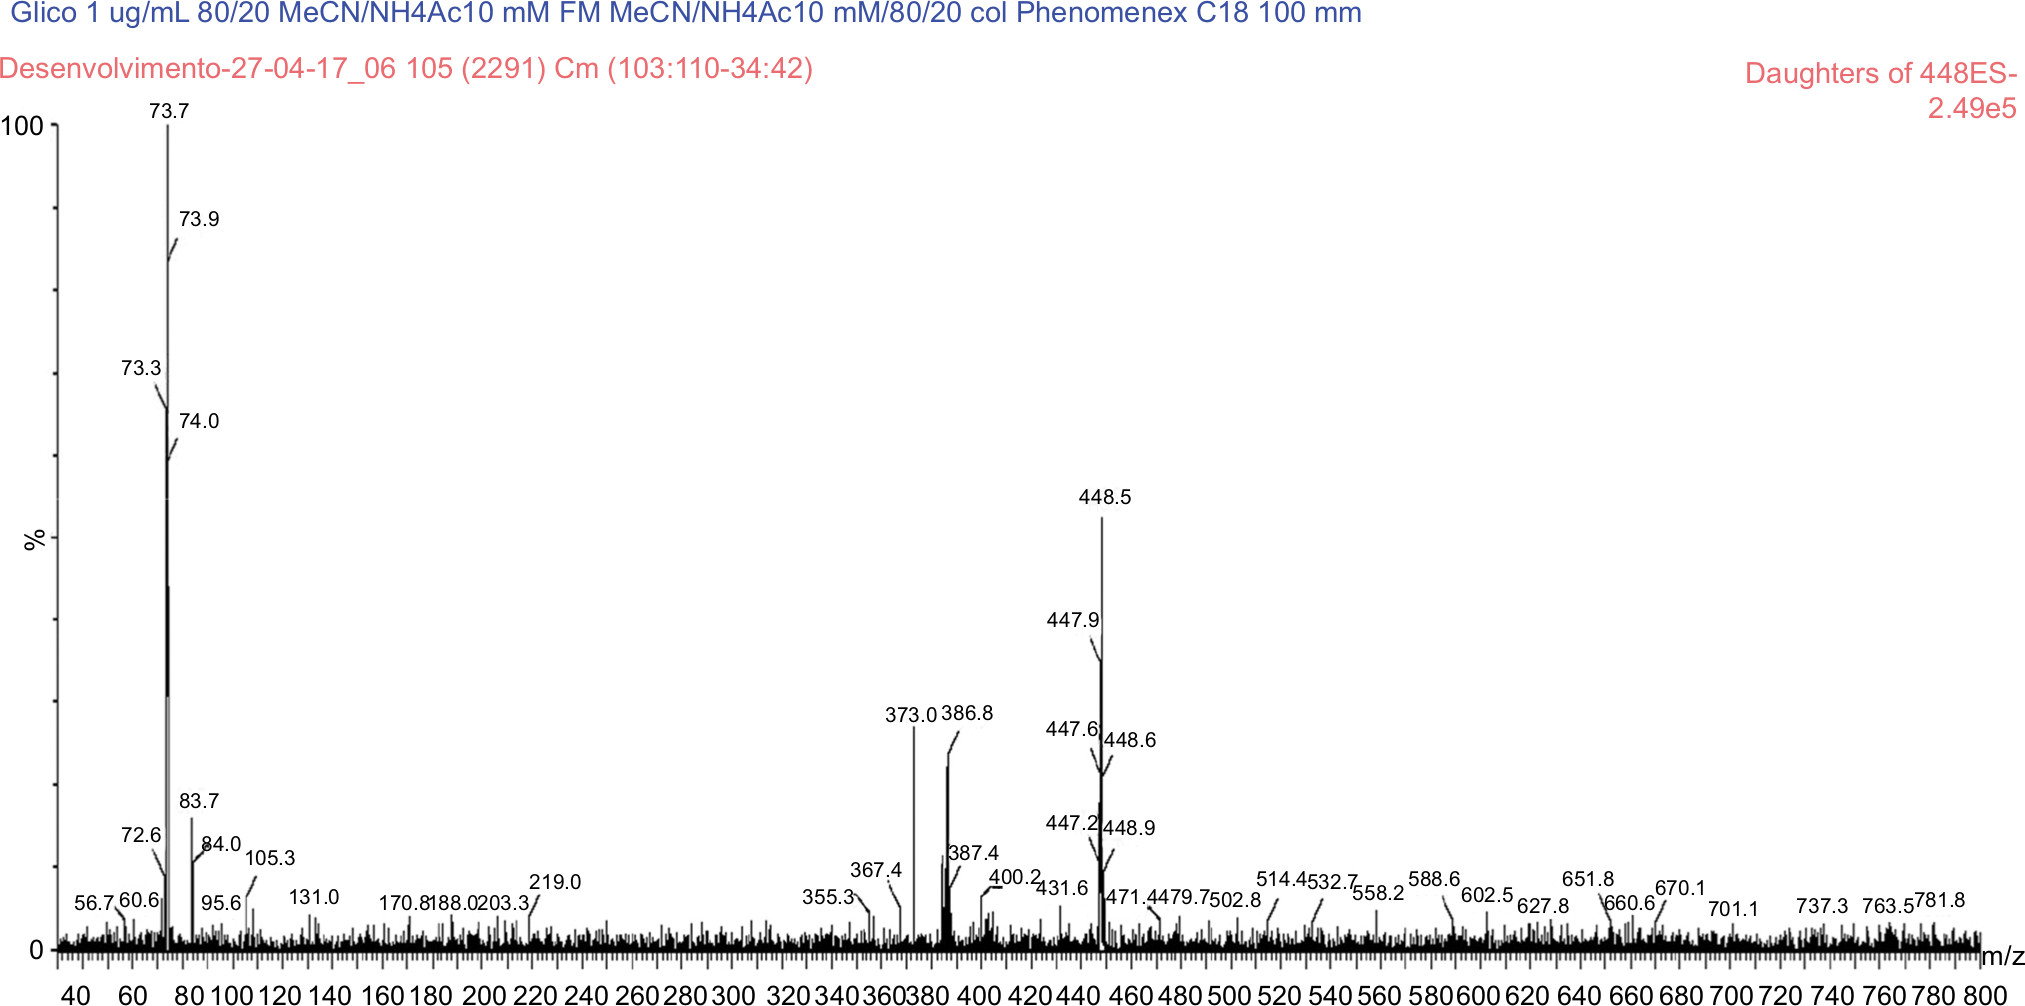 | Figure 4 MS/MS spectrum of glycosodeoxycholic acid: precursor ion m/z 448.5 Da product ion, used to form the monitoring channel, m/z 73.7 Da. Abbreviation: MS/MS, tandem mass spectrometry. |
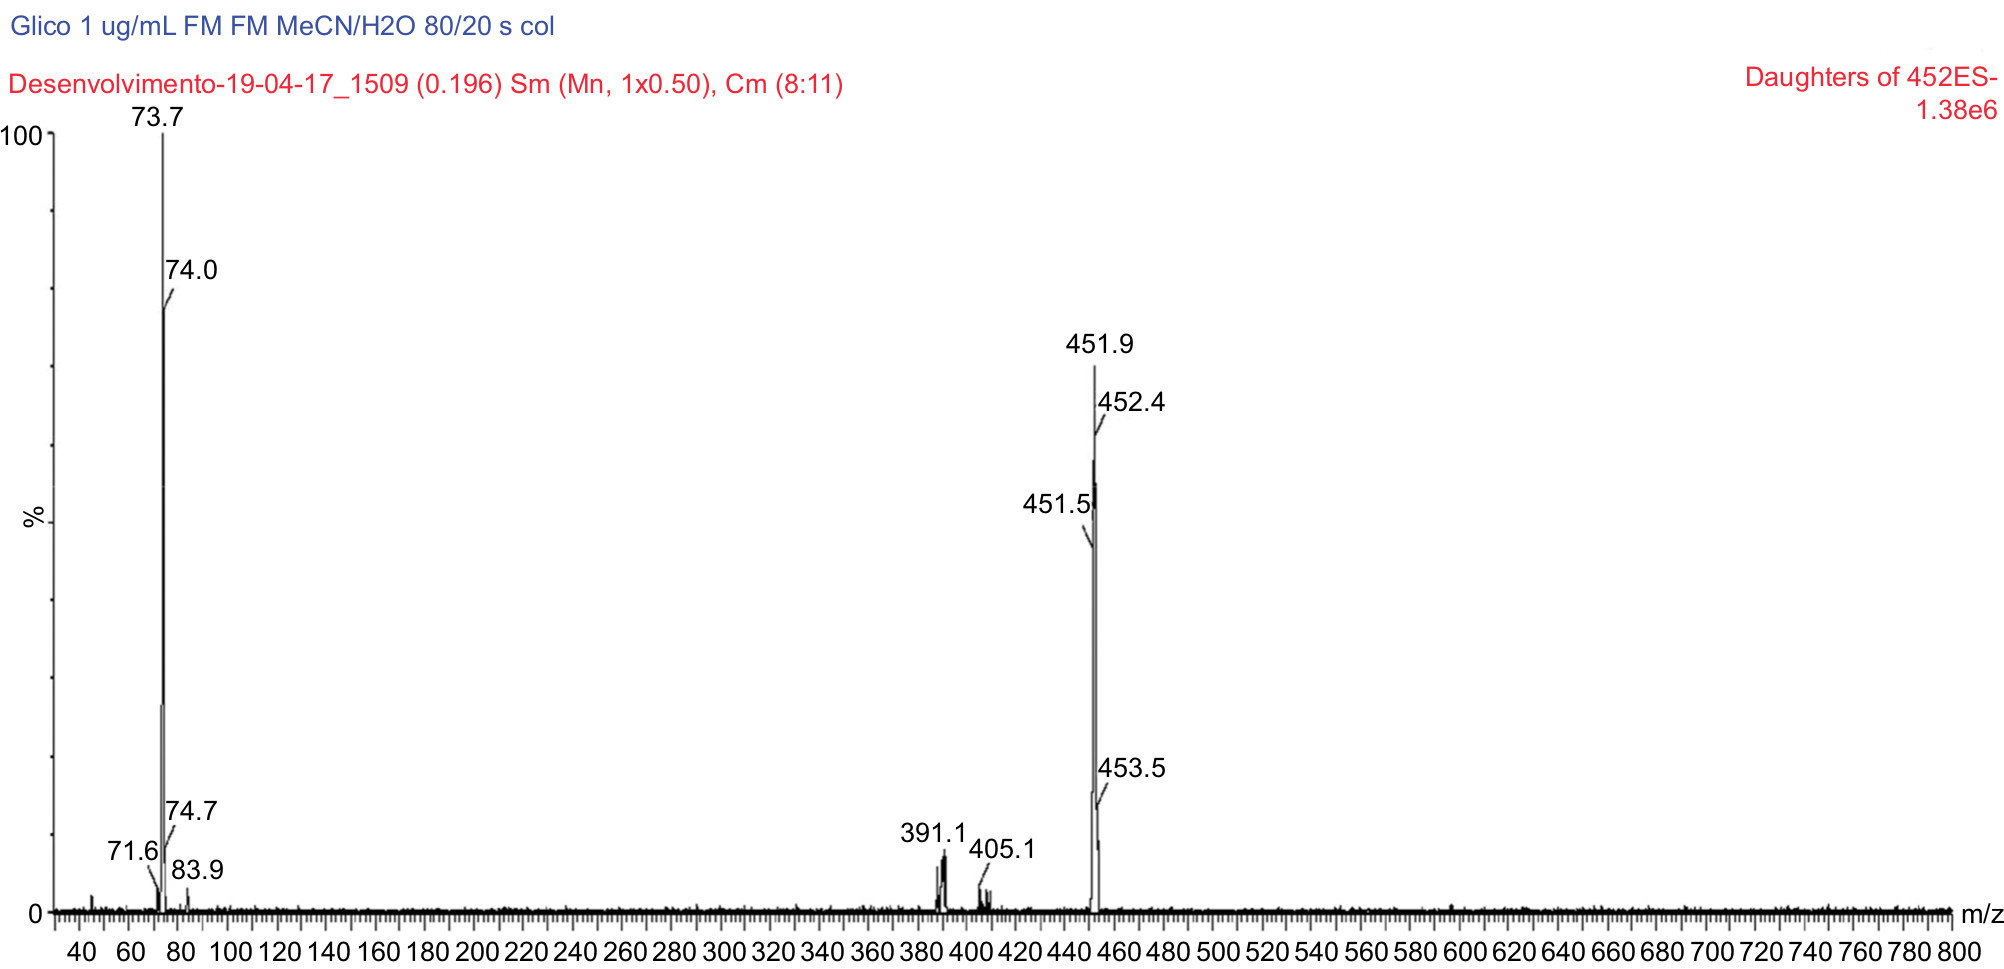 | Figure 5 MS/MS spectrum of glycosodeoxycholic acid D4: precursor ion m/z 451.9 Da product ion, used to form the monitoring channel, m/z 73.7 Da. Abbreviation: MS/MS, tandem mass spectrometry. |
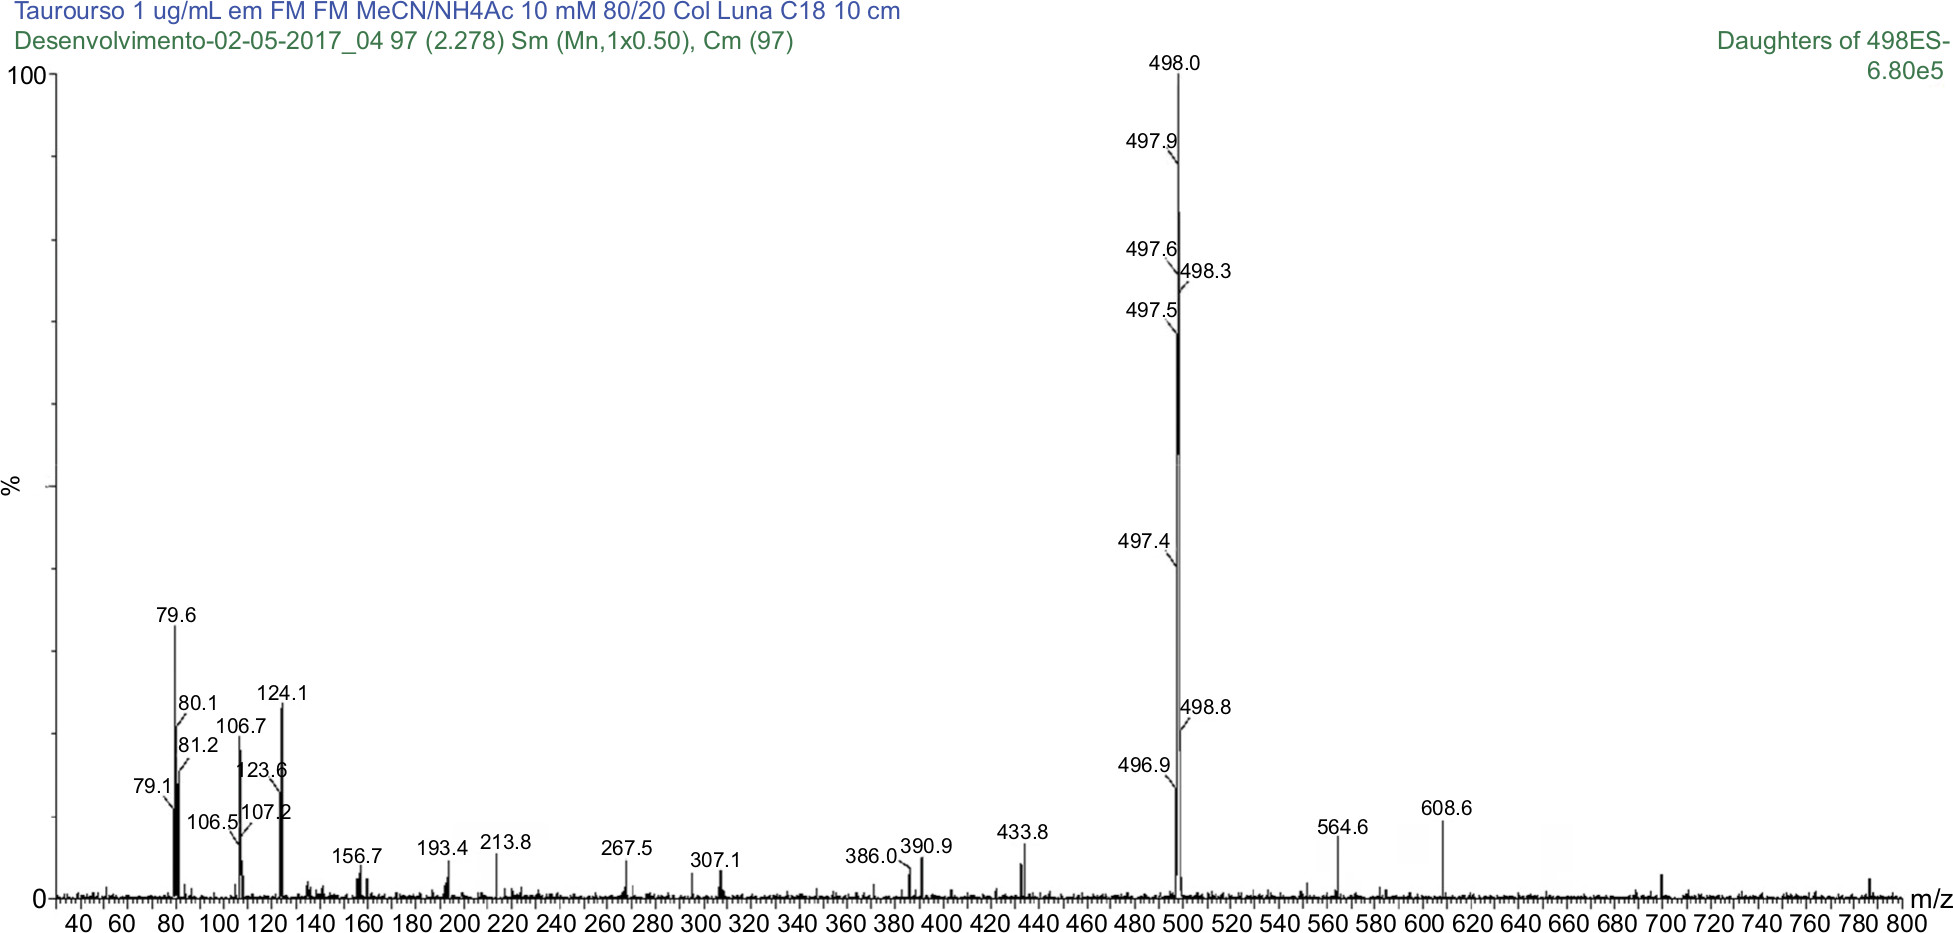 | Figure 6 MS/MS spectrum of taurodeoxycholic acid: precursor ion m/z 498.0 Da product ion, used to form the monitoring channel, m/z 79.6 Da. Abbreviation: MS/MS, tandem mass spectrometry. |
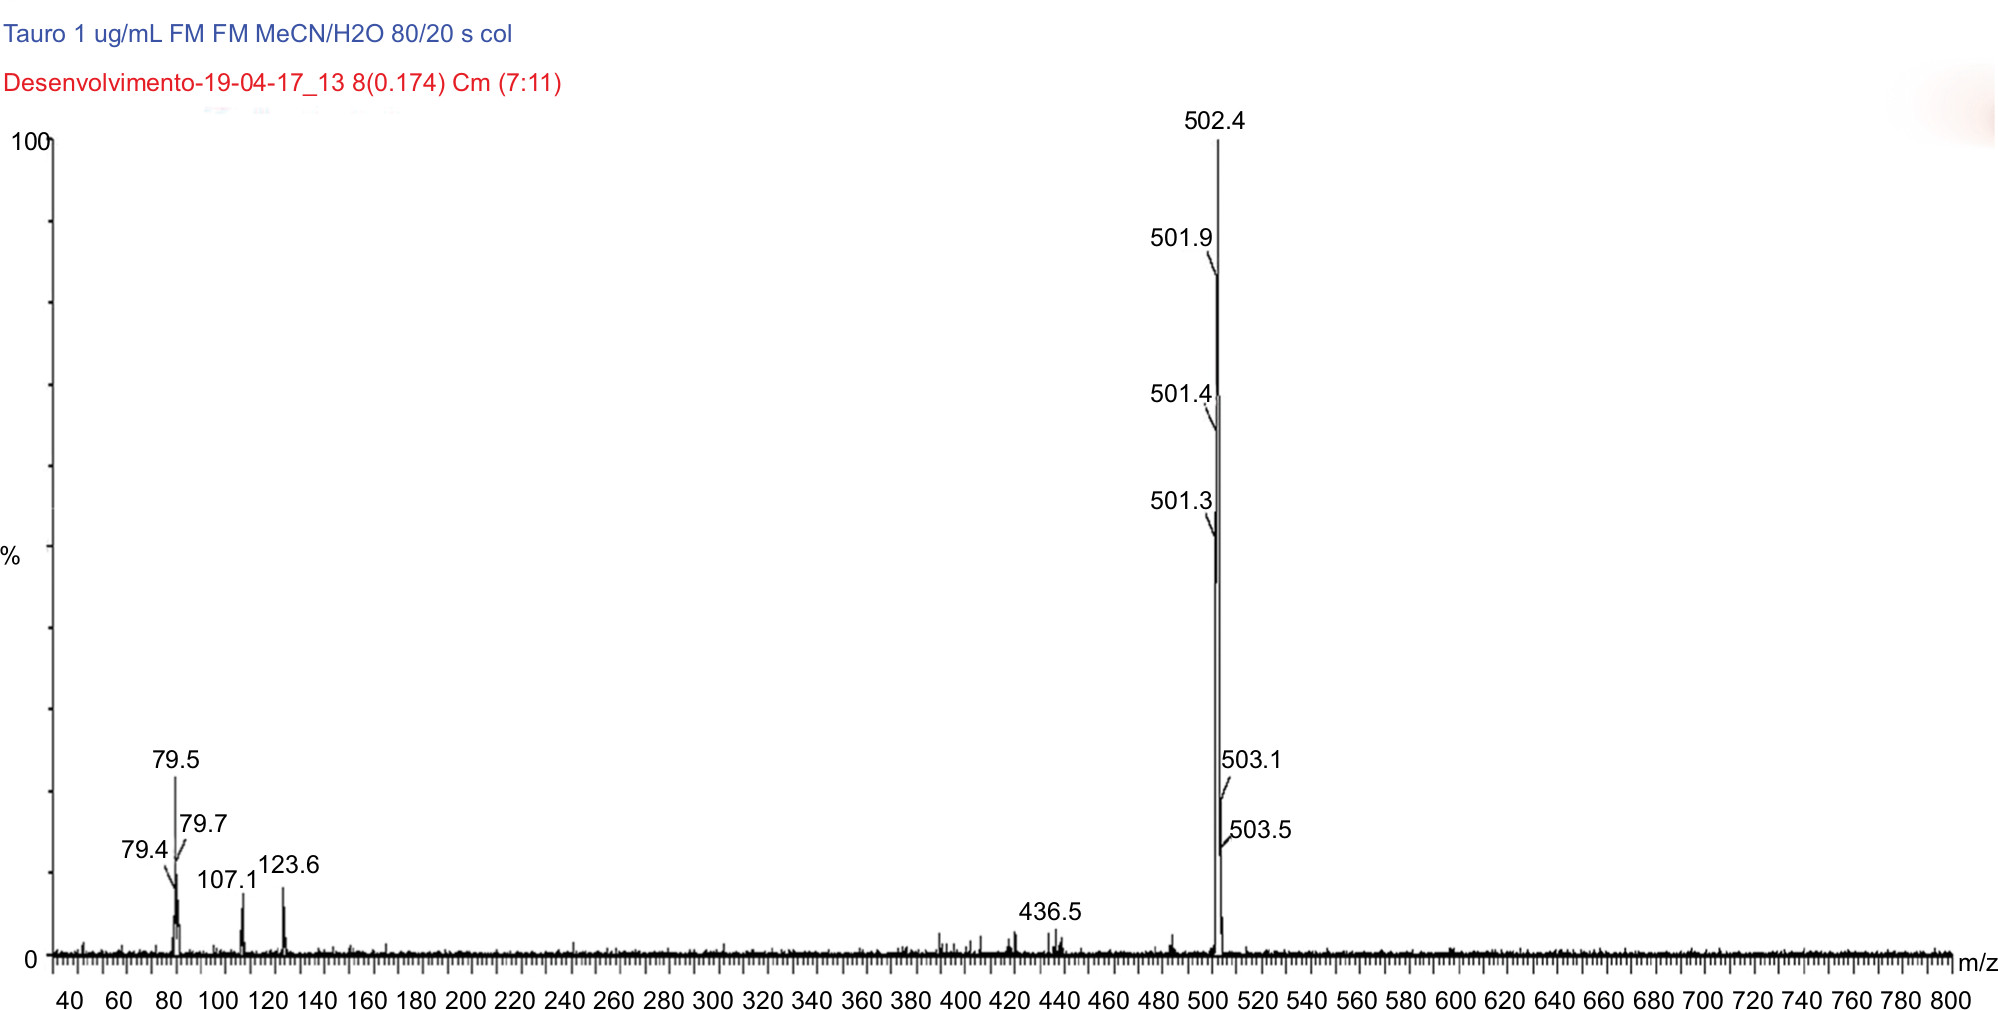 | Figure 7 MS/MS spectrum of tauroursodeoxycholic acid D4: precursor ion m/z 502.4 Da product ion, used to form the monitoring channel, m/z 79.5 Da. Abbreviation: MS/MS, tandem mass spectrometry. |
Results and discussion
Method development
The chromatographic conditions were defined from several internal tests, seeking to obtain a higher peak response, with good resolution, symmetry, and the shortest running time, using the available materials.
The mobile phase for quantification of UDCA was defined after several tests, first acetonitrile/water/ammonium hydroxide (90:10:0.05–20:80:0.05 v/v/v) and acetonitrile/water (60:40 v/v), where the existence of a peak at the same retention time of analyte was observed after testing with blank plasma, which persisted even in the absence of organic modifiers. An increases in water (80 mL) resulted in a slight separation of these peaks when compared to blank samples and spiked samples. These results showed that the peak observed in plasma samples corresponded to an intense eluting with the active. Accordingly, mobile phase tests were performed in several volumes of acetonitrile/water, acetonitrile/ammonium acetate 10 mM/ammonium hydroxide, acetonitrile/water/ammonium hydroxide; acetonitrile/ammonium acetate 10 mM; acetonitrile/ammonium acetate 20 mM; and acetonitrile/ammonium acetate 30 mM. The last solution presented an excellent separation and chromatographic resolution in the proportion of 42:58 (v/v), and so this was the mobile phase chosen for the method. In these tests, the addition of ammonium acetate to the mobile phase favored a decrease in retention time of the peaks, while also minimizing the chromatographic variation and separation between analytes and interferents. The ammonium hydroxide was added as an organic modifier with basic characteristics, but in spite of promoting a significant increase of the electronic signal, it caused a smaller separation and chromatographic resolution. The water increase leads to an electronic signal decrease, making it difficult to quantify the lower limit of quantification (LLOQ), and so it was withdrawn from the final solution.
The mobile phase initially used to quantify the metabolites was acetonitrile/water/ammonium hydroxide (80:20:0.05 v/v/v), which resulted in an electronic signal gain for the two substances. However, these tests revealed peak spreading at the area of interest, so new mobile phases were tested as follows: without ammonium hydroxide, with ammonium acetate in its place, and with the presence of both those modifiers. The mobile phase with 10 mM ammonium acetate only presented the best result for precipitation tests, and so the mobile phase acetonitrile/ammonium acetate 10 mM (57:43 v/v) was used for TUDCA. However, after accuracy tests for GUDCA, interference peaks were observed, and so the mobile phase was changed to acetonitrile/ammonium acetate 10 mM (60:40 v/v), which leads to the separation of those peaks, but it was insufficient. Other proportions were tested: 80:20–50:50–40:60 v/v and the 40:60 v/v that presented the best results. Furthermore, organic modifiers were added to that mobile phase (ammonium hydroxide) in the hopes of improving the signal and chromatographic separation. The new mobile phase demonstrated effectiveness with a proportion of acetonitrile/ammonium acetate 10 mM/ammonium hydroxide (40:60:0.5 v/v/v).
The following columns were also tested for UDCA determination: Synergi Fusion 25 cm, Luna Phenyl Hexyl 25 cm, Ace PFP C18 15 cm, and Luna 5 μ C18 100A 25 cm, the last one being the most efficient in separation of the interferer that eluted after the peak of interest. To stabilize possible variations in the column temperature that could affect its stability, an column oven was coupled keeping it at a temperature of 30°C and the dwell time parameter (speed scan) was increased to minimize the number of scans per seconds, thereby decreasing variations in retention time. For TUDCA and GUDCA, Luna 5 µm C18 100×4.6 mm, Phenomenex C18 100×4.6 mm, Phenomenex 15 cm C18, Phenyl-Hexyl 15 cm, and Luna Phenomenex 5 μ C18 100A 25 cm columns were tested. The last one presented the best results in the separation of interfering peaks that had been found for GUDCA, also in obtaining a satisfactory result for TUDCA.
The UDCA resuspension solution was obtained from several tests to improve the electronic signal. Several proportions of acetonitrile/water/formic acid; acetonitrile/water; acetonitrile/water/ammonium hydroxide; acetonitrile/ammonium acetate 10 mM; and acetonitrile/water/ammonium hydroxide were tested. Although the last option presented a good electronic signal (90:10:0.05 v/v/v), the exclusion of base from the resuspension solution was important for the stabilization of retention time; thus, the solution chosen was acetonitrile/ammonium acetate 10 mM (90/10 v/v). The use of 1M HCl in extractions of GUDCA showed better recovery results. In addition, several tests were performed for resuspension solution of this metabolite: acetonitrile/ammonium acetate 10 mM/ammonium hydroxide in 40:60:0.5, 80:20:01, and 70:30:0.1 v/v/v proportions, and the last option was chosen since it assisted in the elimination of peak spreading problems.
During extraction tests, the liquid–liquid technique was used because it is the most suitable method for predominantly nonpolar compounds, such as UDCA and GUDCA, especially because in its extraction process was made use of solvents and reagents with this characteristic. For TUDCA, the deproteinization technique was used due to its polar nature. The solid phase method, albeit cleaner and more effective, was not chosen due to its high cost, which made it infeasible for the purpose of this study.
For UDCA analysis, a flow of 0.450 mL/min was defined based on the gradient tests, which led to a considerable reduction in the time for each analysis. The channels defined were MRM m/z 391.30 ˃ m/z 373.5 for UDCA and MRM channel m/z 395.3 ˃ m/z 377.1 for UDCA D4 operating on ESI in a negative ionization mode (ESI–). The m/z 391.20> m/z 355.04 channel was also tested for the analyte, but showed chromatographic interferences and poor solubility. For metabolites, signals of their respective masses were only observed in a negative ionization mode (ESI–), using a flow of 0.700 mL/min for GUDCA and 0.200 mL/min for TUDCA, and a gradient was also necessary. The channels were defined as specified earlier.
Thus, a test of accuracy and precision was carried out to confirm the efficiency and effectiveness of the method. With the chosen technique, a triplicate curve was obtained, nine QCs of each concentration and nine LLOQs (lower limit of quantification) for each compound separately (UDCA, GUDCA, and TUDCA). The test was injected and reinjected. There was no change in the analytes’ retention times.
Validation of the analytical methodology
Selectivity
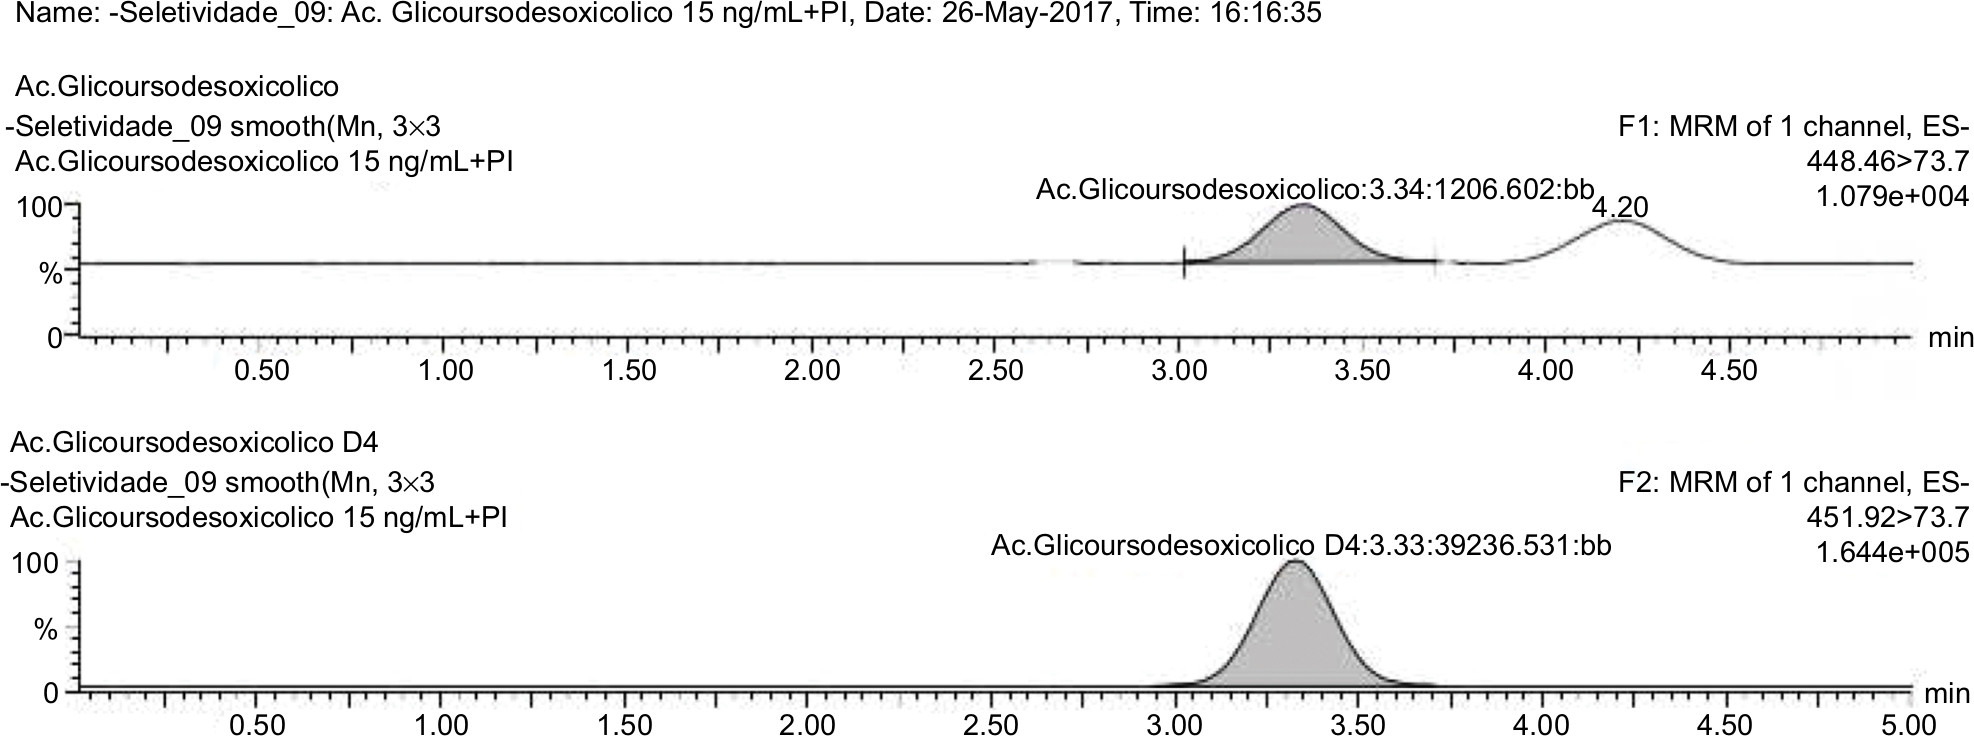
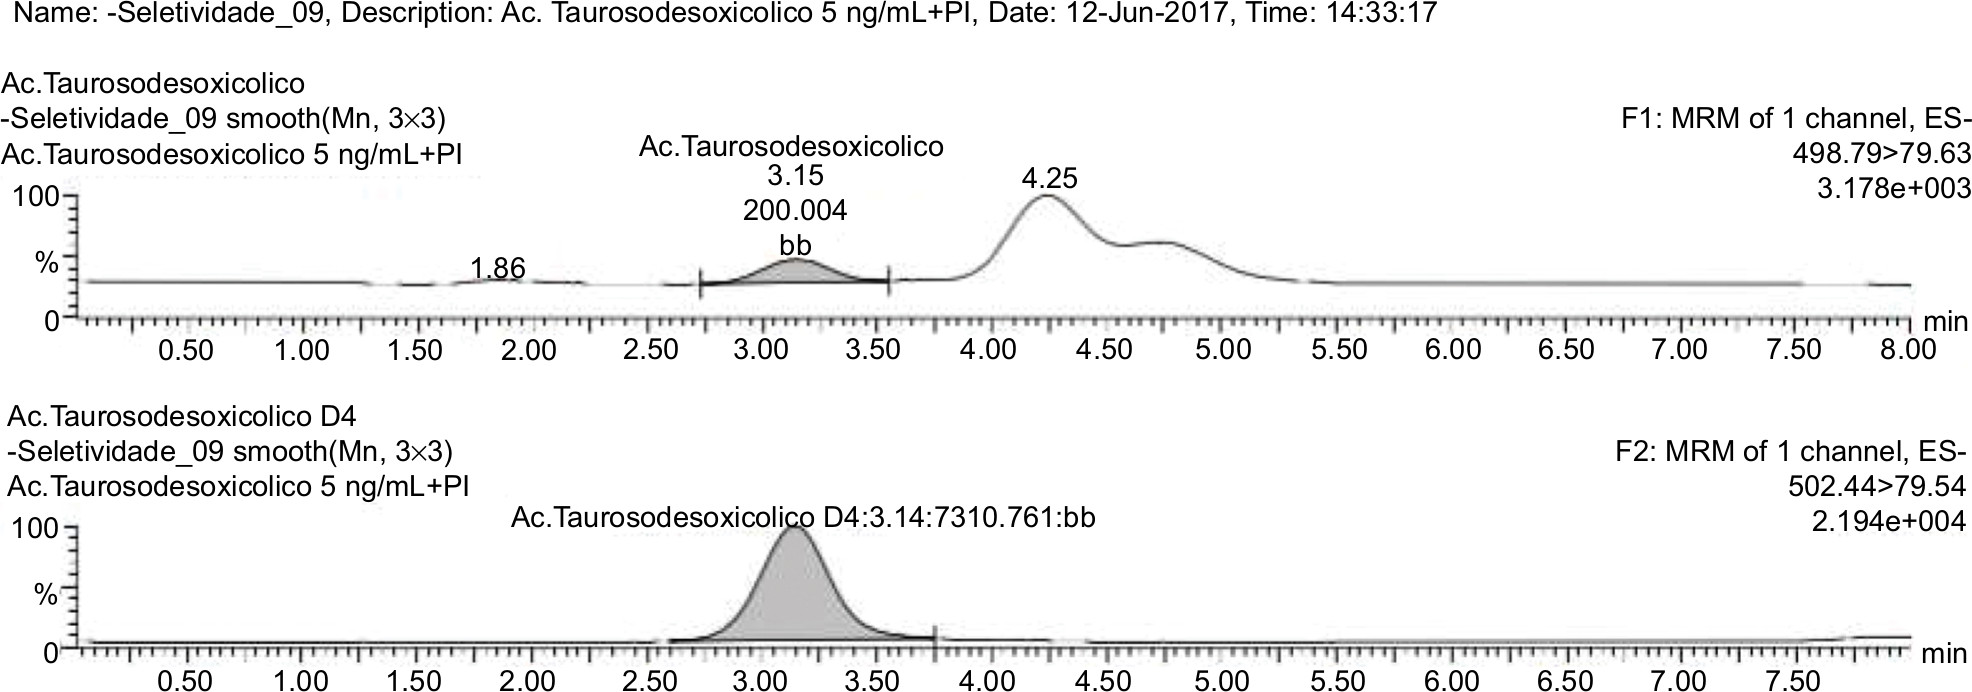
Selectivity is the ability of a method to differentiate and quantify the analyte and IS in the presence of other components of the sample. In this test, it is necessary to compare the biological matrix, obtained from different sources, to investigate interferents that may affect the selectivity of method. Thus, lipemic samples (with high lipid content) and hemolysate (containing lysed erythrocytes) must also be tested.15–17 To confirm the selectivity of the method, blank samples of human plasma obtained from six different individuals were analyzed, with four normal samples, one lipemic sample, and one hemolysed sample for each analyte.
The samples were tested using the extraction procedure and the chromatographic conditions developed to evaluate possible interferences in retention time of the drug and IS. The results were compared with those obtained with processed samples of LLOQ from each analyte (Figures 8–10).
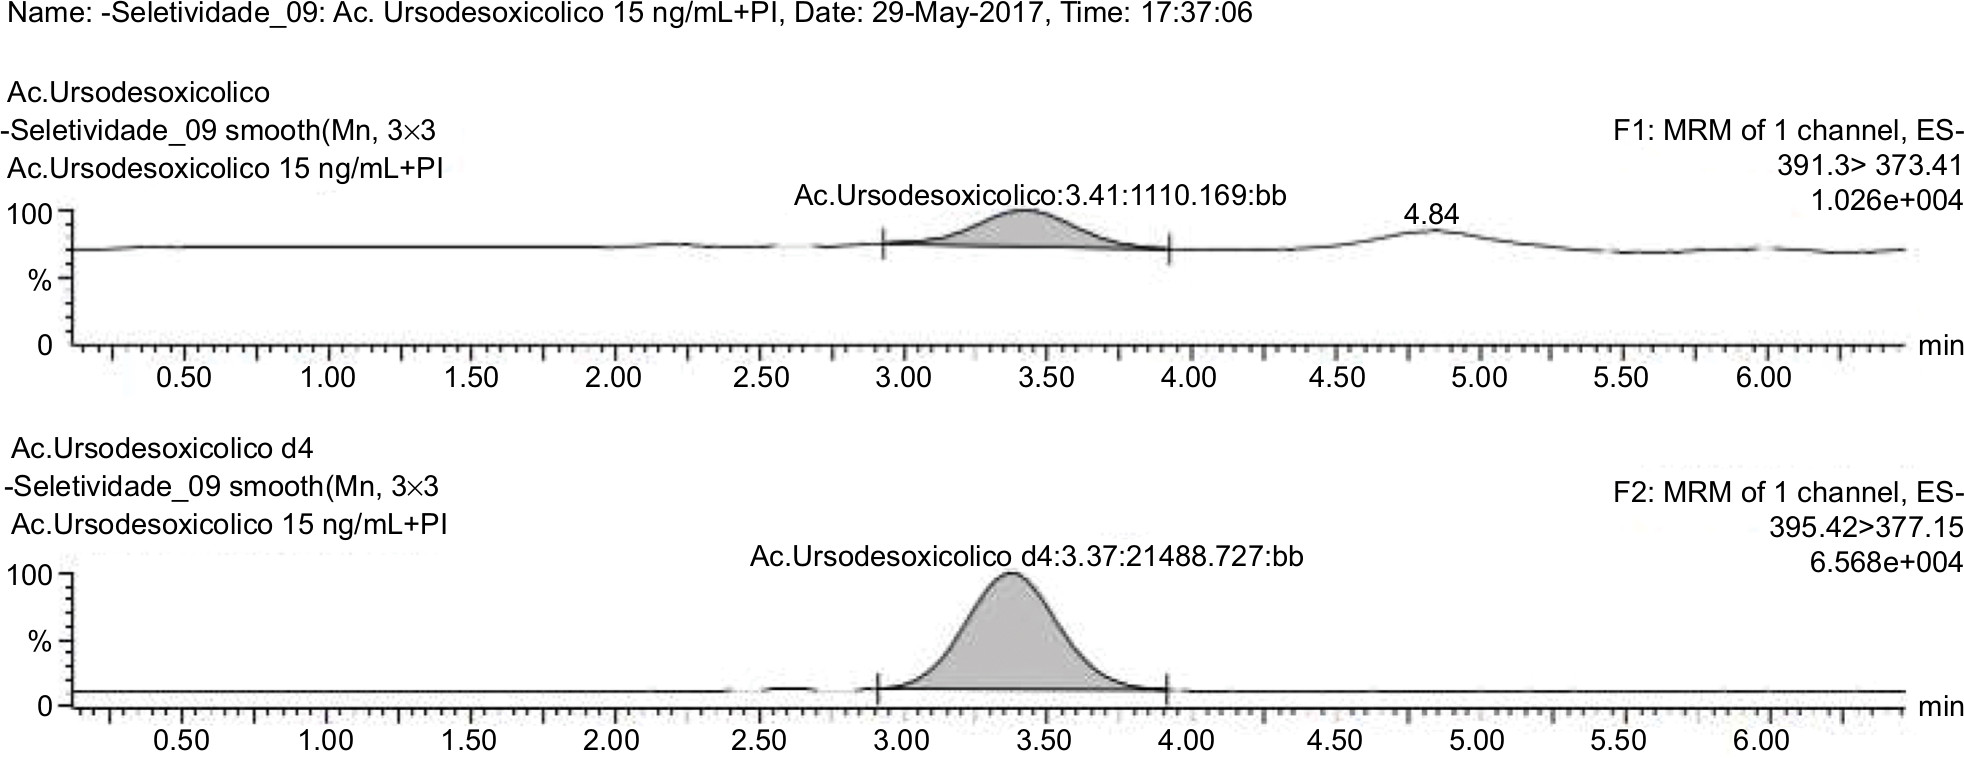 | Figure 8 Normal blank plasma PLS 76/2017 related to analyte and internal standard. |
 | Figure 9 Normal blank plasma PLS 65/2017 related to analyte and internal standard. |
 | Figure 10 Normal blank plasma PLS 388/2016 related to analyte and internal standard. |
The interfering peak responses near the retention time of the analyte should be less than 20% of the analyte response in the LLOQ samples and less than 5% of the IS response. As a result, there were no significant interfering responses at the retention times of analytes and IS, demonstrating the selectivity of the method in a biological matrix composed of human plasma.
Residual effect (carryover)
The residual effect, or carryover, is the effect generated by the appearance of or increase in the analyte or IS signal from contamination of previous samples. For that to be tested, it is necessary to consecutively inject a blank sample, a sample containing the analyte in the upper limit of quantification (ULOQ) concentration with IS, and then two blank samples.14 To evaluate whether there was any carryover effect, three injections of the same white sample were analyzed, with one made before and two soon after injection of the ULOQ sample.
Results were compared with those obtained in the LLOQ processed sample for each analyte.
The interfering peak responses near the retention time of the analyte should be less than 20% of the analyte response in the LLOQ samples and less than 5% of the IS response. As a result, there were no interfering responses at the retention time of the analytes and IS, ie, no residual effect was observed in the methods developed.
Matrix effect
Substances coeluted with the analyte, but undetected, may reduce or increase the signal intensity corresponding to the mass transition of that analyte, affecting precision, accuracy, robustness, selectivity, and sensitivity of the method. This is a phenomenon called matrix effect, and its determination in the development and validation stages is fundamental to ensure the reliability and selectivity of the method.18–21 Therefore, to evaluate whether there was a matrix effect, samples from eight different sources were analyzed (four normal, two lipemic, and two hemolysates), and analyte and IS were spiked at the same concentrations of lower and higher QC. The results were evaluated from the normalized matrix factor (NMF) calculation for the three analytes, respectively. The result showed that there was no significant interference of the plasma matrix.
Lower limit of quantification, linearity, precision, and accuracy
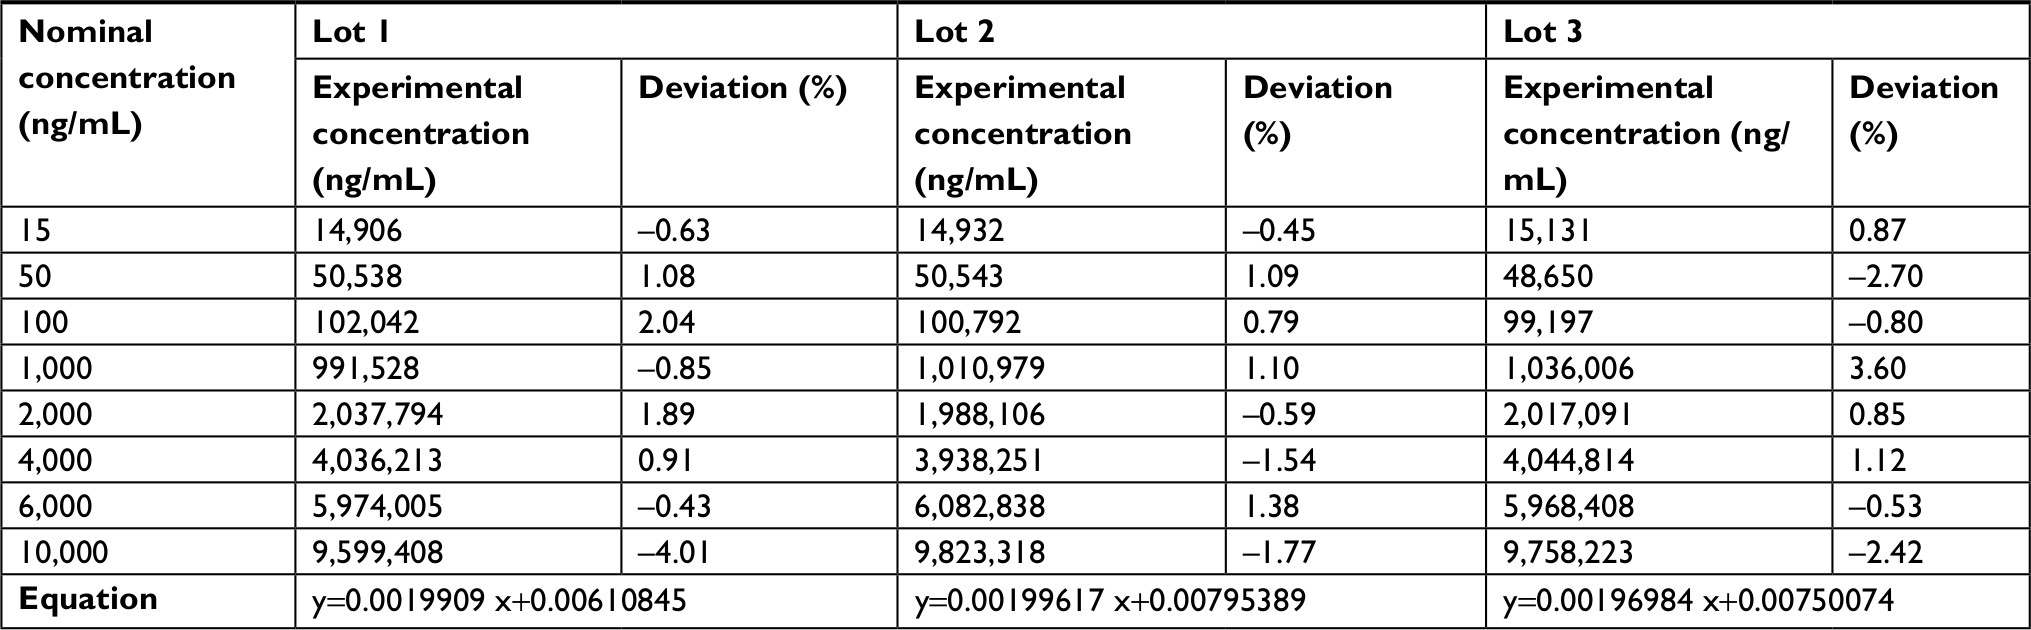
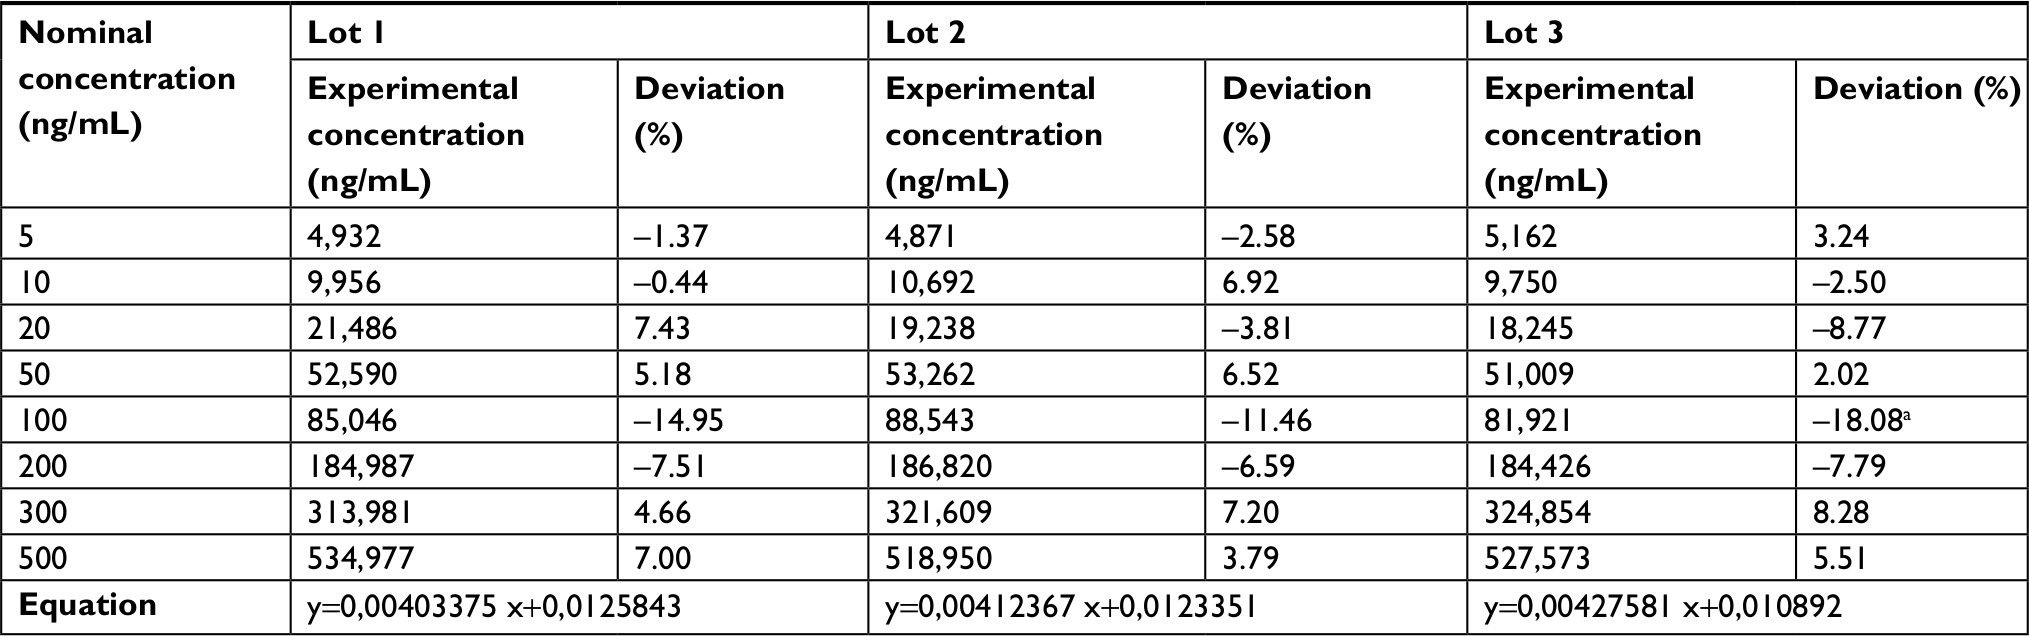
The established LLOQ was 15 ng/mL for UDCA and GUDCA and 5 ng/mL for TUDCA. A linear response for the peak area ratio (response) vs concentration in a range of 15–10,000 ng/mL for UDCA/GUDCA and 5–500 ng/mL for TUDCA (Tables 1–3, respectively), with a mean linear correlation coefficient of 0.9985 (n=8) or better must be evaluate. Intralot accuracy and precision were determined by the analysis of nine replicates of LLOQ, lower CQ, medium QC, higher QC, and a diluted QC in five levels of concentration extracted on the same day, while the inter-lot evaluation was determined by the analysis of three calibration curves with each one of those nine controls with at least two being on different days. The details of the results obtained in those tests are presented in Tables 4–6.
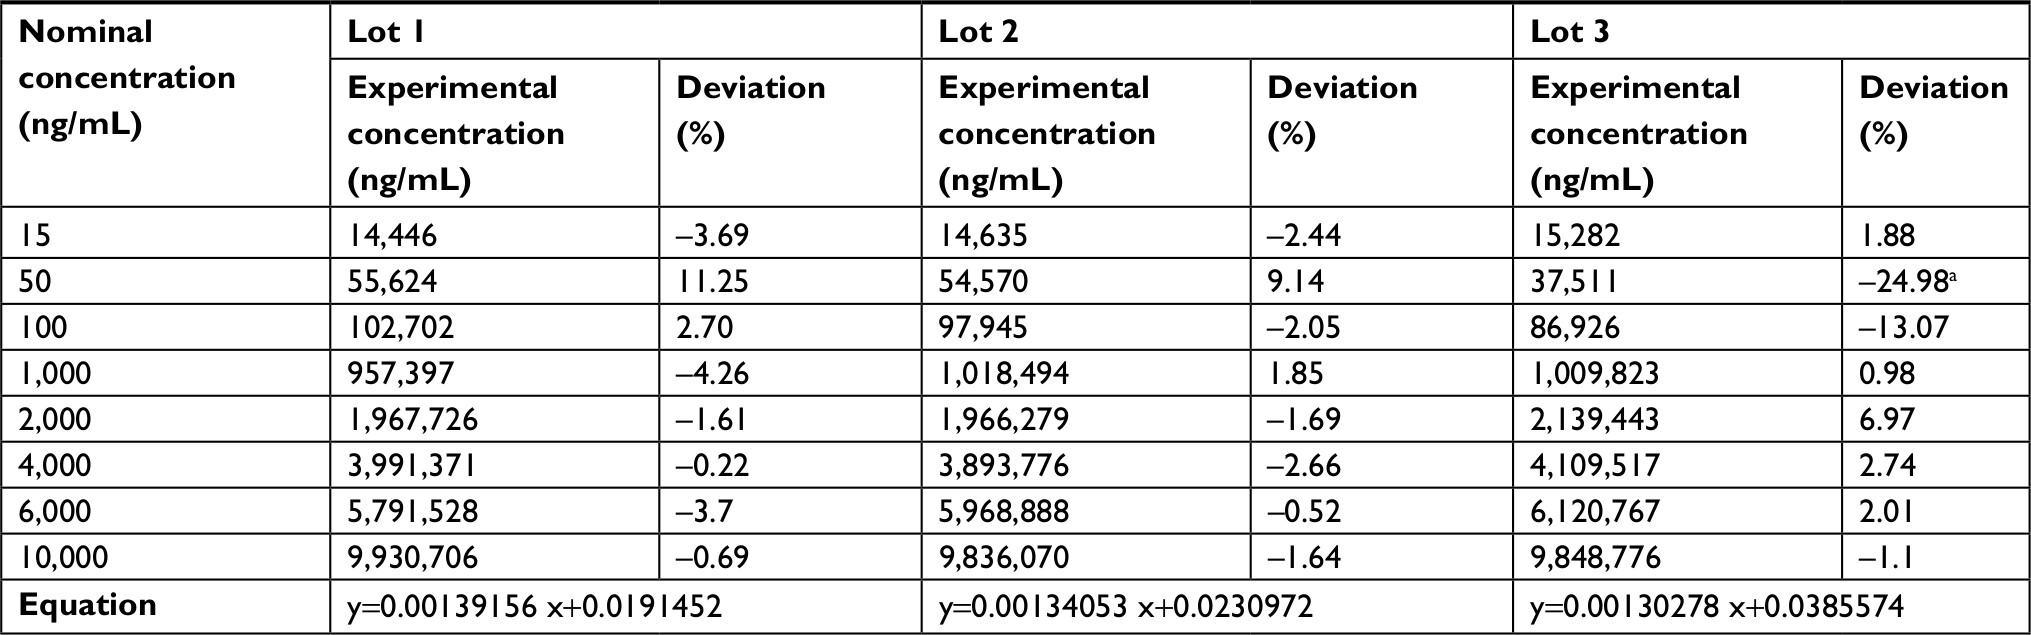 | Table 1 Ursodeoxycholic acid calibration curve data Note: aDeviations above the allowed limit of 15%, this value was not included in the calculation of the curve equation. |
 | Table 2 Glycoursodeoxycholic acid calibration curve data |
 | Table 3 Tauroursodeoxycholic acid calibration curve data Note: aDeviations above the allowed limit of 15%, this value was not included in the calculation of the curve equation. |
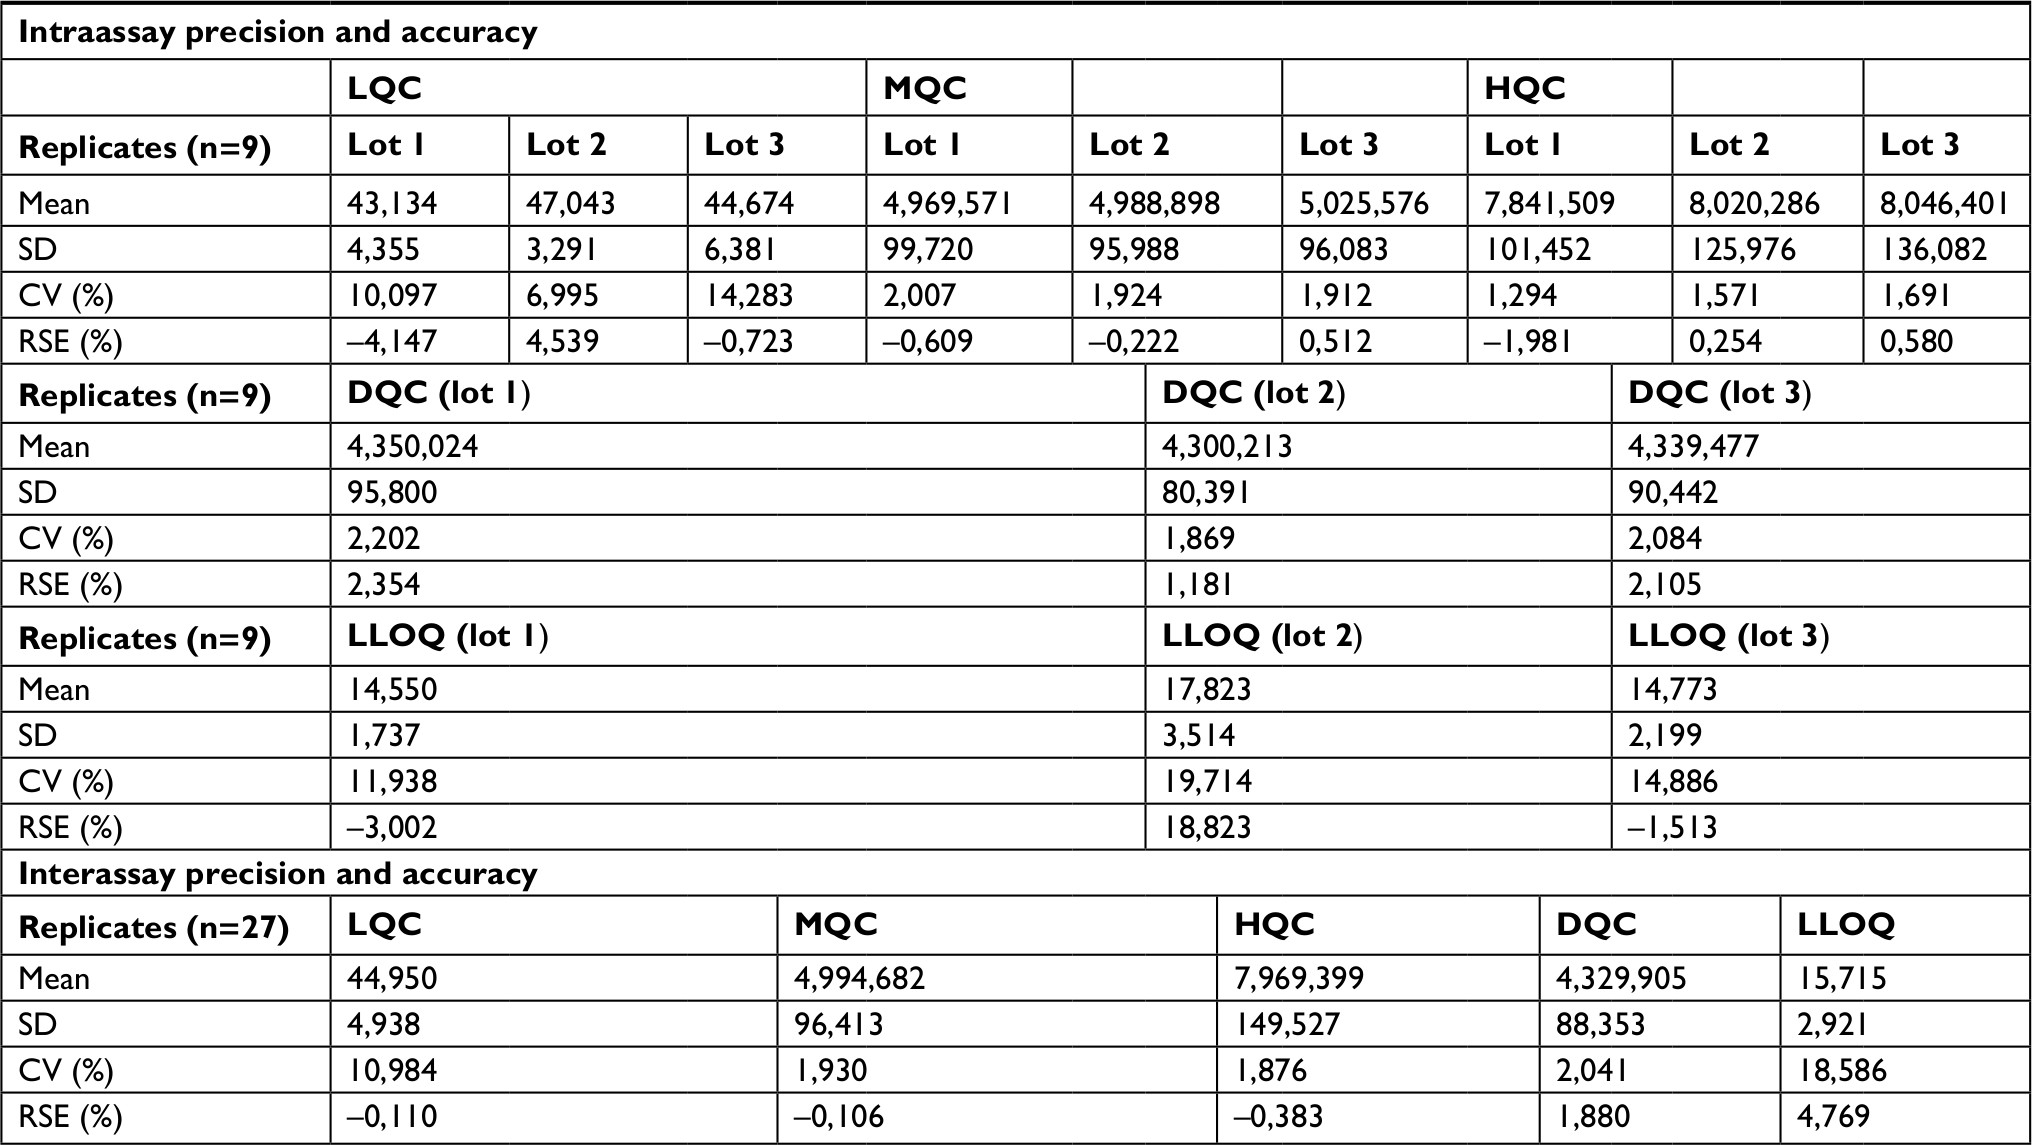 | Table 4 Intraassay and interassay analyses of UDCA Note: Nominal concentration: LQC=45 ng/mL, MQC=5,000 ng/mL, HQC=8,000 ng/mL, DQC=4,250 ng/mL (1:3), LLOQ=15 ng/mL. Abbreviations: CV, coefficient of variation; LLOQ, lower limit of quantification; RSE, relative standard error; UDCA, ursodeoxycholic acid; LQC, lower quality control; MQC, medium quality control; HQC, high quality control; DQC, dilution quality control; LLOQ, lower limit of quantification. |
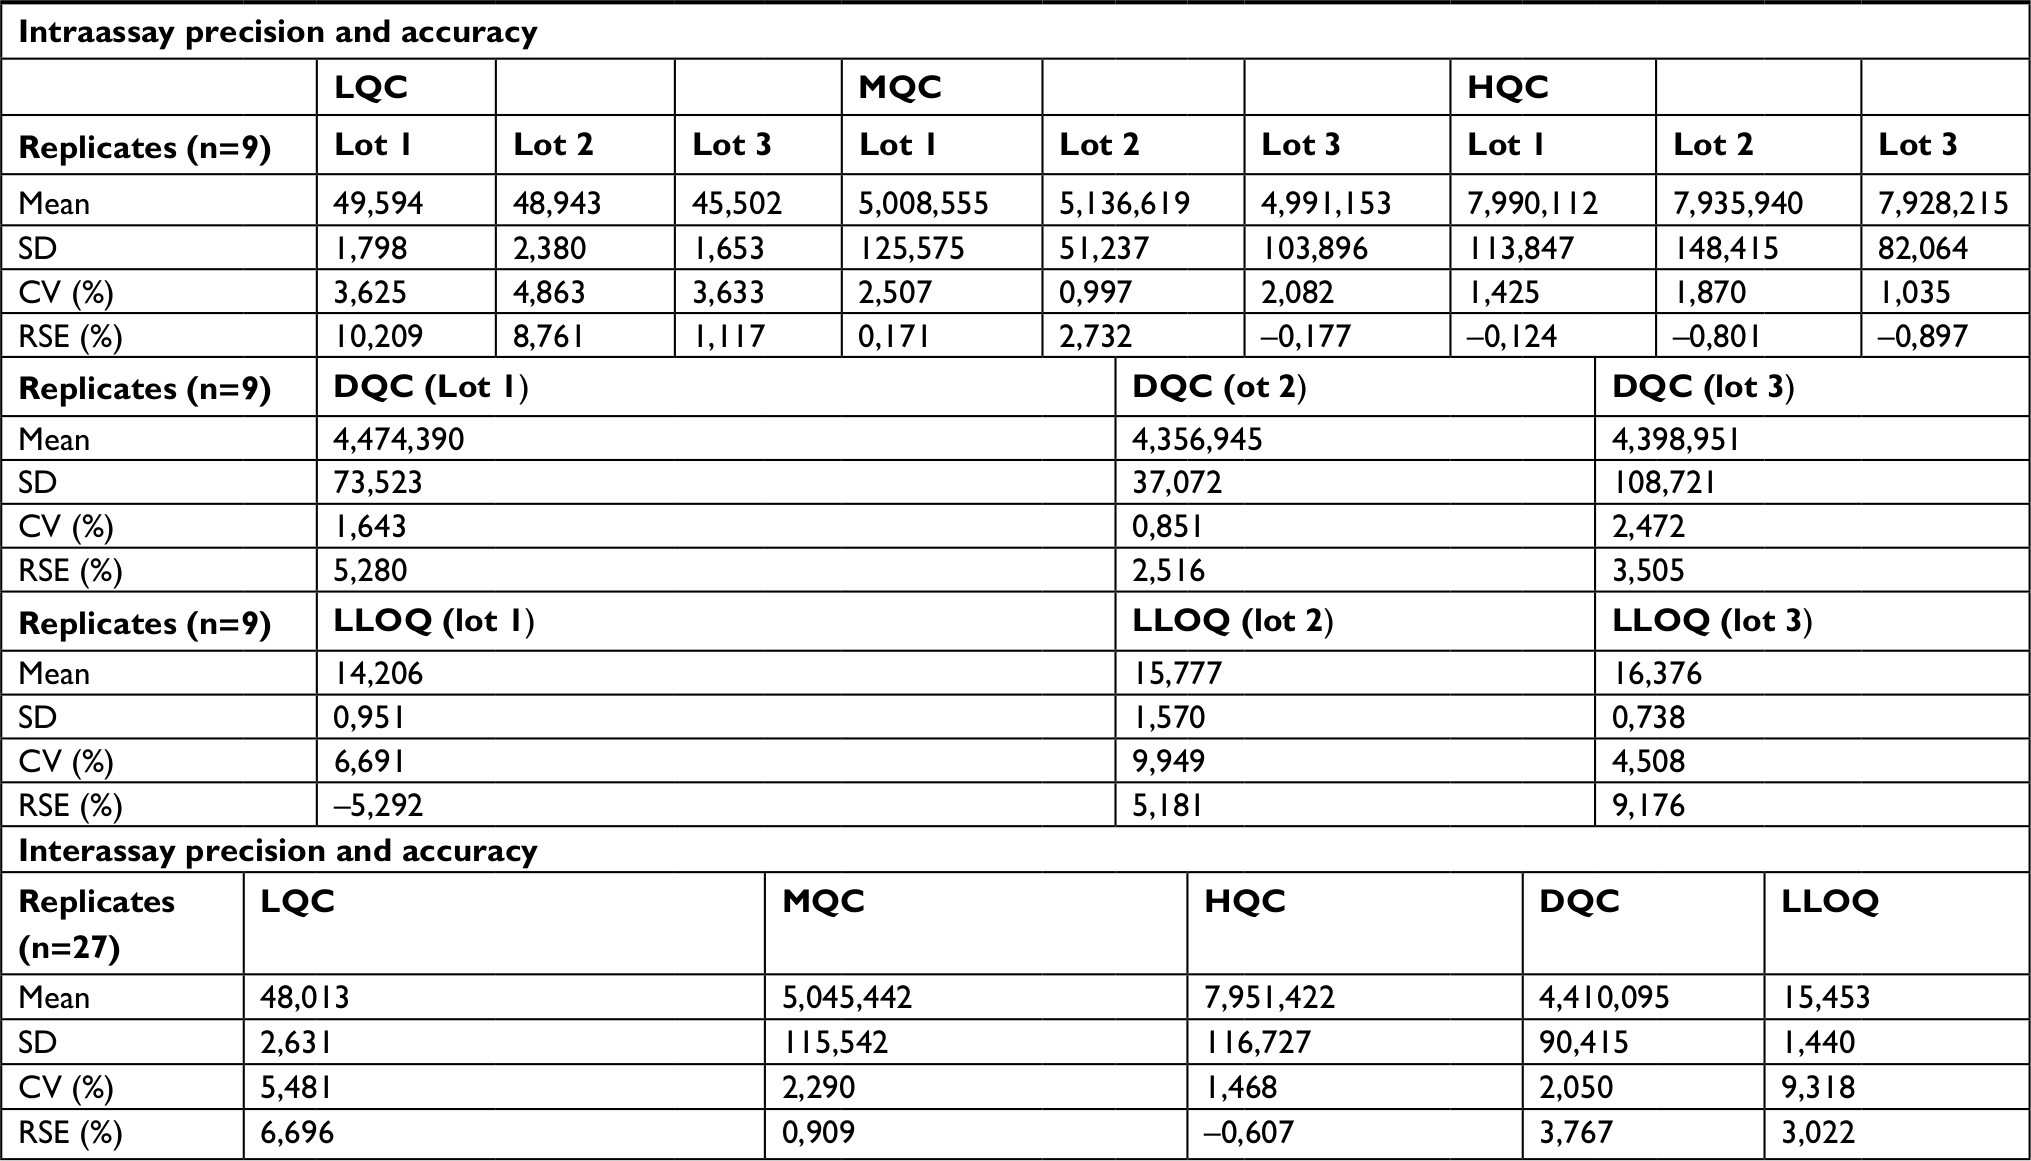 | Table 5 Intraassay and interassay analyses of GUDCA Note: Nominal concentration: LQC=15 ng/mL, MQC=250 ng/mL, HQC=400 ng/mL, DQC=212,5 ng/mL (1:3), LLOQ=5 ng/mL. Abbreviations: CV, coefficient of variation; GUDCA, glycoursodeoxycholic acid; LLOQ, lower limit of quantification; RSE, relative standard error; LQC, lower quality control; MQC, medium quality control; HQC, high quality control; DQC, dilution quality control. |
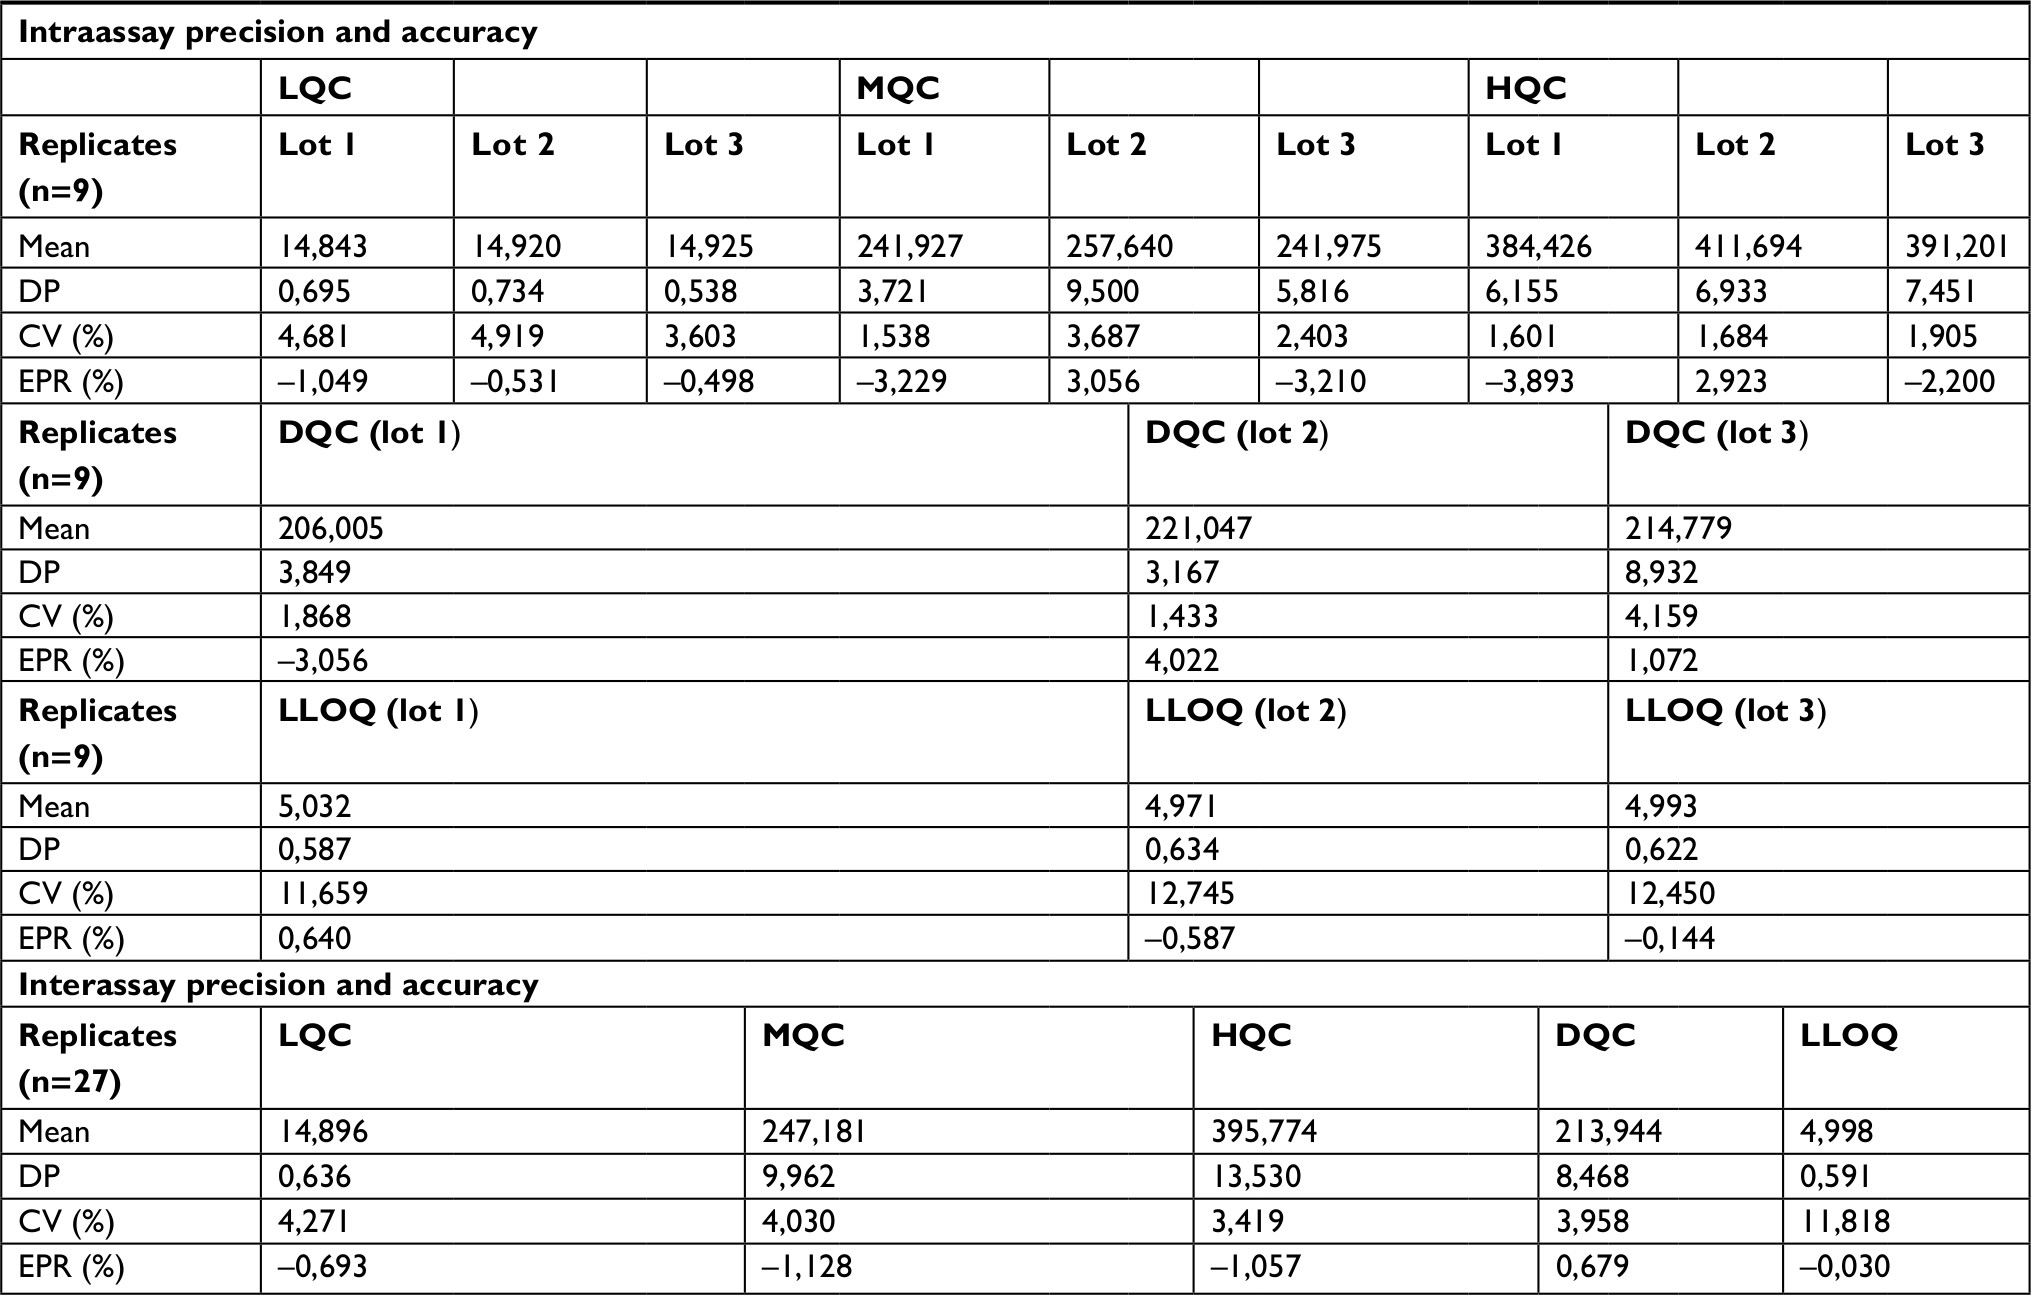 | Table 6 Intraassay and interassay analyses of TUDCA Note: Nominal concentration: LQC=45 ng/mL, MQC=5,000 ng/mL, HQC=8,000 ng/mL, DQC=4,250 ng/mL (1:3), LLOQ =15 ng/mL. Abbreviations: CV, coefficient of variation; LLOQ, lower limit of quantification; RSE, relative standard error; TUDCA, tauroursodeoxycholic acid; LQC, lower quality control; MQC, medium quality control; HQC, high quality control; DQC, dilution quality control. |
The samples considered as reinjected were those that were quantified more than once. The validation of reinjection aims to evaluate the validity of this procedure, when necessary.
The validation of the reinjection for each analyte was demonstrated through the results obtained during the precision and accuracy test, where the mean values for each QC (lower quality control [LQC], medium quality control [MQC], and high quality control [HQC]) of the reinjection were evaluated in relation to the means obtained for the samples of the first injection. No deviation above 15% was observed among them.
Stability
The stability of the UDCA, GUDCA, and TUDCA plasma samples was determined in the conditions of use and storage: top-bench, autosampler, freeze–thaw, and long term. The solutions used were also evaluated in the top-bench conditions (room temperature) and in refrigerator conditions. Initially, a calibration curve and samples at lower QC and higher QC concentrations were spiked, extracted, quantified, freshly prepared, and evaluated according to the acceptance criteria of 15% in comparison to the nominal value of each concentration (this criterion was applied to other stabilities, except for solution). After acceptance, the samples are suitable for determining other stabilities. Thus, a fraction of those spiked plasma QCs used in the initial assay was kept on the bench at controlled room temperature (18°C–24°C) for a period of 20 hours and 50 minutes for UDCA, 20 hours and 15 minutes for GUDCA, and 23 hours and 20 minutes for TUDCA. All of them remained stable during the period according to the previously established criterion. The processed samples were kept at autosampler (approximately 22°C), and each QC sample was analyzed in six replicates initially (at zero time) and after 24 hours for the three analytes. The results showed that they remained stable during that period. The spiked samples were also used for the freezing and thawing process in three cycles for each analyte at –20°C. After comparing the results, it was observed that they remained stable after the process.
The long-term stability of the stored (–20°C) spiked human plasma samples was evaluated for each analyte after 133 days (UDCA), 154 days (GUDCA), and 119 days (TUDCA). Comparing the variations between the lower QC and higher QC means from the stored samples in relation to the nominal value, the analyzed compounds remained stable during that period, since the deviations found were in alignment with the established criteria.
Stability analyses were carried out with a primary solution of higher concentration and a work solution of lower concentration for each analyte and its respective IS. The results were evaluated comparing the individual areas of analyte and the individual areas of IS. Comparing the mean values of analyte and IS responses for the solutions analyzed after 25:40 hours (UDCA/UDCA D4), 24:40 hours (GUDCA/GUDCA D4), and 22:00 hours (TUDCA/TUDCA D4) maintained at room temperature and samples analyzed after 29, 18, and 26 days kept under refrigeration, for each analyte and its IS, respectively, with the means obtained from freshly prepared solutions, it can be concluded that the solutions were stable, since the deviations found were less than 10%.
Conclusion
After all those tests, it was concluded that the analytical method was successfully developed and validated, since it did not present matrix effect and residual effect, proving to be selective for the molecules under study, with adequate accuracy and precision. Accordingly, the method was sensitive, having a coefficient of variation less than 20% for the LLOQ of each compound. In this way, the method can be applied in bioequivalence studies to determine ursodiol and its metabolites in a reproducible, simple, and effective way.
Author contributions
MCP, DCB, ACdO, CML, and SACC made equal contributions to the design and implementation of the research, to the analysis of the results, and to the writing of this manuscript. All authors contributed to data analysis, drafting and revising the article, gave final approval of the version to be published, and agree to be accountable for all aspects of the work.
Disclosure
The authors report no conflicts of interest in this work.
References
The ALSUntangled Group. ALSUntangled no. 25: ursodiol. Amyotroph Lateral Scler Frontotemporal Degener. 2014;15(5–6):475–478. | ||
Tonin F, Arends I. Latest development in the synthesis of ursodeoxycholic acid (UDCA): a critical review. Beilstein J Org Chem. 2018;14:470–483. | ||
Tessier E, Neirinck L, Zhu Z. High-performance liquid chromatographic mass spectrometric method for the determination of ursodeoxycholic acid and its glycine and taurine conjugates in human plasma. J Chromatogr B Analyt Technol Biomed Life Sci. 2003;798(2):295–302. | ||
Ursacol® [Package Insert]. Santana do Parnaíba, SP (Brazil): CHIESI Pharma Inc, Zambom Lab Pharma Inc; 2015. | ||
URSO 250® and URSO Forte® [Package Insert]. Bridgewater, NJ: Aptalis Pharma US, Inc; 2013. | ||
Ko WK, Kim SJ, Jo MJ, et al. Ursodeoxycholic acid inhibits inflammatory responses and promotes functional recovery after spinal cord injury in rats. Mol Neurobiol. Epub 2018 Mar 20. | ||
Thakare R, Alamoudi JA, Gautam N, Rodrigues AD, Alnouti Y. Species differences in bile acids II. Bile acid metabolism. J Appl Toxicol. 2018;38(10):1336–1352. | ||
Horkovics-Kovats S, Ulč I, Vít L, Němec B, Rada V. Physicochemical pharmacokinetics as an optimization tool for generic development: A case study. Eur J Pharm Sci. 2018;111:349–357. | ||
Abdel-Ghaffar A, Ghanem HM, Ahmed EK, Hassanin OA, Mohamed RG. Ursodeoxycholic acid suppresses the formation of fructose/streptozotocin-induced diabetic cataract in rats. Fundam Clin Pharmacol. 2018;32(6):627–640. | ||
Mroz MS, Lajczak NK, Goggins BJ, Keely S, Keely SJ. The bile acids, deoxycholic acid and ursodeoxycholic acid, regulate colonic epithelial wound healing. Am J Physiol Gastrointest Liver Physiol. 2018;314(3):G378–G387. | ||
Shima KR, Ota T, Kato KI, et al. Ursodeoxycholic acid potentiates dipeptidyl peptidase-4 inhibitor sitagliptin by enhancing glucagon-like peptide-1 secretion in patients with type 2 diabetes and chronic liver disease: a pilot randomized controlled and add-on study. BMJ Open Diabetes Res Care. 2018;6(1):e000469. | ||
Pataia V, Papacleovoulou G, Nikolova V, et al. Paternal cholestasis exacerbates obesity-associated hypertension in male offspring but is prevented by paternal ursodeoxycholic acid treatment. Int J Obes. Epub 2018 May 24. | ||
Sundd Singh S, Shah H, Gupta S, et al. Validation of LC/MS electrospray ionisation method for the estimation of ursodiol in human plasma and its application in bioequivalence study. Ann Chim. 2004;94(12):951–959. | ||
BRAZIL. National Health Surveillance Agency. Resolution RDC n. 27, dated May 17, 2012. Provides the minimum requirements for the validation of bioanalytical methods used in studies for registration and post-registration of drugs. Official Gazette of the Federative Republic of Brazil, Brasília, May 2012. | ||
BRAZIL. National Health Surveillance Agency. RE n. 899, dated May 29 2003. Guide for validation of Bioanalytical and Analytical Methods. Official Gazette of the Federative Republic of Brazil, Brasília, June 2003. | ||
BRASIL. National Health Surveillance Agency. Manual of Good Practices for Bioequivalence and Bioavailability. Brasília; 2002. | ||
FDA. Guidance for Industry, Bioanalytical Method Validation, US Department of Health and Human Services, Food and Drug Administration, Centre for Drug Evaluation and Research (CDER). 2013. | ||
Matuszewski BK, Constanzer ML, Chavez-Eng CM. Strategies for the assessment of matrix effect in quantitative bioanalytical methods based on HPLC-MS/MS. Anal Chem. 2003;75(13):3019–3030. | ||
Kushnir MM, Rockwood AL, Nelson GJ, Yue B, Urry FM. Assessing analytical specificity in quantitative analysis using tandem mass spectrometry. Clin Biochem. 2005;38(4):319–327. | ||
Chambers E, Wagrowski-Diehl DM, Lu Z, Mazzeo JR. Systematic and comprehensive strategy for reducing matrix effects in LC/MS/MS analyses. J Chromatogr B Analyt Technol Biomed Life Sci. 2007;852(1–2):22–34. | ||
Sennbro CJ, Knutsson M, van Amsterdam P, Timmerman P. Anticoagulant counter ion impact on bioanalytical LC-MS/MS assays: results from discussions and experiments within the European Bioanalysis Forum. Bioanalysis. 2011;3(21):2393–2399. |
 © 2019 The Author(s). This work is published and licensed by Dove Medical Press Limited. The full terms of this license are available at https://www.dovepress.com/terms.php and incorporate the Creative Commons Attribution - Non Commercial (unported, v3.0) License.
By accessing the work you hereby accept the Terms. Non-commercial uses of the work are permitted without any further permission from Dove Medical Press Limited, provided the work is properly attributed. For permission for commercial use of this work, please see paragraphs 4.2 and 5 of our Terms.
© 2019 The Author(s). This work is published and licensed by Dove Medical Press Limited. The full terms of this license are available at https://www.dovepress.com/terms.php and incorporate the Creative Commons Attribution - Non Commercial (unported, v3.0) License.
By accessing the work you hereby accept the Terms. Non-commercial uses of the work are permitted without any further permission from Dove Medical Press Limited, provided the work is properly attributed. For permission for commercial use of this work, please see paragraphs 4.2 and 5 of our Terms.