")
Back to Journals » Drug Design, Development and Therapy » Volume 15
Method Development and Validation for Measuring O6-Methylguanine in Dried Blood Spot Using Ultra High-Performance Liquid Chromatography Tandem Mass Spectrometry
Authors Harahap Y , Vianney AM, Suryadi H
Received 2 December 2020
Accepted for publication 14 January 2021
Published 3 March 2021 Volume 2021:15 Pages 963—971
DOI https://doi.org/10.2147/DDDT.S283775
Checked for plagiarism Yes
Review by Single anonymous peer review
Peer reviewer comments 2
Editor who approved publication: Dr Tuo Deng
Yahdiana Harahap,1,2 Aurelia Maria Vianney,1 Herman Suryadi1
1Faculty of Pharmacy, Universitas Indonesia, Depok, West Java, 16424, Indonesia; 2Indonesia Defense University, Bogor, 16810, West Java, Indonesia
Correspondence: Yahdiana Harahap Email [email protected]
Background: Cyclophosphamide is a nitrogen mustard chemotherapy drug that damages DNA through alkylation in the DNA base and produces DNA adducts. Alkylation that occurs in the N7 position of guanine base has a cytotoxic effect which is useful for cancer therapy. However, the alkylation that occurs in the O6 position of guanine bases can have mutagenic and carcinogenic effects that can trigger secondary cancer. This carcinogenic compound can be found in very low concentrations in cancer patients who had been receiving alkylating agents as their anticancer therapy. Analysis of O6-methylguanine can be one of the ways of therapeutic drug monitoring to avoid secondary cancer risk. This study aims to develop a sensitive, selective, and validated analytical method using Ultra-High-Performance Liquid Chromatography-Tandem Mass Spectrometry (UPLC-MS/MS).
Methods: Analysis of O6-methylguanine was done in Dried Blood Spot (DBS) and using allopurinol as an internal standard. The optimal analysis conditions were obtained using a C18 Acquity® Bridged Ethylene Hybrid (BEH) column (1.7 μm, 100 mm x 2.1 mm); mobile phase was 0.05% formic acid - acetonitrile (95:5 v/v); flow rate 0.1 mL/minute; gradient elution for 6 minutes; and detection at m/z 165.95 > 149 for O6-methylguanine and m/z 136.9 > 110 for allopurinol.
Results: The present study has fulfilled the FDA validation parameter requirements. The method provides rapid, sensitive, and selective analysis of O6-methylguanine using UPLC-MS/MS with a linear concentration range between 0.5– 20 ng/mL.
Keywords: cyclophosphamide, DNA adduct, O6-methylguanine, UPLC-MS/MS, dried blood spot
Introduction
Cyclophosphamide is a cytotoxic drug that is used for the treatment of many solid and hematologic neoplasms.1 It can be used for single or combination therapy for various indications such as malignant lymphoma, acute and chronic lymphatic leukemia, solid tumors such as breast cancer, or as immunosuppressants. Cyclophosphamide therapy can cause severe side effects such as anemia, leukocytopenia, and thrombocytopenia, gonadal toxicity, and can even cause secondary tumor development.2 It is also classified as a group 1 carcinogen compound (carcinogen in humans) by the IARC.3
Cyclophosphamide belongs to the group of nitrogen mustard which is a bifunctional alkylating agent that damages DNA and form DNA adduct.4 Alkylation of DNA bases gives rise to the mutagenicity and carcinogenicity of the cyclophosphamide, especially in the O6-guanine and N7-guanine positions. Alkylation in these positions causes crosslinks which indicate cytotoxic properties.5 The formation of DNA adducts is the initial step in the process of carcinogenic effects. Therefore, a method is needed to analyze DNA adduct from cyclophosphamide especially O6-methylguanine as a secondary cancer risk biomarker.
This study uses Dried Blood Spot samples for analysis. Dried Blood Spot is one of the biosampling techniques that was done using finger prick and the blood was collected to fill a premarked circle on a filter paper.6 Compared to previous studies that used venipuncture for blood sampling,7 DBS method is less invasive and only requires a small amount of blood thereby increasing patient comfort.8 In addition, the stability of the sample is better when using the DBS method compared to blood from veins.9
In this study, the development and validation of the analytical method were carried out using UPLC-MS/MS with allopurinol as the internal standard. This study aims to obtain the optimum and validated analytical method for measuring O6-methylguanine in Dried Blood Spot samples using Ultra-High-Performance Liquid Chromatography-Tandem Mass Spectrometry. Validation of this analytical method refers to the Food and Drug Administration, 2018.10 This research is expected to be useful for the implementation of drug therapy monitoring especially cyclophosphamide drug therapy.
Materials and Methods
Chemical and Reagents
O6-methylguanine, N7-methylguanine, adenine, and guanine were purchased from Sigma Aldrich (St. Louis, MO, USA). Internal Standard Allopurinol was obtained from Jiangsu Yew Pharm (Yixing, China). Reagents such as formic acid, acetic acid, methanol, ethanol, and acetonitrile were purchased from Merck Co. Ltd. (Darmstadt, Germany). Ultrapure water from Sartorius Water Filter System. Human blood was obtained from The Indonesian Red Cross (Jakarta, Indonesia). Perkin Elmer 226 paper from Perkin Elmer (Waltham, USA). The reagents for the DNA Isolation are Proteinase K, Buffer AL, Buffer AW1, Buffer AW2, and Buffer AE (QIAamp DNA Mini Kits, QIAGEN).
Preparation of Stock and Working Standard Solution
A stock solution of O6-methylguanine and allopurinol was prepared at 1.0 mg/mL by diluting them in methanol. A series of working standard solutions at appropriate concentration levels were obtained via diluting each standard solution with water containing 0.5% (v/v) formic acid. Calibration samples were prepared by diluting a working solution using whole blood to obtain a calibration range of 0.5–20 ng/mL. Quality control samples were prepared at 1.5 ng/mL (QCL), 10 ng/mL (QCM), and 15 ng/mL (QCH) for O6-methylguanine by diluting working solution in whole blood.
UPLC-MS/MS Conditions
The research was performed on an ACQUITYTM UPLC system (Waters Corp., Milford, MA, USA) and a Xevo TQD Triple Quadrupole mass spectrometer (Waters Corp., Manchester, UK) equipped with positive electrospray ionization (ESI+). All data were acquired in centroid mode by the MassLynxTMNT4.1 software and analyzed by the QuanLynxTM program (Waters Corp., Milford, MA, USA). The analyte was separated on the Acquity® UPLC BEH C18 column (1.7 µm, 100 mm x 2.1 mm, Waters Corp., Milford, MA, USA). The mobile phase was 0.05% formic acid solution and acetonitrile; flow rate 0.1 mL/min; autosampler temperature at 8°C; and the injection volume was 10 µL. The gradient elution was used for 6 minutes and shown in Table 1.
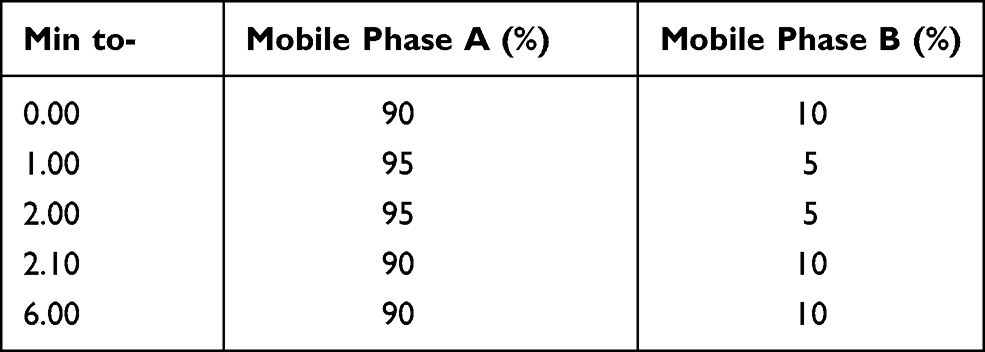 |
Table 2 The Second Gradient Elution Profile |
The mass spectrometric detector parameters were optimized and set as follows: capillary voltage of 3.50 kV, nitrogen desolvation temperature as 349°C with a flow rate of 643 L/h, column temperature of 40°C, and degasser pressure of 0.69 psi. The cone voltage was 32 V for O6-methylguanine, 38 V for N7-methylguanine, 40 V for adenine, 35 V for guanine, and 35 V for allopurinol as IS. The detector was performed in positive ion mode obtained by positive mode of electrospray ionization (ESI+) technique and quantification was acquired with multiple reaction monitoring (MRM) with ion transition at 165.95 → 149 and 165.95 → 134 for O6-methylguanine, m/z 165.95 → 149 and 165.95 → 124 for N7-methylguanine, m/z 135.9 → 118.95 for adenine, m/z 151.9 → 134.95 for guanine and m/z 136.9 → 110 for allopurinol as IS.
Preparation of Sample in Dried Blood Spot
Blood samples were obtained from The Indonesian Red Cross (Jakarta, Indonesia) and were reviewed and approved by the Research Ethics Committees of “Dharmais” Cancer Hospital, Jakarta 11420, Indonesia (No.023/KEPK/II/2020). Calibration and quality control samples were prepared by pipetting 50 μL of whole blood containing O6-methylguanine onto the Perkin Elmer 226 paper and dried at room temperature for 2 h. DBS discs were cut and inserted into a microtube. The IS solution, allopurinol, is made to a concentration of 1 μg/mL and 20 μL was added. Then, the sample was extracted using the QIAamp DNA Mini Kit. DNA extraction procedures refer to the QIAamp DNA Mini and Blood Mini Handbook11 as follows:
- Dried Blood Spot sample in a 1.5 mL microcentrifugation tube was added 180 µL of the ATL buffer and incubated at 85°C. Then, 20 µL of proteinase K solution was added and incubated at 56°C. After that, 200 µL of the AL buffer was added to the sample and incubated at 70°C.
- Samples were added with 200 µL ethanol (96–100%) and the mixture is carefully transferred into the QIAamp mini spin column. QIAamp mini spin column was used in this extraction consisted of a designed silica layer that can trap the DNA on it when centrifuged.
- Then, AW1 and AW2 buffer was added to separate protein from DNA, therefore it increased the purity of DNA.
- Finally, the DNA on the silica layer was eluted using AE buffer and incubated at room temperature. The results of DNA extraction can be stored at −20°C.
The DNA solution was mixed with the same amount of ultrapure water and 90% formic acid. Then, the solution is heated at 85°C for 60 minutes. After that, the solution is cooled to room temperature and ready to be injected into UPLC-MS/MS.
Method Validation
Validation of this analytical method was assessed including Lower Limit of Quantification (LLOQ), calibration curve, selectivity, accuracy and precision, recovery, carryover, dilution integrity, matrix effect, and stability according to the Food and Drug Administration (FDA)Bioanalytical Method Validation Guidance for Industry.10
Lower Limit of Quantification
LLOQ was determined using blank samples and the lowest concentration of analytes in samples that can still be analyzed quantitatively. The analyte response on LLOQ must be 5 times greater than the analyte response on the blank sample. The accuracy and precision of the analyte response should be less than ± 20%.
Calibration Curve
The calibration curve was tested using standard solutions that are prepared on the same biological matrix as the study samples including blank samples, zero calibrator, and at least 6 other concentration points. The calibration curve acceptance criteria are that the analyte concentration is not more than ± 15% at all concentrations other than LLOQ and the analyte concentration is not more than ± 20% at LLOQ concentration. At least 75% of the calibration standards with a minimum of 6 concentrations must meet these requirements.
Selectivity
The selectivity of the analytical method was evaluated using blank and LLOQ concentration. The requirement for selectivity is the peak response area of the analyte in the blank matrix obtained no more than ± 20% of the LLOQ peak area and no more than 5% in the internal standard.
Accuracy and Precision
Accuracy and precision were evaluated by assessing repeat analysis at four concentration levels in the measurement range, namely, LLOQ, QCL, QCM, and QCH over three consecutive days. The accuracy (%diff) and precision (%CV) should be within ± 20% for LLOQ and should be within ± 15% for QC samples.
Recovery
The recovery values were obtained at three QC levels (QCL, QCM, and QCH) by comparing the results of extracted samples with spiked post-extraction samples. Recovery values (%) do not have to be 100%, but the analytical, and standard recovery must be consistent and reproducible.
Carryover
Carryover was evaluated by injecting blank samples after samples with high concentrations or calibration standards at the upper limit of quantification (ULOQ). Carryover should not be greater than 20% of the analyte response at the lower limit of quantification (LLOQ) concentration and not greater than 5% for the internal standard.
Dilution Integrity
The dilution integrity was assessed by mixing the matrix with the analyte at the concentration above the ULOQ and diluting the sample with a blank matrix. The dilution integrity is stated to meet the requirements if the accuracy and precision are not more than ± 15%.
Matrix Effect
Matrix effect was evaluated at QCL and QCH by comparing the results of spiked post-extraction samples and standard solutions containing analyte at equivalent concentrations. The coefficient of variation (%CV) of the matrix effect should not greater than ±15%. The standardized matrix factor values with the internal standard should obtain the acceptance range of 0.8 to 1.2.12
Stability
The stability tested includes stock solution stability, autosampler stability, short-term stability, and long-term stability. Stock solution stability of O6-methylguanine and allopurinol was evaluated in the short term at room temperature and long term at −4°C. The %diff value of the stock solution stability test should not exceed ±10%.13 The other stability test was evaluated using QCL and QCH concentration. Autosampler stability was tested at autosampler temperature, short-term stability at room temperature, and long-term stability was tested at the freezer −20°C. The accuracy (%diff) and %CV at each level should not exceed ±15%.
Results and Discussion
Highly sensitive and selective analytical method is needed for the determination of DNA adduct because it is generally found in a very small level. Therefore, this study used UPLC-MS/MS as the instrument chosen. The UPLC-MS/MS is considered as the best choice for supporting bioanalytical studies due to high sensitivity, selectivity, and rapidity.
Method Development
Optimization of Mass Condition
Mass spectrometric conditions were tuned in positive ionization mode related to analyte basic properties. The chemical structure is shown in Figure 1. The spectra showed a high-intensity signal at m/z 165.95 → 149 and 165.95 → 134 for O6-methylguanine, m/z 165.95 → 149 and 165.95 → 124 for N7-methylguanine, m/z 135.9 → 118.95 for adenine, m/z 151.9 → 134.95 for guanine and m/z 136.9 → 110 for allopurinol as IS, respectively. The fragmentation spectrum of O6-methylguanine and N7-methylguanineare is shown in Figure 2. The capillary voltage used was 3.50 kV, nitrogen desolvation temperature was 349°C with a flow rate of 643 L/h, column temperature of 40°C, and the degasser pressure of 0.69 psi. The cone voltage was 32 V, 38 V, 40 V, 35 V and 35 V for O6-methylguanine, N7-methylguanine, adenine, guanine, and allopurinol, respectively.
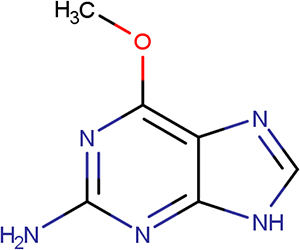 |
Figure 1 O6-methylguanine chemical structure. |
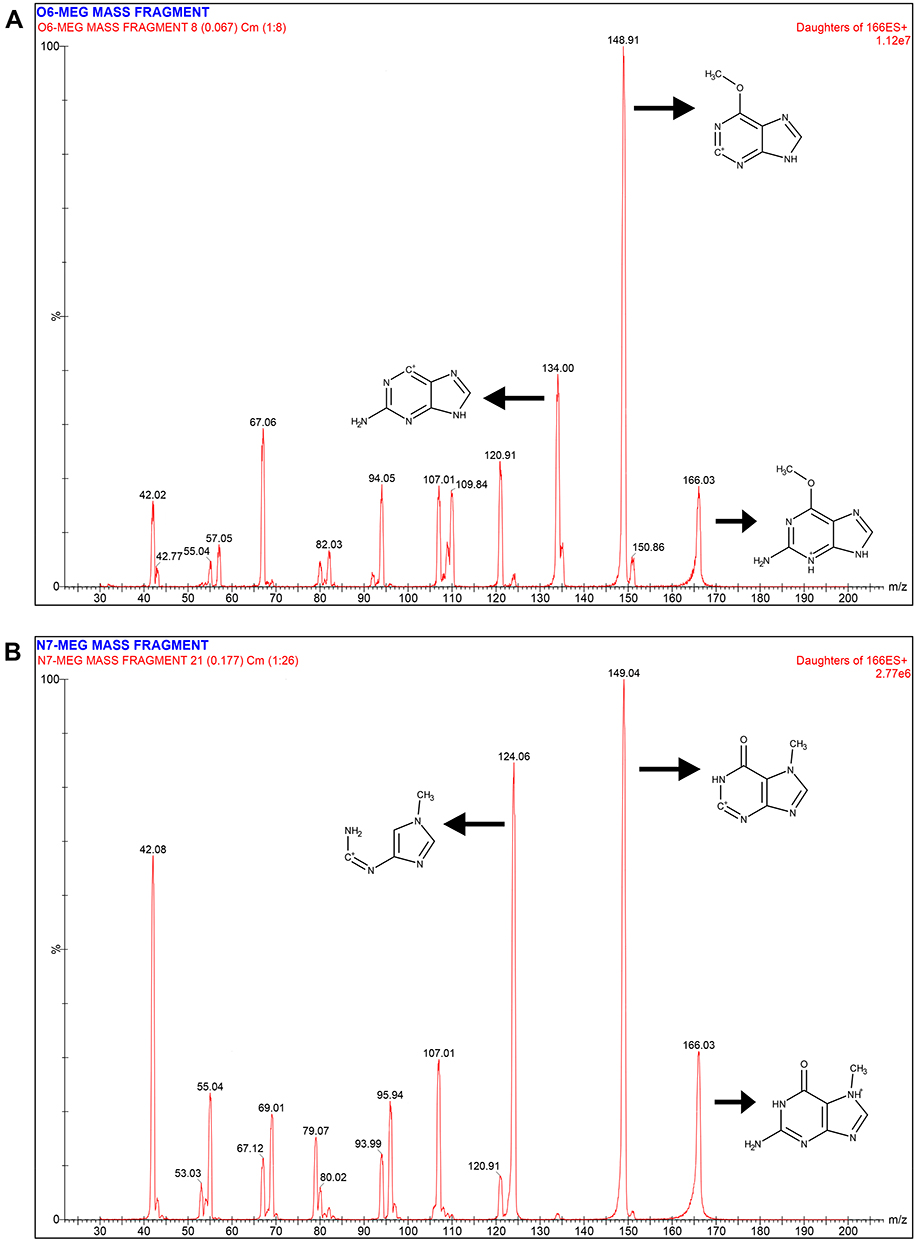 |
Figure 2 Fragmentation spectrum of (A) O6-methylguanine and (B) N7-methylguanine. |
Optimization of Mobile Phase Combination
The selection of the mobile phase combination was carried out in 4 variations, namely, 0.05% acetic acid solution - acetonitrile, 0.05% acetic acid - methanol, 0.05% formic acid - acetonitrile, and 0.05% formic acid - methanol. In this study, a combination of 0.05% formic acid - acetonitrile was chosen because it produced a better chromatogram with the largest area.
Optimization of Mobile Phase Composition
The selection of the composition of the mobile phase is carried out using a combination of 0.05% acetic acid - acetonitrile which is divided into 4 composition variations, namely 95:5, 90:10, 80:20, and 50:50. Based on the results, the composition of the mobile phase 95:5 produces the largest area. Therefore, composition 95: 5 was chosen for use in the analysis.
Optimization of Flow Rate
In this experiment, variations in the flow rate are 0.1 mL/min, 0.2 mL/min and 0.3 mL/min. Based on the results, increasing the flow rate has been shown to accelerate the retention time of the analyte. However, the faster flow rate can increase column pressure which causes the column to become damaged quickly. The use of a flow rate of 0.1 mL/min gives the greatest peak area even with a longer retention time of 3.47 min. Therefore, variations in the flow rate of 0.1 mL/min were chosen for use in this study.
Optimization of Mobile Phase Gradient Elution
Gradient elution was usually done to increase the elution strength which can produce a better peak shape and a larger peak area response. In this experiment, a gradient elution test was carried out using 2 variations as shown in Tables 1 and 2. The use of a gradient elution produces a good chromatogram with a sharper peak shape compared to isocratic conditions. Therefore, the gradient elution profile 2 was chosen.
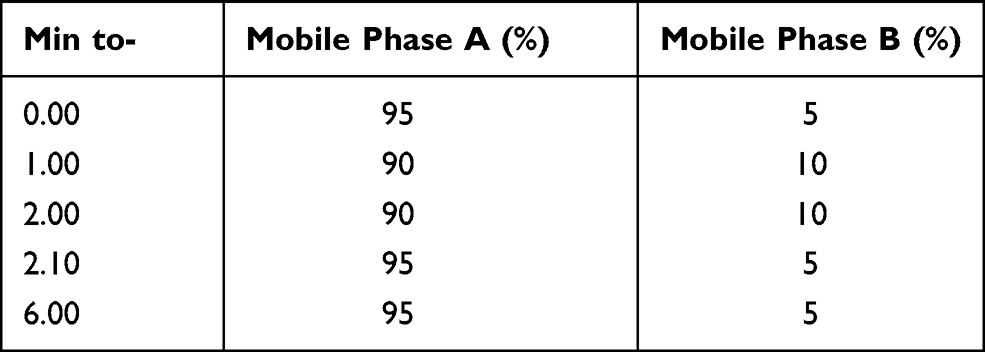 |
Table 1 The First Gradient Elution Profile |
System Suitability Test
After obtaining the optimum analysis conditions, a system suitability test is then performed to ensure that the systems are working properly and are ready to be used for analysis. In this study, the peak area coefficient of variation (%CV) results were 0.68% for O6-methylguanine and 1.0% for allopurinol. The results also showed a % CV value of 0.14% for the retention time of the two compounds. This shows that the system can be used to start the analysis and has fulfilled the requirements that %CV value does not more than 6%.14
Optimization of Sample Preparation
Optimization of DBS sample preparation is done by optimizing the drying time and spotting volume. In this study, optimization of the drying time of DBS samples was evaluated with time variations of 60 min, 120 min, and 180 min. From the experiments carried out, it is known that 120 min is sufficient time and provides the greatest response area of chromatogram. Therefore, 120 min is determined as the optimal drying time for DBS samples. After drying time is optimized, the spotting volume is optimized to get the optimal blood volume that must be spotted on DBS paper. Optimization is evaluated using three variations in the spotting volume of 30, 40, and 50 µL. Based on the results, the response of the peak area of the 50 µL gives the greatest results. Therefore, a spotted volume of 50 µL was chosen as the optimal spotted volume.
Method Validation
Lower Limit of Quantification
LLOQ determines the sensitivity of a method and needs to be determined during method development. LLOQ test for O6-methylguanine at a concentration of 0.5 ng/mL resulted in a value of %diff which ranged from −8.90% to 11.40% with a %CV of 8.95%. This data is shown in Table 3. Based on these results, it is known that the accuracy and precision of the concentration of 0.5 ng/mL meet the LLOQ requirements on FDA, 2018. This LLOQ concentration was the same as previous studies that carried out O6-methylguanine analysis in blood samples.7 This shows that Dried Blood Spot samples can provide the same sensitivity as blood samples.
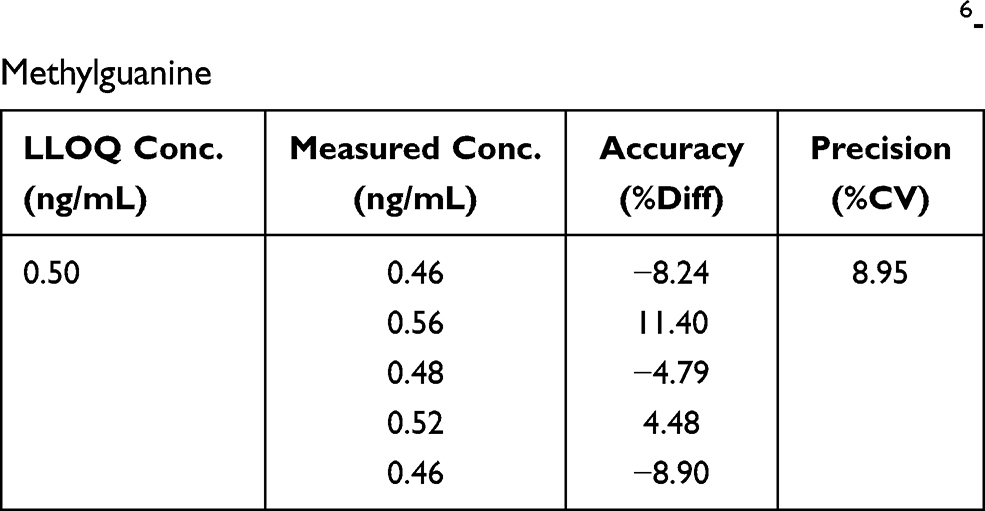 |
Table 3 The Accuracy and Precision from LLOQ of O6-Methylguanine |
Calibration Curve
The calibration curve was made from a concentration of 0.5 ng/mL to 20 ng/mL with 6 concentration levels, blank, and zero samples. The calibration curve obtained was linear and meets the requirements of the correlation coefficient (r) value greater than 0.98.15 The results of the calibration curve experiment showed that the %diff obtained fulfilled the requirements. Data of O6-methylguanine inter-day calibration curves are shown in Table 4.
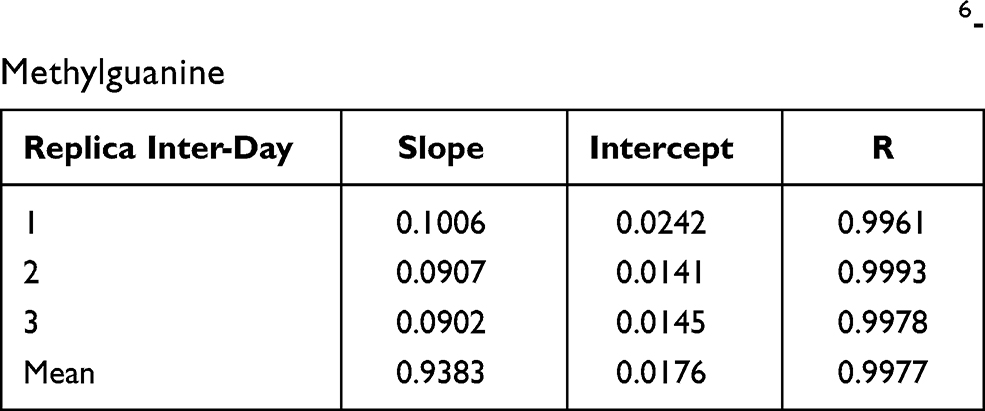 |
Table 4 Data of Inter-Day Calibration Curve of O6-Methylguanine |
Selectivity
Selectivity is a test parameter evaluated to ensure that the method used can measure analytes accurately. Based on results, the selectivity test was fulfilled the FDA requirements with %interference of the analyte between 8.64–13.54% and %interference of allopurinol between 1.329–2.022%. The chromatograms of blank, LLOQ, and QC samples are shown in Figure 3.
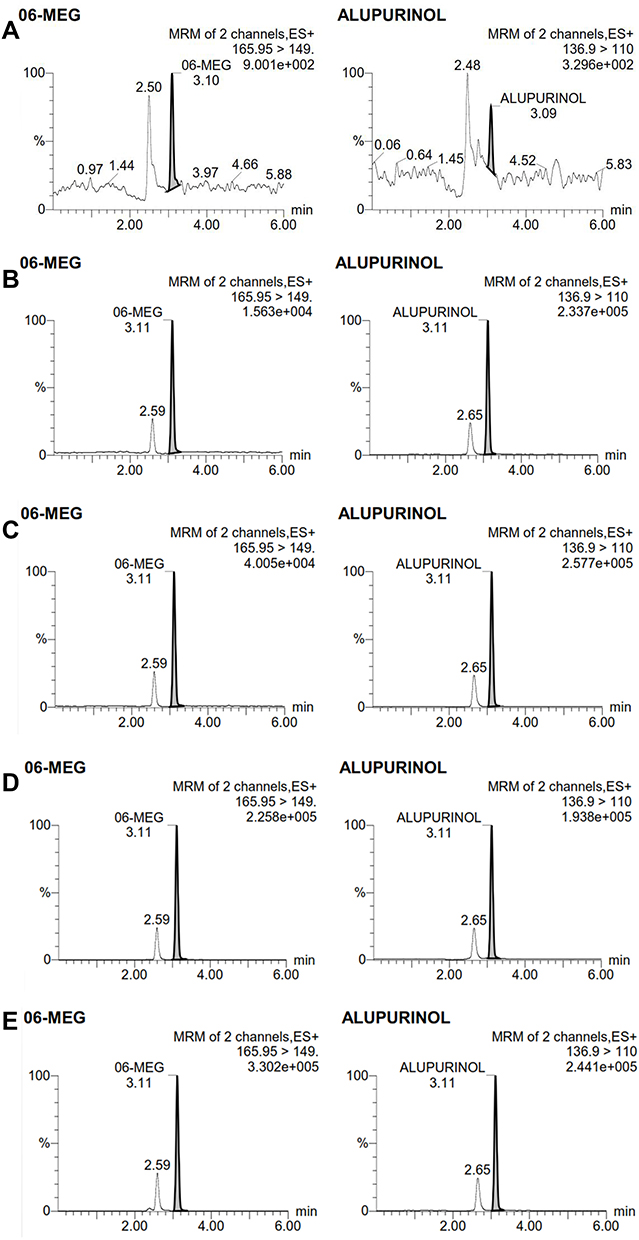 |
Figure 3 Representative UPLC-MS/MS chromatograms of O6-methylguanine and allopurinol in (A) blank DBS; (B) DBS with analyte at LLOQ; (C) QCL; (D) QCM; (E) QCH. |
Accuracy and Precision
Accuracy and precision tests were carried out using 4-level concentrations, namely, LLOQ, QCL, QCM, and QCH. The intraday accuracy value of O6-methylguanine ranged from 91.99–106.29% with %CV values ≤4.61%. The interday accuracy value ranged from 96.23–109.45% with %CV values ≤4.97%. Based on the results, the accuracy and precision of O6-methylguanine meet the requirements with the value of %diff and %CV at LLOQ concentrations do not more than 20% and the value of %diff and%CV at other concentrations than LLOQ do not more than 15%. Compared with previous study,7 this study showed homogen data with lower %CV value. The intra- and inter-day accuracy and precision are shown in Table 5.
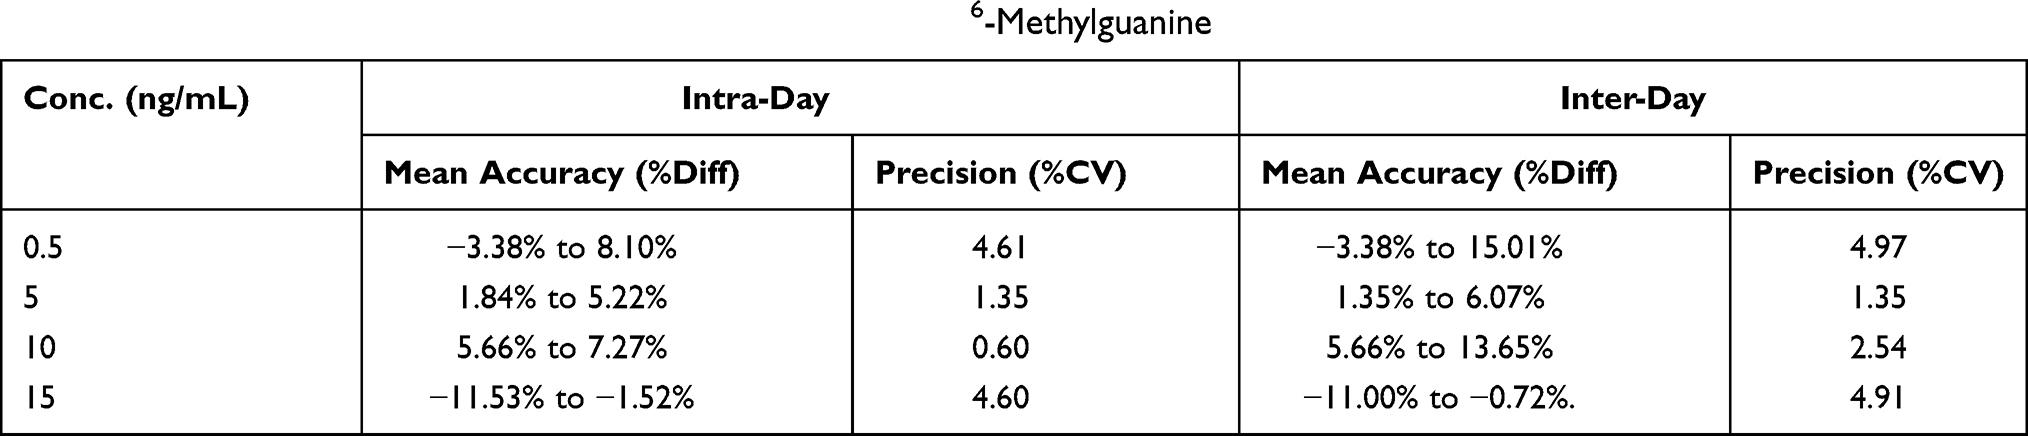 |
Table 5 The Intra- and Inter-Day Accuracy and Precision of O6-Methylguanine |
Recovery
The recovery test is performed to see the extraction efficiency on the sample. According to FDA 2018, the value of recovery in analysis using a biological matrix does not have to be 100%. However, it needs to be consistent and reproducible Based on the test, the average recovery value for O6-methylguanine is 82.62% at QCL concentration, 82.50% at QCM concentration, and 83.29% at QCH concentration. In addition, the test results also showed %CV for the concentrations of QCL, QCM, and QCH of 3.97%, 2.71%, and 5.90%, respectively. The average recovery value obtained for the standard in allopurinol is 81.10% with a %CV of 2.09%.
Carryover
Carryover is a parameter that is tested to determine the availability of analytes in blank samples after injecting high concentration analytes (ULOQ). Based on the results, the value of carryover was 11.12% to 12.65% for O6-methylguanine and 1.30% to 1.68% for the internal standard allopurinol. These results indicate that the carryover of O6-methylguanine and allopurinol meets the 2018 FDA requirements.
Dilution Integrity
Dilution integrity tests showed the value of %diff is obtained between −3.70% and 14.62% with a %CV value of 2.82% for the 2QCH concentration, 6.39% for the QCH concentration, and 3.90% for the ½QCH concentration. The results indicate that it meets the dilution integrity requirements with the value of %diff and %CV do not exceed ±15%.
Matrix Effect
The average matrix factor obtained was 95.69% for QCL concentration and 97.30% for QCH concentration with CV values for QCL and QCH, namely, 1.96% and 1.11%. The results of testing the matrix effect on the internal standard allopurinol give an average matrix factor value of 89.83% with %CV 4.60%. There is little ion suppression from the matrix against the internal standard. This is due to the competition between the matrix and the internal standard in the process of adding charge in the mobile phase. The results of standardized normalized matrix factors obtained were 1.07% for the concentration of QCL and 1.09% for the concentration of QCH with the values of CV for QCL and QCH, respectively, 4.20% and 5.03%.
Stability
Stock solutions of O6-methylguanine and allopurinol were stable for 24 h in room temperature and 30 d in the refrigerator (−4°C). The stability test results of O6-methylguanine and allopurinol showed in Table 6. The data indicate that O6-methylguanine and allopurinol are stable enough during sample preparation and storage conditions.
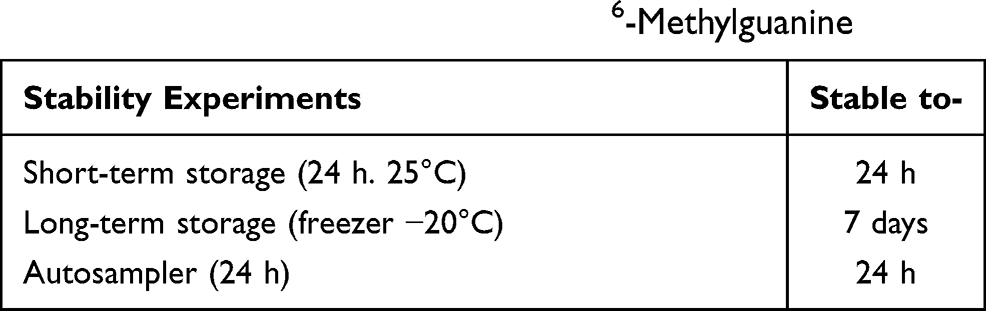 |
Table 6 The Stability Test Results of O6-Methylguanine |
Conclusion
In conclusion, the method for measuring O6-methylguanine in Dried Blood Spot was successfully developed and validated. Compared with the previously used method,7 this method has improved with a less invasive biosampling method and a smaller volume of blood samples. The method provides a rapid, sensitive, and selective analysis of O6-methylguanine using UPLC-MS/MS with a linear concentration range between 0.5–20 ng/mL.
Ethics
This study was conducted in accordance with the Declaration of Helsinki.
Acknowledgments
The authors acknowledge the financial support received from the Directorate of Research and Community Services (DRPM) Universitas Indonesia, Depok, Indonesia with grant number NKB-1272/UN2.RST/HKP.05.00/2020, for the financial support of this research. This study was reviewed and approved by the Research Ethics Committees of “Dharmais” Cancer Hospital, Jakarta 11420, Indonesia (No.023/KEPK/II/2020).
Disclosure
The authors report no conflicts of interest. The authors alone are responsible for the content and writing of this article.
References
1. Reddy H, Duffy A, Holtzman NG, Emadi A. The role of β-elimination for the clinical activity of hypomethylating agents and cyclophosphamide analogues. Am J Cancer Ther Pharm. 2016;3:1–8.
2. Timm R, Kaiser R, Lotsch J, et al. Association of cyclophosphamide pharmacokinetics to polymorphic cytochrome P450 2C19. Pharmacogenomics J. 2005;5(6):365–373. doi:10.1038/sj.tpj.6500330
3. International Agency for Research on Cancer. IARC monograph - 100A. Paris: International Agency for Research on Cancer; 2012.
4. Robert JFH, Bast C
5. Katzung BG, Trevor AJ. Basic & Clinical Pharmacology, Thirteenth. San Fransisco: McGraw-Hill Education; 2015.
6. Wilhelm AJ, den Burger JCG, Swart EL. Therapeutic drug monitoring by dried blood spot: progress to date and future directions. Clin Pharmacokinet. 2014;53:961–973. doi:10.1007/s40262-014-0177-7
7. Harahap Y, Andalusia R, Crystalia Y, Nurfaradilla S. Analysis of O6-methylguanine in cancer patient blood during administration of cyclophosphamide using ultra high performance liquid chromatography-tandem mass spectrometry. J Adv Med Pharm Sci. 2015;2:20–28. doi:10.9734/jamps/2015/12953
8. Ostler MW, Porter JH, Buxton OM. Dried blood spot collection of health biomarkers to maximize participation in population studies. J Vis Exp. 2014;1–9. doi:10.3791/50973
9. Kim HM, Park J, Phuoc Long N, Kim D, Kwon SW. Simultaneous determination of cardiovascular drugs in dried blood spot by liquid chromatography-tandem mass spectrometry. J Food Drug Anal. 2019;27:906–914. doi:10.1016/j.jfda.2019.06.001
10. Food and Drug Administration. Bioanalytical method validation guidance. Food Drug Adm. 2018;1043:25.
11. QIAGEN. QIAamp DNA mini and blood mini handbook Qiagen; 2016:1–72. Available from: http://www.qiagen.com/knowledge-and-support/resource-center/resource-download.aspx?id=67893a91-946f-49b5-8033-394fa5d752ea&lang=en.
12. Li W, Zhang J, Francis LST. Handbook of LC-MS Bioanalysis. Canada: John Wiley & Sons, Inc.; 2013.
13. Van De Merbel N, Savoie N, Yadav M, et al. Stability: recommendation for best practices and harmonization from the global bioanalysis consortium harmonization team. AAPS J. 2014;16:392–399. doi:10.1208/s12248-014-9573-z
14. Briscoe CJ, Stiles MR, Hage DS. System suitability in bioanalytical LC/MS/MS. J Pharm Biomed Anal. 2007;44:484–491. doi:10.1016/j.jpba.2007.03.003
15. Ghatol S, Vithlani V, Gurule S, Khuroo A, Monif T, Partani P. Liquid chromatography tandem mass spectrometry method for the estimation of lamotrigine in human plasma: application to a pharmacokinetic study. J Pharm Anal. 2013;3:75–83. doi:10.1016/j.jpha.2012.09.001
 © 2021 The Author(s). This work is published and licensed by Dove Medical Press Limited. The full terms of this license are available at https://www.dovepress.com/terms.php and incorporate the Creative Commons Attribution - Non Commercial (unported, v3.0) License.
By accessing the work you hereby accept the Terms. Non-commercial uses of the work are permitted without any further permission from Dove Medical Press Limited, provided the work is properly attributed. For permission for commercial use of this work, please see paragraphs 4.2 and 5 of our Terms.
© 2021 The Author(s). This work is published and licensed by Dove Medical Press Limited. The full terms of this license are available at https://www.dovepress.com/terms.php and incorporate the Creative Commons Attribution - Non Commercial (unported, v3.0) License.
By accessing the work you hereby accept the Terms. Non-commercial uses of the work are permitted without any further permission from Dove Medical Press Limited, provided the work is properly attributed. For permission for commercial use of this work, please see paragraphs 4.2 and 5 of our Terms.