")
Back to Journals » Journal of Inflammation Research » Volume 14
Methanolic Fenugreek Seed Extract Induces p53-Dependent Mitotic Catastrophe in Breast Cancer Cells, Leading to Apoptosis
Authors Alrumaihi FA , Khan MA , Allemailem KS , Alsahli MA , Almatroudi A , Younus H , Alsuhaibani SA, Algahtani M, Khan A
Received 8 January 2021
Accepted for publication 24 March 2021
Published 16 April 2021 Volume 2021:14 Pages 1511—1535
DOI https://doi.org/10.2147/JIR.S300025
Checked for plagiarism Yes
Review by Single anonymous peer review
Peer reviewer comments 2
Editor who approved publication: Professor Ning Quan
Faris A Alrumaihi1
Masood A Khan2
Khaled S Allemailem1
Mohammed A Alsahli1
Ahmad Almatroudi1
Hina Younus3
Sultan A Alsuhaibani1
Mohammad Algahtani4
Arif Khan2
1Department of Medical Laboratories, College of Applied Medical Sciences, Qassim University, Buraydah, Saudi Arabia; 2Department of Basic Health Sciences, College of Applied Medical Sciences, Qassim University, Buraydah, Saudi Arabia; 3Interdisciplinary Biotechnology Unit, Aligarh Muslim University, Aligarh, India; 4Department of Laboratory Medicine, Security Forces Hospital, Mecca, Saudi Arabia
Purpose: The plant Trigonella foenum-graecum, well-known as fenugreek, has been shown to control type-2 diabetes, the level of cholesterol, inflammation of wounds, disorders related to gastrointestinal tracts, and cancer as well. The present study aimed to evaluate the anticancer potential of methanolic fenugreek seed extract (FSE) and its possible molecular mechanism of action in breast cancer cells.
Methods: The anticancer potential of FSE was evaluated in MCF-7 and SK-BR3 breast cancer cells through various cellular assays after selecting the IC10, IC25, IC35, and IC50 doses by the cell cytotoxicity assay. Furthermore, the oral acute toxicity of FSE was examined in mice, according to the guidelines of the Organization for Economic Cooperation and Development (OECD).
Results: FSE exhibited dose-dependent cytotoxicity, as the IC50 was found to be 150 and 40 μg/mL for MCF-7 and SK-BR3 breast cancer cells, respectively. The cytological observations showed the typical apoptotic morphology in both of the breast cancer cells upon treatment with FSE, as it inhibited the migration and adhesion, in a dose-dependent manner. The flow cytometry analysis revealed that FSE induced a significant shift from G2/M, and polyploidy (>G) at higher concentrations that suggested the activation of p53-mediated mitotic catastrophe, consequently leading to apoptosis. FSE induced a significant increase in the mitochondrial depolarization, ROS as well as a Bax/Bcl-2 ratio, and also exhibited the mitochondrial associated p53 signaling pathway. The in vivo acute toxicity data revealed that the oral administration of FSE did not induce any toxic effect in mice.
Conclusion: This study, for the first time, reports the mechanistic details of the anti-cancer potential of FSE. It requires a detailed analysis to understand the effect of FSE to induce the apoptosis through the multiple signaling pathways at varying concentrations. The nontoxic effect of FSE in mice suggests to utilize it safely for pharmaceutical formulations in different cancer systems.
Keywords: fenugreek seed extract, breast cancer cells, mitotic catastrophe, apoptosis, p53 signaling, mitochondria-associated pathway, oral acute toxicity
Introduction
It is evident from several epidemiologic studies that the diets comprising fruits, vegetables, whole grains, seeds, herbs may reduce or delays the progression of several ailments such as cancer, cardiovascular diseases, and diabetes.1,2 The idea of using natural foods to minimize the risk of various types of cancer dates back many decades.3 It is believed that the total mortality that occurred due to cancer could be reduced by including the appropriate amounts of natural foods in the diet.4–6 As reviewed by Newman and Cragg 2020, nearly 50% of the drugs available in the market were either derived from plants or chemically modified in the last 40 years.7
Trigonella foenum-graecum is one of the oldest traditional plants in the Mediterranean region, India, and China that is consumed as a medicine in the treatment of several diseases.8,9 In the recent age of reemergence of dietary products as natural drugs, researchers showed immense interest in understanding the therapeutic effect of fenugreek seeds against many diseases, including cancer. Several studies suggest that the fenugreek plant contains many biologically active compounds that are described for their pharmacological actions.10 The fenugreek leaf extracts showed the analgesic effect in the 5-HT model of rodents.11 The seed extracts showed the hepatoprotective effect in alcohol or monosodium glutamate-induced dyslipidemia and oxidative stress in rats.12,13
Similarly, fenugreek has been reported to regulate the levels of triglycerides, total cholesterol, and low-density lipoprotein (LDL) as well.14–17 It was observed that saponins, one of the main constituents of fenugreek, transforms into sapogenins in the gastrointestinal tract and decreases the level of serum cholesterol.14,18 Fenugreek demonstrated the antidiabetic potential by stimulating the secretion of insulin and decreasing insulin resistance in tissues. It also described that fenugreek seeds activated insulin receptor substrate–associated phosphoinositide 3 kinase (PI3K) activity.19–22 Furthermore, it has been reported that fenugreek seed extract stimulates the insulin-mediated molecular pathway in adipocytes and hepatic cells following the phosphorylation of many genes, including insulin receptor, p85 subunit of PI3K in vitro.9
Additionally, fenugreek seed extract modulated the activities of antioxidant enzymes that prevented the elevation in lipid peroxidation.23,24 Concomitantly, it showed a tremendous antioxidant potential against cisplatin-induced nephrotoxicity and hepatotoxicity that may pave a way to prevent chemotherapy-induced toxicity.25 Moreover, it was suggested that the addition of fenugreek seeds in diets would reduce the lipid peroxidation, along with the acceleration of reduced GPx, GST, SOD, and catalase as well.26
The anti-cancer potential of fenugreek has also been documented, but not investigated extensively in vitro as well as in vivo studies against different types of cancer, including breast cancer.8,10,27 The steroid saponin constituent, Diosgenin of fenugreek seeds, showed the induction of aberrant crypt foci formation in F344 rats. It inhibited the proliferation of HT-29 human colon cancer cells in a dose-dependent manner through the activation of caspase-2, leading to apoptosis.28 It has been reported that fenugreek seeds extract is significantly effective in suppressing mammary hyperplasia and decrease its incidence against DMBA-induced breast cancer in vivo.29 Strikingly, it exhibited a selective cytotoxic effect in various cancer cell lines, but no toxic effect was observed in normal cells.30
Keeping the facts including this particular feature into consideration, the use of fenugreek products in natural drug development may be a promising strategy, as one of the major disadvantages of the chemically synthesized drug is toxicity to normal cells. The regulation of biological processes within the cell, such as cell division, expression of genes, programmed cell death, needs the induction of multiple signaling pathways by various enzyme complexes. However, it also requires the presence of many cofactors and coenzymes to get activated. Therefore, the use of crude extract instead of active compounds alone may boost the synergistic impacts between metabolites to induce apoptosis through multiple signaling pathways.31
In the present research, we aimed to investigate the anti-cancer effect of seed extracts in breast cancer cells in vitro and take the initiative to understand the molecular pattern more intricately. The toxicological analysis of the naturally occurring remedies in model animals provides preliminary data to establish the safer dose level. Irrespective of a widespread use of fenugreek seeds in the treatment of various diseases, no work has been done on its in vivo toxicity. Therefore, the present study also aimed to determine the toxicity of FSE using an oral acute toxicity test in Swiss albino mice.
Materials and Methods
Reagents
The cell cytotoxicity assay, TMRE-Mitochondrial membrane potential assay, DCFDA/H2DCFDA-Cellular ROS Assay, ALT, AST, ALP, TBIL kits, antibodies (Abs) against p53, p21, Bax, Bcl-2, β-actin, Rabbit anti-mouse horseradish peroxidase, and goat anti-rabbit horseradish peroxidase-conjugated secondary antibodies were purchased from Abcam (Cambridge, USA). Annexin V-FITC kit, running, washing, and storage buffers for the flow cytometry were procured from Miltenyi Biotec, Germany. Dulbecco’s Modified Eagle Medium (DMEM) and Fetal Bovine Serum (FBS) were procured from Life Technologies, USA. MCF-7 (ECAC 86012803) was commercially purchased from ECACC (European Collection of Cell Cultures), Salisbury, UK. SK-BR3 (ATCC HTB30) was procured from ATCC (American Type Culture Collection), VA, USA.
Preparation of Fenugreek Seeds Extract
The dried organic fenugreek seeds collected from the local market were crushed into coarse powder by kitchen blender machine followed by defatting, using cyclohexane in a 1:3 ratio followed by stirring for 3 hours. The defatted powdered was placed in the thimber cup for the Soxhlet extraction method in Buchi Extraction System for 48 hours, adding the methanol as a solvent in the collecting beaker. The remaining solvent was evaporated entirely under the reduced pressure using vacuum controlled rotary evaporator to remove the traces of methanol (named FSE).
Determination of Total Phenolic Content (TPC) in FSE
Total phenolic content (TPC) in methanolic extract was determined by using the Folin–Ciocalteu (FC) method. The calibration curve was established using gallic acid (1.4–1000 μg/mL).32 Briefly, the diluted extract or gallic acid (1.6 mL) is added to 0.2 mL FC reagent (5-fold diluted with distilled water) and mixed thoroughly for 3 minutes. Sodium carbonate (0.2 mL, 10% w/v) was added to the mixture and the mixture is allowed to stand for 30 minutes at room temperature in a dark place. The FSE as well as GA were prepared in triplicate for each analysis and the mean value of absorbance was obtained. The absorbance of the mixture was measured at 765 nm using a UV–VIS spectrophotometer. TPC was expressed as microgram gallic acid equivalent per gram of fenugreek seed extract (μg of GA/g of FSE).
GC-MS (Gas Chromatography-Mass Spectrometry) Analysis
Agilent GC 7890A combined with a triple axis detector 5975 C single quadrupole mass spectrometer was used for GC-MS analysis. The chromatographic column was an agilent HP 5MS column (30 m × 0.25 mm × 0.25 µm film thickness), with high-purity helium as the gas carrier, at a flow rate of 1 mL/min. The injector temperature was 230°C and it was equipped with a splitless injector at 20:1. The temperature was set initially to 40°C (held for 1 min), then was increased to 150°C at 10° C min−1 (held for 2 min), then increased further to 300°C at 10°C min−1 for 1 min. The MS ion source temperature was 150°C and the inlet line temperature was set to 280°C. The scan range was set at 50 to 550 mass ranges at 70 eV electron energy and the solvent delay of 3 minutes. Finally, unknown compounds were identified by comparing the spectra with that of the NIST 2008 (National Institute of Standard and Technology library). The total time required for analyzing a single sample was 40 minutes.
Determination of Total Flavonoid Content (TFC) in FSE
The total flavonoid content (TFC) of the methanolic fenugreek extract was investigated using the aluminum chloride calorimetry method.33 In brief, the extract sample was diluted with methanol until 100 μg/mL and the calibration curve was prepared by diluting quercetin in methanol (0–100 μg/mL). The diluted extract or quercetin (2.0 mL) was mixed with 0.1 mL of 10% (w/v) aluminum chloride solution and 0.1 mL of 0.1 mM potassium acetate solution. The mixture was kept at room temperature for 30 minutes. Then, the maximum absorbance of the mixture was measured at 415 nm using a UV–VIS spectrophotometer. TFC is expressed as microgram quercetin (QC) equivalent per gram fenugreek seed extracts (μg of QC/g of FSE).
Total Antioxidant Activity
The radical scavenging activity of FSE was determined by using DPPH (1, 1 Diphenyl 2-Picryl Hydrazyl) assay, with minor modifications.34 The decrease in the absorption of the DPPH solution after the addition of an antioxidant was measured at 517nm.

Where, RSA is the Radical Scavenging Activity; Abs control is the absorbance of DPPH radical + methanol; Abs sample is the absorbance of DPPH radical + extract.
Cell Cytotoxicity Assay
The primary screening of FSE at various doses was conducted in MCF-7 and SK-BR3 breast cancer cell lines to select an appropriate dose for further study. The cell cytotoxicity assay was used to determine the percentage viability of MCF-7 and SK-BR3 cells following exposure to FSE doses. Briefly, the cells were grown into 96-well plates (1 × 10⁴ cells/well) overnight, followed by the treatment at the doses 0, 1, 5, 10, 25, 50, 75, 100, 150, 200, and 250 µg/mL of FSE for 48 hours. Then, reagent (20 µL) from the kit was added in each well and incubated the plate at 37°C in a humidified 5% CO2 atmosphere. After 4 hours, the absorbance was measured at 590 nm in a microplate reader. The viability of the cells was measured using the following formula.

Asample is an absorbance of FSE treated cells.
Actrl is the absorbance of untreated cells.
AO is the absorbance of the background of non-cell control (only media).
Morphological Observation of MCF-7 and SK-BR3 Breast Cancer Cells
In the morphological observation, the cells were treated with the selected doses, as suggested by the primary screening using cell cytotoxicity assay. Briefly, 1× 10⁵ cells/well were grown in the 12-well plate for 24 hours, followed by the treatment with FSE at the doses of 40, 80, 100, and 150 μg/mL for MCF-7 cells, and 10, 20, 30, and 40 μg/mL for SK-BR3 cells, respectively, for next 48 hours. The images of the morphological changes were taken using an inverted microscope (Optika-TB-3W, Ponteranica, Italy) at 20 X magnification.
Crystal Violet Staining Assay
In the crystal violet staining cell adhesion assay, the cells were treated with the selected doses of FSE for 48 hours, as stated above. The cells were gently washed and stained with 0.2% crystal violet in 10% formalin solution. Then, the staining solution was removed, and the cells were washed 3X with phosphate-buffered saline (PBS) and were air-dried for taking macrographic images.
Wound Healing Assay
The potential of FSE in the inhibition of migration was assessed using wound-healing assay by following the standard method.35 Briefly, 1 × 10⁵ cells/well were grown in a 12-well plate for 24 hours, followed by making the straight scratch across the center with the help of a pipette tip. The cells were then treated with the chosen doses followed by imaging of the cells at 0 h using an inverted microscope (Optika-TB-3W, Ponteranica, Italy) followed by the incubation for 48 hours. The wound area was measured by ImageJ and the cell migration ability was compared as the relative mobility index, to the gaps filled by untreated control in 48 hours.
Annexin V-FITC/PI Apoptosis Assay
The changes in the proportion of cells in the viable, necrotic, early, and late apoptotic stages at varying doses of FSE was evaluated using Annexin V-FITC/PI apoptosis staining kit (Miltenyi Biotec, Germany). Briefly, 2.5 × 10⁵ cells/well were grown in a 6-well plate for 24 hours, followed by the treatment with the designated doses, and incubated for 48 hours. The cells were then harvested following trypsin treatment, and incubated with Annexin V-FITC and PI in binding buffer at room temperature for 15 minutes in the dark, as per the instructions from the manufacturer. The samples were acquired by MACSQuant Analyzer 10, and analysis was conducted on FlowJo software v10.7.
Cell Cycle Distribution Analysis
The changes in the cell cycle distribution by FSE at various doses were analyzed using the flow cytometry in MCF-7 and SK-BR3 breast cancer cells. The cells were grown and treated, as described in the apoptosis assay. The cells were harvested, washed with sample buffer, followed by fixation in 70% ice-cold ethanol in sample buffer overnight. The cells were suspended in the sample buffer containing 50 µg/mL propidium iodide (PI) and 100 µg/mL Ribonuclease A (RNAse A) followed by incubation at 37°C for 30 minutes. The samples were acquired by MACSQuant Analyzer 10, and the cytometry results were analyzed using FlowJo software v10.7.
Flow Cytometry and Imaging Analysis of Mitochondrial Membrane Potential (MMP or Δψm)
The changes in the MMP by FSE at various doses were determined by the flow cytometry as well as the confocal microscopy using TMRE (tetramethylrhodamine, ethyl ester)-Mitochondrial Membrane Potential Assay Kit (Abcam, Cambridge, USA), according to manufacturer’s instructions. TMRE is a cell permeant, positively charged, red-orange dye that readily accumulates in active mitochondria due to their relative negative charge. Depolarized or inactive mitochondria have decreased the membrane potential and fail to sequester. Briefly, 2.5 × 10⁵ cells for flow cytometry and 5 × 10⁴ for confocal image analysis were grown in each well of 6-well and 24 plates, respectively, for 24 hours, followed by the treatment with the designated doses and incubated for 48 hours. The cells were harvested, washed, and incubated with TMRE (200 nM) for 20 minutes at 37°C, followed by acquisition on MACSQuant Analyzer 10 and analysis using FlowJo software v10.7. For confocal image analysis, the TMRE (50 nM) was overlaid to the culture and incubated for 20 minutes. The media, then replaced by PBS and TMRE, was detected under the confocal microscope.
Note: The FCCP (20 µM) was added 10 minutes prior to staining with TMRE in FSE 0 (positive control) treated cells.
Determination of Intracellular ROS Generation
Intracellular ROS levels of living cells were measured quantitatively and qualitatively by the flow cytometry and confocal microscopy using DCFDA/H2DCFDA-Cellular ROS Assay kit (Abcam, Cambridge, USA), according to the manufacturer’s instructions. Briefly, 2.5 × 10⁵ cells for flow cytometry and 5 × 10⁴ for confocal image analysis were grown in 6- and 24well plate, respectively, for 24 hours, followed by the treatment with the designated doses and incubated for 48 hours. The cells were harvested, washed twice in PBS, and incubated with DCFDA (20 μM) for 30 minutes at 37°C, followed by acquisition on MACSQuant Analyzer 10 and analyzed using FlowJo software v10.7. For confocal image analysis, the DCFDA (50 nM) was overlaid to the culture and incubated for 45 minutes. Then, the media was replaced by PBS, and DCFDA was detected under the confocal microscope.
Note 50 μM Tert-Butyl Hydrogen Peroxide (TBHP) was added 4 hours prior to staining with DCFDA in FSE 0 (+ve Ctrl) treated cells.
Western Blotting
The effect of various doses of FSE on MCF-7 and SK-BR3 breast cancer cells was evaluated on the p53 signaling pathway by the Western blotting. The 0.25 × 10⁶ cells per well were seeded in 6-well plates overnight and treated under the same conditions as described above. The immunoblotting analyses were done by probing the protein on the PVDF membrane with anti-p53, anti-p21, anti-Bax, anti-Bcl-2, anti-β Actin after harvesting of the cells, 48 hours of the treatment.
In vivo Oral Toxicity Study
Female Swiss mice (8–10 weeks) were obtained from the animal house facility of the King Saud University, Riyadh, Saudi Arabia. The experiments involving the animals were carried out after the approval of the animal ethics committee of the College of Applied Medical Sciences, Qassim University, following guidelines of the University of London Animal Welfare Society, Wheathampstead, England. All the twelve mice were fasted overnight before the treatment and the food was provided approximately 1 hour after the treatment. The acute oral toxicity of FSE was investigated in the mice as per the guidelines by the Organization for Economic Co-operation and Development (OECD), Test # 420.36 A single high dose of 5000 mg/kg b.w of FSE in distilled water was administered through oral gavage to six mice, while distilled water was given to another six control mice. All animals were observed frequently on the day of treatment for 6 hours and surviving animals were monitored daily for 14 days for any sign of acute toxicity. All the surviving animals were weighed every other day and visual observations for mortality, behavioral pattern, changes in physical appearance, injury, pain, and signs of illness were conducted daily during the period.
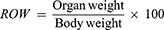
Assessment of Relative Organ Weight
All the mice were sacrificed after the completion 14 days experimental period. The vital organs (lung, liver, kidney, heart, and spleen) were excised and relative organ weight (ROW) was measured using the formula as follows.
Biochemical Analysis
After 14 days of experimental period, the activity of liver markers in the serum was determined by the Colorimetric analyses of the total bilirubin (TBIL), alkaline phosphatase (ALP), alanine aminotransferase (ALT), and aspartate aminotransferase (AST) using the kits from Abcam, following manufacturer’s instructions.
Statistical Analysis
The mean values and standard errors for all samples were calculated for different treated groups. The significant difference between the groups of various doses of FSE was measured by the ordinary one-way and 2way ANOVA, Tukey’s multiple comparison test using Prism 8. P-value < 0.05 was considered statistically significant.
Results
Analysis of the Bioactive Compounds in FSE by GC-MS Analysis
As shown in Table 1, the range of 35 bioactive compounds were identified in the FSE by GC-MS analysis, supports the importance of fenugreek seeds as traditional medicine. The GC-MS spectrum confirmed the presence of various components with different retention times as illustrated in Figure 1.
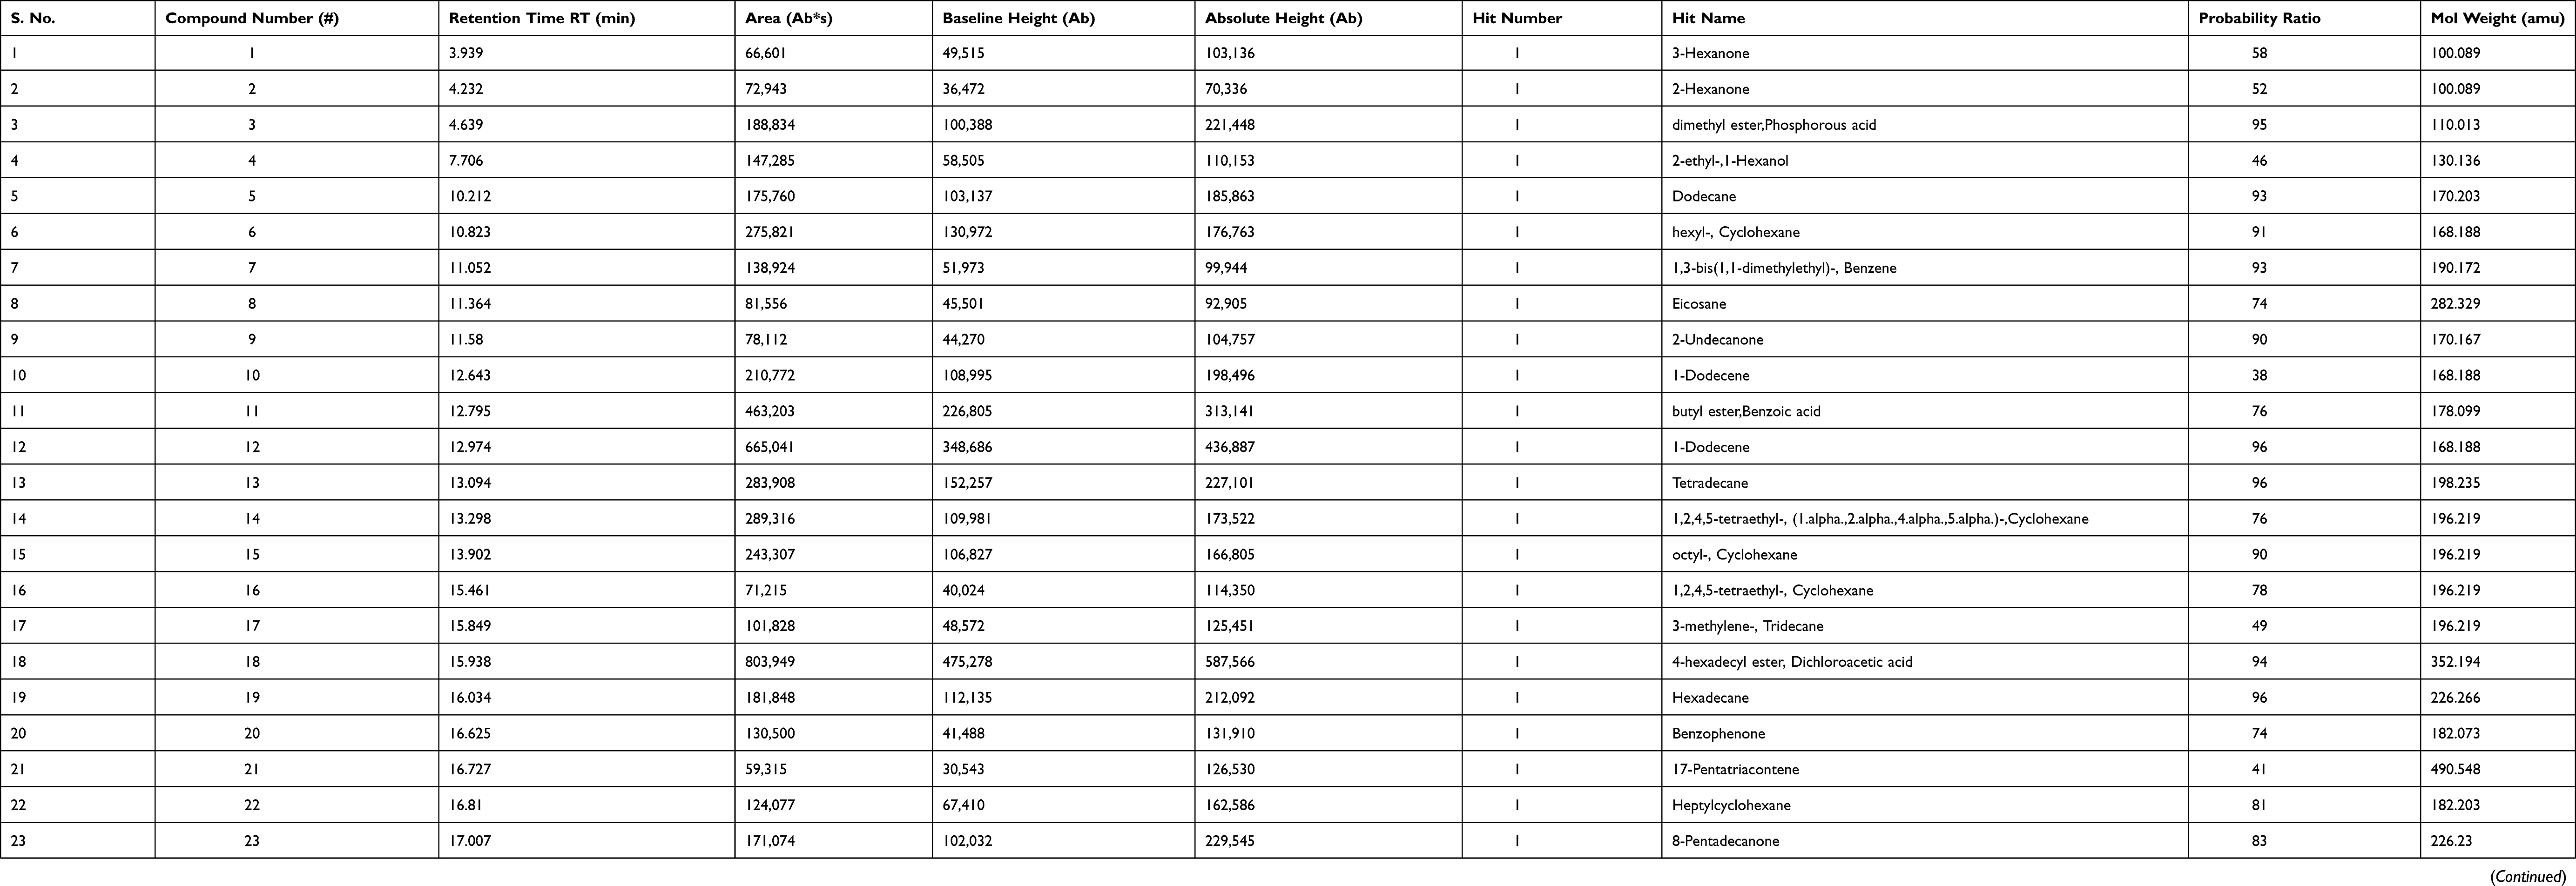 |
Table 1 Biologically Active Chemical Compounds of FSE by GC-MS Analysis |
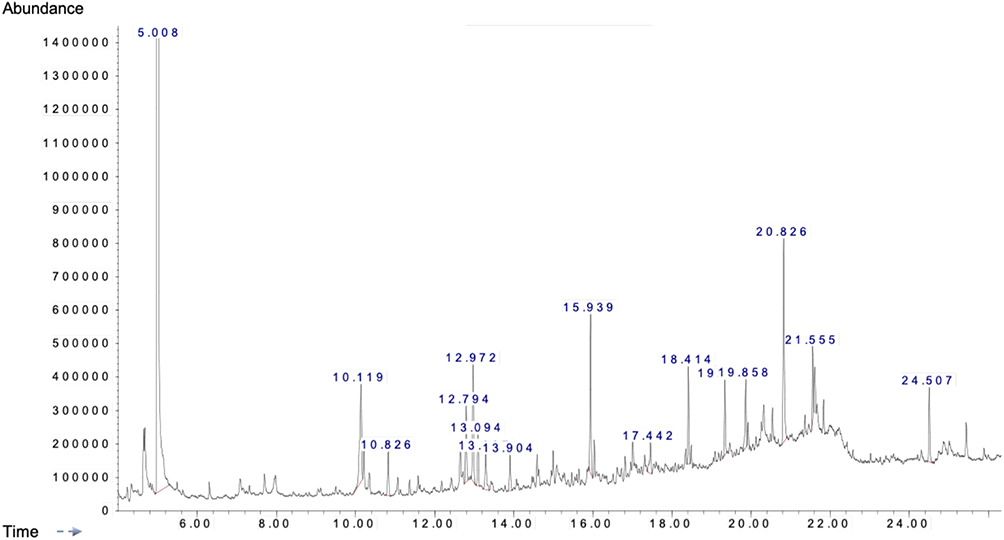 |
Figure 1 A typical chromatogram of the bioactive compounds present in FSE. |
Polyphenols in FSE and Antioxidant Activity
The concentration of polyphenols as total phenolic contents (TPC) and total flavonoid contents (TFC) in FSE was measured to be 128.3 and 14.93 µg/g of extract (Figure 2A). The antioxidant activity of FSE was found to be increasing in dose depending manner. As depicted in Figure 1B, the IC50 value as 50% radical scavenging activity was observed at 19 µg/mL of FSE (Figure 2B).
 |
Figure 2 Concentration of polyphenols in FSE and antioxidant activity. Abbreviations: FSE, fenugreek seed extract; TPC, total phenolic contents; TFC, total flavonoid contents; DPPH, 2,2-diphenyl-1-picrylhydrazyl; SEM, standard error mean. Notes: (A) TPC and TFC. (B) The antioxidant (DPPH scavenging) activity as percentage of DPPH radical inhibition and IC50 value (μg/mL). The data represented mean value cells ± SEM of three independent experiments. |
FSE Induced Cytotoxicity in MCF-7 and SKBR-3 Cells
The cell viability was evaluated on MCF-7 and SK-BR3 breast cancer cells by the cell cytotoxicity assay following 48 hours of treatment with various concentrations of FSE. As depicted in Figure 3, both of the cell lines responded to the anti-proliferative and cytotoxic effects of FSE in a dose-dependent manner. It induced the cell proliferation within the range of 1–10 µg/mL, whereas started the growth inhibition at 25 µg/mL of FSE in MCF–7 cells, and IC50 was observed at 150 µg/mL (Figure 3A). The induction of cell proliferation was recorded at only 1–2 µg/mL in SK-BR3 cells, though it initiated the cytotoxic effect of cell death at 5 µg/mL. The SK–BR3 cell showed potent cytotoxic activity as the IC50 was measured at 40 µg/mL (Figure 3B). This primary screening of both of the cells helped us to select the four different doses for each cell line for further studies that showed the viability of the cells from 90 to 50%. The four doses that showed IC10, IC25, IC35, IC50 for the MCF-7 and SK-BR3 cells were selected and designated as follows: 40 (IC10/FSE 40), 80 (IC25/FSE 80), 100 (IC35/FSE 100) and 150 µg/mL (IC50/FSE 150) and 10 (IC10/FSE 10), 20 (IC25/FSE 20), 30 (IC35/FSE 30) and 40 µg/mL (IC50/FSE 40), respectively.
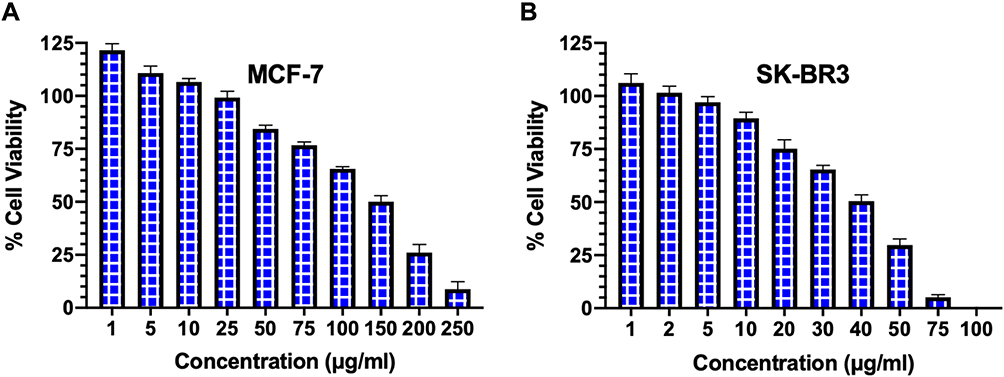 |
Figure 3 The analysis of cell viability by cell cytotoxicity assay. Notes: (A) MCF-7 and (B) SK–BR3 cells (1 × 10⁴) were treated with a range of FSE doses (0-250 μg/mL) for 48 hours in 96 well plates, and the percentage of cell viability was measured by cell cytotoxicity assay kit. Data represented mean percentages of viable cells ± SEM of three independent experiments. |
Effect of FSE on the Cell Morphology
Treatment of breast cancer cells with FSE induced morphological alterations that include the loss of attachment, membrane blebbing, cell shrinkage, substantiate the cells in the stages of apoptosis. The microscopic images showed that the changes could also be noticed in the MCF-7 cells exposed to FSE 40 µg/mL as compared to the control. It increased with the doses as ~50% of the cells were detached, having the rounded shape of the cells treated with FSE 150. Similarly, the increasing changes in the morphology of SK-BR3 were seen in a dose-dependent manner as only 25–30 cells were viable, exposed to FSE 40, whereas it appeared 90% viable cells treated with FSE 10 (Figure 4).
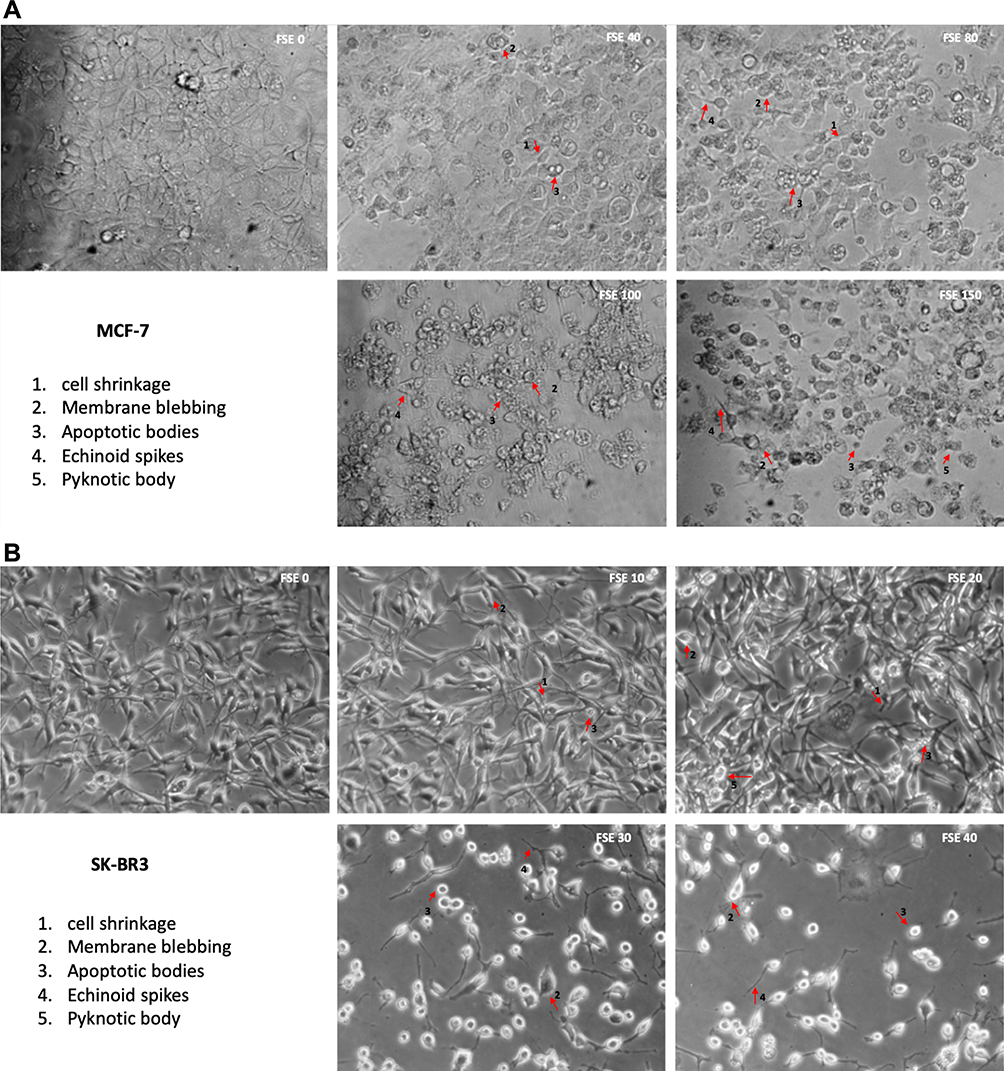 |
Figure 4 FSE induced morphological changes in breast cancer cells. Notes: (A) MCF-7 and (B) SK-BR3 cells (1 × 10⁵) were treated with indicated concentrations of FSE for IC10, IC25, IC35, and IC50 received from cell cytotoxicity assay for 48 hours in 12 well plates. The representative photomicrographs were obtained after 48 hours of the treatment using Optika inverted microscope (Magnification, 100X) and recorded using TBS-3 software. The arrows indicate the morphological changes in the cells as 1. Cell shrinkage, 2. Membrane blebbing, 3. Apoptotic bodies, 4. Echinoid spikes, and 5. Pyknotic body. |
FSE Induced the Inhibition of Cell Migration
The potential of FSE on the migration of both MCF-7 and SK-BR3 cells was studied using a wound-healing assay. The cells exposed to FSE 0 were migrated to the wound area, leading to ~64% healing after 48 hours, comparing the wound at 0 h. However, the significant dose-dependent inhibition of migration was seen among all the doses in both of the cells (Figure 5). As shown in Figure 4A, there was 21.5%, 38.4%, 49%, and 59.5% inhibition in migration in the MCF-7 cells treated with FSE 40, 80, 100 and 150 µg/mL, respectively (Figure 5A). Whereas it was estimated to be 5%, 30%, 35%, and 47% in the SK-BR3 cells exposed to 10, 20, 30, and 40 µg/mL of corresponding doses of FSE (Figure 5B).
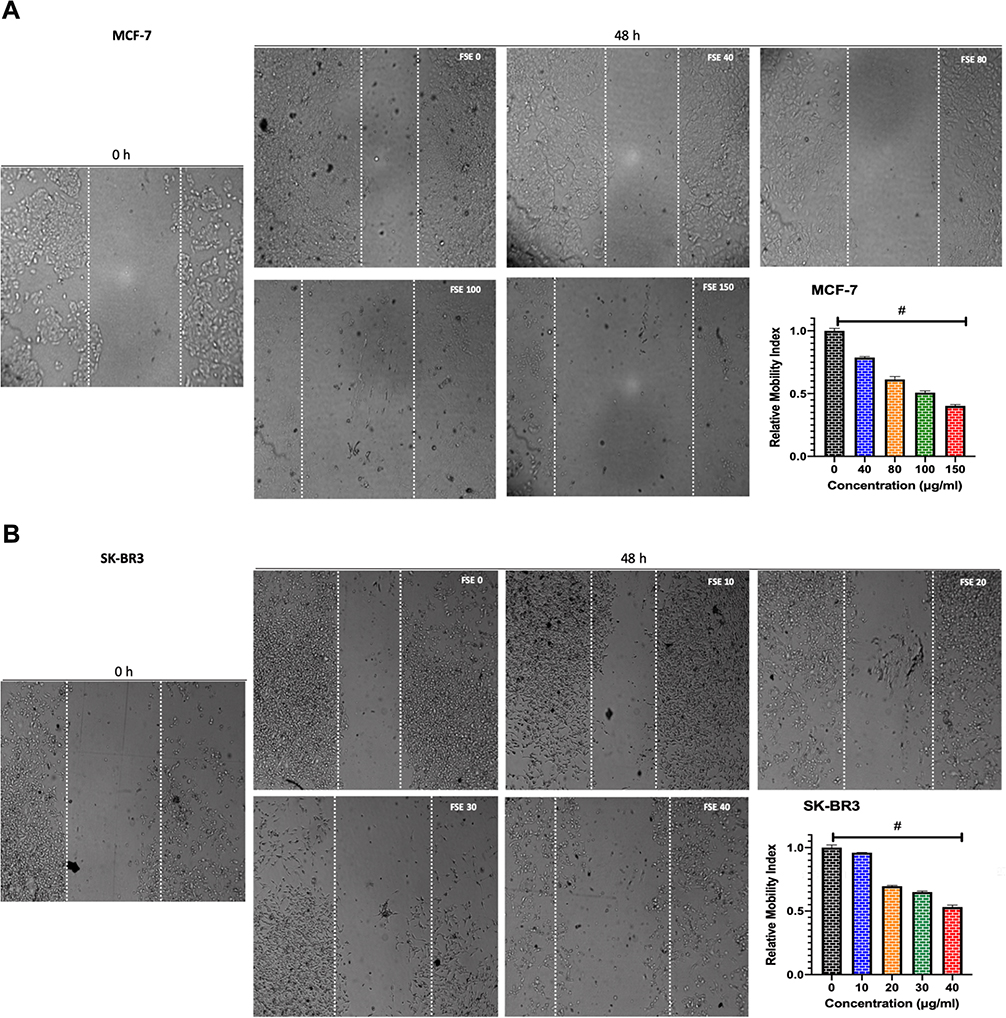 |
Figure 5 FSE inhibited metastatic properties of breast cancer cells by wound healing/scratch motility assay. Notes: (A) MCF-7 and (B) SK-BR3 cells (1 × 10⁵) were grown for 24 hours, followed by the treatment with selected concentrations as mentioned above for 48 hours in a 12 well plate. Photomicrographs were obtained after 0 and 48 hours of treatment using Optika inverted microscope (Magnification, 40X) and recorded using TBS-3 software. The representative images and analyses of wound healing assay as ± SEM of three independent experiments. Statistical differences were analyzed by Ordinary one-way ANOVA, Tukey’s multiple comparison test. #Significant difference between each treated group. |
Effect of FSE on Cell Adhesion
The crystal violet assay revealed the significant loss in the adherence of cells in both breast cancer cells treated with all the doses as compared to control. The significant loss of cell adherence was also investigated in MCF-7 as well as SK-BR3 cells within the doses. As depicted in Figure 6A, the 14.2, 35.4, 55.5, 76.5% loss in the cell adherence were detected in the MCF-7 cells treated with FSE at the odes of 40, 80, 100, and 150 µg/mL, respectively. It was assessed to be 14.75, 33.7, 55.2, and 79.5 in the SK-BR3 cells exposed to FSE at the corresponding doses of 10, 20, 30, and 40 µg/mL (Figure 6B).
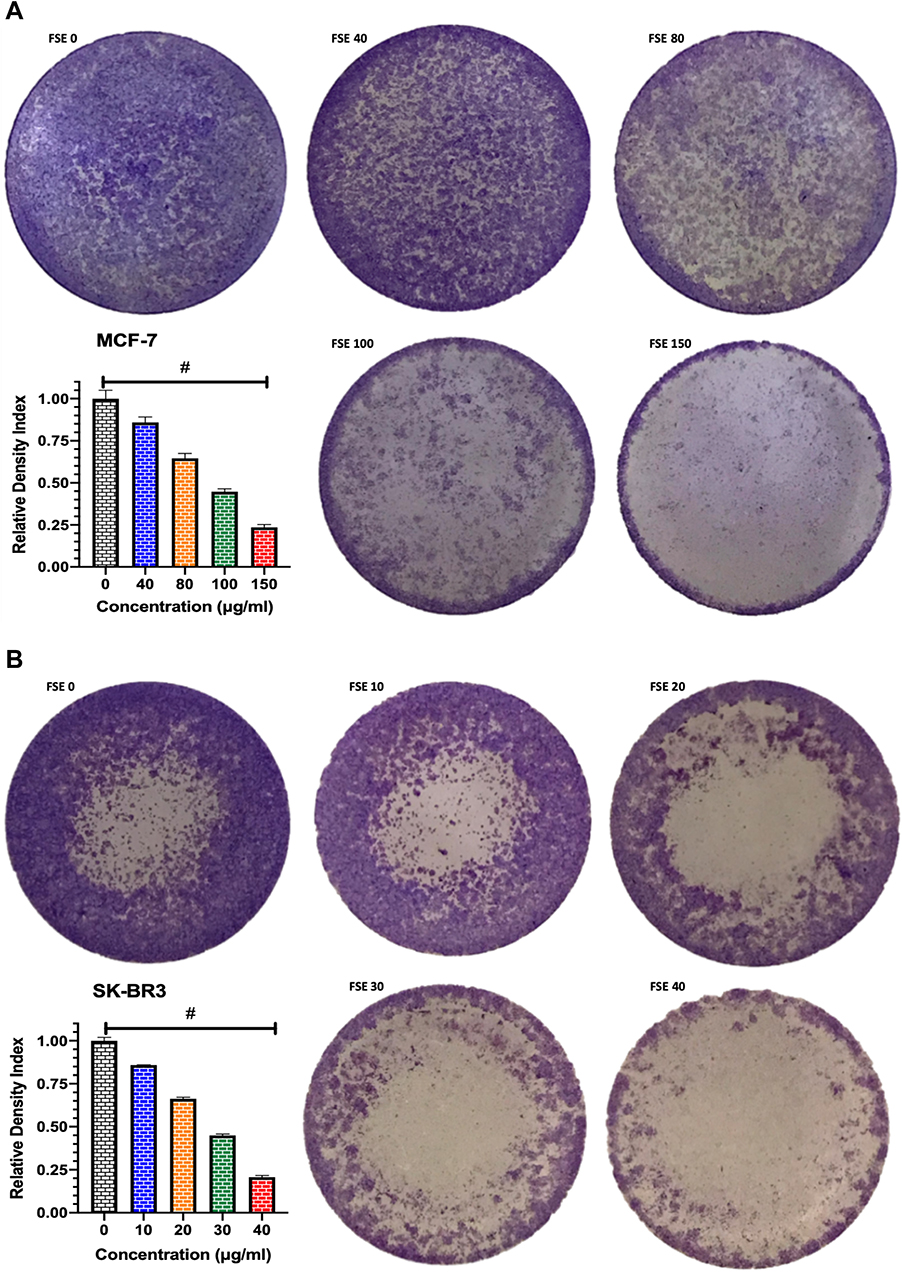 |
Figure 6 Effect of FSE on adhesion of breast cancer cells by crystal violet staining assay. Notes: (A) MCF-7 and (B) SK-BR3 cells (1 × 10⁵) were grown, followed by the treatment with selected concentrations, as mentioned above, for 48 hours in a 12 well plate. The representative images and density index of viable cells after being stained with 0.2% crystal violet as ± SEM of three independent experiments. Statistical differences were analyzed by Ordinary one-way ANOVA, Tukey’s multiple comparison test. #Significant difference between each treated group. |
Effect of FSE on Cell Apoptosis
The results indicated the changes in the percentage of early and late apoptotic cells in a dose-dependent manner. As depicted in Figure 7A, the 13.3% cells were found to be necrotic but no apoptosis in the MCF-7 cells exposed to FSE 40, whereas 11.6% necrotic cells, 8.81% early and 16.1% late apoptotic cells were estimated in FSE 80 treated cells. It was found only ~5% necrosis in the cells exposed to FSE 100 and FSE 150. Whereas an increase in apoptosis, as 12.5 and 12.8% late and 20.4, and 20.0% early apoptotic cells were recorded, respectively (Figure 7A). As shown in Figure 7B, the necrotic death was found to be 8.68, 16.5, and 10.8% in the SK-BR3 cells exposed to FSE 80, 100, and 150, respectively. Besides, the significant changes were also observed in the stages of apoptosis in a dose-dependent manner as 4.2, 8.84, and 13.2% early and 20.2, 34.3, and 48.3% late apoptosis were explored, correspondingly in the cells treated with FSE 80, 100, and 150.
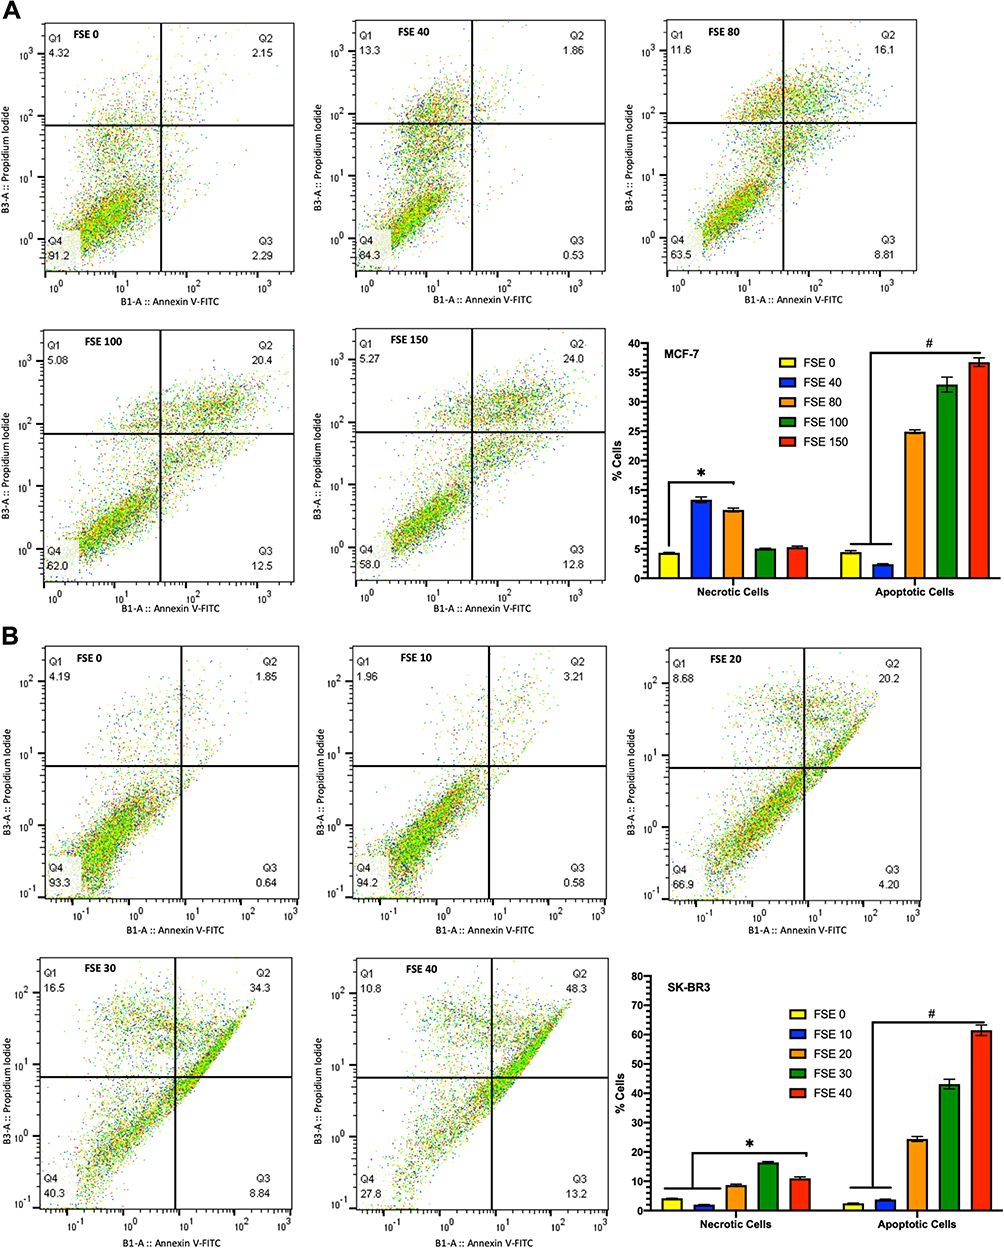 |
Figure 7 FSE induced apoptosis using Annexin V-FITC/PI by flow cytometry. Abbreviations: FITC, fluorescein isothiocyanate; PI, propidium iodide. Notes: (A) MCF-7 and (B) SK-BR3 cells (2.5 × 10⁵) were grown followed by the treatment with selected concentrations FSE, as mentioned above, for 48 hours in a 6 well plate. The representative changes in the proportion of cells were analyzed after staining the cells with Annexin V-FITC/PI by flow cytometry. The percentage of the viable (lower left; Annexin V–/PI–) necrotic (upper left; Annexin V–/PI+), early apoptosis (lower right; Annexin V+/PI–), and late apoptosis (upper right; Annexin V+/PI+) stages of FSE treated cells were evaluated by FlowJo software v10.7. The representative analyses of apoptosis as ± SEM of three independent experiments. Statistical differences were analyzed by Two-way ANOVA, Tukey’s multiple comparison test. #Significant difference between each treated group, *significant difference within the indicated groups. |
Effect FSE on Cell Cycle Analysis
The distribution of cell cycle analyses of the flow cytometry data revealed the continuous shift of cell cycle arrest in a dose-dependent manner in both of the breast cancer cells (Figure 8). The exposure of MCF-7 cells to the doses of IC10 (FSE 40) and IC25 (FSE 80) showed the accumulation of the proportion of cells in S-phase from 31.2% ± 1.7% to 44.3% ± 2.19% and 54.6% ± 1.29%, respectively. Whereas, the accumulation of the percentage of SK-BR3 cells exposed to the similar IC doses of FSE was changed in S-phase from 41.82% ± 2.18% to 64.267% ± 2.23% and 75.1% ± 2.67%, correspondingly. The robust cell cycle arrest was observed in G2/M and >G2 phases, as the cells were treated with IC35 and IC50. The proportion of the cells was accumulated in G2/M and >G2 phase from 22.4%±1.4% and 0.0 to 77.23%± 2.75% and 23.1%± 2.89% exposed to FSE 100, whereas it was found to be 70.33%±3.59% and 30.83%±2.74% in the cells treated with FSE 150, respectively. However, the cell cycle was arrested to 29.5%±1.49% and 10.2%±0.87% and 38.63%±1.06% and 6.5%±0.67% cells in G2/M & >G2 phase from 23.73%±1.48% and 0.0% exposed to IC35 and IC50 in SK-BR3 cells. These results suggested that FSE inhibited cellular proliferation via S, G2/M, as well as >G2 phase cell cycle arrest in a dose-dependent manner.
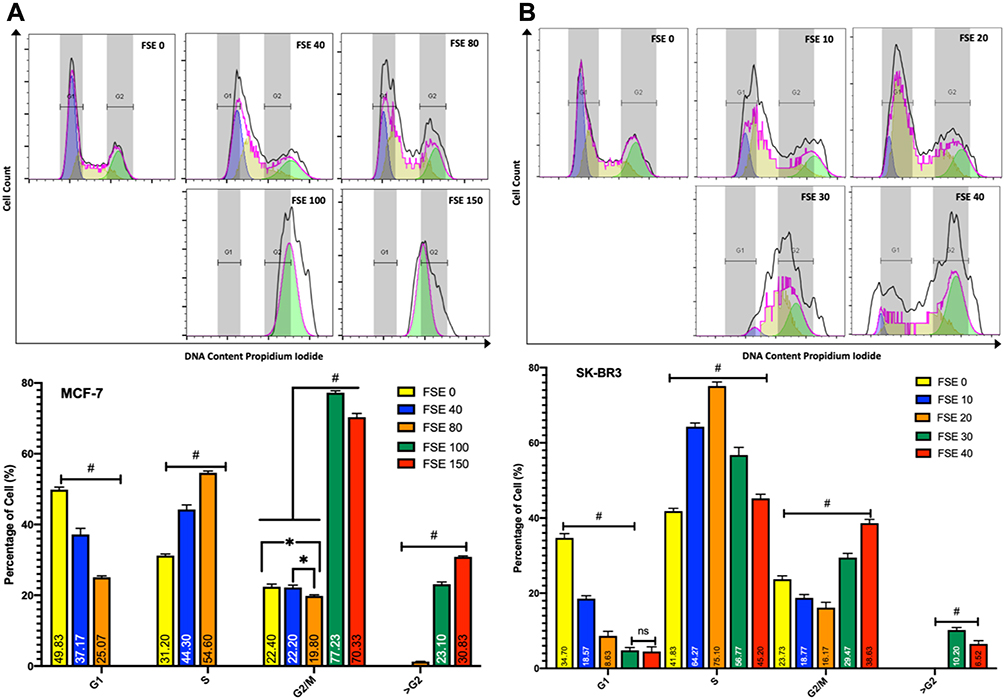 |
Figure 8 Effect of FSE on cell cycle distribution using PI by flow cytometry. Notes: (A) MCF-7 and (B) SK-BR3 cells (2.5 × 10⁵) were grown, followed by the treatment with the indicated concentrations for 48 hours in a 6 well plate. The changes in the cell cycle distribution using PI were analyzed by flow cytometry. The percentage of G1, S, G2/M, and >G2 phase distribution of FSE exposed cells was measured by FlowJo software v10.7. The representative analyses of the distribution of cells in the phases as ± SEM of three independent experiments. Statistical differences were analyzed by Two-way ANOVA, Tukey’s multiple comparison test. #Significant difference between each treated group, *significant difference within the indicated groups. |
FSE Reduced Mitochondrial Membrane Potential in a Dose-Dependent Manner in MCF-7 and SK-BR3 Cells
The TMRE fluorescence from the flow cytometry, as well as the confocal microscopic studies, showed the significantly increasing reduction in the MMP in all the selected doses in comparison to TMRE control and between the doses as well in both of the cells. The mean fluorescence intensity (MFI) by the flow cytometry was measured to be 1821, 1712, 1287, 988.3, and 581.7 in the MCF-7 cells exposed to FSE 0 (negative control), 40, 80, 100, and 150, respectively (Figure 9A). It was shown 894.7, 770, 299.7, 210.7, and 121.3 in SK-BR3 cells treated with FSE 0 (negative control), 40, 80, 100, and 150, correspondingly (Figure 9B).
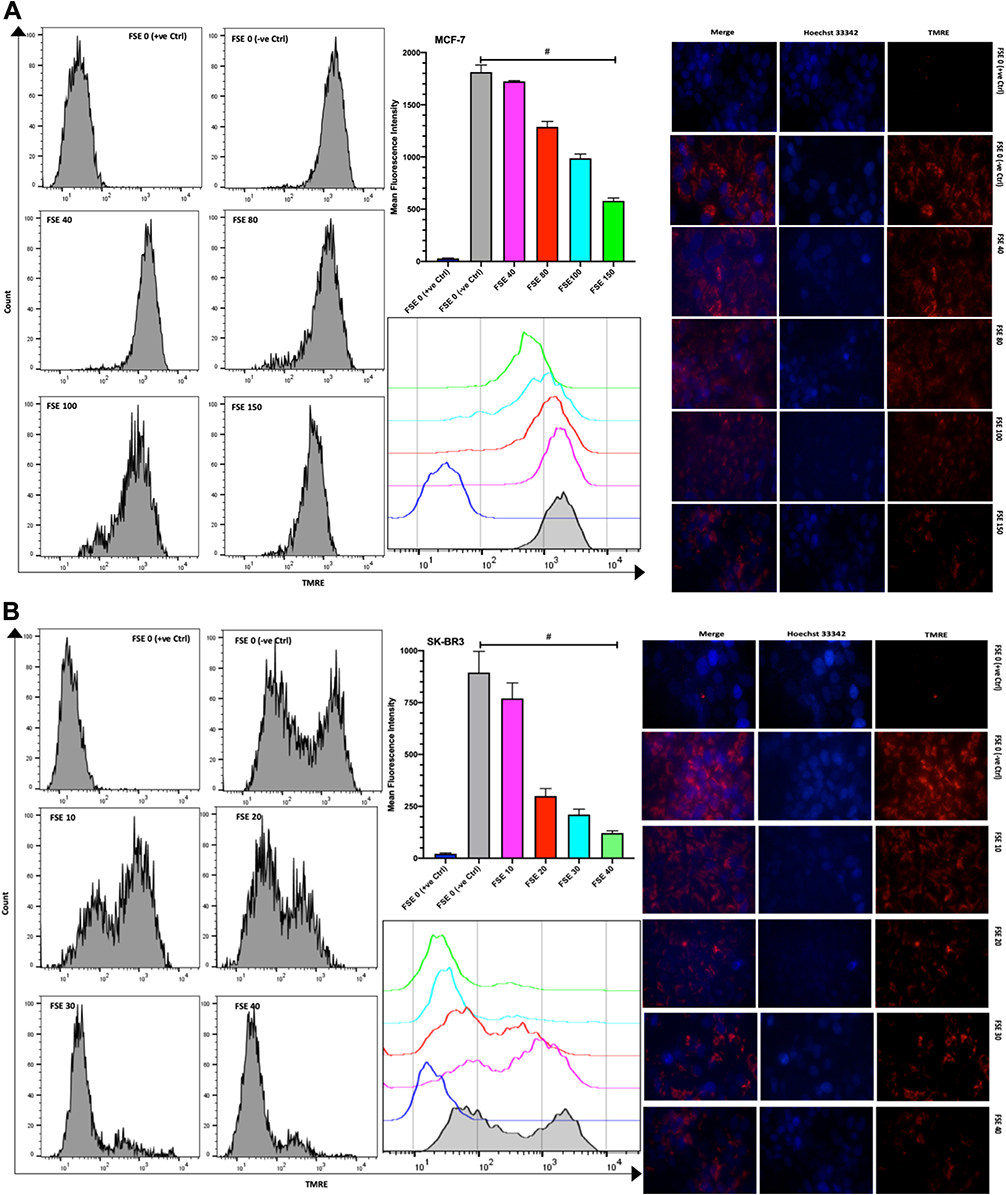 |
Figure 9 Effect of FSE on mitochondrial membrane potential (MMP or ΔΨm). (A) MCF-7 and (B) SK-BR3 cells (2.5 × 10⁵ cells for flow cytometry and 5 × 10⁴ cells for confocal microscopy) were grown, followed by the treatment with the specified concentrations for 48 hours in 6 well and 24 well plates, respectively. The ΔΨm of the cells was measured quantitatively and qualitatively using TMRE by the flow cytometry and confocal microscopy (Magnification, 300X), correspondingly. The representative images and analyses of ΔΨm as ± SEM of three independent experiments. Statistical differences were analyzed by Ordinary one-way ANOVA, Tukey’s multiple comparison test. #Significant difference between each treated group. The FCCP (20 µM) was added 10 minutes prior to staining with TMRE in FSE 0 (+ve Ctrl) treated cells. Abbreviations: TMRE, tetramethylrhodamine, ethyl ester; FCCP, carbonyl cyanide 4-(trifluoromethoxy) phenylhydrazone. |
FSE Induced ROS Potential in a Dose-Dependent Manner in MCF-7 and SK-BR3 Cells
The DCFDA fluorescence from the flow cytometry, as well as confocal microscopic studies, suggested the significant continuous rise in the ROS in all the selected doses as compared to the controls. The mean fluorescence intensity (MFI) of DCFDA by the flow cytometry was estimated to be 563, 728, 746.7, 788.3, and 815 in the MCF-7 cells exposed to FSE 0, 40, 80, 100, and 150, respectively (Figure 10A). It showed 319.3, 468, 526.3, 629, and 706.3 in SK-BR3 cells treated with FSE 0, 40, 80, 100, and 150, correspondingly (Figure 10B).
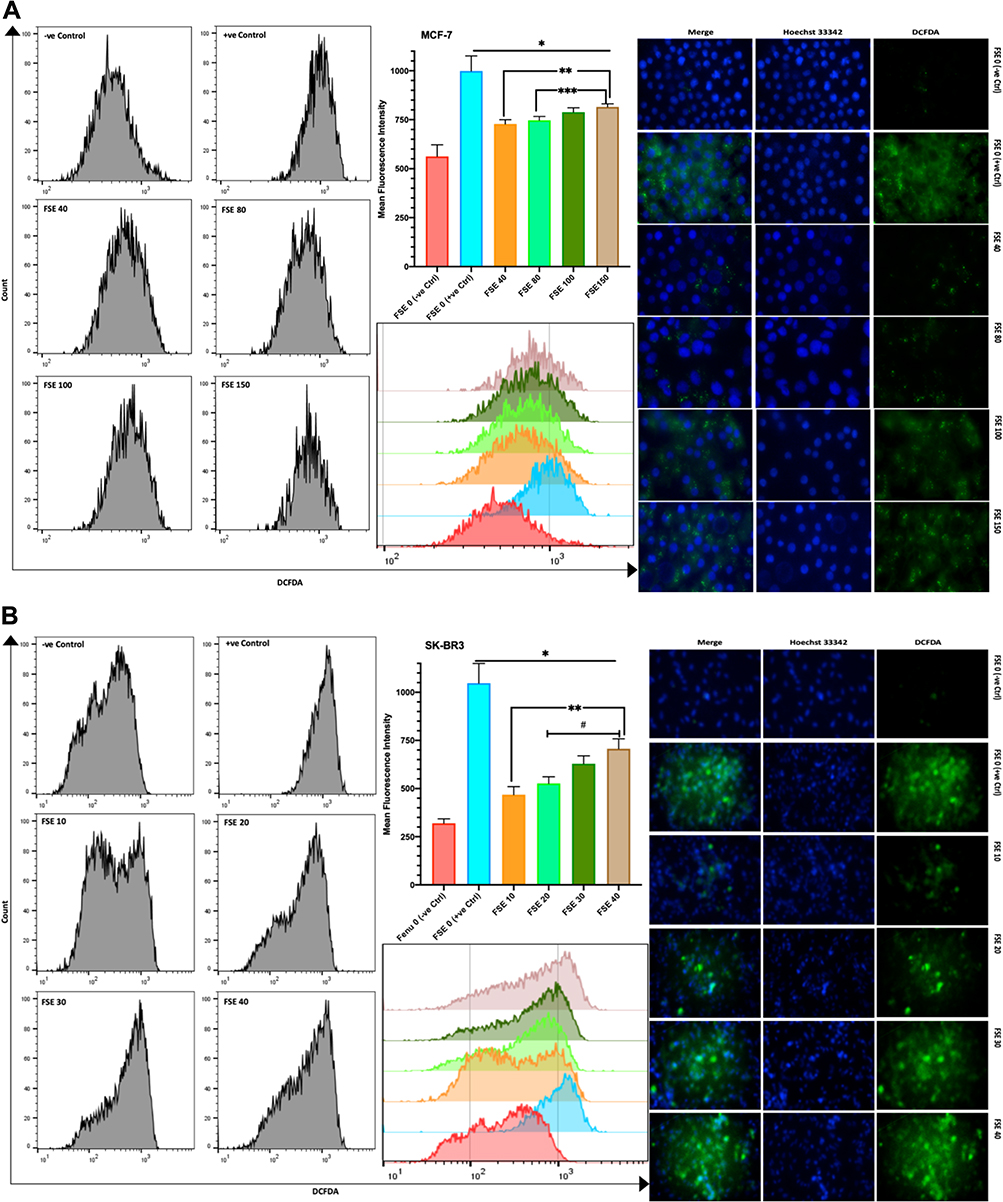 |
Figure 10 Effect of FSE on the generation of reactive oxygen species (ROS). Abbreviations: DCFDA, 2ʹ,7ʹ-dichlorofluorescin diacetate; TBHP, tert-butyl hydrogen peroxide. Notes: (A) MCF-7 and (B) SK-BR3 cells (2.5 × 10⁵ cells for flow cytometry and 5 X 10⁴ cells for confocal microscopy) were grown, followed by the treatment with the specified concentrations for 48 hours in 6 well and 24 well plates, respectively. The induction of ROS by FSE in the cells was measured quantitatively and qualitatively using DCFDA by flow cytometry and confocal microscopy (Magnification, 300X), correspondingly. The representative images and analyses of ROS generation as ± SEM of three independent experiments. Statistical differences were analyzed by Ordinary one-way ANOVA, Tukey’s multiple comparison test. *Significant difference vs FSE (+ve Ctrl), **significant difference vs FSE 10 and 40, ***significant difference vs FSE 80, #significant difference between each treated group. The TBHP (50 µM) was added 4 hours prior to staining with DCFDA in FSE 0 (+ve Ctrl) treated cells. |
FSE Increased Bax/Bcl-2 Ratio via p53 Signaling Pathway in MCF-7 and SK-BR3 Cells
The Western blotting analysis revealed the upregulation of p53 dose-dependently in both breast cancer cells as it was measured up to >3-fold increase as compared to the untreated control. The expression of p21 was found unchanged in both of the cells exposed to the concentration of IC10 and IC25. Though it was observed more than 3-fold and 1.7 to 2.2-fold increase in MCF-7 and SK-BR3, respectively, exposed to IC35 and IC50 (Figure 11). FSE increased the ratio of Bax/Bcl-2, inducing the mitochondrial-associated apoptotic cell death, as the downregulation in the expression of Bcl-2 and the elevation in the level of Bax were observed in both of the breast cancer cells (Figure 11).
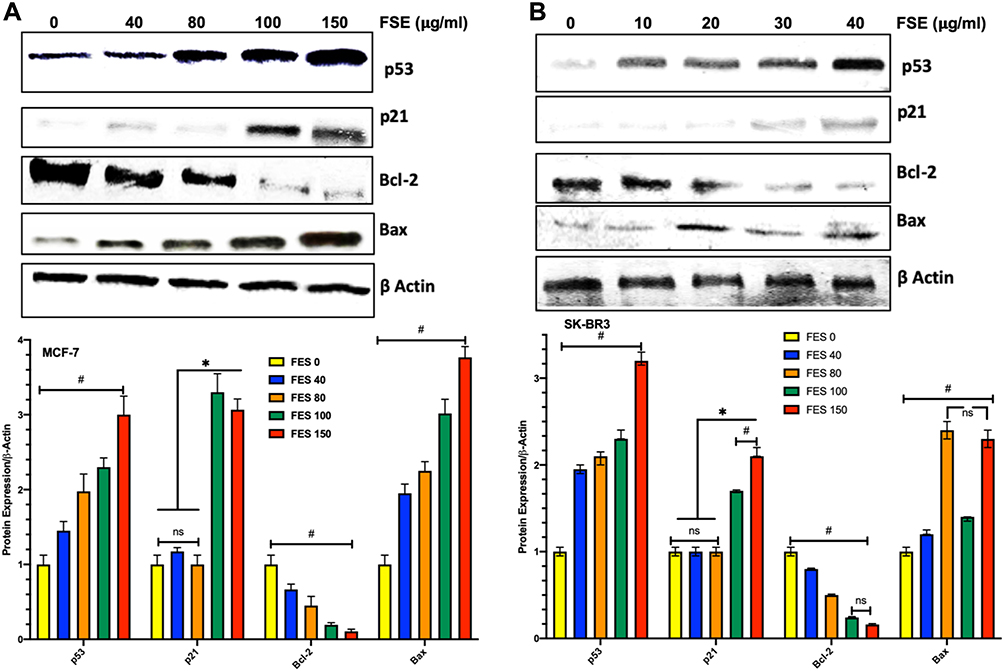 |
Figure 11 Effect of FSE on p53 signaling using the Western blotting. Notes: (A) MCF-7 and (B) SK-BR3 cells (1 × 10⁶) were treated with indicated concentrations of FSE for 48 hours in 100 mm plates. The cells were lysed to isolate the whole-cell protein for immunoblotting using antibodies specific for p53, p21, Bax, Bcl-2, and β-actin. The data are shown as the mean ± SEM of triplicate experiments. Statistical differences were analyzed by Two-way ANOVA, Tukey’s multiple comparison test. *Significant difference vs FSE 0, 40, and 80, #significant difference between each treated group. |
In vivo Oral Toxicity Study
As shown in Table 2, no toxic symptom or mortality was observed during the experimental period of 14 days in the animals monitored following administration of FSE at 5000 mg/kg body weight. However, the piloerection, blinking of the eyes, rapid heartbeat were noticed in the first 6 hours after the exposure of FSE, but later become normal (Table 2). The data revealed the normal growth of all the animals as the average body was calculated to be 29.3 g and 27.9 g in vehicle and FSE treated animals, respectively (Figure 12A). As depicted in Figure 11B-F, no significant changes were measured in the relative weight of vital organs in comparison to vehicle-treated control mice. The biochemical analysis in the serum also showed no significant differences in the level of ALT, AST, ALP, and TBIL as well (Figure 13).
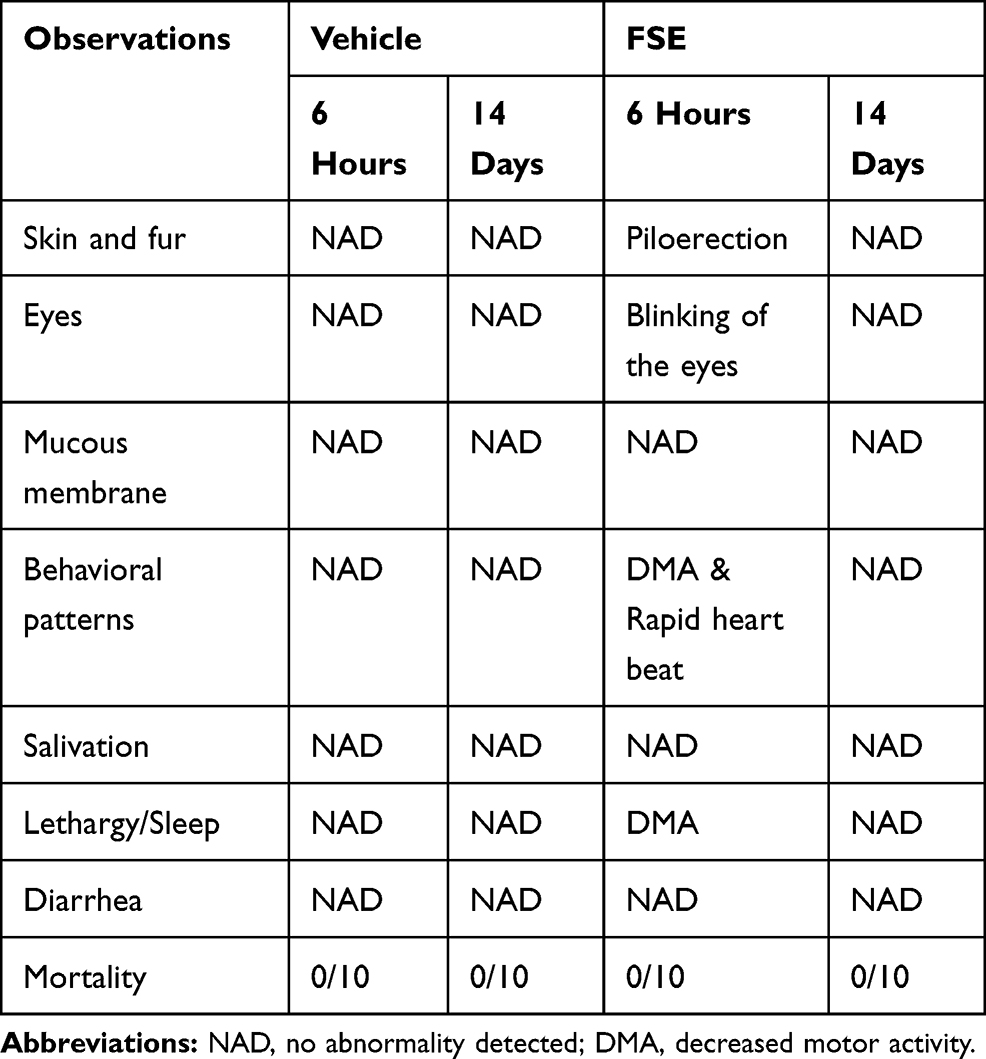 |
Table 2 General Appearance and Behavioral Observations of Oral Acute Toxicity Study for Vehicle and FSE Treated Groups |
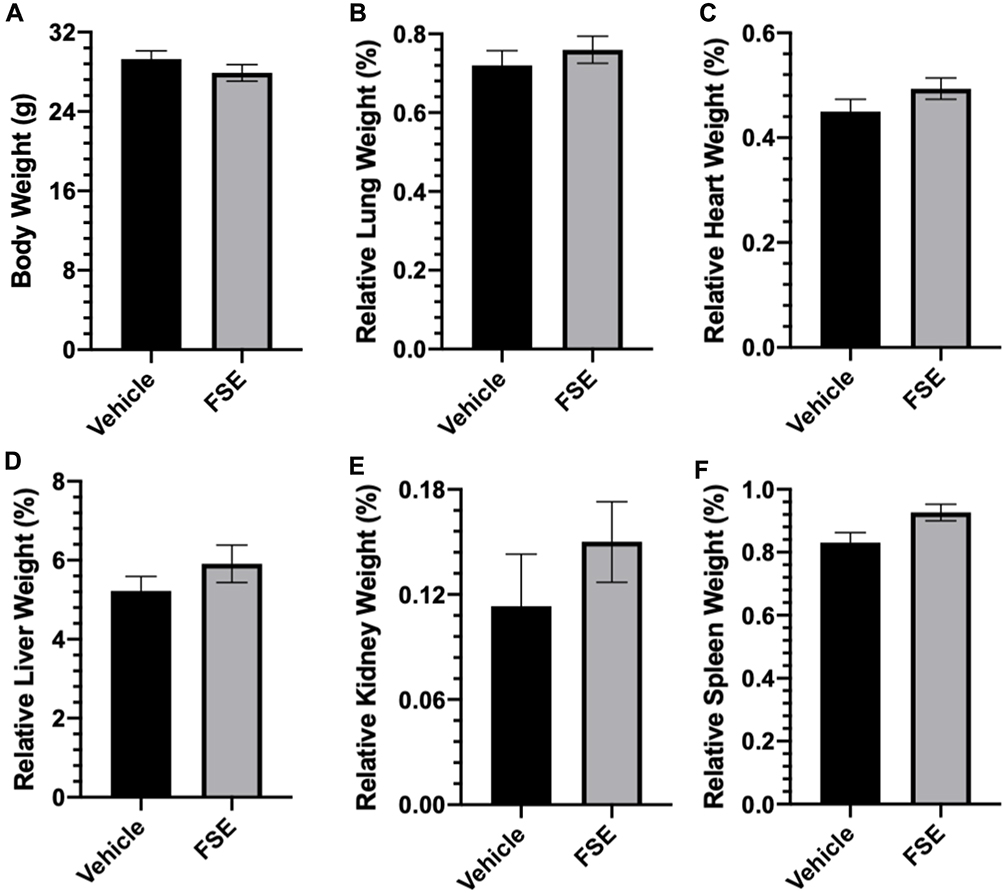 |
Figure 12 Effect of FSE on body weight and relative organs weight (ROW). Abbreviations: RLW, relative lung weight; RHW, relative heart weight; RLvW, relative liver weight; RKW, relative kidney weight; RSW, relative spleen weight. Notes: (A) The mice were weighed at the start of the experiment followed by every other day and before sacrifice, (B) RLW, (C) RHW, (D) RLvW, (E) RKW and (F) RSW. The relative organs weight were measured using the formula as described in materials and methods after sacrificing the mice at the end of the experiment. The values are expressed as ± SEM of six mice for each group. |
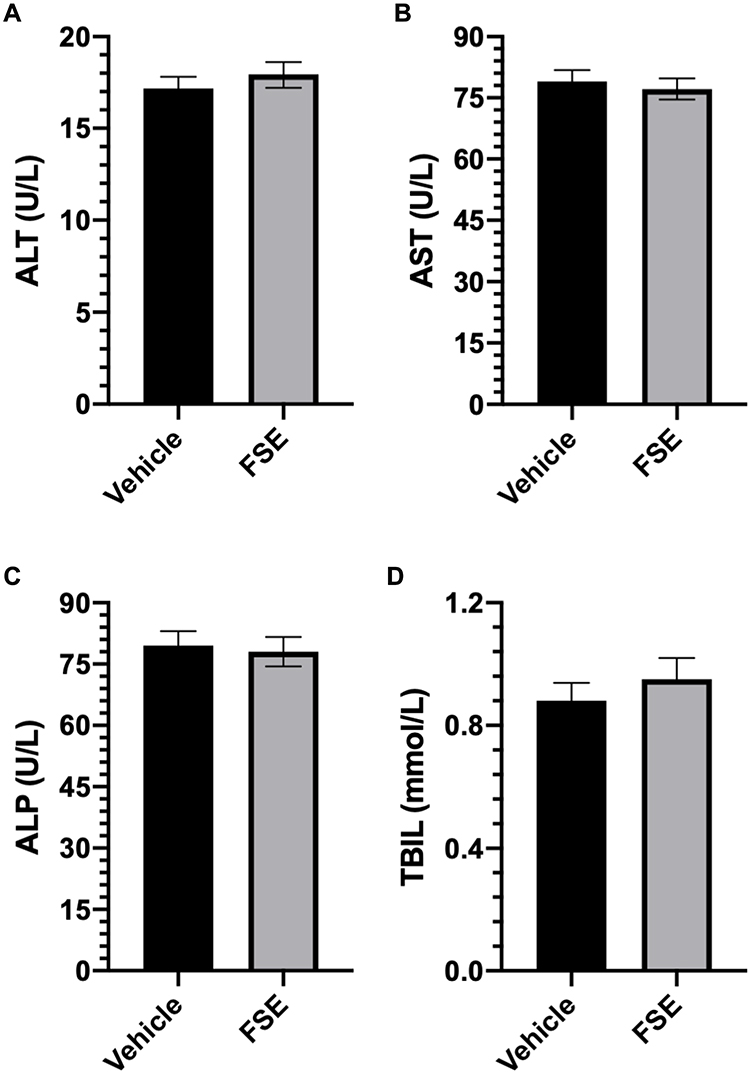 |
Figure 13 Effect of FSE on biochemical parameters. Abbreviations: ALT, alanine aminotransferase; AST, aspartate aminotransferase; ALP, alkaline phosphatase; TBIL, total bilirubin levels. Notes: (A) ALT, (B) AST, (C) ALP, and (D) TBIL. The level of the enzymes was detected colorimetrically in the serum using the kits. The values are expressed as ± SEM of three independent experiments. |
Discussion
In recent years, the use of herbal medicines in the treatment of various diseases has received widespread attention as several traditional medicinal plants have now been well documented as “treasure trove” of secondary metabolites. We demonstrated the difference of sensitivity in cell lines as FSE showed 40 μg/mL and 150 μg/mL IC50 in the SK-BR3 and MCF-7 breast cancer cells, respectively. The growth-inhibitory sensitivity of FSE and diosgenin was also reported in DU-145, PC-3, LNCaP prostate cancer (PCa), and MDA-MB-231 breast cancer cells,37 A549 lung cancer,38 HT-29 colon adenocarcinoma cell lines.28 Remarkably, to date, no detailed studies have tested the effect of FSE on breast cancer cells. To the best of our knowledge, this is the first study of the function and mechanism of action of FSE in breast cancer cells. However, some studies showed the induction of apoptosis via Caspase-3, p53 activation, and the inhibition of Akt by FSE or diosgenin, but the results were supportive to the conclusion.39,40
The leading cause of breast cancer-associated mortality is distant metastasis, involving migration, adhesion, and invasion. The migration of cancer cells is an essential initial step in the process of metastasis. The FSE showed the anti-metastatic effect by reducing the healing in a dose-dependent manner in both MCF-7 and SK-BR3 breast cancer cells. Subsequently, the detachment of cells and the relative density index of crystal violet demonstrated cell adherence by the effect of FSE (Figures 4 and 6). Noticeably, no study so far exhibited the anti-metastatic potential of FSE or its active constituent against any cancer cell.
The apoptotic morphology was detected in the FSE exposed cells, more prominently as showing condensed nuclei, cell shrinkage, membrane blebbing, apoptotic bodies, and echinoid spikes as well (Figure 3). The proportion of the cell death via necrosis, early and late apoptosis was analyzed by the flow cytometry using Annexin V-FITC/PI, showing FSE-induced apoptosis in a dose-dependent manner. There was a significant increase in the percentage of late apoptosis in the cells treated with IC35 and IC50 doses. The distribution of cells was measured by cell cycle analysis using the flow cytometry to elucidate the molecular mechanism of apoptosis. Interestingly, we observed a dose-dependent S, G2/M, and polyploidy in cell cycle arrest following exposure with FSE, as illustrated in Figure 14. The data revealed the difference in the cell cycle arrest by FSE from a previously published report using different cancer cells. It showed the variation in the cell cycle as significant, sub-G1 and G2/M phase in PC-3 and LNCaP prostate cancer cells,37 sub-G1 and G1 in hepatocellular HepG2 cells41 were arrested, while exposed to methanolic fenugreek seeds extract. Our data revealed the accumulation of ~44 and 55% in MCF-7, and 75 and 56% in SK-BR3 cells in the S-phase, treated with IC10 and IC25, respectively. As most of the cells arrested in S-phase, accompanied by the reduction in the number of cells in G1, here we focused on interpreting the cell cycle arrest in S-phase at these concentrations. As the cells are exposed to stress, DNA may be damaged while cells attempt to replicate it. It is said that the S-phase checkpoint, comparatively not as sensitive as G1 or G2/M, does not arrest the cell cycle progression, but the extent of the duration.42 The results of the present study have made it interesting, as the behavior of the cell cycle arrest was changed with the doses that significantly lead to apoptosis. However, several studies reported the S–phase arrest by inhibiting the chromatin assembly, activating p53 mediated pathway.43–48 The p53-associated blockade of DNA synthesis may prevent the generation and propagation of additional DNA damage, as the failure to arrest DNA synthesis is lethal to the cells (Figure 14). Then, the cells may either repair the damaged DNA or undergo apoptosis before entering to next cell cycle.49,50 As depicted in Figure 7, about 27% MCF-7 and 25% SK-BR3 apoptotic cells were detected when exposed to IC25. The Western blotting analysis revealed the upregulation of p53, whereas no change in the expression of p21 was detected in the cells treated with the same doses (Figure 11). The unaltered expression of p21 may be assumed in the S-phase arrest as it could be an essential requirement for efficient restart of DNA synthesis.51,52 The mitochondrial-associated apoptotic pathway may be induced by intra-and extracellular stress and is dependent on mitochondrial outer membrane permeabilization. The loss in the MMP leads to the release of cytochrome c is taken by cells to activate apoptotic machinery.53,54 The continuous loss of MMP was measured in both cells exposed to varying doses of FSE, by TMRE using the flow cytometry, as well as confocal microscopy (Figure 9). The proto-oncoprotein BCl-2 appears to be a potent antagonist of MMP, makes the Bcl-2/Bax ratio a critical determinant of a cell’s threshold for undergoing apoptosis through the mitochondrial pathway.55 The data revealed significant increase in the expression of Bax, while the decrease in Bcl-2, leading to apoptosis in both of the cells exposed to FSE in a dose-dependent manner (Figure 11). Several studies suggested the selective toxicity of chemotherapeutic drugs through MMP pathways, as it played a critical role in the oxidative signaling, generation of ROS.56–59 Here, we observed the increasing level of ROS in a concentration-dependent manner in both cells, as it could be critical to FSE-induced cell cycle arrest and apoptosis as well (Figures 10 and 14).
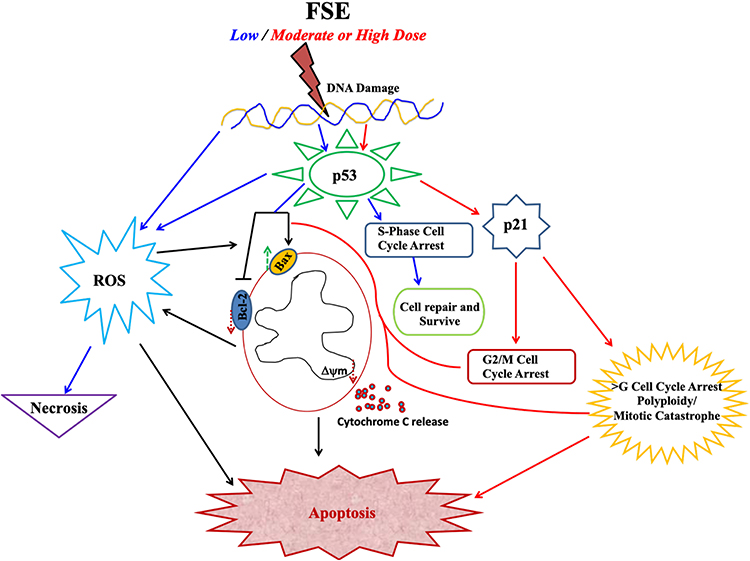 |
Figure 14 Schematic illustration of FSE induced dose-dependent signaling pathways. |
Furthermore, the accumulation of 100% MCF-7 and more than 40% SK–BR3 cells was measured in G2/M and polyploidy when exposed to IC35 and IC50, respectively. The mitotic catastrophe or mitotic slippage could be occurred due to the aberrant G2/M transition before the completion of DNA replication.60 It requires the Cdk1 activation, but the early entry of the Cdk1/cyclin B1 complex instigates premature chromatin condensation followed by apoptosis.61–65 Several studies suggested that the activation of Cdk1 can induce mitochondrial membrane permeabilization by phosphorylating BAD at Ser128. Subsequently, BAD can translocate to mitochondria, antagonizes Bcl-2, induces Bax, and then induces apoptosis after missing the interaction with 14-3–3 proteins.66,67 Besides, the p53 can indirectly increase the Cdk1 activity through the activation of Bax and Puma, thus inducing mitochondrial apoptosis.68,69 It has been reported that the presence of p53, polyploidy triggers the activation of p21 followed by cell death, which suggests p21 as one of the critical target genes in this perspective.70–72 The expression of p21 was also observed in both cells treated with IC35 and IC50. Thus, p21 independent, as well as dependent behavior of the cells was noticed in a dose-dependent manner in both of the breast cancer cells (Figures 11 and 14).
Several studies suggested that the absorption of toxins in the gastrointestinal tract change the body, relative organs weight, and hematopoietic system as well.73–76 The in vivo toxicological studies data revealed no clinical toxic sign of 5000 mg/kg FSE as revealed from behavioral pattern, mortality, body weight, relative vital organs weight, and biochemical analysis. According to the chemical labeling and classification of acute systemic toxicity recommended by OECD, the FSE was given class 5 status (LD50>5,000 mg/kg) which was the lowest category of toxicity.36
Conclusions
The present study demonstrated the molecular mechanism of the anti-cancer effect of FSE in breast cancer cells. The current study clearly indicates the induction of apoptosis by FSE through multiple signaling pathways. Further analysis is required to understand the detailed involvement of the signaling pathway. The FSE may be a potential anti-cancer agent in combination with chemotherapeutic agents. The nontoxic effect of FSE in mice suggests to utilize it safely for pharmaceutical formulations in different cancer systems. However, detailed toxicity studies are needed to understand the effect of FSE on animal fetus, pregnant, and their reproductive capacity.
Acknowledgments
The authors gratefully acknowledge the Deanship of Scientific Research, Qassim University, Buraydah, Saudi Arabia for the financial support for this research under the Grant # [cams-2018-1-14-S-5212] during the academic year 2018.
Disclosure
The authors report no conflicts of interest in this work.
References
1. Gray A, Dang BN, Moore TB, et al. A review of nutrition and dietary interventions in oncology. SAGE Open Med. 2020;8:2050312120926877. doi:10.1177/2050312120926877
2. Liu RH. Potential synergy of phytochemicals in cancer prevention: mechanism of action. J Nutr. 2004;134(12 Suppl):3479s–3485s. doi:10.1093/jn/134.12.3479S
3. Kaefer CM, Milner JA. Herbs and spices in cancer prevention and treatment. In: Benzie IFF, Wachtel-Galor S, editors. Herbal Medicine: Biomolecular and Clinical Aspects. 2nd edition. Boca Raton (FL): CRC Press/Taylor & Francis; 2011:Chapter 17. Available from: www.ncbi.nlm.nih.gov/books/NBK92774/.
4. Birt DF, Pelling JC, Nair S, et al. Diet intervention for modifying cancer risk. Prog Clin Biol Res. 1996;395:223–234.
5. Goodwin JS, Brodwick M. Diet, aging, and cancer. Clin Geriatr Med. 1995;11(4):577–589. doi:10.1016/S0749-0690(18)30258-1
6. Pal D, Banerjee S, Ghosh AK. Dietary-induced cancer prevention: an expanding research arena of emerging diet related to healthcare system. J Adv Pharm Technol Res. 2012;3(1):16–24. doi:10.4103/2231-4040.93561
7. Newman DJ, Cragg GM. Natural products as sources of new drugs over the nearly four decades from 01/1981 to 09/2019. J Nat Prod. 2020;83(3):770–803. doi:10.1021/acs.jnatprod.9b01285
8. El Bairi K, Ouzir M, Agnieszka N, et al. Anticancer potential of Trigonella foenum graecum: cellular and molecular targets. Biomed Pharmacother. 2017;90:479–491. doi:10.1016/j.biopha.2017.03.071
9. Nagulapalli Venkata KC, et al. A small plant with big benefits: fenugreek (Trigonella foenum-graecum Linn.) for disease prevention and health promotion. Mol Nutr Food Res. 2017;61(6).
10. Yadav UCS, Baquer NZ. Pharmacological effects of Trigonella foenum-graecum L. in health and disease. Pharm Biol. 2014;52(2):243–254. doi:10.3109/13880209.2013.826247
11. Parvizpur A, Ahmadiani A, Kamalinejad M. Probable role of spinal purinoceptors in the analgesic effect of Trigonella foenum (TFG) leaves extract. J Ethnopharmacol. 2006;104(1–2):108–112. doi:10.1016/j.jep.2005.08.057
12. Kaviarasan S, Sundarapandiyan R, Anuradha CV. Protective action of fenugreek (Trigonella foenum graecum) seed polyphenols against alcohol-induced protein and lipid damage in rat liver. Cell Biol Toxicol. 2008;24(5):391–400. doi:10.1007/s10565-007-9050-x
13. Kumar P, Bhandari U. Protective effect of Trigonella foenum-graecum Linn. on monosodium glutamate-induced dyslipidemia and oxidative stress in rats. Indian J Pharmacol. 2013;45(2):136–140. doi:10.4103/0253-7613.108288
14. Zhang H, Xu J, Wang M, et al. Steroidal saponins and sapogenins from fenugreek and their inhibitory activity against α-glucosidase. Steroids. 2020;161:108690. doi:10.1016/j.steroids.2020.108690
15. Petit PR, Sauvaire YD, Hillaire-Buys DM, et al. Steroid saponins from fenugreek seeds: extraction, purification, and pharmacological investigation on feeding behavior and plasma cholesterol. Steroids. 1995;60(10):674–680. doi:10.1016/0039-128X(95)00090-D
16. Stark A, Madar Z. The effect of an ethanol extract derived from fenugreek (Trigonella foenum-graecum) on bile acid absorption and cholesterol levels in rats. Br J Nutr. 1993;69(1):277–287. doi:10.1079/BJN19930029
17. Yoshikawa M, Murakami T, Komatsu H, et al. Medicinal foodstuffs. IV. Fenugreek seed. (1): structures of trigoneosides Ia, Ib, IIa, IIb, IIIa, and IIIb, new furostanol saponins from the seeds of Indian Trigonella foenum-graecum L. Chem Pharm Bull (Tokyo). 1997;45(1):81–87.
18. Sauvaire Y, Ribes G, Baccou J-C, et al. Implication of steroid saponins and sapogenins in the hypocholesterolemic effect of fenugreek. Lipids. 1991;26(3):191–197. doi:10.1007/BF02543970
19. Moorthy R, Prabhu KM, Murthy PS. Mechanism of anti-diabetic action, efficacy and safety profile of GII purified from fenugreek (Trigonella foenum-graceum Linn.) seeds in diabetic animals. Indian J Exp Biol. 2010;48(11):1119–1122.
20. Naicker N, Nagiah S, Phulukdaree A, et al. Trigonella foenum-graecum Seed Extract, 4-hydroxyisoleucine, and metformin stimulate proximal insulin signaling and increase expression of glycogenic enzymes and GLUT2 in HepG2 Cells. Metab Syndr Relat Disord. 2016;14(2):114–120. doi:10.1089/met.2015.0081
21. Vijayakumar MV, Singh S, Chhipa RR, et al. The hypoglycaemic activity of fenugreek seed extract is mediated through the stimulation of an insulin signalling pathway. Br J Pharmacol. 2005;146(1):41–48. doi:10.1038/sj.bjp.0706312
22. Xue WL, Li XS, Zhang J, et al. Effect of Trigonella foenum-graecum (fenugreek) extract on blood glucose, blood lipid and hemorheological properties in streptozotocin-induced diabetic rats. Asia Pac J Clin Nutr. 2007;16(Suppl 1):422–426.
23. Belguith-Hadriche O, Bouaziz M, Jamoussi K, et al. Comparative study on hypocholesterolemic and antioxidant activities of various extracts of fenugreek seeds. Food Chem. 2013;138(2–3):1448–1453. doi:10.1016/j.foodchem.2012.11.003
24. Hozzein WN, Saleh AM, Habeeb TH, et al. CO2 treatment improves the hypocholesterolemic and antioxidant properties of fenugreek seeds. Food Chem. 2020;308:125661. doi:10.1016/j.foodchem.2019.125661
25. Hegazy MG, Emam MA. Ethanolic extract of Trigonella Foenum Graecum attenuates cisplatin-induced nephro- and hepatotoxicities in rats. Cell Mol Biol (Noisy-Le-Grand). 2015;61(7):81–87.
26. Das S, Dey KK, Dey G, et al. Antineoplastic and apoptotic potential of traditional medicines thymoquinone and diosgenin in squamous cell carcinoma. PLoS One. 2012;7(10):e46641. doi:10.1371/journal.pone.0046641
27. Jagadeesan J, Nandakumar N, Rengarajan T, et al. Diosgenin, a steroidal saponin, exhibits anticancer activity by attenuating lipid peroxidation via enhancing antioxidant defense system during NMU-induced breast carcinoma. J Environ Pathol Toxicol Oncol. 2012;31(2):121–129. doi:10.1615/JEnvironPatholToxicolOncol.v31.i2.40
28. Raju J, Patlolla JMR, Swamy MV, et al. Diosgenin, a steroid saponin of Trigonella foenum graecum (Fenugreek), inhibits azoxymethane-induced aberrant crypt foci formation in F344 rats and induces apoptosis in HT-29 human colon cancer cells. Cancer Epidemiol Biomarkers Prev. 2004;13(8):1392–1398.
29. Amin A, Alkaabi A, Alfalasi S, et al. Chemopreventive activities of (Fenugreek) against breast cancer. Cell Biol Int. 2005;29(8):687–694. doi:10.1016/j.cellbi.2005.04.004
30. Alsemari A, Alkhodairy F, Aldakan A, et al. The selective cytotoxic anti-cancer properties and proteomic analysis of Trigonella Foenum-Graecum. BMC Complement Altern Med. 2014;14(1):114. doi:10.1186/1472-6882-14-114
31. Skehan P, Storeng R, Scudiero D, et al. New colorimetric cytotoxicity assay for anticancer-drug screening. J Natl Cancer Inst. 1990;82(13):1107–1112. doi:10.1093/jnci/82.13.1107
32. Singleton VL, Orthofer R, Lamuela-Raventós RM. [14] Analysis of total phenols and other oxidation substrates and antioxidants by means of folin-ciocalteu reagent. In: Packer L, editor. Methods in Enzymology. Academic Press; 1999:152–178.
33. Quettier-Deleu C, Gressier B, Vasseur J, et al. Phenolic compounds and antioxidant activities of buckwheat (Fagopyrum esculentum Moench) hulls and flour. J Ethnopharmacol. 2000;72(1–2):35–42. doi:10.1016/S0378-8741(00)00196-3
34. Sharma OP, Bhat TK. DPPH antioxidant assay revisited. Food Chem. 2009;113(4):1202–1205. doi:10.1016/j.foodchem.2008.08.008
35. Liang CC, Park AY, Guan JL. In vitro scratch assay: a convenient and inexpensive method for analysis of cell migration in vitro. Nat Protoc. 2007;2(2):329–333. doi:10.1038/nprot.2007.30
36. OECD. Test No. 420: Acute Oral Toxicity - Fixed Dose Procedure; 2002.
37. Shabbeer S, Sobolewski M, Anchoori RK, et al. Fenugreek: a naturally occurring edible spice as an anticancer agent. Cancer Biol Ther. 2009;8(3):272–278. doi:10.4161/cbt.8.3.7443
38. Rahmati-Yamchi M, Ghareghomi S, Haddadchi G, et al. Fenugreek extract diosgenin and pure diosgenin inhibit the hTERT gene expression in A549 lung cancer cell line. Mol Biol Rep. 2014;41(9):6247–6252. doi:10.1007/s11033-014-3505-y
39. Alshatwi AA, Shafi G, Hasan TN, et al. Fenugreek induced apoptosis in breast cancer MCF-7 cells mediated independently by fas receptor change. Asian Pac J Cancer Prev. 2013;14(10):5783–5788. doi:10.7314/APJCP.2013.14.10.5783
40. Khoja KK, Shaf G, Hasan TN, et al. Fenugreek, a naturally occurring edible spice, kills MCF-7 human breast cancer cells via an apoptotic pathway. Asian Pac J Cancer Prev. 2011;12(12):3299–3304.
41. Khalil MIM, Ibrahim MM, El–Gaaly GA, et al. Trigonella foenum (Fenugreek) induced apoptosis in hepatocellular carcinoma cell line, HepG2, mediated by upregulation of p53 and proliferating cell nuclear antigen. Biomed Res Int. 2015;2015:914645. doi:10.1155/2015/914645
42. Chao HX, Poovey CE, Privette AA, et al. Orchestration of DNA damage checkpoint dynamics across the human cell cycle. Cell Syst. 2017;5(5):445–459.e5. doi:10.1016/j.cels.2017.09.015
43. Banin S, et al. Enhanced phosphorylation of p53 by ATM in response to DNA damage. Science. 1998;281(5383):1674–1677. doi:10.1126/science.281.5383.1674
44. Canman CE, Lim DS, Cimprich KA, et al. Activation of the ATM kinase by ionizing radiation and phosphorylation of p53. Science. 1998;281(5383):1677–1679. doi:10.1126/science.281.5383.1677
45. Redon C, Pilch D, Rogakou E, et al. Histone H2A variants H2AX and H2AZ. Curr Opin Genet Dev. 2002;12(2):162–169. doi:10.1016/S0959-437X(02)00282-4
46. Scully R, Chen J, Ochs RL, et al. Dynamic changes of BRCA1 subnuclear location and phosphorylation state are initiated by DNA damage. Cell. 1997;90(3):425–435. doi:10.1016/S0092-8674(00)80503-6
47. Tibbetts RS, Brumbaugh KM, Williams JM, et al. A role for ATR in the DNA damage-induced phosphorylation of p53. Genes Dev. 1999;13(2):152–157. doi:10.1101/gad.13.2.152
48. Tibbetts RS, Cortez D, Brumbaugh KM, et al. Functional interactions between BRCA1 and the checkpoint kinase ATR during genotoxic stress. Genes Dev. 2000;14(23):2989–3002. doi:10.1101/gad.851000
49. Agarwal ML, Agarwal A, Taylor WR, et al. A p53-dependent S-phase checkpoint helps to protect cells from DNA damage in response to starvation for pyrimidine nucleotides. Proc Natl Acad Sci U S A. 1998;95(25):14775–14780. doi:10.1073/pnas.95.25.14775
50. Hastak K, Paul RK, Agarwal MK, et al. DNA synthesis from unbalanced nucleotide pools causes limited DNA damage that triggers ATR-CHK1-dependent p53 activation. Proc Natl Acad Sci U S A. 2008;105(17):6314–6319. doi:10.1073/pnas.0802080105
51. Bunz F, Dutriaux A, Lengauer C, et al. Requirement for p53 and p21 to sustain G2 arrest after DNA damage. Science. 1998;282(5393):1497–1501. doi:10.1126/science.282.5393.1497
52. Gottifredi V, McKinney K, Poyurovsky MV, et al. Decreased p21 levels are required for efficient restart of DNA synthesis after S phase block. J Biol Chem. 2004;279(7):5802–5810. doi:10.1074/jbc.M310373200
53. Autret A, Martin SJ. Bcl-2 family proteins and mitochondrial fission/fusion dynamics. Cell Mol Life Sci. 2010;67(10):1599–1606. doi:10.1007/s00018-010-0286-x
54. Estaquier J, Vallette F, Vayssiere JL, Mignotte B. The mitochondrial pathways of apoptosis. Adv Exp Med Biol. 2012;942:157–183.
55. Rello S, Stockert JC, Moreno V, et al. Morphological criteria to distinguish cell death induced by apoptotic and necrotic treatments. Apoptosis. 2005;10(1):201–208. doi:10.1007/s10495-005-6075-6
56. Badrinath N, Yoo SY. Mitochondria in cancer: in the aspects of tumorigenesis and targeted therapy. Carcinogenesis. 2018;39(12):1419–1430. doi:10.1093/carcin/bgy148
57. Nguyen C, Pandey S. Exploiting mitochondrial vulnerabilities to trigger apoptosis selectively in cancer cells. Cancers (Basel). 2019;11(7).
58. Vyas S, Zaganjor E, Haigis MC. Mitochondria and cancer. Cell. 2016;166(3):555–566. doi:10.1016/j.cell.2016.07.002
59. Weinberg F, Hamanaka R, Wheaton WW, et al. Mitochondrial metabolism and ROS generation are essential for Kras-mediated tumorigenicity. Proc Natl Acad Sci U S A. 2010;107(19):8788–8793. doi:10.1073/pnas.1003428107
60. Sinha D, Duijf PHG, Khanna KK. Mitotic slippage: an old tale with a new twist. Cell Cycle. 2019;18(1):7–15. doi:10.1080/15384101.2018.1559557
61. Fotedar R, Flatt J, Gupta S, et al. Activation-induced T-cell death is cell cycle dependent and regulated by cyclin B. Mol Cell Biol. 1995;15(2):932–942. doi:10.1128/MCB.15.2.932
62. Jin P, Hardy S, Morgan DO. Nuclear localization of cyclin B1 controls mitotic entry after DNA damage. J Cell Biol. 1998;141(4):875–885. doi:10.1083/jcb.141.4.875
63. Porter LA, Cukier IH, Lee JM. Nuclear localization of cyclin B1 regulates DNA damage-induced apoptosis. Blood. 2003;101(5):1928–1933. doi:10.1182/blood-2002-04-1103
64. Yasuhira S, Shibazaki M, Nishiya M, et al. Paclitaxel-induced aberrant mitosis and mitotic slippage efficiently lead to proliferative death irrespective of canonical apoptosis and p53. Cell Cycle. 2016;15(23):3268–3277. doi:10.1080/15384101.2016.1242537
65. Yoshikawa R, Kusunoki M, Yanagi H, et al. Dual antitumor effects of 5-fluorouracil on the cell cycle in colorectal carcinoma cells: a novel target mechanism concept for pharmacokinetic modulating chemotherapy. Cancer Res. 2001;61(3):1029–1037.
66. Letai A, et al. Distinct BH3 domains either sensitize or activate mitochondrial apoptosis, serving as prototype cancer therapeutics. Cancer Cell. 2002;2(3):183–192.
67. Pennington KL, Chan TY, Torres MP, et al. The dynamic and stress-adaptive signaling hub of 14-3-3: emerging mechanisms of regulation and context-dependent protein-protein interactions. Oncogene. 2018;37(42):5587–5604. doi:10.1038/s41388-018-0348-3
68. Castedo M, Kroemer G. [Mitotic catastrophe: a special case of apoptosis]. J Soc Biol. 2004;198(2):97–103. French. doi:10.1051/jbio/2004198020097
69. Castedo M, Perfettini J-L, Roumier T, et al. Mitotic catastrophe constitutes a special case of apoptosis whose suppression entails aneuploidy. Oncogene. 2004;23(25):4362–4370. doi:10.1038/sj.onc.1207572
70. Andreassen PR, Lohez OD, Lacroix FB, et al. Tetraploid state induces p53-dependent arrest of nontransformed mammalian cells in G1. Mol Biol Cell. 2001;12(5):1315–1328. doi:10.1091/mbc.12.5.1315
71. Lanni JS, Jacks T. Characterization of the p53-dependent postmitotic checkpoint following spindle disruption. Mol Cell Biol. 1998;18(2):1055–1064. doi:10.1128/MCB.18.2.1055
72. Meek DW. The role of p53 in the response to mitotic spindle damage. Pathol Biol (Paris). 2000;48(3):246–254.
73. Liu X, Zheng L, Zhang R, et al. Toxicological evaluation of advanced glycation end product Nε-(carboxymethyl)lysine: acute and subacute oral toxicity studies. Regul Toxicol Pharmacol. 2016;77:65–74. doi:10.1016/j.yrtph.2016.02.013
74. Siddique AB, King JA, Meyer SA, et al. Safety evaluations of single dose of the olive Secoiridoid S-(-)-oleocanthal in Swiss albino mice. Nutrients. 2020;12(2):314.
75. Vutukuri VR, Das MC, Reddy M, Prabodh S, Sunethri P. Evaluation of acute oral toxicity of ethanol leaves extract of Catharanthus roseus in Wistar Albino Rats. J Clin Diagn Res. 2017;11(3):Ff01–ff04.
76. Worasuttayangkurn L, Nakareangrit W, Kwangjai J, et al. Acute oral toxicity evaluation of Andrographis paniculata-standardized first true leaf ethanolic extract. Toxicol Rep. 2019;6:426–430. doi:10.1016/j.toxrep.2019.05.003
 © 2021 The Author(s). This work is published and licensed by Dove Medical Press Limited. The full terms of this license are available at https://www.dovepress.com/terms.php and incorporate the Creative Commons Attribution - Non Commercial (unported, v3.0) License.
By accessing the work you hereby accept the Terms. Non-commercial uses of the work are permitted without any further permission from Dove Medical Press Limited, provided the work is properly attributed. For permission for commercial use of this work, please see paragraphs 4.2 and 5 of our Terms.
© 2021 The Author(s). This work is published and licensed by Dove Medical Press Limited. The full terms of this license are available at https://www.dovepress.com/terms.php and incorporate the Creative Commons Attribution - Non Commercial (unported, v3.0) License.
By accessing the work you hereby accept the Terms. Non-commercial uses of the work are permitted without any further permission from Dove Medical Press Limited, provided the work is properly attributed. For permission for commercial use of this work, please see paragraphs 4.2 and 5 of our Terms.