")
Back to Journals » Infection and Drug Resistance » Volume 15
Metabonomic Analysis of Metabolites Produced by Escherichia coli in Patients With and Without Sepsis
Authors Wang Y, Jin Y, Ji X, Huang M, Xie B
Received 6 September 2022
Accepted for publication 29 November 2022
Published 13 December 2022 Volume 2022:15 Pages 7339—7350
DOI https://doi.org/10.2147/IDR.S388034
Checked for plagiarism Yes
Review by Single anonymous peer review
Peer reviewer comments 2
Editor who approved publication: Prof. Dr. Héctor Mora-Montes
Yangyanqiu Wang,1 Yin Jin,2 Xiaowei Ji,1 Man Huang,3 Bo Xie1
1Department of General Intensive Care Unit, Huzhou Central Hospital, Huzhou Hospital Affiliated to Zhejiang University School of Medicine, Huzhou, People’s Republic of China; 2Department of Clinical Laboratory, Huzhou Central Hospital, Huzhou Hospital Affiliated to Zhejiang University School of Medicine, Huzhou, People’s Republic of China; 3Department of General Intensive Care Unit, The Second Affiliated Hospital of Zhejiang University, Hangzhou, People’s Republic of China
Correspondence: Bo Xie, Email [email protected]
Aim: To analyze the metabolites of the most common sepsis-related pathogen and their correlation with clinical indicators.
Methods: Information of bacterial-infection patients in Huzhou Central hospital was retrospectively investigated and analyzed. The most common pathogen inducing sepsis was selected. Then, the metabolic profiles of pathogens from blood were detected by liquid chromatography/mass spectrometry. Cluster and classification analysis, KEGG pathway enrichment analysis, multidimensional OPLS-DA, Z scores, correlation analysis were used to analyze the metabolites.
Results: Escherichia coli (E. coli) was the pathogen that caused the most infection (about 21%) and sepsis. Amino acids, peptides, terpene glycosides, carbohydrates were the main metabolites of E.coli and they were mainly digestive and endocrine-related compounds. Most of them were related to amino acids metabolism, cofactors and vitamins metabolism, biosynthesis of secondary metabolites, et al. Moreover, metabolites were involved in purine metabolism, neuroactive ligand-receptor interaction, ABC transporters, etc. Then, over 70 differential metabolites such as tyramine, tryptophan, 3- hydroxymalondialdehyde were screened in E.coli from nonseptic and septic patients. They were mainly involved in phenylalanine metabolism, tryptophan metabolism, protein digestion and absorption. Distribution of metabolites of E. coli from nonseptic and septic patients was obviously different. What is more, differential metabolites had evidently correlation with SOFA score, APPACHE II score, C-reactive protein, erythrocyte, platelet, aspartate aminotransferase, coagulation function, lactic acid (p < 0.01).
Conclusion: The different metabolic profile of E. coli from nonseptic and septic patients indicated that differential metabolites might be associated with sepsis.
Keywords: sepsis, Escherichia coli, bacteria, metabolomics, LC/MS analysis
Introduction
Sepsis was a systemic inflammatory response syndrome caused by bacteria and other pathogenic microorganisms invading the body.1,2 Fleischmann-Struzek et al performed a random-effects meta-analysis with incidence of hospital-treated sepsis. These studies published on 01/1979-02/2019 included the overall incidence of sepsis defined according to clinical criteria (sepsis −1, −2: severe sepsis criteria, or sepsis −3: sepsis criteria) or related ICD codes. They found pooled incidence was 189 [95% CI 133, 267] hospital-treated sepsis cases per 100,000 person-years. Since 2008, the incidence of septicemia treated in hospitals had increased significantly.3 Sepsis could be caused by infection in any part, and it was common in peritonitis, cholangitis, pneumonia, abscess, etc.4–6 In 2012, the national intensive care study showed that gram-negative bacterial infections were more common than Gram-positive bacterial infections in the United States.7,8 The research report of patients with acute sepsis suggested that Escherichia coli (E. coli) (Gram-negative) and Staphylococcus aureus (Gram-positive) were among the most common microorganisms.4,7
However, not all microbial infections could lead to sepsis. Some microorganisms, including bacteria, invaded the blood stream locally, but only transiently passed through the blood circulation. They would not cause damage to the function of organs. In clinical studies, we found that some patients with bacteria-infection became sepsis patients, while others did not. The reasons leading to this difference deserved further exploration.
Sepsis was an organ dysfunction syndrome caused by a maladjusted response to microbial infection.2 It was considered that organ dysfunction of infected patients was related to host’s abnormal response to different infectious pathogenic microorganisms and their toxins, complex systemic inflammatory network effect, gene polymorphism, immune dysfunction, et al9–11 Various metabolites produced by bacteria, such as pyrogen, toxin, bacteriocins might involve in the process of sepsis.12,13 These metabolites could interfere with the physiological functions of the human body, causing symptoms such as fever and hypotension.13,14
In recent years, researchers have gradually realized that sepsis was not only related to inflammation in human body. The high stress state of sepsis was also closely related to the metabolic activities of various cells.15 Researchers began to try to use metabolomics to monitor the changes of sepsis and analyze the prognosis of sepsis patients.16–20 Jaurila et al analyzed serum metabolites from 44 patients with sepsis and 14 healthy subjects. They found that the serum levels of glucose, glycine and 3-hydroxybutyric acid were significantly higher in septic patients than in healthy controls, while the levels of citric acid and histidine were significantly lower in septic patients than in healthy controls. This revealed that 3-hydroxybutyric acid, citric acid and glycine might be specific metabolites in patients with sepsis.19 Metabolites were analyzed in serum samples of patients with sepsis at the time of admission to intensive care unit and 24 hours later, and the clinical outcomes (survival/death) were compared. The results showed that the concentrations of amino acids such as alanine, glutamic acid, glutamine and methionine, tricarboxylic acid circulating intermediates, lactate and pyruvate in serum of patients with poor prognosis increased.20 There was a big difference in metabolic characteristics between survivors and the dead, which indicated that dynamic monitoring of the changes of related metabolites was avail to predict the disease progression.
E. coli was the bacterium that caused more infections and more sepsis. In this study, E. coli from the blood of septic patients and non-septic patients were cultured in vitro and their metabolic differences were analyzed. The correlation between metabolites of E. coli from septic patients and organ dysfunction in sepsis was discussed.
Methods
This study was conducted in accordance with the Declaration of Helsinki and was approved by the Human Research Ethics Committee of Huzhou Central Hospital (Ethical number 20191116-01). This was a single-center retrospective study, the data were anonymous, and the need for informed consent was waived by the Human Research Ethics Committee of Huzhou Central Hospital.
Retrospective Study Analysis of Bacteria-Infection
Records of patients with positive blood culture were retrieved in Huzhou Central Hospital from January 2019 to December 2021. Information on basic characteristics, laboratory results and outcomes was abstracted. Patients with multiple bacterial infections, organ function impairment due to other diseases and death within 72 hours were excluded. The remaining bacteria-infection patients were enrolled. Then, the number and proportion of each bacteria in the total bacterial infections were analyzed. The included patients were divided into nonseptic and septic groups according to new sepsis definitions (Sepsis-3). The proportion of each bacteria in nonseptic and septic groups were statistically analyzed.
Metabonomic Analysis of Metabolites Produced by E. coli from Patients With and Without Sepsis
Selecting E. coli-Infection Patients and Preparation of E. coli
The hospitalization information of patients with positive E. coli blood culture from January, 2021 to August, 2021 was obtained from clinical laboratory doctors in Huzhou Central Hospital. The basic characteristics and laboratory results of patients infected with E. coli were extracted from Haitai system. Patients with multi-bacterial infection, organ dysfunction caused by other diseases, death within 72 hours and incomplete medical records were excluded. The remaining E. coli-infection patients were enrolled and divided into non-sepsis and sepsis group according to Sepsis −3.
Then, E. coli strains of the enrolled patients were obtained from the lab culture media and placed into a strain tube. Sterilized glycerin solution was diluted to a glycerin concentration of 15–50% v/v and was added to prepare a bacterial glycerin stock solution. After mixing, the samples were sealed with a sealing film and frozen at −80°C. According to the classification of infected hosts, E. coli strains were classified into nonseptic and septic groups.
The working flow of E. coli preparation is shown in Figure 1.
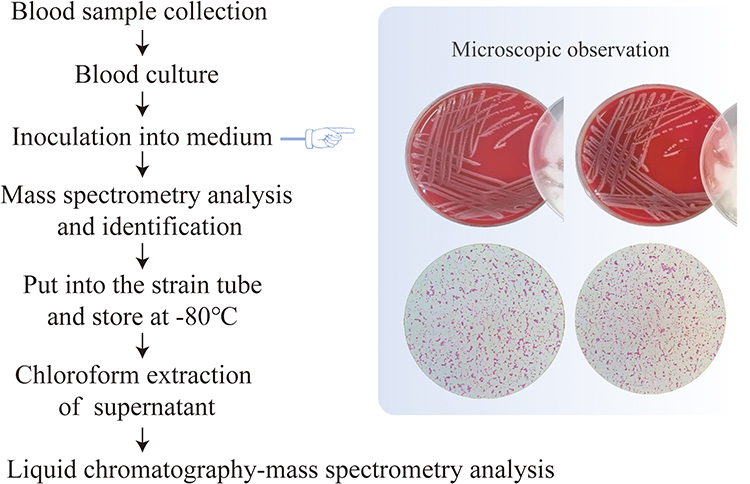 |
Figure 1 Workflow showing E. coli preparation and processing. |
Liquid Chromatography/Mass Spectrometry (LC/MS) Analysis of Metabolites of E. coli from Patients With and Without Sepsis
LC/MS was performed on an Ultimate 3000-Velos Pro system equipped with a binary solvent delivery manager and a sample manager coupled with an LTQ Orbitrap mass spectrometer equipped with an electrospray interface (Thermo Fisher Scientific, USA).
LC Conditions
Column: Acquity BEH C18 column (100 mm × 2.1 mm i.d., 1.7 µm; Waters, Milford, USA). Solvent: The column was maintained at 45°C, and separation was achieved using the following gradient: 5% B–25% B over 0–1.5 min, 25% B–100% B over 1.5–10.0 min, 100% B–100% B over 10.0–13.0 min; 100% B–5% B over 13.0–13.5 min, and 13.5–14.5 min holding at 5% B at a flow rate of 0.40 mL/min; B was acetonitrile (0.1% (v/v) formic acid) and A was aqueous formic acid (0.1% (v/v) formic acid) in the positive mode, and B was acetonitrile (containing 5 mM ammonium formate) and A was water (containing 5 mM ammonium formate) in the negative mode. The injection volume was 3.00 μL, and the column temperature was set at 45.0°C.
MS Conditions
The data of mass spectrometry were collected using an LTQ Orbitrap mass spectrometer equipped with an electrospray ionization (ESI) source operating in either positive or negative ion mode. The capillary and source temperatures were set at 350°C, with a desolvation gas flow of 45 L/h. Centroid data were collected from 50 to 1000 m/z at a 30,000 resolution.
Data Analysis
Raw data were preprocessed and imported into the metabolomics processing software Progenesis QI (Waters Corporation, Milford, USA) for baseline filtering, peak identification, integration, retention time correction, peak alignment and normalization. Finally, the data matrices of retention time, mass-to-charge ratio and peak strength were obtained.
Cluster Analysis
The gplot package in R software was used for expression pattern clustering analysis of all metabolites. The distance calculation algorithm was used, including Spearman correlation between the samples, Pearson correlation between the metabolites, and complete H-cluster algorithm.
Classification and Enrichment Analysis
The human metabolome (HMDB) database (www.hmdb.ca) and Kyoto Encyclopedia of Genes and Genomes (KEGG) database (http://www.genome.jp/kegg/) of the metabolism of E. coli were analyzed for classification. Comparison with the KEGG compound database was used to obtain the corresponding KEGG compound ID numbers of the metabolites. KEGG functional ways of the metabolites were analyzed based on the KEGG compound ID numbers. KEGG pathway enrichment analysis with a cutoff of p < 0.05 and count ≥2 was performed.
Differential Metabolite Analysis
Multidimensional OrthogonalPartialLeast Squares-DiscriminantAnalysis (OPLS-DA) were used to identify differential metabolites between the groups (VIP > 1, p < 0.05). Differential metabolites were identified by http://www.genome.jp/kegg/. Differential metabolites were analyzed by KEGG classification. Then, KEGG pathway enrichment analysis with a cutoff of p < 0.05 and count ≥2 was performed. The z scores of the top 20 differential metabolites were calculated and the corresponding scatter plots were drawn. Z score calculation formula:  ; x was the specific amount of metabolite in the sample, μ was the mean, and σ was the standard deviation.
Metabolic Pathway Analysis
Differential metabolites were annotated by the KEGG database. IDs of the transformation function were acquired from the MBRole website (http://csbg.cnb.csic.cs/mbrole), and differential metabolites were obtained based on KEGG IDs; compounds without KEGG IDs were excluded from analysis. KEGG IDs of differential metabolites obtained using the KEGG database annotations were used for pathway annotation analysis (https://www.genome.jp/kegg/pathway.html), and a metabolic pathway map was generated.
Correlation Analysis
Based on each defined differential metabolites, and clinical indicators in every sepsis patient, the Pearson correlation coefficient among all the clusters was calculated using the cor function in R. Then, the corrplot software in R (https://mirrors.tuna.tsinghua.edu.cn/ CRAN/web/packages/corrplot) was applied to visualize the correlation heatmap.
Statistical Analysis
Data of normal distribution were expressed as average standard deviation, and data of non-normal distribution were expressed as median and quartile. When comparing the differences between groups, t-test was used for measurement data with normal distribution and the Mann–Whitney test was used for measurement data with non-normal distribution; chi-square test was used for count data. Statistical analyses were performed using SPSS version 23.0 (IBM Corporation, Armonk, NY, USA). Differential metabolites were analyzed by OPLS-DA and R (version:3.5.1) package. p < 0.05 were considered statistically significant.
Results
Investigation of Bacterial-Infection and Sepsis
A total of 1560 patients in Huzhou Central Hospital with positive blood cultures were included. E.coli, Staphylococcus hominis, Staphylococcus epidermidis and Klebsiella pneumoniae were four bacteria with the largest number of infections (Figure 2A). Three hundred and twenty-eight patients with E. coli infection were enrolled, 138 of whom developed sepsis (accounting for 42%); two hundred patients infected with Staphylococcus hominis were enrolled, 75 of whom developed sepsis developed sepsis (accounting for 36%); one hundred and eighty-seven patients infected with Staphylococcus epidermidis were enrolled, 81 of whom developed sepsis (accounting for 43%); one hundred and seventy-three patients infected with Klebsiella pneumoniae, 55 of whom developed sepsis (accounting for 32%) (Figure 2B).
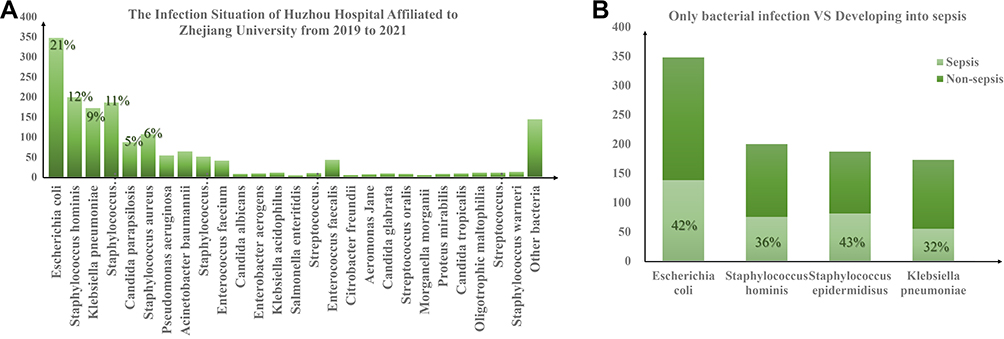 |
Figure 2 The Infection Situation of Huzhou Central Hospital from 2019 to 2021 (A). The number of bacteria-infection patients and the proportion of bacteria-infection induced sepsis (B). |
Description of Metabolic Profiles of E. coli from Patients With and Without Sepsis
Demographic characteristics and clinical characteristics of 30 E. coli-infected patients are summarized in Table 1.
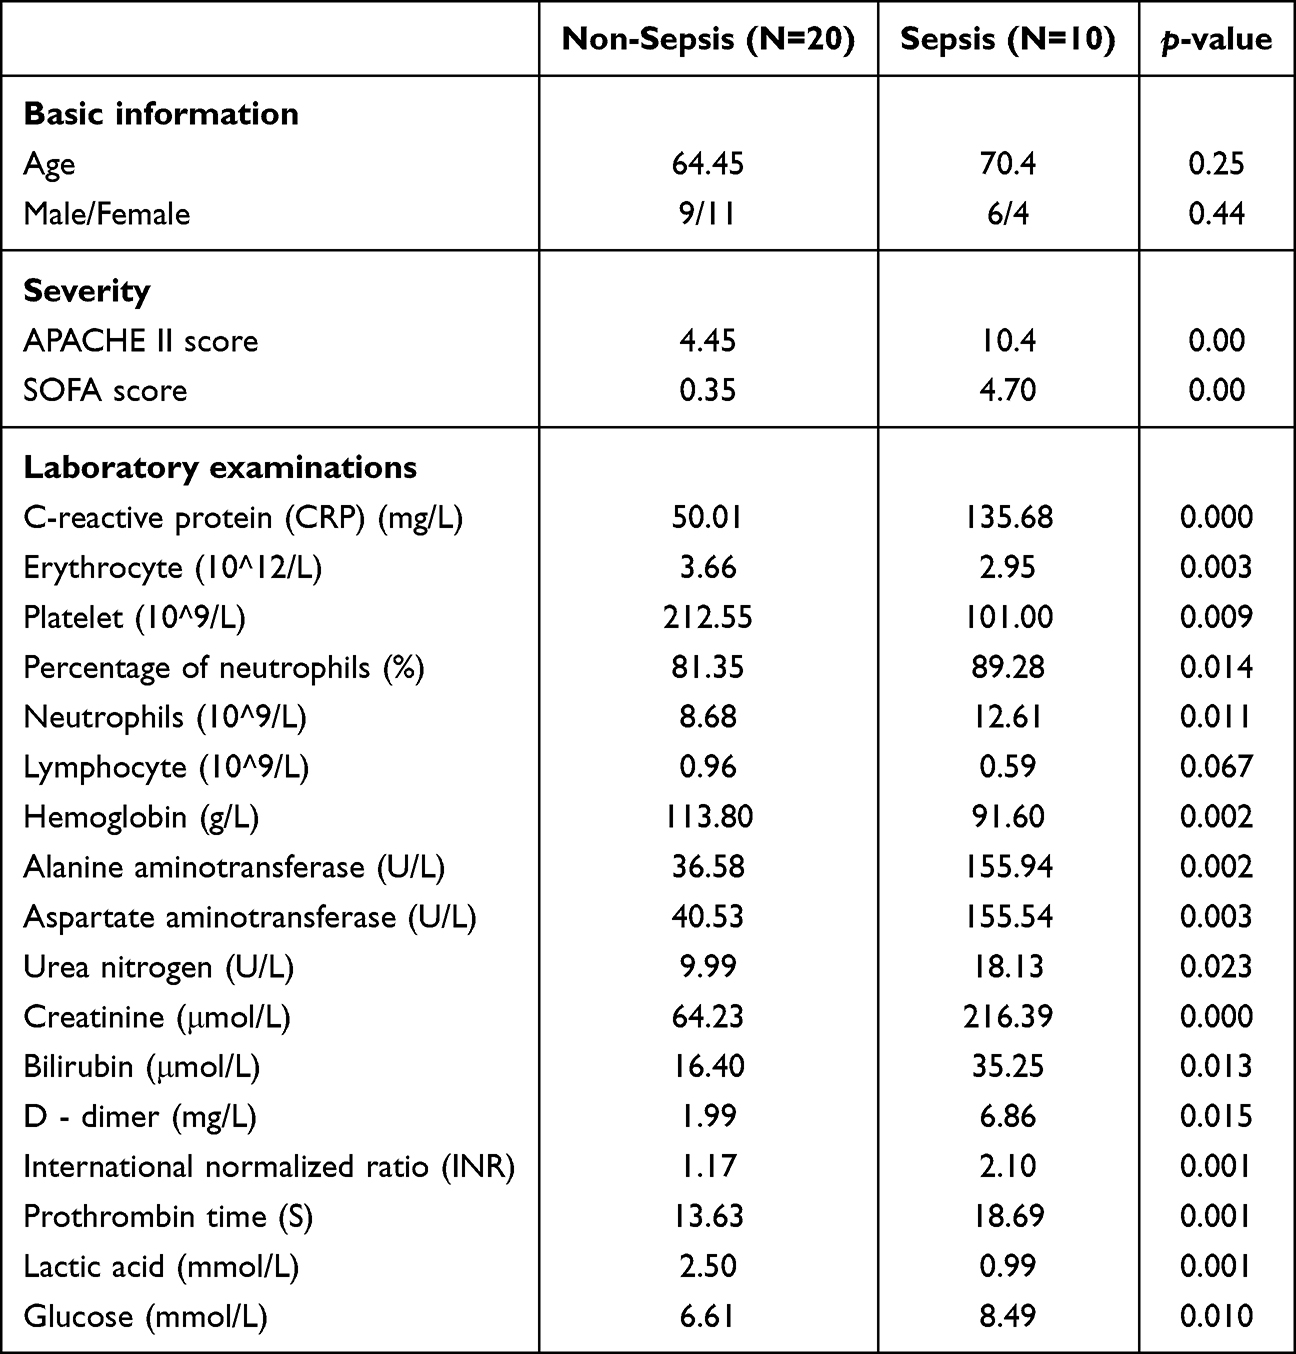 |
Table 1 Demographics and Clinical Characteristics of E. coli-Infection Patients with and without Sepsis |
LC/MS detected 10,797 metabolites in the positive ion mode and 9944 metabolites in the negative ion mode. The top 50 metabolites of E. coli from nonseptic patients and septic patients were, respectively, shown in Figure 3A and B.
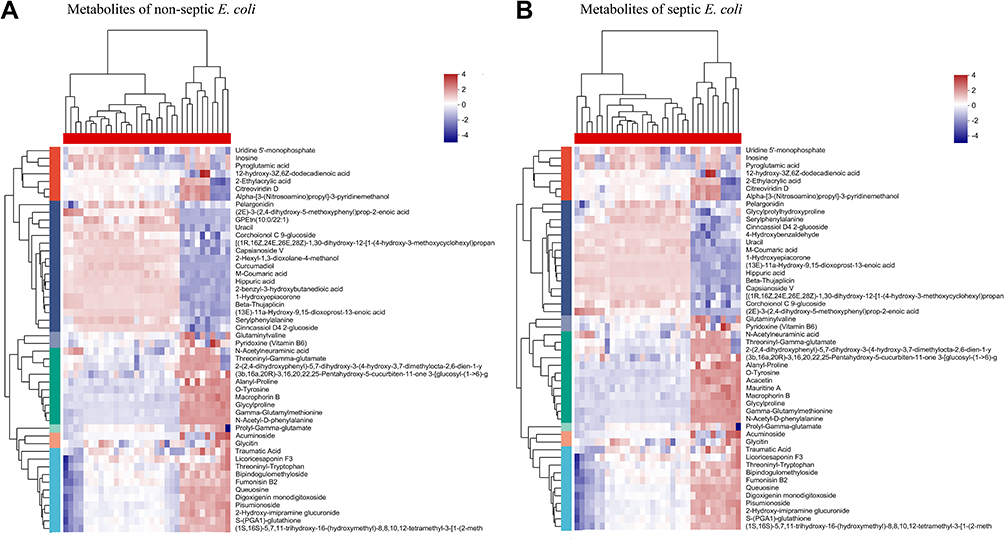 |
Figure 3 Top 50 metabolites of nonseptic E. coli (A) and septic E. coli (B). |
Amino acids, peptides, analogus organic acids and derivatives accounted for 29.87% in the metabolites of E. coli from nonseptic patients and 32.58% in the metabolites of E. coli from septic patients; terpene glycosides accounted for 6.22% in the metabolites of E. coli from nonseptic patients and 6.87% in the metabolites of E. coli from septic patients; carbohydrates and carbohydrate conjugates accounted for 6.12% in the metabolites of E. coli from nonseptic patients and 6.64% in the metabolites of E. coli from septic patients according to the HMDB classification (Figure 4A and B). Amino acids, carboxylic acids and monosaccharides accounted for most of the metabolites of E. coli from nonseptic patients and septic patients according to the classification of KEGG compounds. Compared with non-septic control, the metabolites such as 24 carbon atoms, phospholipids and fatty acids of E. coli from septic patients were decreased (Figure 4C and D).
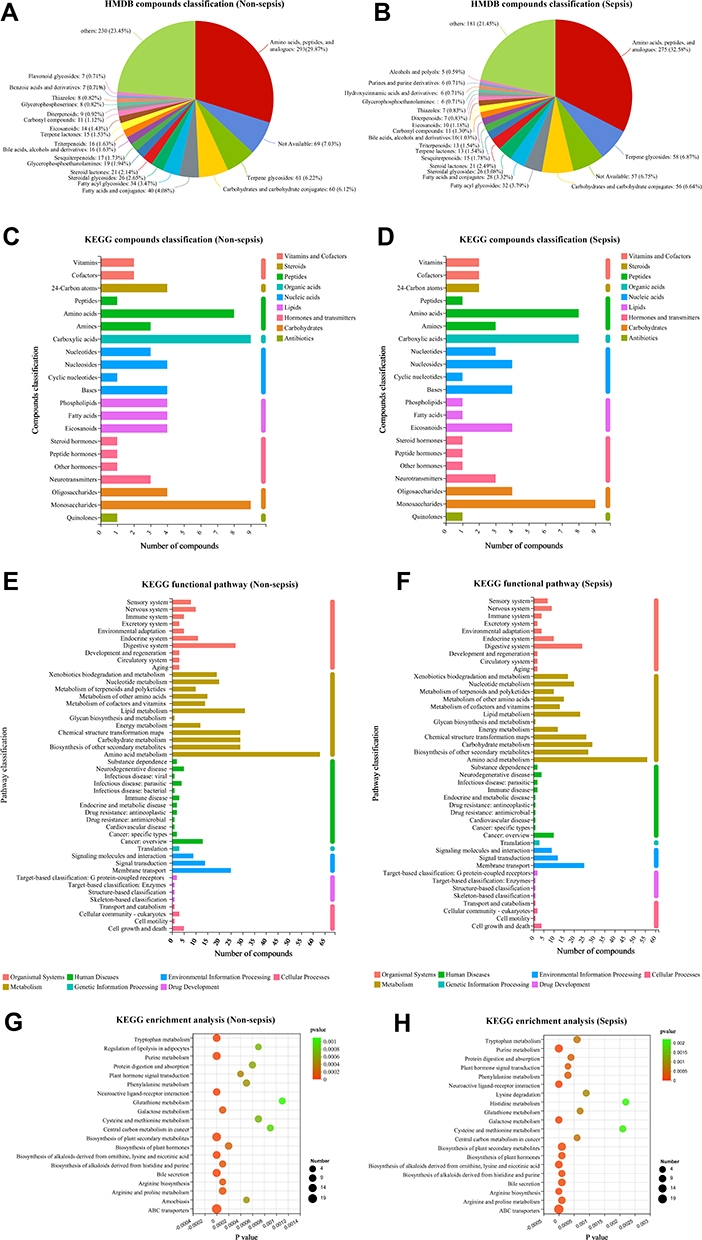 |
Figure 4 Classification of E. coli metabolites according to the HMDB database (A and B), KEGG database (C and D) and KEGG pathway (E and F). KEGG enrichment analysis of E. coli metabolites (G and H). |
The metabolites of E. coli from nonseptic patients and septic patients were mainly digestive-related and endocrine-related compounds. Large amounts of the metabolites were related to xenobiotics biodegradation, nucleotide metabolism, terpenoids and polyketides metabolism, amino acids metabolism, cofactors and vitamins metabolism, lipid metabolism, chemical structure transformation maps, carbohydrate metabolism, biosynthesis of other secondary metabolites, membrane transport, et al (Figure 4E and F).
Moreover, according to KEGG enrichment analyses, metabolites of E. coli from nonseptic patients were involved in tryptophan metabolism, purine metabolism, neuroactive ligand-receptor interaction, biosynthesis of alkaloids derived from ornithine, lysine and nicotinic acid, bile secretion, ABC transporters, etc.; metabolites of E. coli from septic patients were involved in purine metabolism, neuroactive ligand-receptor interaction, galactose metabolism, biosynthesis of alkaloids derived from ornithine, lysine and nicotinic acid, bile secretion, arginine biosynthesis, arginine and proline metabolism, ABC transporters, etc. (Figure 4G and H).
Analysis of Differential Metabolites of E. coli in Patients With and Without Sepsis
Differential metabolites of E. coli from nonseptic patients and septic patients were analyzed and about 70 known differential metabolites were screened (Figure 5A) (Table 2).
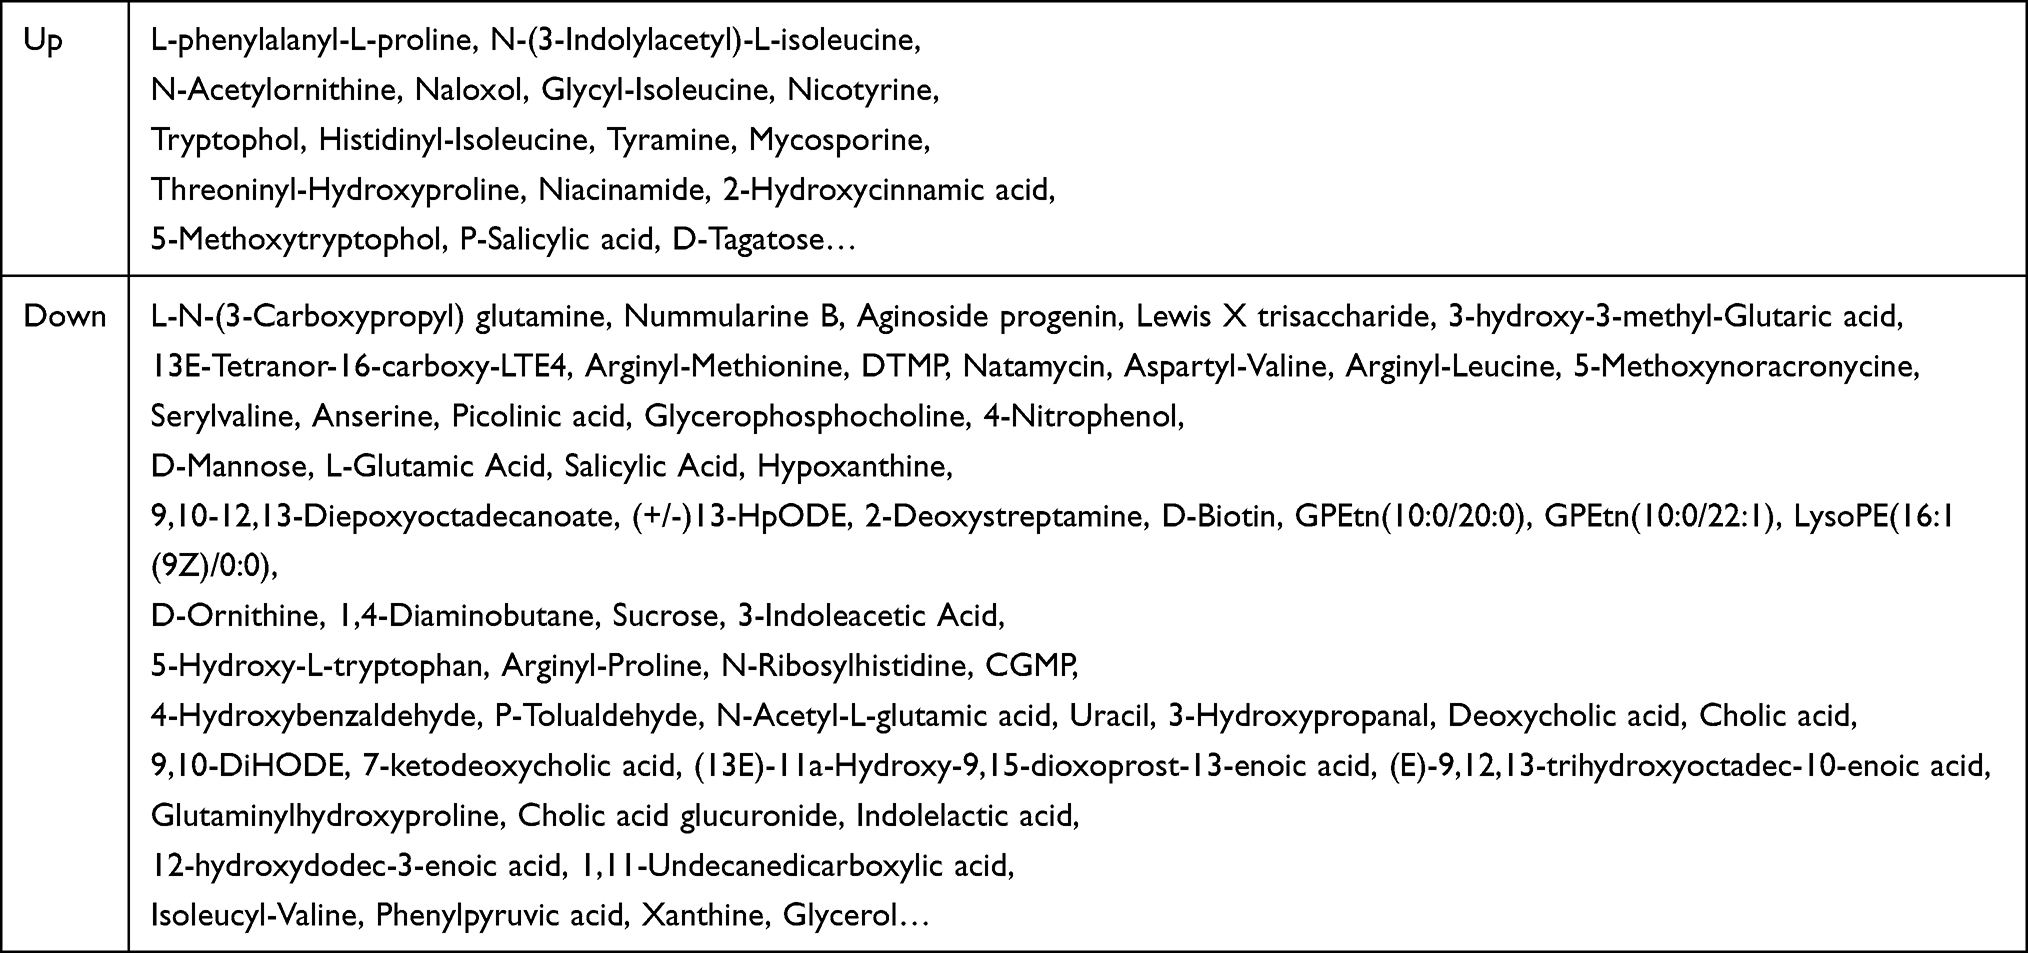 |
Table 2 Differential Metabolites of E. coli from Nonseptic and Septic Patients |
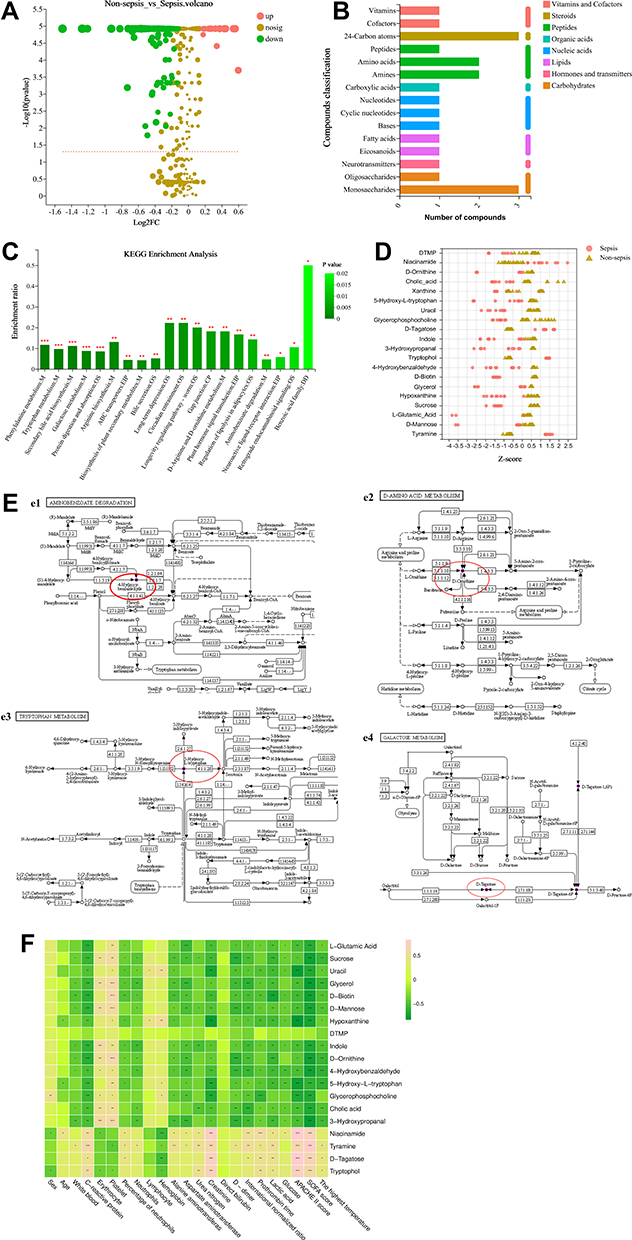 |
Figure 5 Analysis of differential metabolites of nonseptic and septic E. coli (A). Classification of differential metabolites according to the KEGG database (B) and the KEGG pathway (C). Z score was used to show The distribution difference of top 20 metabolites between nonseptic and septic E. coli (D). The main metabolic pathways of known differential metabolites (E). Correlation of characteristic metabolites and clinical indicators of patients with sepsis (F). (*p < 0. 05, **p < 0.01, *** p < 0.001). |
According to the classification of KEGG compounds, differential metabolites were mainly 24-carbon atoms, peptides, amino acids, amines, nucleic acids, monosaccharides, et al (Figure 5B). According to KEGG enrichment analyses, differential metabolites were mainly involved in phenylalanine metabolism, tryptophan metabolism, secondary bile acid biosynthesis, galactose metabolism, protein digestion and absorption (Figure 5C). Z score was used to reflect the distribution of top 20 differential metabolites (p < 0.01) in nonseptic and septic groups. There were obvious differences in the distribution of metabolites such as tyramine, Sucrose, D-biotin, Tryptophan, 3- Hydroxymalondialdehyde, D-tagatose, Glycerophosphocholine, Uracil and 5- Hydroxyl-tryptophan between non-septic and septic groups (Figure 5D).
Among the top 20 different metabolites, metabolic pathways of four differential metabolites including 4-Hydroxybenzaldehyde, 5-Hydroxy-L-tryptophan, D-Ornithine and D-Tagatose were found in KEGG library (Figure 5E). Metabolic pathways of other metabolic differences need to be improved in KEGG metabolic pathway database.
Correlation of Characteristic Metabolites and Clinical Indicators of Patients with Sepsis
By analyzing correlation of the differential metabolites with clinical indicators of sepsis patients, it was found that Natamycin, Tyramine, D-Tagatose, Tryptophol, Glycerophosphocholine, 5-Hydroxy-L-tryptophan, Hypoxanthine, Uracil had evidently correlation with SOFA score, APPACHE II score and creatine (p < 0.01). L-Glutamic Acid, Sucrose, Glycerol, D-biotin, D-Mannose, Indole, D-Ornithine, 5-Hydroxy-L-tryptophan, Glycerophosphocholine, Tyramine had obvious correlation with C-reactive protein (p < 0.01). 5-Hydroxy-L-tryptophan had obvious correlation with the patient’s temperature at the same time. Indole and 3-Hydroxypropanal had clear correlation with the number of erythrocyte (p < 0.01). Glycerol, D-biotin, D-Mannose, D-Ornithine, 3-Hydroxypropanal had significant correlation with the number of platelet (p < 0.01). L-Glutamic Acid, Glycerol, 3-Hydroxypropanal were closely related to aspartate aminotransferase (p < 0.01). Glycerol, 4-Hydroxybenzaldehyde, Glycerophosphocholine, Natamycin had something to do with the patient’s coagulation function (p < 0.01). Sucrose, D-biotin and D-Ornithine were related to lactic acid changes (p < 0.01) (Figure 5F). These results indicated that metabolites of E. coli might be related to the occurrence and development of sepsis.
Discussion
Investigation showed that E. coli was one of the most common bacteria in hospital infection and E. coli was also one of the bacteria most likely to induce septicemia. In this study, LC/MS metabolomics was used to analyze the metabolic spectrum of E. coli from blood. Then, over 70 differential metabolites of E. coli from nonseptic patients and septic patients were detected. Differential metabolites showed strong correlation with patients’ clinical indicators.
Metabolites, as the terminal of biological information transmission, could reflect the physiological and pathological state of the body. Hence, metabonomic technology based on the analysis of small molecular metabolites has been paid much attention now. However, there were still some problems, such as the imperfection of KEGG metabolic pathway database. Not all metabolites owned their metabolic pathway maps. Due to the limitation, metabolic pathways of only 4 metabolites are shown in Figure 5. KEGG metabolic pathways of differential metabolites were availed to understand the transformation between various substances. Thus, it is imperative to improve the metabolic database.
E. coli was a gram-negative bacterium. Like most bacteria, E. coli were tiny and had a large relative surface area, so material exchange was frequent and rapid. E. coli would actively adjust their nutritional requirements, energy sources and enzyme systems according to the external environment, resulting in the formation of various metabolites. The metabolites produced by E. coli in nonseptic environment were different from those produced in septic environment. It might be due to the changes made by E. coli actively adaption to the external environment. We might be able to identify whether E. coli being in sepsis environment or not by detecting its metabolites in serum in future research. Combined with algorithms such as machine learning model, it might be possible to quickly predict whether the host being a sepsis patient or not.
But it was also possible that there were differences among E. coli. Different strains of E. coli had different metabolic systems, thus producing different metabolites. These differential metabolites were strongly correlated with the clinical indicators of human organ dysfunction, which indicated that the differential metabolites might be a key to induce sepsis in their hosts. In addition, some studies had shown that the metabolites of E. coli had an impact on human biological systems, such as DNA components. For example, fumarase precursor metabolites fumaric acid and succinic acid produced by E. coli metabolism could inhibit α-ketoglutarate-dependent DNA damage repair enzyme AlkB;21 the toxic gene island polyketide synthase (pks) of E. coli produced colicin, a secondary metabolite, which could alkylate DNA with a special electrophilic cyclopropane.22 The metabolites of E. coli from septic patients might affect the DNA components and further affected the function of human cells.
The regulation of enzyme level was the most primitive and basic regulation of metabolism. Adjusting the quantity and activity of enzymes could control the speed and direction of metabolic pathway. The whole genome of E. coli from nonseptic patients and septic patients should be sequenced to find the upstream key enzymes that regulate the differential metabolites. Detecting the expression/activity of enzymes that control the synthesis of different metabolites was availed to clarify the causes of metabolic differences between non-sepsis group and sepsis group and was beneficial to find out the potential mechanism of sepsis induced by different metabolites in vivo (or in vitro). What is more, it was availed to study the early intervention treatment of sepsis.
Conclusion
In summary, the present study reported metabolic profiles of E. coli and metabolic differences between E. coli from nonseptic and E. coli from septic patients. It showed potential to distinguish non-sepsis and sepsis from bacterial metabolism. More attention from the public and medical communities should be paid on sepsis-derived bacteria metabolism.
Data Sharing Statement
All data generated or analyzed during this study were included in this published article.
Ethics Approval and Consent to Participate
The clinical protocols involving the patients and the informed consent form were approved by the Ethics Committee of Huzhou Central Hospital (Ethical number 20191116-01).
Consent for Publication
All the authors listed approve the publication.
Acknowledgments
The authors gratefully acknowledge the patients for their contributions to the investigation of clinical data, blood collection.
Author Contributions
All authors made a significant contribution to the work reported, whether that is in the conception, study design, execution, acquisition of data, analysis and interpretation, or in all these areas; took part in drafting, revising or critically reviewing the article; gave final approval of the version to be published; have agreed on the journal to which the article has been submitted; and agree to be accountable for all aspects of the work.
Funding
This work was supported by Public Welfare Technology Application Research Program of Huzhou (No.2019GYB10) and Medical Science and Technology Project of Zhejiang Province (No.2023KY311).
Disclosure
The authors declare no conflicts of interest in this work.
References
1. Fernando SM, Rochwerg B, Seely AJE. Clinical implications of the third international consensus definitions for sepsis and septic shock (Sepsis-3). CMAJ. 2018;190(36):E1058–E1059. doi:10.1503/cmaj.170149
2. Singer M, Deutschman CS, Seymour CW, et al. The third international consensus definitions for sepsis and septic shock (Sepsis-3). JAMA. 2016;315(8):801–810. doi:10.1001/jama.2016.0287
3. Fleischmann-Struzek C, Mellhammar L, Rose N, et al. Incidence and mortality of hospital- and ICU-treated sepsis: results from an updated and expanded systematic review and meta-analysis. Intensive Care Med. 2020;46(8):1552–1562. doi:10.1007/s00134-020-06151-x
4. Vincent JL, Rello J, Marshall J, et al. International study of the prevalence and outcomes of infection in intensive care units. JAMA. 2009;302:2323–2329. doi:10.1001/jama.2009.1754
5. Vincent JL, Sakr Y, Sprung CL, et al. Sepsis in European intensive care units: results of the SOAP study. Crit Care Med. 2006;34:344–353. doi:10.1097/01.CCM.0000194725.48928.3A
6. Karlsson S, Varpula M, Ruokonen E, et al. Incidence, treatment, and outcome of severe sepsis in ICU-treated adults in Finland: the Finnsepsis study. Intensive Care Med. 2007;33:435–443. doi:10.1007/s00134-006-0504-z
7. Vincent JL, Marshall JC, Namendys-Silva SA, et al. Assessment of the worldwide burden of critical illness: the Intensive Care Over Nations (ICON) audit. Lancet Respir Med. 2014;2:380–386. doi:10.1016/S2213-2600(14)70061-X
8. Vincent JL, Lefrant JY, Kotfis K, et al. Comparison of European ICU patients in 2012 (ICON) versus 2002 (SOAP). Intensive Care Med. 2018;44(3):337–344. doi:10.1007/s00134-017-5043-2
9. Zekavat SM, Lin SH, Bick AG, et al. Hematopoietic mosaic chromosomal alterations increase the risk for diverse types of infection. Nat Med. 2021;27(6):1012–1024. doi:10.1038/s41591-021-01371-0
10. Bone RC. The pathogenesis of sepsis. Ann Intern Med. 1991;115(6):457–469. doi:10.7326/0003-4819-115-6-457
11. van der Poll T, van de Veerdonk FL, Scicluna BP, et al. The immunopathology of sepsis and potential therapeutic targets. Nat Rev Immunol. 2017;17(7):407–420. doi:10.1038/nri.2017.36
12. Deng W, Bai Y, Deng F, et al. Streptococcal pyrogenic exotoxin B cleaves GSDMA and triggers pyroptosis. Nature. 2022;602(7897):496–502. doi:10.1038/s41586-021-04384-4
13. Ramezani A, Raj DS. The gut microbiome, kidney disease, and targeted interventions. J Am Soc Nephrol. 2014;25(4):657–670. doi:10.1681/ASN.2013080905
14. Oda M, Terao Y, Sakurai J, Nagahama M. Membrane-binding mechanism of clostridium perfringens alpha-toxin. Toxins. 2015;7(12):5268–5275. doi:10.3390/toxins7124880
15. González-Domínguez R, Sayago A, Fernández-Recamales Á. Direct infusion mass spectrometry for metabolomic phenotyping of diseases. Bioanalysis. 2017;9(1):131–148. doi:10.4155/bio-2016-0202
16. Izquierdo-García JL, Nin N, Ruíz-Cabello J, et al. A metabolomic approach for diagnosis of experimental sepsis. Intensive Care Med. 2011;37(12):2023–2032. doi:10.1007/s00134-011-2359-1
17. Parent BA, Seaton M, Sood RF, et al. Use of metabolomics to trend recovery and therapy after injury in critically ill trauma patients. JAMA Surg. 2016;151(7):e160853. doi:10.1001/jamasurg.2016.0853
18. Mickiewicz B, Vogel HJ, Wong HR, et al. Metabolomics as a novel approach for early diagnosis of pediatric septic shock and its mortality. Am J Respir Crit Care Med. 2013;187(9):967–976. doi:10.1164/rccm.201209-1726OC
19. Jaurila H, Koivukangas V, Koskela M, et al. 1H NMR based metabolomics in human sepsis and healthy serum. Metabolites. 2020;10(2):70. doi:10.3390/metabo10020070
20. Liu Z, Triba MN, Amathieu R, et al. Nuclear magnetic resonance-based serum metabolomic analysis reveals different disease evolution profiles between septic shock survivors and non-survivors. Crit Care. 2019;23(1):169. doi:10.1186/s13054-019-2456-z
21. Silas Y, Singer E, Das K, et al. A combination of Class-I fumarases and metabolites (α-ketoglutarate and fumarate) signal the DNA damage response in Escherichia coli. Proc Natl Acad Sci U S A. 2021;118(23):e2026595118. doi:10.1073/pnas.2026595118
22. Xue M, Kim CS, Healy AR, et al. Structure elucidation of colibactin and its DNA cross-links. Science. 2019;365(6457):eaax2685. doi:10.1126/science.aax2685
 © 2022 The Author(s). This work is published and licensed by Dove Medical Press Limited. The full terms of this license are available at https://www.dovepress.com/terms.php and incorporate the Creative Commons Attribution - Non Commercial (unported, v3.0) License.
By accessing the work you hereby accept the Terms. Non-commercial uses of the work are permitted without any further permission from Dove Medical Press Limited, provided the work is properly attributed. For permission for commercial use of this work, please see paragraphs 4.2 and 5 of our Terms.
© 2022 The Author(s). This work is published and licensed by Dove Medical Press Limited. The full terms of this license are available at https://www.dovepress.com/terms.php and incorporate the Creative Commons Attribution - Non Commercial (unported, v3.0) License.
By accessing the work you hereby accept the Terms. Non-commercial uses of the work are permitted without any further permission from Dove Medical Press Limited, provided the work is properly attributed. For permission for commercial use of this work, please see paragraphs 4.2 and 5 of our Terms.