")
Back to Journals » Clinical Interventions in Aging » Volume 13
Metabolomics study of the therapeutic mechanism of Schisandra chinensis lignans on aging rats induced by D-galactose
Authors Sun JH , Jing S, Jiang R, Wang CM , Zhang CY, Chen JG , Li H
Received 21 January 2018
Accepted for publication 23 March 2018
Published 1 May 2018 Volume 2018:13 Pages 829—841
DOI https://doi.org/10.2147/CIA.S163275
Checked for plagiarism Yes
Review by Single anonymous peer review
Peer reviewer comments 3
Editor who approved publication: Dr Zhi-Ying Wu
Jinghui Sun,1 Shu Jing,2 Rui Jiang,3 Chunmei Wang,1 Chengyi Zhang,1 Jianguang Chen,1 He Li1
1Department of Pharmacology, College of Pharmacy, Beihua University, Jilin, People’s Republic of China; 2General Surgery Area, Affiliated Hospital of Beihua University, Jilin, People’s Republic of China; 3Jilin Technology Innovation Center for Chinese Medicine Biotechnology, College of Chemistry and Biology, Beihua University, Jilin, People’s Republic of China
Objective: The aim of this study was to evaluate the antiaging effect of Schisandra chinensis lignans (SCL) by analyzing the characteristics in the serum of d-galactose (d-gal)-induced rats.
Methods: Forty male Wistar rats were randomly divided into control group, d-gal model group, low-dose SCL group (50 mg/kg/d), medium-dose SCL group (100 mg/kg/d), and high-dose SCL group (200 mg/kg/d). A serum metabolomics analysis method based on rapid resolution liquid chromatography coupled with quadruple-time-of-flight mass spectrometry was carried out to study the characteristics of d-gal-induced aging rats and evaluate the antiaging effects of SCL, and multivariate statistical analysis was performed for pattern recognition and characteristic metabolites identification. The relative levels of p19, p53, and p21 genes in the brain tissue were measured by quantitative real-time polymerase chain reaction for investigating the underlying mechanism.
Results: Metabolomics analysis showed that 15 biomarkers were identified and 13 of them recovered to the normal levels after the administration of SCL. Based on the pathway analysis, the antiaging mechanisms of SCL might be involved in the following metabolic pathways: energy, amino acid, lipid, and phospholipid metabolism. Furthermore, SCL significantly inhibited the mRNA expression level of p19, p53, and p21 in the brain of aging rats induced by d-gal.
Conclusion: These results suggest that SCL can delay rat aging induced by d-gal through multiple pathways.
Keywords: Schisandra chinensis lignans, aging, rat, metabolomics, RRLC-Q-TOF-MS, RT-PCR
Introduction
In recent years, natural products with antiaging activity, such as traditional Chinese medicines and herbal medicines, have been increasingly widely used. Schisandra, a famous traditional Chinese medicine material that originated in China, is the ripe and dry fruit of Schisandra chinensis (Turcz.) Baill. Lignans are one of the main components with multiple functions in Schisandra. There have been extensive reports on the role of lignans in Schisandra in delaying aging, such as improving learning and memory impairment caused by oxidative damage induced by D-galactose (D-gal) in rats,1 inhibiting D-gal-induced brain tissue aging in mice by attenuating apoptosis of the endoplasmic reticulum pathway,2 and regulating autophagy and inhibiting apoptosis.3 However, aging is accompanied by the overall change of multiple organs and systems, in which the organs and systems affect each other closely; so, it is not reasonable to clarify the overall effects of a drug on the body based on changes induced by the drug in a part of the body.
In recent years, metabonomics has been widely used for research on plant characteristics, the diagnosis of diseases, the exploration of drug action mechanisms, and the discovery of biomarkers, is reaching its maturity with the development of equipment, improvement of experimental methods, and the emergence of related analysis software, and as a new tool, has been considered to have immense scope in research on the development of diseases and the mechanism of drug action,4–6 especially suitable for the study of changes in the overall metabolism of the aging body.
The D-gal-induced aging model, as the most widely used subacute aging animal model currently, shows various aging manifestations, such as shortened life span, learning and memory disorders, neurodegenerative changes, hypoimmunity, and low fecundity,7,8 with similar changes to those in the morphological, physiological, and biochemical indexes of natural aging in various organs, and is widely used for the investigation of aging mechanisms, and the pharmacodynamic evaluation of antioxidants and antiaging drugs. It has been found that spontaneous behavior (open field test) is reduced and the spatial memory ability is damaged (water maze) in D-gal-induced aging rats.9,10 In our previous study, Schisandra chinensis lignans (SCL) showed an anti-hyperlipidemia effect on hyperlipidemia mice induced by high-fat diet, and the mechanisms may be involved in metabolic pathways such as tricarboxylic acid (TCA) cycle, synthesis of ketone body and cholesterol, choline metabolism, and fatty acid metabolism, with acetyl-CoA as the key factor to anti-hyperlipidemia of SCL.11 It has been reported that aging is closely related to dyslipidemia.12
In the present study, a rapid resolution liquid chromatography coupled with quadruple-time-of-flight mass spectrometry (RRLC-Q-TOF-MS)-based metabolomic approach was used to evaluate the antiaging effect of SCL by analyzing characteristics in the serum of D-gal-induced rats and the antiaging mechanism involved in the expression of related protein genes was also investigated.
Materials and methods
SCL preparation and its method
S. chinensis was purchased from Jian City Schisandra Cultivation Base, Jilin Province, China and identified as the ripe dried fruit of Schisandra by Professor Li Fengli at the Department of Pharmacognosy, Beihua University, China. Schisandra total lignans were extracted according to the procedures of carbon dioxide supercritical extraction reported previously.11 The contents of seven active lignans (schizandrol A, schisandrol B, schisantherin A, schisanhenol, schisandrin B, schisandrin C, and deoxyschizandrin) in SCL were determined by high-performance liquid chromatography (HPLC; e2695; Waters Corporation, Milford, MA, USA) and the conditions were as follows:
Column: Waters ODS (250×4.6 mm, 5 μm); mobile phase: methanol (A), water (B); the following gradient program was used: 0–15 minutes (40% to 25% B), 16–20 minutes (25% B), 21–30 minutes (25% to 10% B), 31–40 minutes (10% to 0% B), 41–45 minutes (0% B), 46–55 minutes (0% to 40% B); column temperature: 30°C; flow rate: 0.5 mL/min; detection wavelength: 230 nm; sample size: 10 μL. The contents of lignans in the samples were calculated. The results are shown in Table 1 and Figure 1.
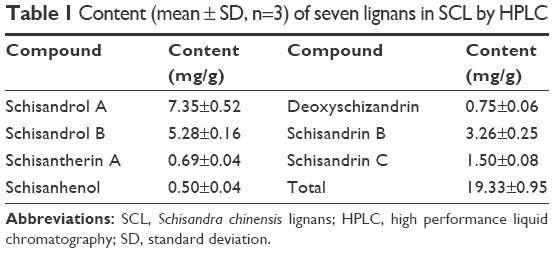 | Table 1 Content (mean ± SD, n=3) of seven lignans in SCL by HPLC |
 | Figure 1 Schisandra chinensis lignans: (A) photo of fresh Schisandra; (B) photo of fruit powder; (C) photo of extract solution; (D) typical HPLC of standards; (E) typical HPLC of sample. Peak identification: 1, schisandrol A; 2, schisandrol B; 3, schisantherin A; 4, schisanhenol; 5, schisandrin B; 6, schisandrin C; 7, deoxyschizandrin. |
Chemicals and materials
HPLC-grade methanol and acetonitrile were purchased from TEDIA (Fairfield, OH, USA). Schizandrol A, schisandrol B, schisantherin A, schisanhenol, schisandrin B, schisandrin C, and deoxyschizandrin were purchased from Chengdu Preferred Biotechnology Co Ltd (Chengdu, Sichuan, China), with purity >98%. D-gal and all the reference standards were purchased from Sigma-Aldrich Co (St Louis, MO, USA). The water used in the experiments was collected from a Milli-Q Ultra-pure water system (EMD Millipore, Billerica, MA, USA). Other chemicals were of analytical grade.
Animal handling
Forty male Wistar rats, weighing 200–220 g, were provided by the Changchun Institute of Biological Products Co, Ltd (Changchun, China; certificate number: [Ji] 2016-0008, specific pathogen-free). The experimental animals were raised in accordance with the regulations approved by the Council of Animal Care and Use of Beihua University (CACUBU). The animal room was sterilized once a week, with a temperature control of 20°C–24°C and humidity of 45%–55%. The animals were exposed to a circadian cycle of 12 hours/12 hours and were housed in separate cages, with free access to food and water. The animal pad was replaced once every 3 days, and the body weights of animals were weighed and recorded once every 2 weeks.
All rat experimental procedures were approved by CACUBU (no 20170302) and performed in accordance with the Regulations for the Administration of Affairs Concerning Experimental Animals approved by the State Council of People’s Republic of China.
Forty male Wistar rats were randomly divided into control group (control), D-gal model group, low-dose SCL group (SCL-L), medium-dose SCL group (SCL-M), and high-dose SCL group (SCL-H), with eight rats in each group. Rats in the model, SCL-L, SCL-M, and SCL-H groups were given 100 mg/kg D-gal via subcutaneous injection once daily for 9 consecutive weeks, and those in the control group were given normal saline in the same way. Rats in SCL-L, SCL-M, and SCL-H groups were intragastrically given 50, 100, and 200 mg/kg/day SCL, respectively, and those in both the control group and model group were given an equal volume of distilled water for 3 consecutive weeks from the seventh week after the administration of D-gal and normal saline.
Blood and brain sample collection
Blood samples of rats in the control, SCL-L, SCL-M, and SCL-H groups were collected from the inner canthus (anesthesia with ether) by the end of the ninth week, and those in the model group were collected in the same way by the end of the third, sixth, and ninth week, respectively, for the analysis of serum metabolomics. Rats from each group were sacrificed after the last blood collection, and the brain tissues were removed onto an ice plate immediately. The removed brain tissues were washed with pre-cooling saline, dried with filter paper, and cryopreserved at −80°C for use.
RRLC/MS analysis
One hundred microliters of the serum were added with 1 mL methanol, shaken by a vertex meter, and then centrifuged (12,000 rpm) at 4°C for 5 minutes to obtain the supernatant. The supernatant was filtered through a 0.22 μm filter membrane and the filtrate was stored at 4°C for use.
Chromatographic separation was performed using a 1200 rapid resolution liquid chromatography system (Agilent Technologies, Santa Clara, CA, USA). An Agilent SB-C18 column (100×3.0 mm, 1.8 μm, 600 bar) was used at a temperature of 25°C. The gradient elution was carried out with a binary pump. Formic acid (0.1%) (v/v) was considered as phase A and acetonitrile as phase B at a constant flow rate of 300 μL/min. A gradient profile with the following proportions (v/v) of phase B was applied: 0-10 minutes from 5% to 50% and 10-20 minutes from 50% to 95%. The injected volume was 5 μL.
MS analysis was performed on 6520 Q-TOF MS (Agilent Technologies), which was equipped with an electrospray interface and automatic calibration system. The MS parameters were set as follows: drying gas (N2) temperature at 350°C and flow rate at 8.0 L/min, nebulizer at 207 kPa, capillary voltage at 3.5 kV, fragmentor voltage at 175 V, and skimmer voltage at 65 V. The full MS scan range was from m/z 50 to 1,000 in both negative and positive modes.
Biomarkers data and statistical analysis
After RRLC/MS measurement, the raw data were preprocessed using MassHunter 03.01 and Mass Profiler Professional 02.02 software (Agilent Technologies) for peak extraction, filtration, and normalization. All data were expressed as mean ± standard deviation (SD) ( ±s). “n” denotes the sample numbers in each group. The data were analyzed using independent t-test and one-way analysis of variance (ANOVA) (SPSS 19.0; IBM Corporation, Armonk, NY, USA); p-values <0.05 were considered significant. Multivariate data analysis was performed by using principal component analysis (PCA), partial least squares-discriminant analysis (PLS-DA), and orthogonal PLS-DA (OPLS-DA). The identification of metabolites was accomplished by comparison of the measured accurate mass value with the following databases: Human Metabolome Database,13 LIPID MAPS,14 and Kyoto Encyclopedia of Genes and Genomes.15
RNA extraction and real-time reverse transcription polymerase chain reaction (RT-PCR)
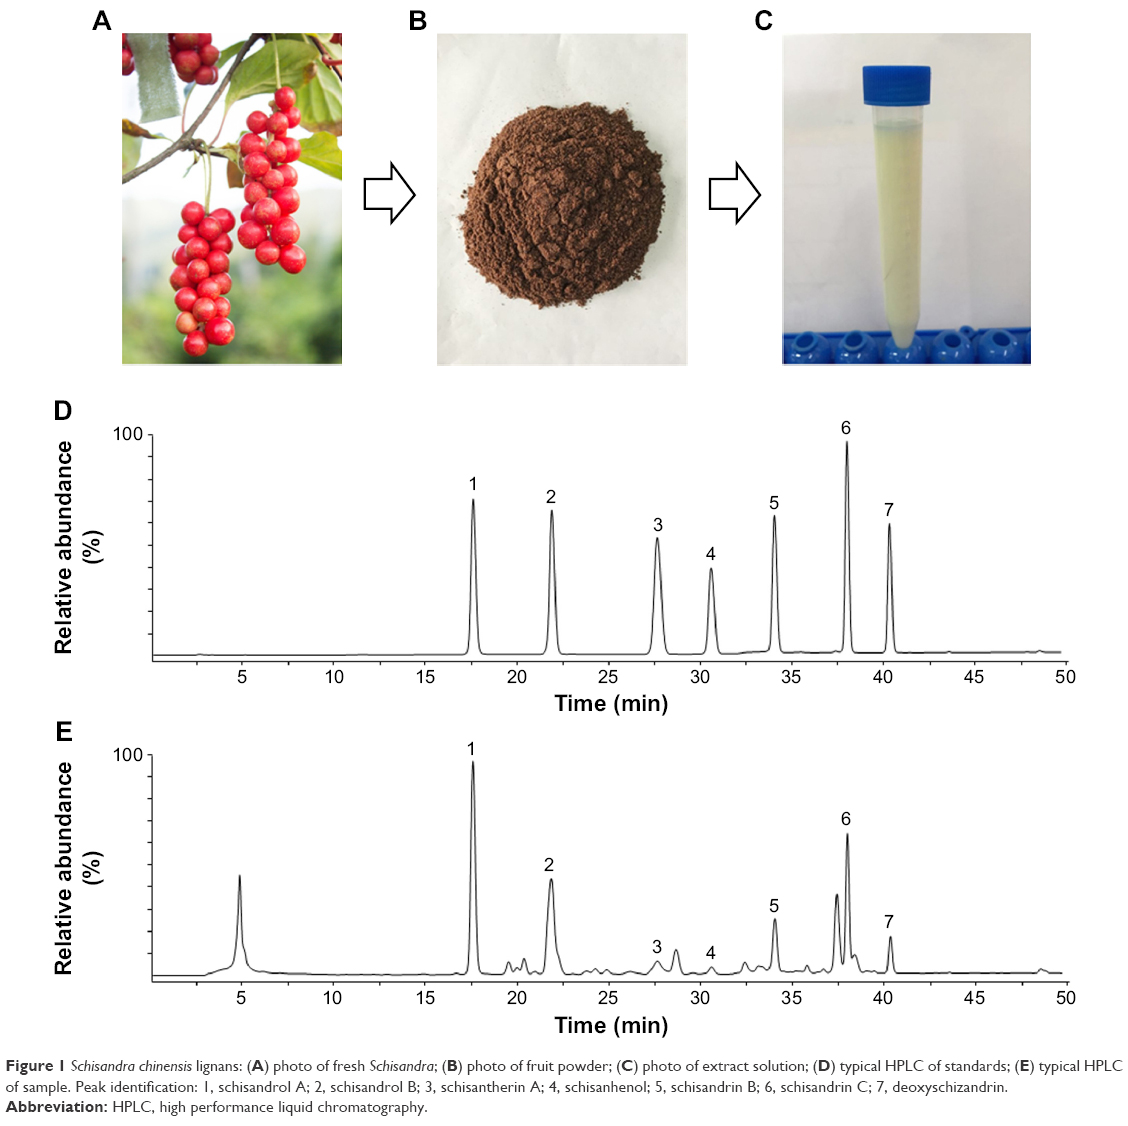
The total RNA in the brain tissue of rats was extracted with Trizol reagent, and effects of SCL on the expression of p19, p53, and p21 genes in the brain tissue of rats were observed. RT was performed using 5 μg RNA, 1 μL Random Primers (0.5 μg/reaction), 1 μL Oligo(dT) 15 Primer (0.5 μg/reaction), and 3 μL Nuclease-Free Water, strictly referring to the procedures of RT kits (Promega Corporation, Fitchburg, WI, USA). The PCR primer sequence was designed by Dingguo Changsheng Biotechnology Co Ltd (Beijing, China) using Primer 6.0 software (PREMIER Biosoft International, Palo Alto, CA, USA) and the gene expression level was analyzed using SYBR Green kit (Promega Corporation). The sequence and length of primer are listed in Table 2. ΔΔCt method was used for the relative quantitative analysis. β-Actin was used as the control to normalize the data and the unit was expressed as a percentage.
 | Table 2 Primers used for quantitative real-time PCR |
Results
RRLC-Q-TOF-MS method for the metabolomic analysis
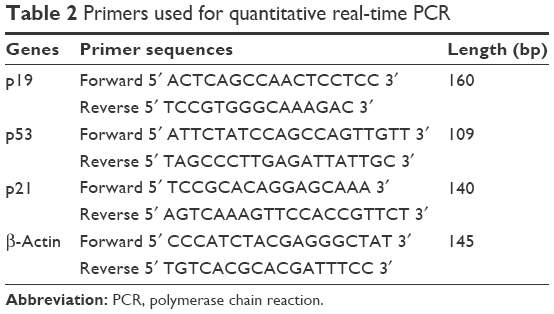
D-gal-induced aging rat model is the most commonly used method for establishing a subacute aging animal model currently, characterized by shortened life expectancy, learning and memory impairment, and immunodeficiency. In this study, rats were subcutaneously injected with 100 mg/kg D-gal once daily continuously for 9 weeks and a RRLC-Q-TOF-MS approach was employed in the metabolomic study of biochemical changes in the serum of aging rats. Figure 2 presents the base peak intensity chromatograms of serum samples from control, D-gal (9 weeks), and SCL-H rats in both negative and positive ion modes. For the precision and repeatability of the developed RRLC-Q-TOF-MS method in this study, 50 μL of all the serum samples were mixed to prepare a quality control (QC) sample. During all the liquid chromatography (LC)-MS analyses, the QC sample was measured after every six serum samples. Five ions (m/z 145.0621, 180.9721, 231.9666, 452.9206, and 588.8940) in negative ion mode and five ions (m/z 132.0973, 188.0652, 215.2066, 330.3273, and 437.1814) in positive ion mode were extracted for the assessment according to the variation of their peak areas and retention times. The system stability (relative standard deviations %) of m/z values, retention times, and peak areas were <0.20%, 0.0008%, and 9.3%, respectively. These results indicated the excellent reproducibility and stability during the whole sequence.
 | Figure 2 BPI chromatograms obtained from negative and positive ion RRLC-Q-TOF-MS analyses of control, D-gal (9 weeks), and SCL-H rat. |
Analysis of serum metabolite profiles
Based on RRLC-Q-TOF-MS data, PCA was performed to determine the potential metabolites of serum samples from control, D-gal (3 weeks), D-gal (6 weeks), D-gal (9 weeks), SCL-L, SCL-M, and SCL-H rats. PCA, as a common method for multivariate data analysis, can be used to reduce the dimensionality with minimal information loss while retaining the characteristics that contribute most to the variance. Figure 3 shows the PCA score plots, and the scattered points of control, D-gal (3 weeks), D-gal (6 weeks), and D-gal (9 weeks) samples exhibit an obvious separation in both negative and positive ion modes. SCL-H and SCL-M samples, especially SCL-H samples, exhibited an obvious separation from D-gal (9 weeks) samples and close to that of D-gal (3 weeks) samples in both negative and positive ion modes. SCL-L samples exhibited an obvious separation from D-gal (9 weeks) samples and close to that of D-gal (6 weeks) samples in negative ion mode, but no significant separation from D-gal (9 weeks) samples in positive ion mode. PCA, as an unsupervised method, can only reflect the original state of data, but in the experiment, environment, diet, and other factors, as well as system errors will affect the experimental results. In order to filter metabolic changes caused by some factors that were not related to the experiment, and obtain more accurate results, supervised PLS-DA and OPLS-DA analyses were used for further processing of data in this study.
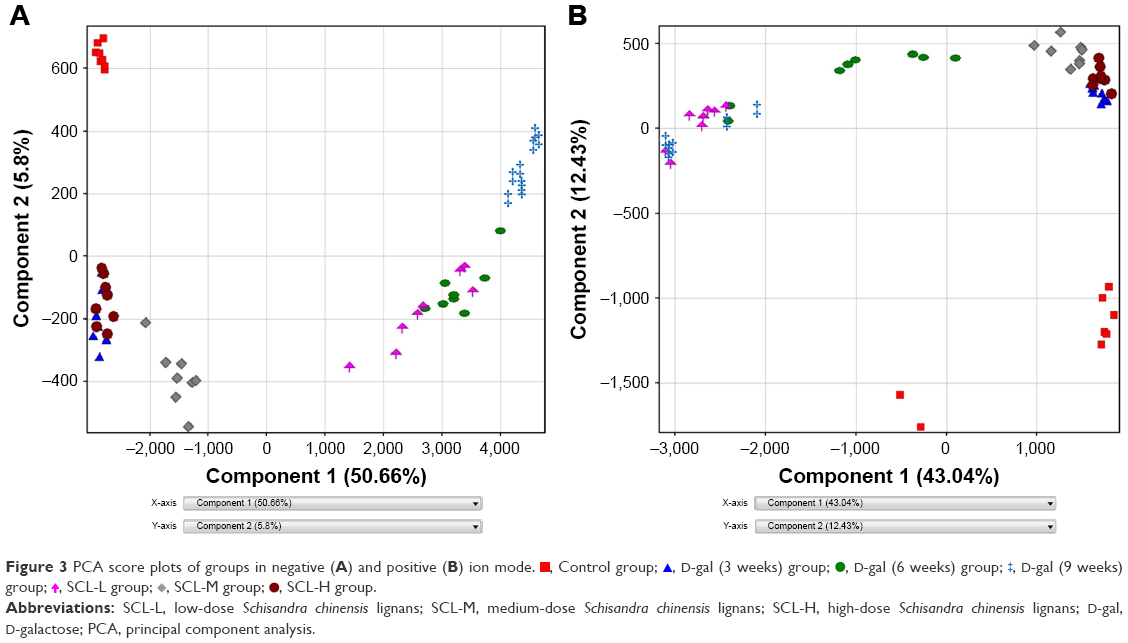 | Figure 3 PCA score plots of groups in negative (A) and positive (B) ion mode. |
 , Control group;
  , D-gal (3 weeks) group;
  , D-gal (6 weeks) group;
  , D-gal (9 weeks) group;
  , SCL-L group;
  , SCL-M group;
  , SCL-H group.
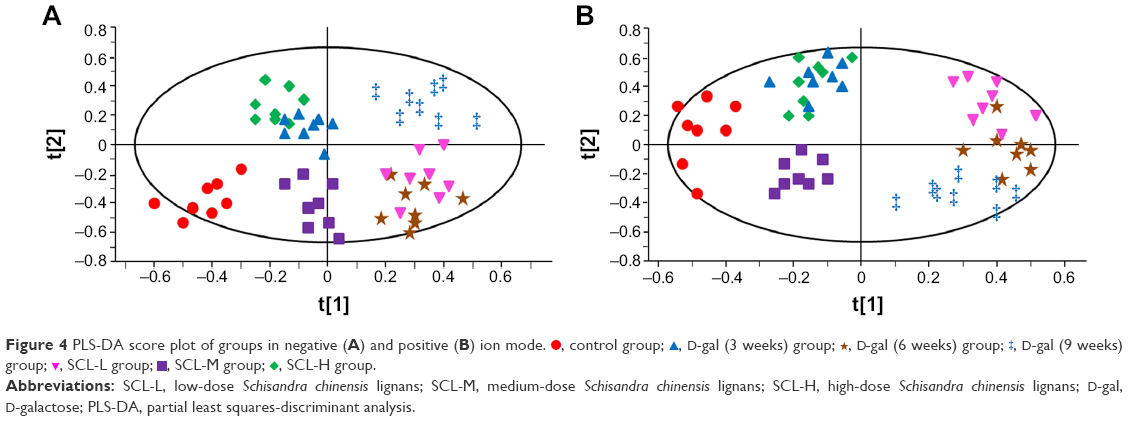
All the sample data matrixes were analyzed in statistics with the PLS-DA method. As shown in Figure 4, the distinguishing results of samples among the different groups were roughly the same as those by PCA, and the degree of separation from D-gal (9 weeks) samples was better in the positive ion mode. The PLS-DA score plot revealed a good fit and high predictability of the PLS-DA model with high statistical values of R2 and Q2. The R2 values were 0.942 (positive ion mode) and 0.925 (negative ion mode), and Q2 values were 0.937 (positive ion mode) and 0.916 (negative ion mode). The results demonstrated validity of the current model.
 | Figure 4 PLS-DA score plot of groups in negative (A) and positive (B) ion mode. |
 , control group;
  , D-gal (6 weeks) group;
  , SCL-L group;
  , SCL-M group;
  , SCL-H group.
In order to confirm the differences in the regulation of endogenous metabolites in the blood of rats before and after the modeling and after the administration of SCL to a maximum extent, OPLS-DA was applied to analyze the results in the control and D-gal (9 weeks) group, D-gal (9 weeks) and SCL-H group, to obtain OPLS-DA score plots and S-plot (Figure 5), and the different metabolites were looked for by S-plot in combination with variable importance in projection values (>1). Accordingly, there were a total of 15 potential metabolites which showed significant differences between control and D-gal (9 weeks) groups; 13 of them showed significant differences between D-gal (9 weeks) and SCL-H groups.
 | Figure 5 OPLS-DA analysis of RRLC-Q-TOF-MS of rat serum. Score plot of control and D-gal (9 weeks) group in negative (A) and positive (B) ion mode. Score plot of D-gal (9 weeks) and SCL-H group in negative (C) and positive (D) ion mode. S-plot of control and D-gal (9 weeks) group in negative (E) and positive (F) ion mode. S-plot of D-gal (9 weeks) and SCL-H group in negative (G) and positive (H) ion mode. |
To identify these potential biomarkers, the retention time, accurate molecular ion mass, and characteristic MS/MS fragment ions were compared with those of authentic standards and database resources. The [M−H]− ion at m/z 201 in negative ion mode was selected as an example to illustrate the biomarker identification. Figure 6A is the extracted ion chromatogram (EIC) of m/z 201 in negative ion mode and the mass spectrum is shown in Figure 6B. As the mass accuracy was <10 ppm, the possible elemental composition of the compound was compared with that of the registered compounds in databases and the metabolite was tentatively identified as sebacic acid. To confirm the identification, the reference standard of sebacic acid was analyzed by LC/MS and MS/MS. Figure 6C shows the MS/MS spectrum of sebacic acid and the characteristic fragment ions at m/z 183 [M−H2O−H]− and m/z 139 [M−C2H6O2−H]−, with a good concordance with the metabolite m/z 201. Based on the above information, the metabolite m/z 201 was identified as sebacic acid. The other compounds were identified using the above method. Fifteen compounds were tentatively identified as biomarkers and the related information is listed in Table 3.
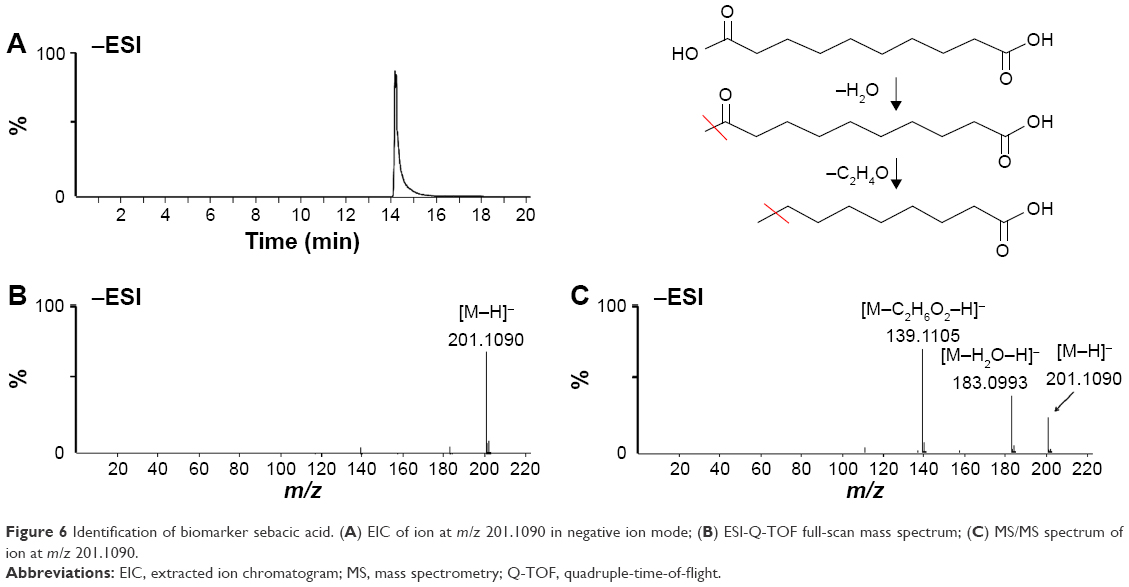 | Figure 6 Identification of biomarker sebacic acid. (A) EIC of ion at m/z 201.1090 in negative ion mode; (B) ESI-Q-TOF full-scan mass spectrum; (C) MS/MS spectrum of ion at m/z 201.1090. |
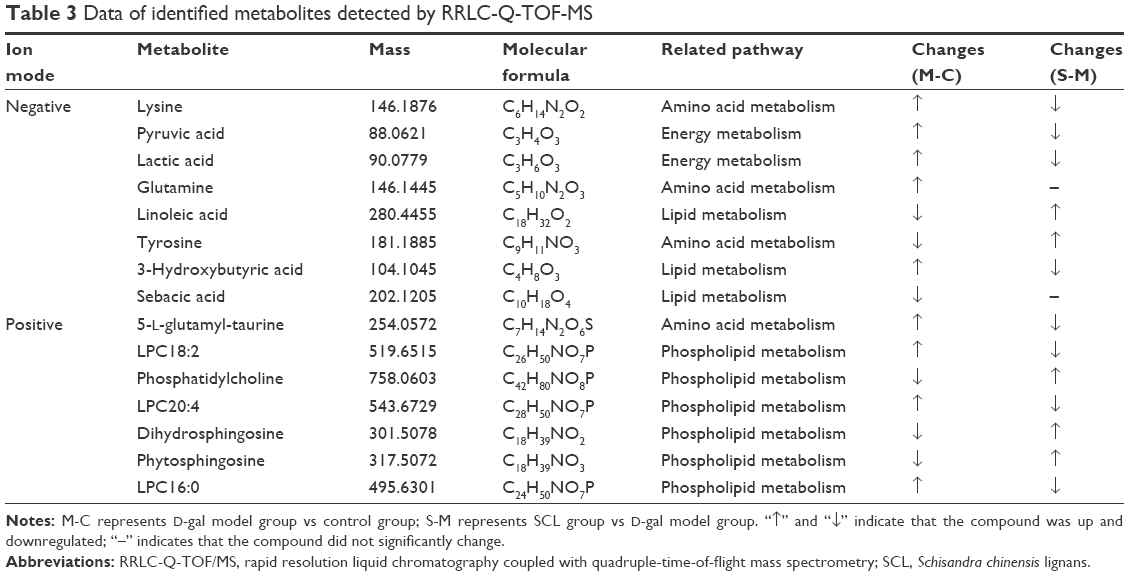 | Table 3 Data of identified metabolites detected by RRLC-Q-TOF-MS |
In order to further compare the variation trend of metabolites in each group, the EIC and the average peak area of all the metabolites in each group were analyzed to determine the relative intensity. The relative intensity of the metabolites in each group was presented as the mean ± SD. Differences at the feature level between samples were statistically distinguished using the ANOVA test at a significance level of p<0.05 and p<0.01. Changes of the metabolites in each group are shown in Figure 7.
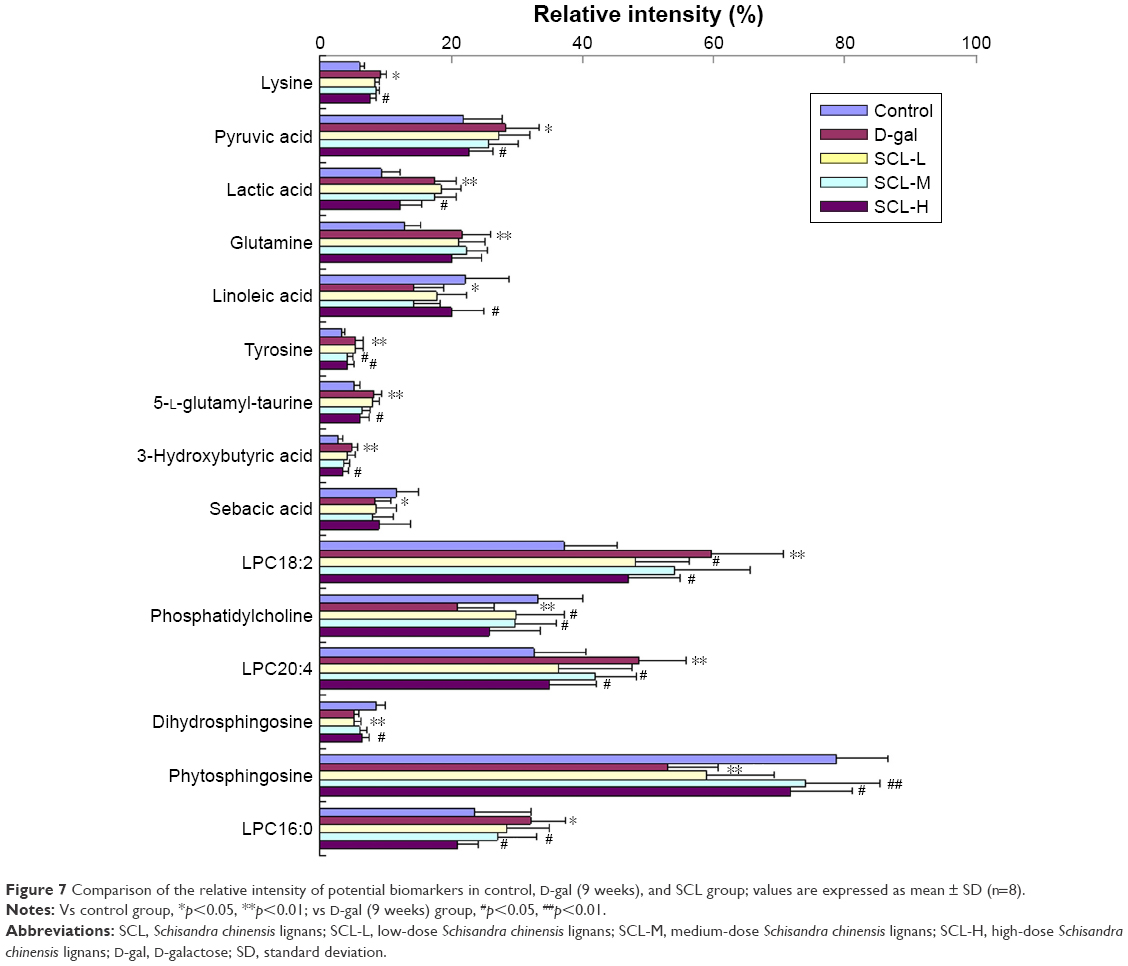 | Figure 7 Comparison of the relative intensity of potential biomarkers in control, D-gal (9 weeks), and SCL group; values are expressed as mean ± SD (n=8). |
Effects of SCL on the expression of p19, p53, and p21 genes
p19, p53, and p21 genes pathways are important pathways through which D-gal promotes senescence, and literature has reported that lysophosphatidylcholine, phospholipid, and sphingolipid are closely related to the p53 pathway.16–21 Therefore, p19, p53, and p21 mRNA expressions in the brain tissue of all the rats were detected by q-PCR and analyzed by using the ANOVA test. As shown in Figure 8, compared with those in the control group, p19, p53, and p21 mRNA expressions in the brain tissue of rats in D-gal group (9 weeks) were significantly increased (p<0.01); compared with those in the model group, p19, p53, and p21 mRNA expressions in the brain tissue of rats in SCL-M and SCL-H groups were significantly decreased (p<0.05), suggesting that D-gal could significantly increase the expression of p19, p53, and p21 genes in the brain tissue of rats, and SCL could significantly inhibit the abnormally high expression of p19, p53, and p21 genes in the brain tissue of D-gal-induced rats.
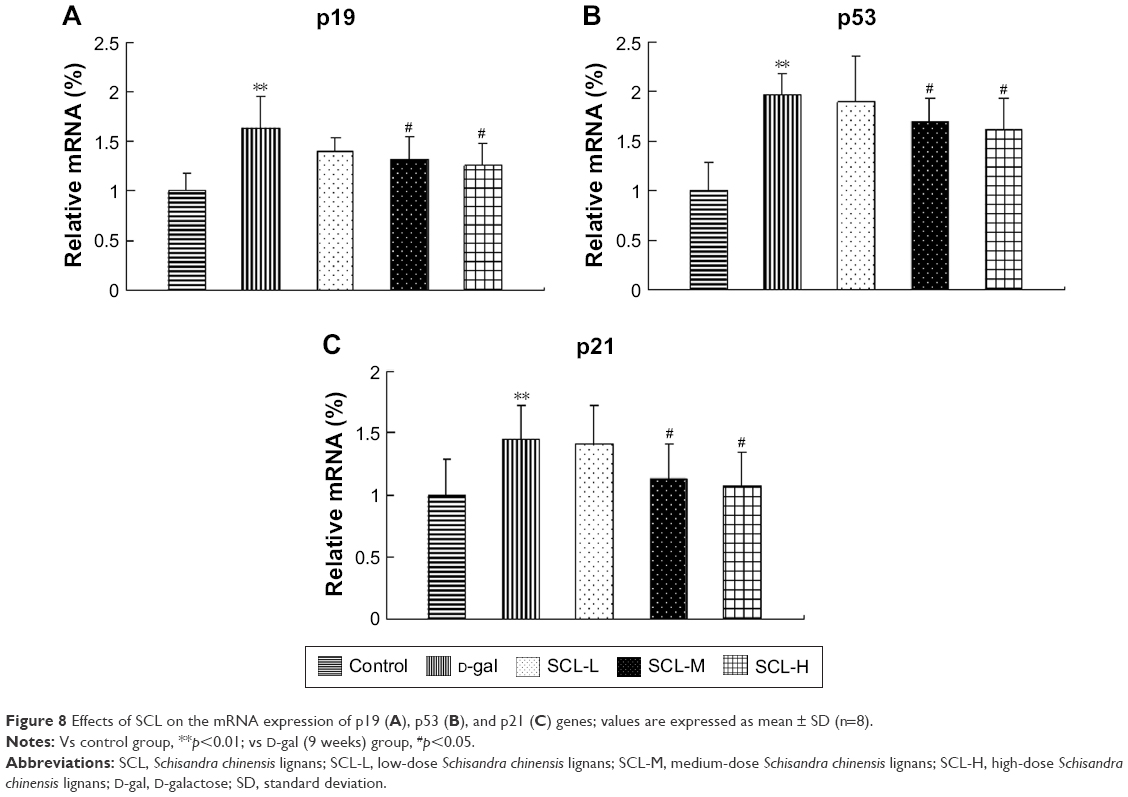 | Figure 8 Effects of SCL on the mRNA expression of p19 (A), p53 (B), and p21 (C) genes; values are expressed as mean ± SD (n=8). |
Discussion
In this study, rats were subcutaneously injected with 100 mg/kg D-gal once daily continuously for 9 weeks, and a RRLC-Q-TOF-MS approach was employed in the metabolomic study of biochemical changes in the serum of aging rats. The results showed that the levels of lysine, pyruvic acid, lactic acid, glutamine, 5-L-glutamyl-taurine, 3-hydroxybutyric acid, LPC18:2, LPC20:4, and LPC16:0 increased remarkably, while those of linoleic acid, tyrosine, sebacic acid, phosphatidylcholine, dihydrosphingosine, and phytosphingosine decreased obviously in the serum of D-gal-induced rats compared with those in the control group. After the administration of SCL, the levels of most metabolites returned to normal except those of glutamine and sebacic acid. These change trends indicate that D-gal-induced aging is closely related to energy metabolism, amino acid metabolism, lipid metabolism, and phospholipid metabolism, and SCL can mitigate metabolism disorders induced by D-gal.
Pyruvic acid plays an important pivotal role in the metabolism of three nutrient substances, such as conversion to acetyl-CoA involved in lipid metabolism and TCA cycle.22 D-gal can stimulate a significant increase of pyruvic acid, and the reason is the disorder of glycolysis and TCA cycle.23 An increase in the level of lactic acid indicates changes in gluconeogenesis, carbohydrate and energy metabolism. It was also reported that there is a high level of pyruvic acid and lactic acid in the urine of D-gal-induced rats.24 In this study, the content of pyruvic acid and lactic acid was significantly increased in the serum of D-gal rats, and the intervention with SCL could significantly decrease the content of pyruvic acid and lactic acid, indicating that SCL could alleviate the glucose metabolism and energy metabolism disorders.
Tyrosine is an essential amino acid and the precursor of catecholamines, such as epinephrine, dopamine, and norepinephrine.25 Many studies have indicated that serum and brain tyrosine metabolism is closely related to aging.26,27 Lysine, as a ketogenic amino acid, can provide structural components for the synthesis of carnitine, and carnitine will facilitate the synthesis of fatty acid in cells.28 Glutamine is the precursor of glutathione, an important antioxidant, and a lower level of glutamine indirectly leads to increased lipid peroxidation damage. In our previous studies, it was found that SCL could improve metabolic disorders of lysine, glutamine, and 5-L-glutamyl-taurine in the serum of mice with hyperlipidemia.11 The level of serum lysine, glutamine, and 5-L-glutamyl-taurine increased in the model group, showing an oxidative stress injury and lipid metabolism disorder in D-gal-induced rats. After the intervention of SCL, the level of lysine, tyrosine, and 5-L-glutamyl-taurine recovered to different degrees, indicating that SCL could improve the amino acid metabolism disorder caused by D-gal.
Sebacic acid is a saturated straight-chain dicarboxylic acid. Lipid metabolism was reported to play an important role in aging since the related metabolites were involved in many biochemistry reactions29 and fatty acid in serum showed a significant increasing trend with aging.30 Linoleic acid, a polyunsaturated fatty acid, is a precursor of prostaglandins in the arachidonic acid pathway and plays an important role in protecting the brain from neurodegenerative processes.31 Compared with that in the control group, the level of serum linoleic acid in the model group was significantly reduced, but rebounded significantly after the intervention of SCL, indicating that SCL can improve the lipid metabolism disorder and nervous system damage induced by D-gal, which was also in accordance with the results of Yan et al’s study.1
3-Hydroxybutyric acid is generally considered to be a ketone body, synthesized in the liver from acetyl-CoA, and can be used as an energy source for the brain when blood glucose is low. It was reported that the level of 3-hydroxybutyric acid increased significantly in aging and hyperlipidemia animals.26,32 The results of this study are consistent with those reported by many other studies, indicating that SCL can correct the lipid metabolism disorder induced by D-gal.
LPC18:2, LPC20:4, and LPC16:0 are all lysophosphatidylcholines. Free radicals are one of the most recognized considerations in the aging theory; the oxidative stress in the aging process is closely related to some age-related diseases, such as Parkinson’s disease and Alzheimer’s disease, and when oxidative stress occurs, the generation of free radicals can activate the phospholipase A2 that could hydrolyze phosphatidylcholine to become lysophosphatidylcholine.33,34 Lysophosphatidylcholine is an effective detergent-like cytotoxic compound, and can damage the membrane of plasmocytes and vesicles, and eventually lead to the death of cells if a sufficient amount of it is generated.35 In this study, the level of serum lysophosphatidylcholine in the model group was significantly elevated, and after the intervention of SCL, the level of serum lysophosphatidylcholine was reduced in different degrees, showing that an obvious oxidative damage could be induced by D-gal, and SCL could alleviate free radical injury.
Phosphatidylcholine, dihydrosphingosine, and phytosphingosine all are phospholipids and the major components of cellular membranes. Ceramide, the metabolite of phospholipids, is involved in the proliferation, differentiation, and apoptosis of cells. Many studies have shown that in the oxidative stress state, the content of phospholipids is significantly reduced in the blood of both aging animal models and patients with Alzheimer’s disease.34,36 In this study, the content of the three phospholipids in the D-gal group was significantly reduced, and significantly elevated after the intervention of SCL.
In summary, SCL treatment partially improved the metabolism disorders induced by D-gal, with a good antiaging effect. The metabolic pathways included were proposed as follows: energy metabolism, amino acid metabolism, lipid metabolism, and phospholipid metabolism (Figure 9).
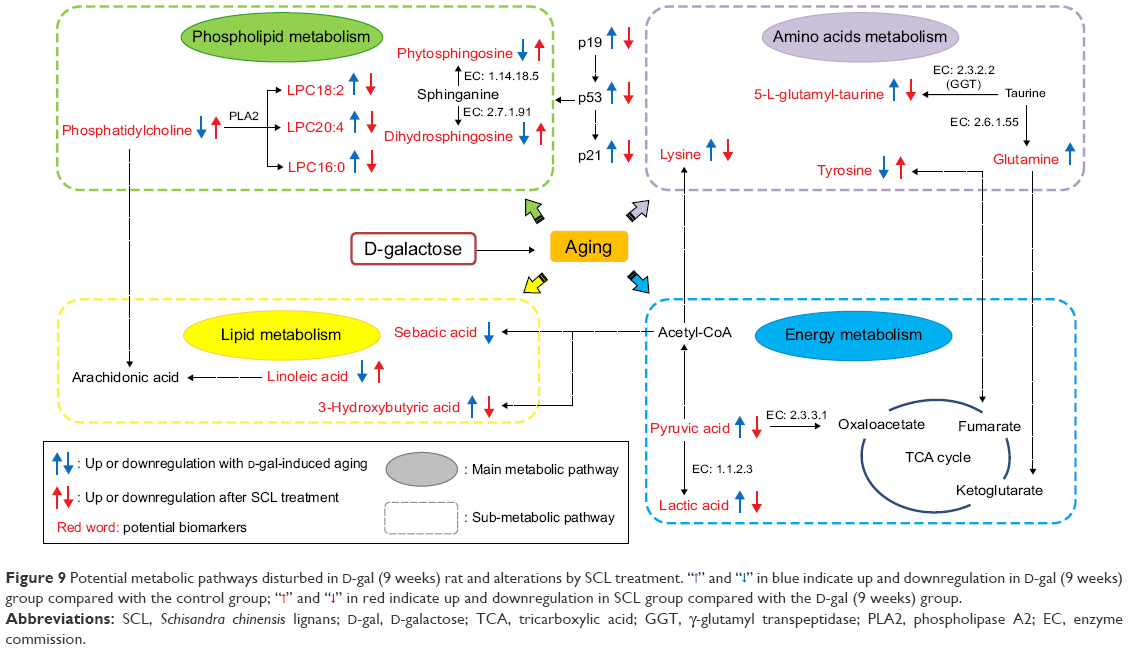 | Figure 9 Potential metabolic pathways disturbed in D-gal (9 weeks) rat and alterations by SCL treatment. “ |
 ” and “
 ” in blue indicate up and downregulation in D-gal (9 weeks) group compared with the control group; “
 ” and “
 ” in red indicate up and downregulation in SCL group compared with the D-gal (9 weeks) group.
Cell stress factors, such as hypoxia, nitrative stress, genetic toxicity, and telomere shortening, can cause cell cycle arrest and cell senescence or apoptosis, thereby limiting the proliferation of damaged cells and preventing the cells from canceration.37–39 p53, as a protein located in the key nodes of a variety of regulatory networks, plays a very important role in maintaining the cell cycle, and ensuring the integrity of cell genome and the response of cells to various stresses.40,41 p19ARF is the upstream gene of p53; the expression of p19ARF can inhibit the translocation of Mdm2 from the cytoplasm to the nucleus, and p19ARF can increase the expression of p53 by blocking the translocation of Mdm2. The downstream target molecule of p53 is p21, an inhibitor of cyclin-dependent protein kinase, which can inhibit the cell cycle to result in an irreversible growth arrest of the cells. The results of this study showed that SCL could reduce the expression of p19, p53, and p21 genes in the brain tissue of aging rats, indicating that SCL can exert its antiaging effect by downregulating p19, p53, and p21 genes to regulate the cell cycle.
Conclusion
In the present study, an RRLC-Q-TOF-MS-based metabolomic approach was employed to reveal the metabolic regulation of SCL on aging rats induced by D-gal. It turned out that the administration of SCL could partially recover the metabolism dysfunction caused by D-gal via several possible metabolic pathways: energy metabolism, amino acid metabolism, lipid metabolism, and phospholipid metabolism, and the mechanism may be related to the downregulation of SCL on p19, p53, and p21 signaling pathways. This study may provide a theoretical basis for the prevention and treatment of aging.
Acknowledgments
This project was supported by the National Natural Science Foundation of China (81641138), Natural Science Foundation of Jilin Province (20150101230JC; 201603103YY), and Jilin Science and Technology Bureau (20166018).
Disclosure
The authors report no conflicts of interest in this work.
References
Yan TX, Shang L, Wang MS, et al. Lignans from Schisandra chinensis ameliorate cognition deficits and attenuate brain oxidative damage induced by D-galactose in rats. Metab Brain Dis. 2016;31(3):653–661. | ||
Yu CY, Yu CR, Li H, et al. Schisandra total lignin attenuates apoptosis of endoplasmic reticulum pathway to delay mouse brain aging. Chin J Pathophysiol. 2014;30(11):1967–1973. | ||
Yu CY, Yu CR, Jing S, et al. Effects of Schisandra total lignin on autophagy and apoptosis of mouse brain aging induced by D-galactose. J Jilin Univ. 2014;40(6):1210–1215. | ||
Ellis DI, Dunn WB, Griffin JL, Allwood JW, Goodacre R. Metabolic fingerprinting as a diagnostic tool. Pharmacogenomics. 2007;8(9):1243–1266. | ||
Legg K. Metabolomics: gaining insight into pain. Nat Rev Drug Discov. 2012;11(3):188–189. | ||
Lindon JC, Holmes E, Nicholson JK. Metabonomics in pharmaceutical R&D. FEBS J. 2007;274(5):1140–1151. | ||
Kumar A, Dogra S, Prakash A. Effect of carvedilol on behavioral, mitochondrial dysfunction, and oxidative damage against D-galactose induced senescence in mice. Naunyn Schmiedebergs Arch Pharmacol. 2009;380(5):431–441. | ||
Wei H, Li L, Song Q, Ai H, Chu J, Li W. Behavioural study of the D-galactose induced aging model in C57BL/6J mice. Behav Brain Res. 2005;157(2):245-251. | ||
Wang C, He L, Yan M, Zheng GY, Liu XY. Effects of polyprenols from pine needles of Pinus massoniana on ameliorating cognitive impairment in a D-galactose-induced mouse model. Age. 2014;36(4):9676. | ||
Sun SW, Yu HQ, Zhang H, Zheng YL, Wang JJ, Luo L. Quercetin attenuates spontaneous behavior and spatial memory impairment in D-galactose–treated mice by increasing brain antioxidant capacity. Nutr Res. 2007;27(3):169-175. | ||
Sun JH, Liu X, Cong LX, et al. Metabolomics study of the therapeutic mechanism of Schisandra Chinensis lignans in diet-induced hyperlipidemia mice. Lipids Health Dis. 2017;16(1):145–158. | ||
Head T, Daunert S, Goldschmidt-Clermont PJ. The aging risk and atherosclerosis: a fresh look at arterial homeostasis. Front Genet. 2017;8:216. | ||
HMDB Online. Available from: http://www.hmdb.ca/. Accessed February 17, 2017. | ||
LIPID MAPS Online. Available from: http://www.lipidmaps.org/. Accessed February 19, 2017. | ||
KEGG Online. Available from: http://www.genome.jp/kegg/. Accessed February 19, 2017. | ||
Krautbauer S, Meier EM, Rein-Fischboeck L, et al. Ceramide and polyunsaturated phospholipids are strongly reduced in human hepatocellular carcinoma. Biochim Biophys Acta. 2016;1861(11):1767–1774. | ||
Carroll B, Donaldson JC, Obeid L. Sphingolipids in the DNA damage response. Adv Biol Regul. 2015;58:38–52. | ||
Heffernan-Stroud LA, Obeid LM. p53 and regulation of bioactive sphingolipids. Adv Enzyme Regul. 2011;51(1):219–228. | ||
Rueda-Rincon N, Bloch K, Derua R, et al. p53 attenuates AKT signaling by modulating membrane phospholipid composition. Oncotarget. 2015;6(25):21240–21254. | ||
Kakisaka K, Cazanave SC, Fingas CD, et al. Mechanisms of lysophosphatidylcholine-induced hepatocyte lipoapoptosis. Am J Physiol Gastrointest Liver Physiol. 2012;302(1):77–84. | ||
Kemp MQ, Jeffy BD, Romagnolo DF. Conjugated linoleic acid inhibits cell proliferation through a p53-dependent mechanism: effects on the expression of G1-restriction points in breast and colon cancer cells. J Nutr. 2003;133(11):3670–3677. | ||
Zierhut ML, Yen YF, Chen AP, et al. Kinetic modeling of hyperpolarized 13-pyruvate metabolism in normal rats and TRAMP mice. J Magn Reson. 2010;202(1):85-92. | ||
Ramos KR, Valdehuesa KN, Liu H, Nisola GM, Lee WK, Chung WJ. Combining De Ley–Doudoroff and methylerythritol phosphate pathways for enhanced isoprene biosynthesis from D-galactose. Bioprocess Biosyst Eng. 2014;37(12):2505–2513. | ||
Chang YF, Gong WX, Zheng YH, et al. Urinary metabolomics study of the effects of Scutellaria baicalensis Georgi ethanol extract on D-galactose-induced rats. Acta Pharmaceutica Sinica. 2016;51(1):86–92. | ||
Udenfriend S, Wyngaarden JB. Precursors of adrenal epinephrine and norepinephrine in vivo. Biochim Biophys Acta. 1956;20(1):48–52. | ||
Chu H, Zhang A, Han Y, et al. Metabolomics approach to explore the effects of Kai-Xin-San on Alzheimer’s disease using UPLC/ESI-Q-TOF mass spectrometry. J Chromatogr B Analyt Technol Biomed Life Sci. 2016;1015–1016:50–61. | ||
Durani LW, Hamezah HS, Ibrahim NF, et al. Age-related changes in the metabolic profiles of rat hippocampus, medial prefrontal cortex and striatum. Biochem Biophys Res Commun. 2017;493(3):1356–1363. | ||
Adeva-Andany MM, Calvo-Castro I, Fernández-Fernández C, Donapetry-García C, Pedre-Piñeiro AM. Significance of l-carnitine for human health. Iubmb Life. 2017;69(8):578–594. | ||
Teunissen CE, De Vente J, von Bergmann K, et al. Serum cholesterol, precursors and metabolites and cognitive performance in an aging population. Neurobiol Aging. 2003;24(1):147–155. | ||
Huang Q, Lu YH, Wang GJ, et al. Metabonomic profiling of plasma metabolites in wistar rats to study the effect of aging by means of GC/TOF/MS-based techniques. Yao Xue Xue Bao. 2009;44(10):1095–1101. | ||
Beydoun MA, Kaufman JS, Satia JA, Rosamond W, Folsom AR. Plasma n-3 fatty acids and the risk of cognitive decline in older adults: the Atherosclerosis Risk in Communities Study. Am J Clin Nutr. 2007;85(4):1103–1111. | ||
Wang M, Wang F, Wang YN, et al. Metabonomics study of the therapeutic mechanism of Gynostemma pentaphyllum and atorvastatin for hyperlipidemia in rats. PLoS One. 2013;8(11):e78731. | ||
Koltover VK. Free radical timer of aging: from chemistry of free radicals to systems theory of reliability. Curr Aging Sci. 2016;10(1):12–17. | ||
Fu C, Wang T, Wang Y, et al. Metabonomics study of the protective effects of green tea polyphenols on aging rats induced by d-galactose. J Pharm Biomed Anal. 2011;55(5):1067–1074. | ||
Lee ES, Charlton CG. 1-Methyl-4-phenyl-pyridinium increases S-adenosyl-l-methionine dependent phospholipid methylation. Pharmacol Biochem Behav. 2001;70(1):105–114. | ||
Toledo JB, Arnold M, Kastenmüller G, et al. Metabolic network failures in Alzheimer’s disease: a biochemical road map. Alzheimers Dement. 2017;13(9):965–984. | ||
Soussi T, Dehouche K, Béroud C. p53 website and analysis of p53 gene mutations in human cancer: forging a link between epidemiology and carcinogenesis. Hum Mutat. 2000;15(1):105–113. | ||
Krejci O, Wunderlich M, Geiger H, et al. p53 signaling in response to increased DNA damage sensitizes AMLI-ETO cells to stress-induced death. Blood. 2008;111(4):2190–2198. | ||
Cuenin S, Tinel A, Janssens S. p53-induced protein with a death domain (PIDD) isoforms differentially activite nuclear factor-kappaB and caspase-2 in response to genotoxic stress. Oncogene. 2008;27(3):389–396. | ||
May P, May E. Twenty years of p53 research: structural and functional aspects of the p53 protein. Oncogene. 1999;18(53):7621–7636. | ||
Kern SE, Kinzler KW, Bruskin A, et al. Identification of p53 as a sequence-specific DNA-binding protein. Science. 1991;252(5013):1708–1711. |
 © 2018 The Author(s). This work is published and licensed by Dove Medical Press Limited. The full terms of this license are available at https://www.dovepress.com/terms.php and incorporate the Creative Commons Attribution - Non Commercial (unported, v3.0) License.
By accessing the work you hereby accept the Terms. Non-commercial uses of the work are permitted without any further permission from Dove Medical Press Limited, provided the work is properly attributed. For permission for commercial use of this work, please see paragraphs 4.2 and 5 of our Terms.
© 2018 The Author(s). This work is published and licensed by Dove Medical Press Limited. The full terms of this license are available at https://www.dovepress.com/terms.php and incorporate the Creative Commons Attribution - Non Commercial (unported, v3.0) License.
By accessing the work you hereby accept the Terms. Non-commercial uses of the work are permitted without any further permission from Dove Medical Press Limited, provided the work is properly attributed. For permission for commercial use of this work, please see paragraphs 4.2 and 5 of our Terms.