")
Back to Journals » Clinical Interventions in Aging » Volume 16
Metabolomics Study of Isocaloric Different Dietary Patterns on the Life Span in Healthy Population
Authors Zhang C, Yan Q, Zhu Q, Liu J, Dong Y, Li Y, Wang R, Tang X, Lv X, Li X, Cai Y, Niu Y
Received 6 October 2021
Accepted for publication 14 December 2021
Published 22 December 2021 Volume 2021:16 Pages 2111—2123
DOI https://doi.org/10.2147/CIA.S343057
Checked for plagiarism Yes
Review by Single anonymous peer review
Peer reviewer comments 4
Editor who approved publication: Dr Zhi-Ying Wu
Cong Zhang,1,2,* Qingna Yan,1,* Qiushuang Zhu,1,* Jinxiao Liu,1,* Yuanjie Dong,1 Yuqiao Li,1 Ruohua Wang,1 Xuanfeng Tang,1 Xinyi Lv,1 Xiaoqing Li,1 Yunjiang Cai,3 Yucun Niu1
1Department of Nutrition and Food Hygiene, Public Health College, Harbin Medical University, Harbin, 150086, People’s Republic of China; 2Center of Disease Control and Prevention of Xishan District, Wuxi, 214000, People’s Republic of China; 3Nursing College of Daqing Campus of Harbin Medical University, Daqing, 163319, People’s Republic of China
*These authors contributed equally to this work
Correspondence: Yucun Niu
Department of Nutrition and Food Hygiene, College of Public Health, Harbin Medical University, 157 Baojian Road, Nangang District, Harbin, 150081, People’s Republic of China
Tel +86-451-8750-2730
Fax +86-451-8750-2885
Email [email protected]
Purpose: How to prolong life by diet has been widely concerned. There are many reports about the effects of different dietary patterns on life span, but the results are not consistent. The main reason may be that total energy intake has not been considered. This study aims to explore the effects of isocaloric different dietary patterns on population life span.
Materials and Methods: From the data of the follow-up population, eligible participators were divided into normal control (NC) group (28.31% fat, 12.37% protein, 62.30% carbohydrate), isocaloric high-fat (IHF) group (38.39% fat, 12.21% protein, 51.32% carbohydrate), isocaloric high-protein (IHP) group (33.41% fat, 17.10% protein, 52.67% carbohydrate) and isocaloric high-carbohydrate (IHC) group (22.23% fat, 10.52% protein, 70.13% carbohydrate) according to the dietary structure and the age stratification. Global serum metabolic profiling analysis by UPLC−Q-TOF-MS/MS technology, fatty acid and amino acid profiles in serum were determined by GC-MS and UPLC-TQ-MS technology. One-way ANOVA followed by Dunnett post hoc test and receiver operating characteristic (ROC) curve analysis were used to statistical analysis.
Results: Non-targeted metabolomics was to identify 18 potential metabolites related to longevity. ROC curve analysis to identify biomarkers indicated that the areas under the ROC (AUC) of the 12 of 18 biomarkers are above 0.9. The 12 biomarkers were mainly enriched in three metabolic pathways: lipid metabolism, amino acid metabolism and tricarboxylic acid cycle. Compared to control, 11 and 10 of 12 biomarkers showed the same trend with aging in IHP and IHC groups, respectively. Conversely, no differences were observed between IHF group and NC group.
Conclusion: Without consideration of the nature of carbohydrates, fats and proteins, IHP and IHC diets might shorten life span by influencing amino acid metabolism, lipid metabolism and tricarboxylic acid cycle metabolism, while the isocaloric IHF diet has no effects on longevity.
Keywords: amino acid, fatty acid, biomarkers, metabolomics
Introduction
Lifespan is affected by many factors, among which dietary intakes are crucial factors.1 To date, the effective interventions that coincidentally has been proven to increase lifespan in nematodes and primates are caloric restriction (CR) and dietary patterns.2,3 There is general agreement that CR extends life span and retards age-related chronic diseases in a variety of species from yeast to humans.4 But which dietary pattern is more conducive to longevity and health is still debated. Studies have shown that low protein/high carbohydrate diet can extend the life of mice, furthermore, high-carbohydrate diet lower circulating BCAAs hepatic mTOR activation and insulin levels to longevity.5 Lee et al found that the higher the carbohydrate: protein (C:P) ratio is, the longer the lifespan of drosophila will be, with longevity highest at a protein-to-carbohydrate ratio of 1:16.6 However, another study found that on the condition of controlling energy intake, the most extreme low-carbohydrate diets, the ketogenic diet extends longevity and health span in adult mice.7 We speculate one reason for these inconsistencies is controlled calorie intake. In addition, such studies have limited human data. Thus, it is necessary to design an experiment to study effects of different dietary patterns on lifespan in healthy population with controlling the total energy intake.
Despite the fact that identifying the impact of isocaloric different dietary patterns to lifespan in humans is intrinsically challenging, both animal experiments and human studies point to alterations in metabolism as being the central and likely highest-yield targets for investigation.8,9 Metabolomics can use dynamic processes to study the changes of metabolites at different periods to identify biomarkers associated with aging and successfully applied to study the effects of nutritional interventions and aging.10 For example, an animal study found that the taurine, citric acid, succinic acid, tyrosine and α-methylnicotinamide in urine, as well as the ketoglutaric acid, bile salts, isoleucine and methionine in fecal were associated with longevity.11 A metabolomics-based human investigation discovered unique polar compounds and lipid analytes related to longevity, including citric acid cycle intermediates and the bile acid taurocholate.12 Besides, the complex remodeling of lipid and amino acid metabolism is a key regulatory process of human longevity, which also deserves attention.13,14
Metabolomics is used to detect a large number of small components, and has been widely used in the study of nutrition, chronic diseases and longevity through the use of animal and human serum or urine samples.10 Especially UPLC-TQ- MS and GC-MS technology are being widely used to analyze serum amino acid and fatty acid profiles in both animals and humans. Principal component analysis (PCA) principal component analysis (PCA), partial least squares discriminant analysis (PLS-DA) and S-plot are recognized methods for metabolic analysis that enable high-throughput data analysis of samples.
To this end, the study was designed to examine the relationship between age and serum metabolites, and to determine if different isocaloric dietary patterns have an influence within these groups.
Materials and Methods
Chemicals and Reagents
Acetonitrile, methanol and formic acid (chromatographic grade) were purchased from Thermo Fisher Scientific, Inc (Loughborough, UK). Normal hexane and isopropyl alcohol (chromatographic grade) were purchased from the Tianjin Reagent Company (Tianjin, China). Leucine-enkephalin was purchased from Sigma Aldrich (St. Louis, MO). Ultrapure water was prepared by an ultra clear system (PURELAB Ultra, Veolia Water Solutions & Technologies, France).
Subjects and Grouping
The Harbin Cohort Study on Diet, Nutrition and Chronic Noncommunicable Disease (HDNNCDS) was launched in 2010 by the national key discipline, Department of Nutrition and Food Hygiene at Harbin Medical University.15 The HDNNCDS covered 7 urban administrative regions of Harbin. Each region was divided into 3 strata according to their financial situation, and a total of 42 communities were randomly selected from each stratum in each administrative region by performing a stratified multistage random cluster sampling design.
Subjects were eligible to enter in the study if they (1) were between 20 and 74 years old, (2) had been living in Harbin for at least 2 years, (3) were without cancer, and (4) took in energy within the recommended 10% range in two surveys (2015 and 2016) according to the provisions of the “reference intake of dietary nutrients for Chinese residents” (2013 edition) (Table 1).
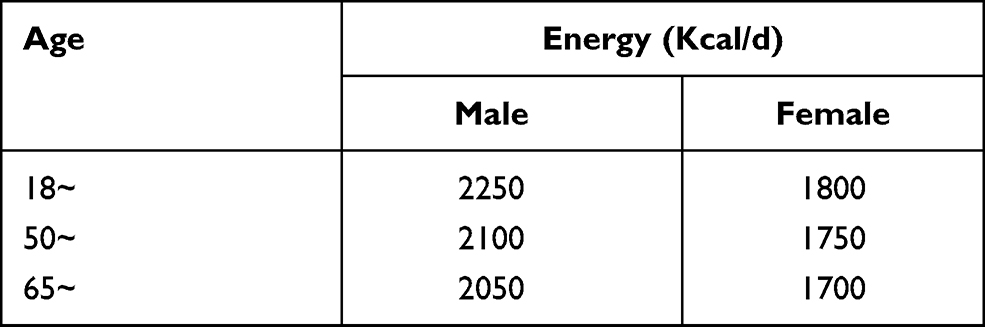 |
Table 1 Recommended Energy Intake Standards for Dietary Nutrients for Chinese Residents (2013 Edition) |
The criteria for exclusion were smoking (those who have smoked at least 100 cigarettes lifetime and smoke every day or some days now), drinking (those who consumed≥1 alcoholic drink each month in the past 12 months before the survey) and being pregnant or lactating. Furthermore, individuals were excluded if having common chronic diseases (hypertension, hyperlipidemia, diabetes, cardio-cerebrovascular diseases), family history (hypertension, diabetes, asthma, hyperlipidemia and blood diseases) and previous medical history (hypertension, hyperlipidemia, diabetes, cardio-cerebrovascular diseases, asthma and blood diseases) according to followed-up from 2015 to 2016.
The energy supply ratio of protein, fat, carbohydrate and energy intake of subjects were evaluated by the validated semi-quantitative food frequency questionnaire (FFQ) containing the data regarding usual dietary intake over the past 12 months, including 103 food items from 14 food groups which are rice, wheaten food, potato starch and its products, beans and its products, vegetables, fruits, livestock and its products, poultry and its products, milk and its products, eggs and its products, fish and its products, snack, beverage, and ice cream.15 Before the 2015 survey, the following study was conducted to evaluate the validity and repeatability of the FFQ. A random subsample of 200 participants was recruited from 4 of the 42 study communities to complete two FFQs and a 3-day dietary record. After adjusting for energy intake, major nutritional factors (staple food, poultry, fish, vegetable, fruit, beans, and milk products) which were assessed by the two FFQs and DRs correlated well. This indicates that the FFQ used in the HDNNCDS is a reliable method for assessing dietary intake. In terms of quality control, the questionnaire did not include any self-administered information which was needed to be filled in by participants themselves and all surveys were recorded in-person by the well trained interviewers.
Participants who met all inclusion criteria were divided into four isocaloric groups including normal control (NC) group, isocaloric high-protein (IHP) group, isocaloric high-fat (IHF) group and isocaloric high-carbohydrate (IHC) group. In the NC group, the energy supply ratio of protein, fat and carbohydrate was in line with the reference intake of dietary nutrients for Chinese residents, that is, the energy supply ratio of protein, fat and carbohydrate was in the range of 10%~15%, 20%~30% and 50%~65%, respectively. Averagely, in NC group, 28.31%kcal is fat, 12.37%kcal is protein and 62.30%kcal is carbohydrate. The upper quartile group whose protein, fat and carbohydrate intake account for the percentage of total energy intake were divided into IHF (38.39%kcal from fat), IHP (17.10%kcal from protein) and IHC (70.13%kcal from carbohydrate) group, respectively. Each group was stratified according to the Chinese population age classification standards (young adult aged 18–40, middle-aged people aged 41–65 and old people aged over 65). 15 subjects were randomly selected from each age group, and 45 subjects were included in each isocaloric diet group. The project was approved by the Ethics Committee of Harbin Medical University, and written informed consent was provided by all subjects.
Global Serum Metabolic Profiling Analysis by UPLC−Q-TOF-MS/MS
Serum samples stored at −80 °C refrigerator were melted in the 4 °C refrigerator, gradually reaching the room temperature. Methanol (200 μL) was added to the serum (100 μL) at room temperature and vortexed for 2 min, and then centrifuged at 12,000 rpm for 10 min at 4 °C. The supernatant was evaporated to dryness by a Bath Nitrogen Blow Instrument (TTL-DCI, Beijing, China) and a mixture of acetonitrile and water (1:2, 100 μL) was then added to each tube. The mixture was vortexed for 2 min, and then separated by centrifugation at 12,000 rpm for 10 min at 4 °C. Meanwhile, the quality control (QC) sample was prepared by mixing equal volumes (100 μL) from each sample supernatant. All samples were then transferred to autosampler vials for serum metabolomics analysis.
UPLC−Q-TOF-MS/MS analysis was performed using a Waters ACQUITY UPLC System (Waters Corp., Milford, MA) coupled to a Waters Xevo G2 Q-TOF Mass Spectrometry (Waters, Manchester, UK). Equipped with a UPLC BEH C18 column (100 mm 2.1 mm, i.d. 1.7 mm, Waters Corp., Milford, MA). The conditions of UPLC included flow rate0.35 mL/min,injection volume 2 mL, solvent A 0.1% formic acid, solvent B acetonitrile and MS included desolvation gas (nitrogen) flow 650 L/h, desolvation temperature 300 °C, cone gas (nitrogen) flow 50 L/h, source temperature 120 °C, capillary voltage (POS) 3000 V, capillary voltage (NEG) 2800 V, sample cone voltage 35 V, collision energy 6 eV. To ensure accuracy and reproducibility of all analyses, Leucine enkephalin was used as the lock mass via a lock spray interface at a flow rate of 10 mL/min for monitoring in the positive ([M + H]+ = 556.2771) and negative ion modes ([M - H]-= 554.2615). The lock spray frequency was set at 10s, and the lock mass data were averaged over 10 scans for correction. Moreover, the stability of the system was evaluated using a mixture of QC sample at interval of 10 samples.
The raw data were imported into the MarkerLynx software incorporated in the Masslynx software (version 4.1 SCN 714). MarkerLynx ApexTrack peak integration was used for peak detection and alignment. After being recognized and aligned, the peak area of each ion was normalized to the summed total ion intensity of each chromatogram to take into account the variation in serum concentration and volume. The 3-D data including peak number (RT−m/z pair), sample name and normalized peak areas were exported to SIMCA-P version 13 software (Umetrics). Data reduction was handled according to the “80% rule”; thus, only the variables with values were greater than zero presenting in at least 80% of each group were kept for the following analysis. Perform detailed multivariate statistical analyses, such as principal component analysis (PCA), partial least squares discriminant analysis (PLS-DA) and S-plot. Prior to multivariate statistical analysis, the data was processed using Pareto scaling. Here, PCA was used to evaluate the reliability of the resulting dataset (including QC samples), and also to provide a general visual separation of all samples. The supervised PLS-DA was performed to better distinguish the different age groups. Moreover, a default 7-fold cross validation and testing with 200 random permutations were performed in order to avoid over-fitting of supervised PLS-DA model. The variable importance in the projection (VIP) values of all peaks from the PLS-DA model was taken as a coefficient for peak selection. VIP values were calculated from all extracted components Indicating the value of contribution of each substance to the variance. Multivariate and folding metabolites (VIP >1.0 and folding >1.5 or <0.6) were considered as life-related markers.16 Biomarker identification and metabolic pathway determination were achieved by comparison with online free databases such as human metabolome database (https://www.hmdb.ca/) and Kyoto encyclopedia of genes and genomes (https://www.kegg.jp/) using exact m/z values and MS/MS spectra and validation with available standard compounds.
Serum Amino Acid Profile Analysis
Each 30 µL serum sample was used for metabolite extraction before UPLC-TQ- MS analysis. The metabolite extraction procedure was carried out after adding 10 μL (100 μg/mL) internal standard solution of norleucine and 80 µL acetonitrile/methanol/formic acid (74.9:24.9:0.2 v/v/v), vortex-mixed for 30 s, stood on the ice 30 min, and centrifuged at 15,000 rpm for 20 min at 4 °C. The supernatant were transferred to the vial tube. Overnight (12 h) at −20 °C, centrifuged at 15,000 rpm for 15 min at 4 °C. Take the supernatant in the lining tube, put it into the liquid sample tray, and take 2 µL into the liquid chromatography-mass spectrometer for detection.
UPLC-TQ-MS analysis was performed using a Waters ACQUITY UPLC system (Waters Corporation, Milford, MA, USA) coupled to a Waters Xevo TQD Mass Spectrometer (Waters Corporation, Manchester, UK). Equipped with an ACQUITY UPLCTM HILIC column (100 mm × 2.1 mm i.d., 1.7 μm; Waters Corporation, Milford, MA, USA). The conditions of UPLC included flow rate 0.30 mL/min,injection volume 2 mL, solvent A 10 mM ammonium formate and 0.1% formic acid, solvent B acetonitrile with 0.1% formic acid and MS included desolvation gas (nitrogen) flow 650 L/h, desolvation temperature 40 °C, cone gas (nitrogen) flow 50 L/h, source temperature 150 °C, capillary voltage 3200 V, sample cone voltage 35V.
Serum Free Fatty Acids Profile Analysis
200 μL serum were spiked with 200 μL internal standard solution (200 ug/ mL) of Methyl Heptadecanoate and 2 mL 0.4 M KOH–CH3OH was added, vortex-mixed for 1 min and placed at room temperature for 10 min, add a certain amount of anhydrous sodium sulfate. Then, it was extracted with 2 mL of hexane twice using a vortex mixer for 30 s, and discarded the supernatant. After that, some anhydrous sodium sulfate were added to remove traces of water and 2 mL 5% H2SO4–CH3OH was added to the residuary phase, reacted at 62 °C water bath for 2 h. Then, extracted with 2mL of hexane twice using a vortex mixer for 30 s and the methyl ester FFA were obtained. Samples were evaporated to dryness under N2. Hexane (100 μL) was added to each tube when analysis.
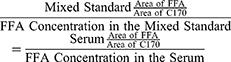
GS-MS analysis was performed using gas chromatography coupled to an ion-trap mass spectrometer (TRACE GC/PolarisQMS, Thermo Finnigan, USA), separation was performed on a J&W DB-WAX capillary column (30 m×0.25 mm, 0.25 μm; J&W Scientific Folsom, CA). The measured temperature was: (1) the initial temperature was 50 °C, and the temperature was increased to 200 °C at the rate of 10 °C/min for 2 min. (2) the temperature was raised to 220 °C at the rate of 10 °C/min for 15 min. Interspersed samples with mixed serum were used for quality control to correct for differences between batches. The concentration is calculated as follows.
Statistical Analysis
Statistical analysis was done by SPSS (version 25.0 Beijing Stats Date Mining Co. Ltd., China). We used one-way ANOVA followed by Dunnett post hoc test to compare the differences between the two groups, adjusted covariates including energy, BMI, and energy/BMI. Statistical significance was considered at P <0.05. We performed receiver operating characteristic (ROC) curve analysis as a second method to identify biomarkers. The metabolites of areas under the ROC (AUC)>0.9 were selected as biomarkers.
Results
Biochemical Characteristics
There was no significant difference in total daily energy intake of each dietary group and age group. The results indicated the grouping meets the requirements. The serum concentrations of blood glucose (GLU), total cholesterol (TCHO), triglyceride (TG), low density lipoprotein (LDL-C) and systemic blood pressure (SBP) were increased significantly with the increase of age (P<0.05). Compared to the NC group, the serum concentrations of TCHO, TG and LDL-C in the IHP group were significantly increased (P<0.05), but the high density lipoprotein (HDL-C) was significantly decreased (P<0.05). Meanwhile the serum concentrations of TCHO and LDL-C concentrations in IHC group were higher (P<0.05) than NC group. And LDL-C concentration in IHF group was higher (P<0.01) than NC group. In addition, the body mass index (BMI), blood uric acid (UA), phosphorus (P) and calcium (Ca) were no difference in age groups and diet groups (Table 2). The sociological characteristics of the participants are in supplementary data (Supplementary Table 1).
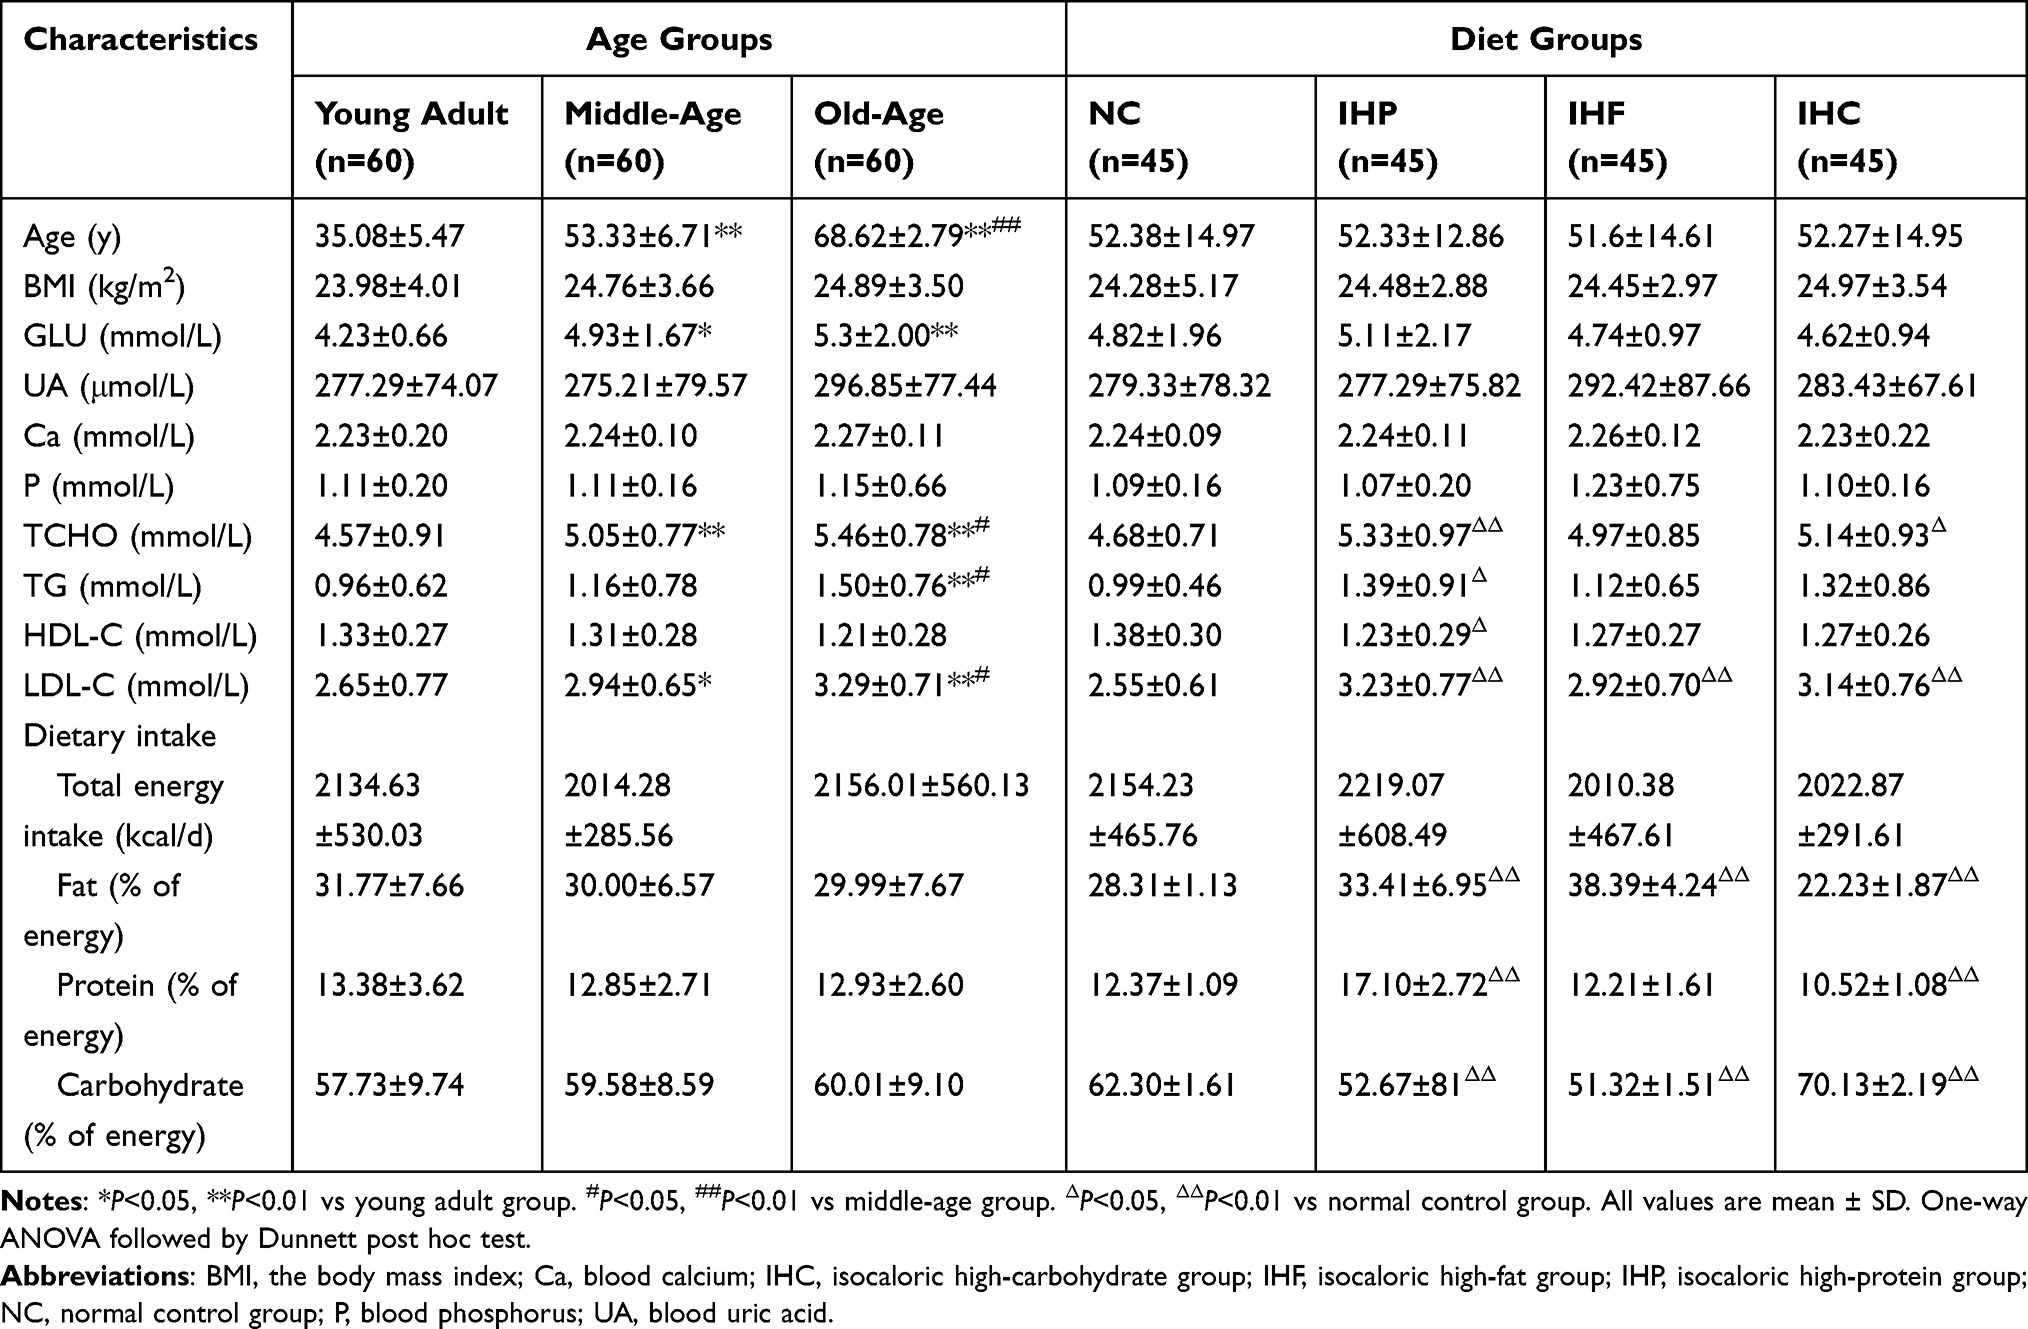 |
Table 2 Characteristics of Participants in Different Age Groups and Different Isocaloric Diet Groups |
UPLC-Q-TOF-MS Data Analysis
Due to the complex composition of metabolites in the blood, the positive mode and negative mode were adopted in this study to carry out non-targeted metabolomics analysis of serum of different age groups. The QC samples were located in the centre and cluster together tightly (Figure 1A and B). The permutation plot strongly indicated that the PLS-DA model was valid (Figure 1C and D). After peak alignment, a total of 16,475 variables (12,369 for positive mode and 4106 for negative mode) were used for multivariate statistical analysis. As displayed by the PLS-DA in positive and negative modes, three different age groups could be separated into distinct clusters with small intra-group differences (Positive mode: Four components, R2Y = 0.979 and Q2 = 0.956; Negative mode: Four components, R2Y = 0.921 and Q2 = 0.878) (Figure 1E and F). In addition, compared with the NC group, IHF, IHP and IHC groups were able to separate significantly in positive and negative modes (Figure 2). Therefore, the above results suggested the body has undergone significant metabolic changes not only in different age groups but also in different isocaloric dietary pattern groups.
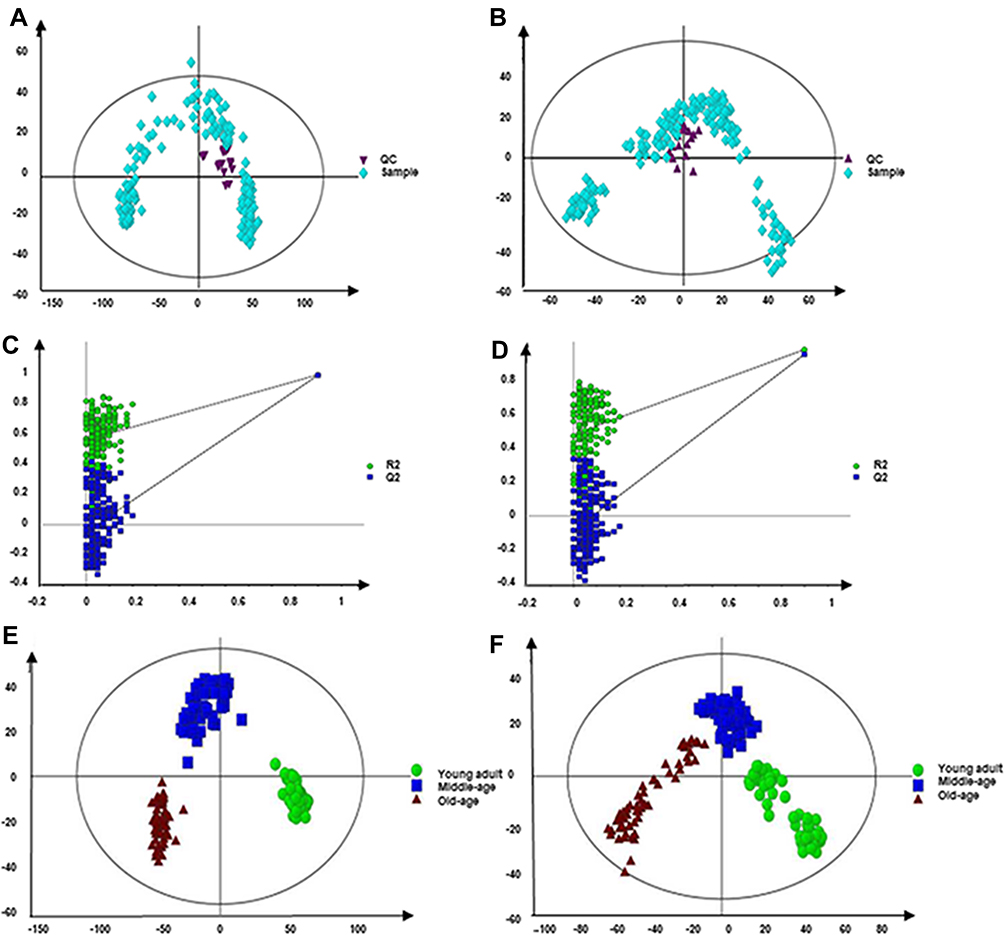 |
Figure 1 PCA scores plot and validation plot of permutation testing of PLS-DA model. (A and B) PCA scores plot generated from serum samples of participants and QC in positive and negative mode. Purple triangle, QC. Light blue diamond, Sample. (C and D) The validation plot of permutation testing of PLS-DA model. (E and F) PLS-DA score plots generated from serum samples of participants in different age groups. Green dot, young group. Blue box, middle-aged group. Crimson triangle, old-aged group. (A, C and E) the positive mode. (B, D and F) the negative mode. |
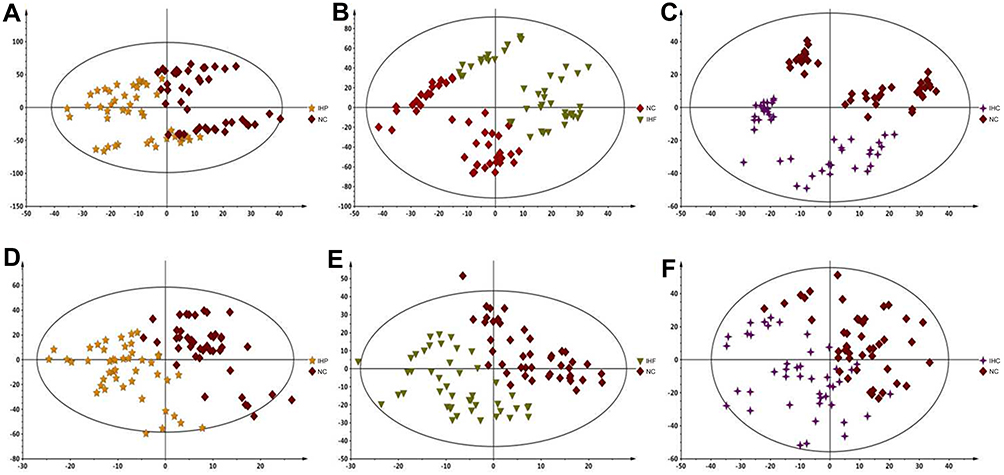 |
Figure 2 PLS-DA score plots generated from serum samples of participants in different diet groups. (A–C) The positive ESI mode. (D–F) The negative ESI mode. |
Identification of Serum Metabolites
We calculated VIP values in the PLS-DA model of different ages. The metabolite ions with VIP values>1.0 were initially selected as distinguishing factors, the 18 potential biomarkers (12 in the positive mode and 6 in the negative mode) were identified in the serum. Furthermore, we performed ROC curve analysis for discrimination of young adult and old-age groups to identify biomarkers. The areas under the ROC (AUCs) of methionine sulfoxide, succinic acid, L-valine, L-threonine, leukotriene F4, cis-aconitic acid, aminoadipic acid, 12, 13-DHOME, glycocholic acid, LysoPC (O-18:0), LysoPE (18:2/0:0), γ-aminobutyric acid were 0.998, 0.979, 0.983, 1.000, 0.965, 0.973, 0.939, 0.948, 0.982, 1.000, 1.000 and 0.971. Serum levels of metabolites sulfoxide, lysophosphatidylcholine (LysoPC (O-18:0)), lysophosphatidylethanolamine (LysoPE (18:2/0:0)), γ-aminobutyric acid, L-valine, L-threonine, glycocholic acid were decreased significantly with age. Conversely, aminoadipic acid, leukotriene F4, succinic acid, cis-aconitic acid, 12, 13-DHOME were increased significantly with age (Table 3, Figure 3).
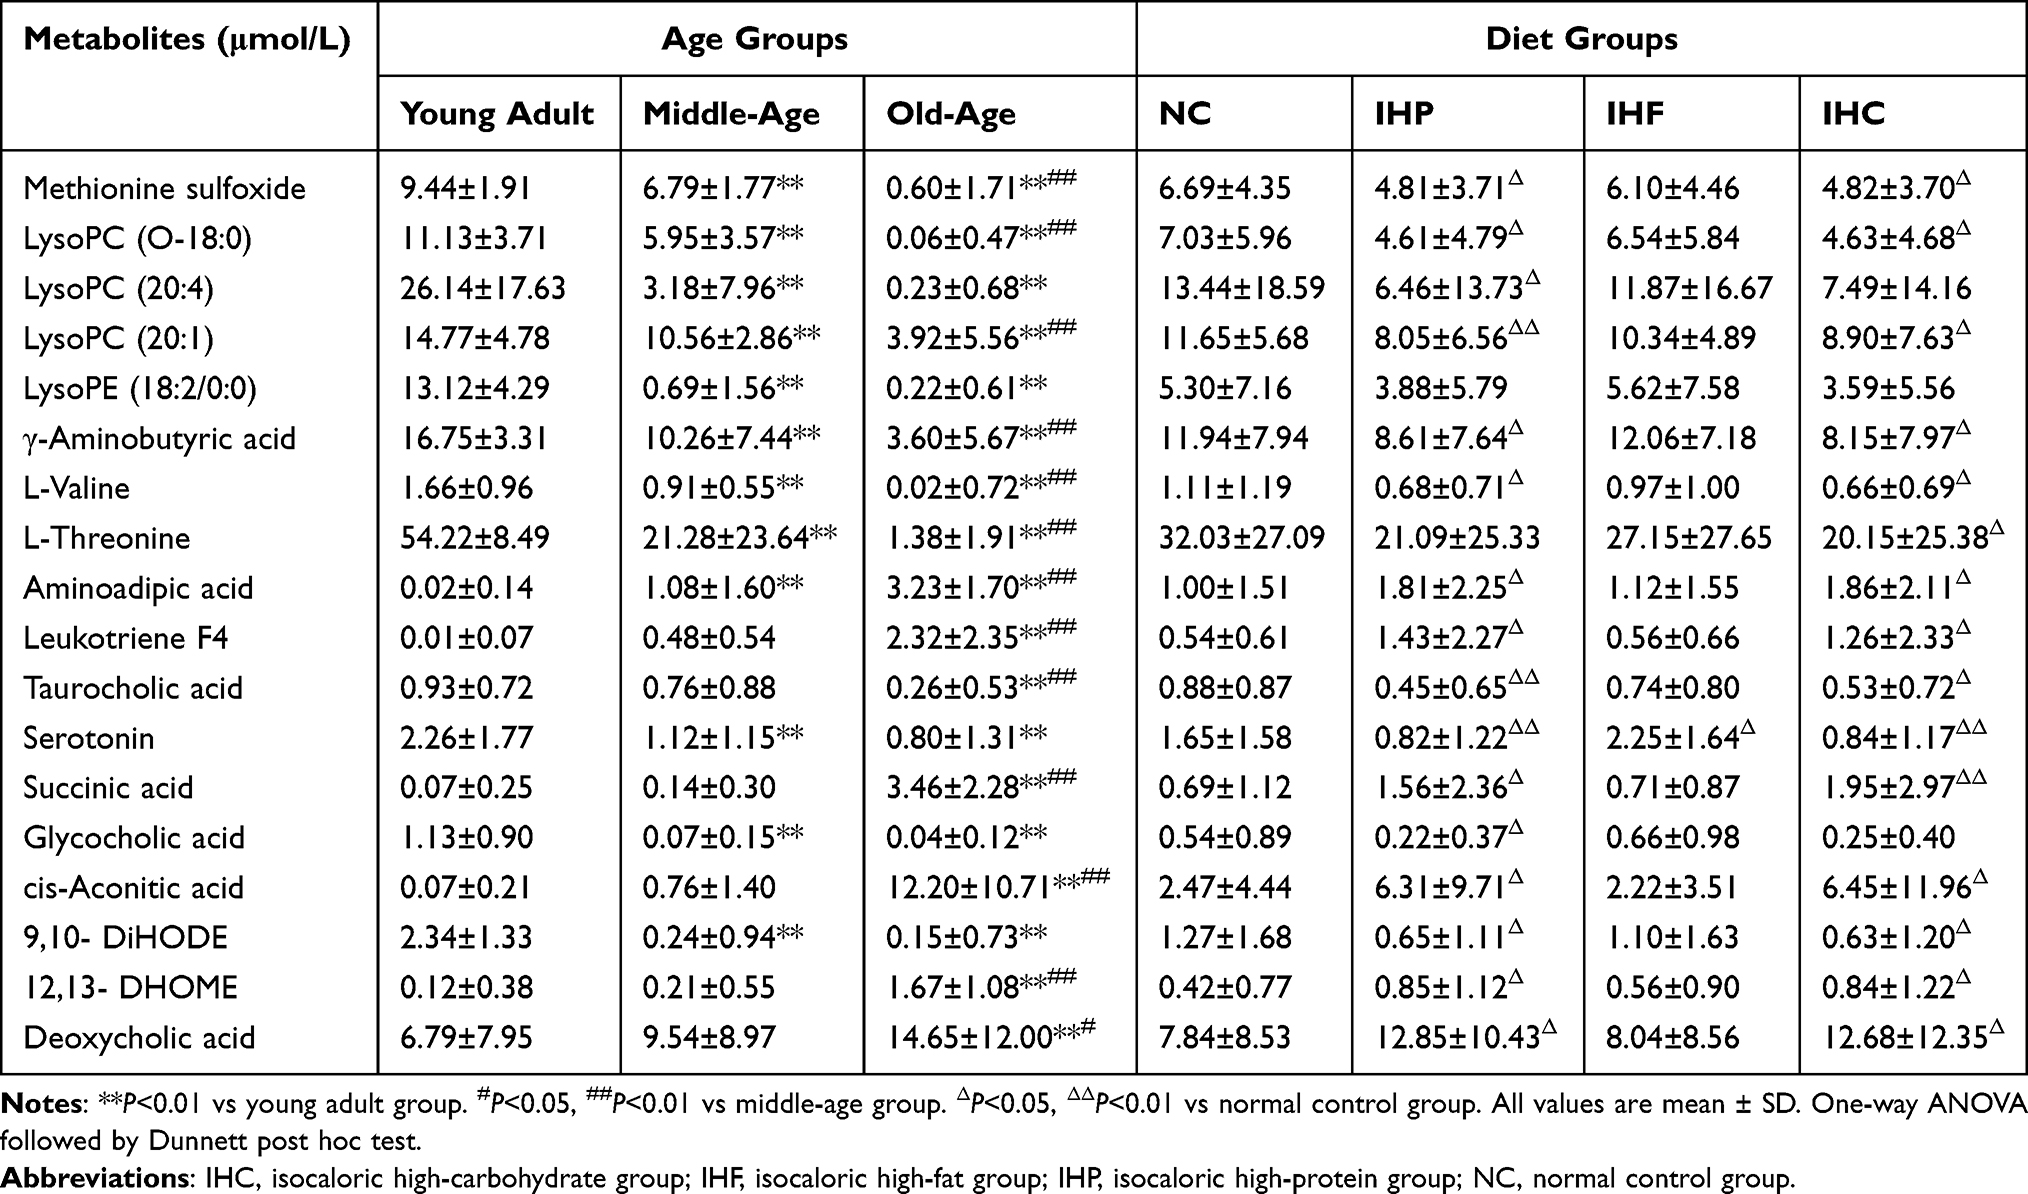 |
Table 3 Ionic Strength of 18 Potential Life-Related Biomarkers in Different Age Groups and Different Isocaloric Diet Groups |
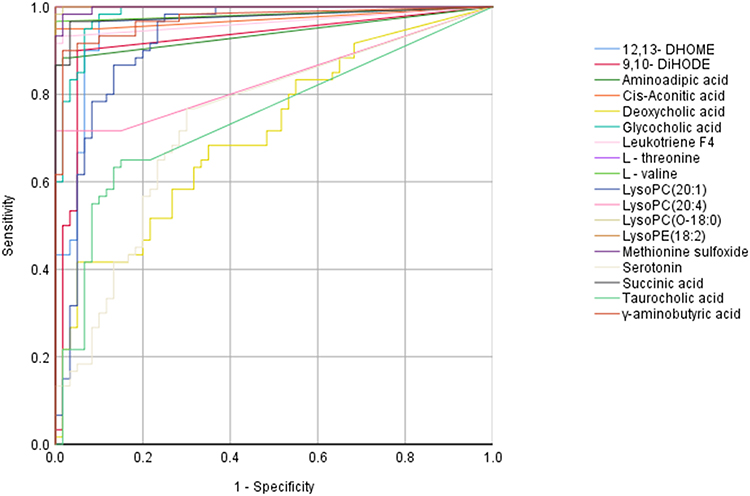 |
Figure 3 ROC curves of 18 potential biomarkers in young adult group vs old-age group. 18 potential biomarkers include LysoPC (20:1) (AUC=0.923), γ-aminobutyric acid (AUC=0.971), L-valine (AUC=0.983), L-threonine (AUC=1), aminoadipic acid (AUC=0.939), leukotriene F4 (AUC=0.965), taurocholic acid (AUC=0.746), serotonin (AUC=0.738), LysoPE (18:2) (AUC=1), succinic acid (AUC=0.979), glycocholic acid (AUC=0.982), cis-Aconitic acid (AUC=0.973), methionine sulfoxide (AUC=0.998), LysoPC (O-18:0) (AUC=1), LysoPC (20:4) (AUC=0.837), 9,10-DiHODE (AUC=0.92), 12,13- DHOME (AUC=0.948), and deoxycholic acid (AUC=0.7130). |
Level of 12 age-related metabolites were analyzed between the IHP, IHC, IHF and NC group, respectively. Results found that IHP group decreased methionine sulfoxide, LysoPC (O-18:0), γ-aminobutyric acid, glycocholic acid, and L-valine levels significantly (P<0.05), increased aminoadipic acid, leukotriene F4, cis-aconitic acid, 12, 13-DHOME, and succinic acid levels significantly (P<0.05). IHC group decreased methionine sulfoxide, LysoPC (O-18:0), γ-aminobutyric acid, L-valine, L-threonine and 9, 10-DiHODE level significantly (P<0.05), increased aminoadipic acid, leukotriene F4, cis-aconitic acid, 12, 13-DHOME, and succinic acid level significantly (P<0.05) (Table 3). Briefly, 11 (excluding LysoPE (18:2/0:0)) and 10 (excluding LysoPE (18:2/0:0) and glycocholic acid) of 12 biomarkers showed same trend with aging in IHP and IHC groups respectively. Conversely, there was no difference in 12 biomarkers between the IHF group and NC group.
Amino Acids in Serum
Most amino acids in serum concentration showed a trend of gradual decline with age. The serum concentrations of threonine, leucine, valine, methionine, isoleucine, tryptophan, serine, glycine, lysine, creatine, taurine, asparagine and tyrosine show a significant decrease with increasing age (P<0.01) (Figure 4A). Compared with the NC group, the serum concentrations of threonine, tryptophan, serine, methionine, lysine, taurine, tyrosine and branched-chain amino acids (leucine, valine and isoleucine) were significantly decreased (P<0.05) in the IHP group and IHC group. There was no significant difference in serum amino acid concentrations between the IHF group and the NC group (Figure 4B).
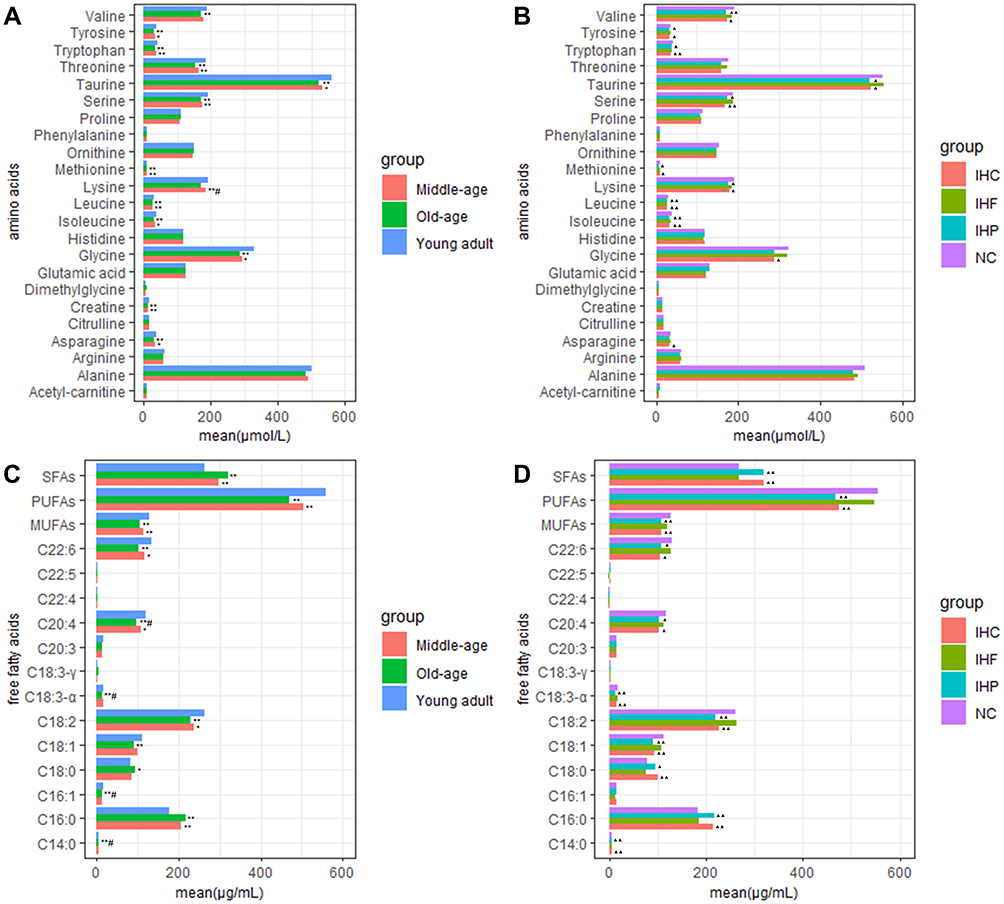 |
Figure 4 One-way ANOVA followed by Dunnett post hoc test of different age groups and diet groups. (A) Comparison of amino acids concentrations in different age groups. (B) Comparison of amino acids concentration in different isocaloric dietary groups. (C) Comparison of free fatty acids concentrations in different age groups. (D) Comparison of free fatty acids concentrations in different isocaloric dietary groups. *P<0.05, **P<0.01 vs young adult group. #P<0.05 vs middle-age group. ▲P<0.05, ▲▲P<0.01 vs normal control group. Abbreviations: NC, normal control group; IHP, isocaloric high-protein group; IHF, isocaloric high-fat group; IHC, isocaloric high-carbohydrate group. |
Free Fatty Acids in Serum
With the increase of age, the concentrations of myristic acid (C14:0), palmitic acid (C16:0), stearic acid (C18:0), and saturated fatty acid (SFAs) in serum were significantly increased (P<0.05). The concentrations of palmitoleic acid (C16:1), oleic acid (C18:1), linoleic acid (C18:2), α-linolenic acid (C18:3-α), arachidonic acid (C20:4), docosahexaenoic acid (C22:6), monounsaturated fatty acids (MUFAs) and polyunsaturated fatty acids (PUFAs) were decreased significantly (P<0.01) (Figure 4C).
The free fatty acids concentrations in serum of different isocaloric dietary groups were significantly different. Compared with the NC group, the concentrations of C18:0, C14:0, C16:0 and SFAs were significantly increased (P<0.05), the concentrations of C20:4, C22:6, C18:1, C18:2, C18:3-α, MUFAs and PUFAs were significantly decreased (P<0.05) in IHP and IHC groups. However, there was no significant difference in free fatty acids between the IHF group and NC group (Figure 4D).
Discussion
In our observation, after fine selecting daily intake of total energy and daily energy supply ratio of the three major nutrients without significant difference in different age groups, and disregarding the composition of fats, the source of proteins and the nature of carbohydrates, 12 metabolites were distinguishable between the young adult and old-age groups. The 12 biomarkers include methionine sulfoxide, succinic acid, L-valine, L-threonine, leukotriene F4, cis-aconitic acid, aminoadipic acid,12,13- DHOME, glycocholic acid, LysoPC (O-18:0), LysoPE (18:2/0:0) and γ-aminobutyric acid, involved in different biochemical metabolic pathways, such as amino acid, lipid, and tricarboxylic acid cycle.
Five metabolites are involved in the amino acid metabolism pathway. Methionine sulfoxide can be considered as a biomarker of oxidative stress in vivo in that upon oxidative stress, it may play a role in the preservation of mitochondrial integrity by decreasing the intracellular reactive oxygen species (ROS) build-up through its scavenging role, hence contributing to cell survival and protein maintenance.17 γ-aminobutyric acid can inhibit the decarboxylation of glutamic acid, thereby reducing blood ammonia concentration and improving liver function. L-valine can repair tissues and regulate blood glucose. L-threonine is involved in the metabolism of fat in the body, and it is easy to appear liver fatty lesion when lacking. Aminoadipic acid, a metabolite of the main biochemical pathway of lysine has been proved that lysine residues can be deoxidized by lysyl oxidase to produce allyllysine and further oxidized to aminoadipic acid. Studies in rats have shown that aminoadipic acid (along with the three branched-chain amino acids-leucine, valine, and isoleucine) levels are elevated in pre-diabetes, so it may serve as a predictive biomarker to predict the development of diabetes.18 Chronic hyperglycaemia in endothelial cells also leads to elevated levels of aminohexanoic acid, which is considered a sign of lysine breakdown through oxidative stress and ROS.19 Aminoadipic acid is a potential small-molecule marker of oxidative stress.20 There are also studies show that aminoadipic acid accumulated with age to large levels.21 The results showed that concentrations of methionine sulfoxide, L-valine, L-threonine, and γ-aminobutyric acid were decreased with age, while aminoadipic acid was increased with age. Meanwhile our amino acids concentration detection results showed that the levels of most amino acids in serum in different age group decrease along with age. Those are supported by the change trend of amino acid concentration in the blood in accelerated aging mice and long-lived mice.22,23 The above results indicate that the changes in the concentration of amino acids and other metabolites in the metabolism of amino acids may be a feature of the aging process, or may lead to increased levels of inflammation and oxidative stress in the body, promoting the occurrence of chronic diseases and accelerating the aging process. We found IHP and IHC diets reduced the serum concentration of most amino acids, such as methionine sulfoxide, L-valine, L-threonine, and γ-aminobutyric acid, while increased the aminoadipate level. However, the IHF diet had little effect on the serum amino acid concentration. This is consistent with mice in Australia that showed a negative correlation between protein intake and the concentration of free fatty acids in their bodies and that mice fed a high-protein diet did not achieve healthy aging.5 Therefore, it suggested that amino acid metabolism of the body may be affected by IHP and IHC diets. Moreover, the change trend of biomarkers in amino acid metabolism under the influence of both diets was the same as the trend of aging. That is, IHP and IHC diets have a certain promoting effect on the occurrence and development of aging in the amino acid metabolism pathway.
Studies have shown that SFAs may be driving factor for increased insulin resistance, cardiovascular disease risk and inflammation in older adults.24 Unsaturated fatty acids play an active and beneficial role in the body. The study of Stanford University in the United States found that the life span of c. elegans could be effectively prolonged under the condition of dietary supplement of MUFAs and endogenous accumulation of MUFAs. Dietary supplementation of long-chain PUFAs can reduce neurodegeneration and inflammation, and its deficiency may lead to the occurrence of cardiovascular diseases, hypertension, type 2 diabetes and other chronic diseases.25 This study results in which measure the levels of fatty acid in different age verified the above research conclusion. Among those biomarkers screened out in this study, five are linked to lipid metabolism pathway. LysoPC and LysoPE are both lysophospholipids, intermediates of phospholipid metabolism. Phospholipids and phosphatidylcholine are precursors of diacylglycerol and ceramide. Both diacylglycerol and ceramide are considered to be key mediators of insulin resistance and lipid toxicity. Ceramide also induces inflammation by inhibiting Akt and blocks insulin action and glucose uptake.26 Phospholipids are inflammatory mediators,27 with atherogenic properties and their altered levels are linked to age-related physiological changes.28 In this study, LysoPC (LysoPC (O-18:0)), LysoPE (LysoPE (18:2/0:0)) levels in serum decreased with age. Our results are in accordance with previous studies.13,29 12, 13-DHOME is the leucocyte toxin 12 (13) -EpOME generated by linoleic acid oxidized by P450 monooxygenase, and then hydrolyzed by soluble epoxylylase. Studies have reported that 12, 13-DHOME is a potential toxin, and leukotoxin glycol (including 12, 13-DHOME) can play a series of pathophysiological roles in mammals, including inhibiting mitochondrial function and promoting oxidative stress.30 Leukotrienes are a class of lipid mediators produced by arachidonic acid under the catalysis of 5-lipoxygenase, and are pro-inflammatory factor that promotes oxidation and inflammation and is associated with many senescence related diseases.31 The level of 12, 13-DHOME and leukotriene F4 in the elderly is significantly higher than that in the young, which may be related to the occurrence mechanism of aging, oxidative stress and inflammation. Glycocholic acid, an intermediate product of bile acid synthesis, is involved in the emulsification of fats and plays an important role in the digestion and absorption of fat.32 Shown in this study, the level of glycocholic acid was significantly decreased with age, this may one of the reasons lead to serum TCHO concentration increase with age. It can be seen that senescence has certain effects on the concentration of fatty acids, metabolism of fatty acids, phospholipid metabolism and bile acid synthesis in vivo. Under the action of IHP and IHC diets, SFAs concentration were increased while MUFAs and PUFAs concentration were decreased. In addition, LysoPCs and glycocholic acid level showed a decreasing trend, while 12, 13-DHOME and leukotriene F4 level showed an increasing trend in those two dietary groups. The levels of the above metabolites were no difference in IHF and NC groups. This indicates that IHP and IHC diets may cause lipid metabolism disorder to some extent via fatty acid metabolism, phospholipid metabolism and bile acid metabolism, which may accelerate the aging of the body and shorten life. However, an IHF diet did not affect lipid metabolism.
Many studies have proved that there is a close relationship between the tricarboxylic acid cycle and longevity. Seo et al from Korea found that in the plasma of elderly mice, the levels of malic acid, cisaconitine, citric acid and isocitric acid increased.33 Nevedomskaya et al from the Netherlands found elevated concentrations of succinic acid in the tricarboxylic acid cycle and 2-oxopentarate from isocitrate decarboxylation in the urine of model mice with accelerated aging, although their physiological significance may simply indicate changes in energy metabolism.34 The results of this experiment showed that the level of succinic acid and cis-aconitate were significantly increased with age, indicating that aging had a certain effect on the tricarboxylic acid cycle and energy metabolism. The level of intermediate products of the tricarboxylic acid cycle in the IHC and IHP group was significantly higher than that in the NC group, but the level of the tricarboxylic acid cycle was not affected by the IHF diet. The results showed that IHP and IHC diets may have an effect on the tricarboxylic acid cycle and energy metabolism, and may have a certain effect on the aging of the body. But an IHF diet had no effect on the tricarboxylic acid cycle and energy metabolism.
Since the data is based on a questionnaire, the information provided by the participants may be available, which may bias the data.
Conclusion
IHP and IHC diets may promote aging through amino acid metabolism, lipid metabolism and tricarboxylic acid cycle metabolic pathways, but the IHF diet has no effect on aging, without consideration of the composition of fats, the source of proteins and the nature of carbohydrates. Although the mechanism remains elusive, these findings suggest a direction to further explore longevity.
Ethics Approval and Consent to Participate
This study was conducted in accordance with the Declaration of Helsinki. The project was approved by the Ethics Committee of Harbin Medical University, and written informed consent was provided by all subjects.
Acknowledgments
We would like to thank all participants included in the study.
Funding
This work was supported by the National Natural Science Foundation of China (81973035), Applied Technology Research and Development Plan of Heilongjiang Province (GA20C012) and the Humanities and Social Science Project of Ministry of Education (15YJCZH003).
Disclosure
The authors report no conflicts of interest in this work.
References
1. Ekmekcioglu C. Nutrition and longevity - From mechanisms to uncertainties. Crit Rev Food Sci Nutr. 2020;60(18):3063–3082. doi:10.1080/10408398.2019.1676698
2. Dorling JL, Martin CK, Redman LM. Calorie restriction for enhanced longevity: the role of novel dietary strategies in the present obesogenic environment. Ageing Res Rev. 2020;64:101038. doi:10.1016/j.arr.2020.101038
3. Lopez-Otin C, Galluzzi L, Freije JMP, Madeo F, Kroemer G. Metabolic control of longevity. Cell. 2016;166(4):802–821. doi:10.1016/j.cell.2016.07.031
4. Green CL, Lamming DW, Fontana L. Molecular mechanisms of dietary restriction promoting health and longevity. Nat Rev Mol Cell Biol. 2021. doi:10.1038/s41580-021-00411-4
5. Solon-Biet SM, McMahon AC, Ballard JW, et al. The ratio of macronutrients, not caloric intake, dictates cardiometabolic health, aging, and longevity in ad libitum-fed mice. Cell Metab. 2014;19(3):418–430. doi:10.1016/j.cmet.2014.02.009
6. Lee KP, Simpson SJ, Clissold FJ, et al. Lifespan and reproduction in Drosophila: new insights from nutritional geometry. Proc Natl Acad Sci U S A. 2008;105(7):2498–2503. doi:10.1073/pnas.0710787105
7. Roberts MN, Wallace MA, Tomilov AA, et al. A ketogenic diet extends longevity and healthspan in adult mice. Cell Metab. 2017;26(3):539–546 e535. doi:10.1016/j.cmet.2017.08.005
8. Acosta-Rodríguez VA, Rijo-Ferreira F, Green CB, Takahashi JS. Importance of circadian timing for aging and longevity. Nat Commun. 2021;12(1):2862. doi:10.1038/s41467-021-22922-6
9. Lopez-Otin C, Blasco MA, Partridge L, Serrano M, Kroemer G. The hallmarks of aging. Cell. 2013;153(6):1194–1217. doi:10.1016/j.cell.2013.05.039
10. Alseekh S, Aharoni A, Brotman Y, et al. Mass spectrometry-based metabolomics: a guide for annotation, quantification and best reporting practices. Nat Methods. 2021;18(7):747–756. doi:10.1038/s41592-021-01197-1
11. Calvani R, Brasili E, Pratico G, et al. Fecal and urinary NMR-based metabolomics unveil an aging signature in mice. Exp Gerontol. 2014;49:5–11. doi:10.1016/j.exger.2013.10.010
12. Cheng S, Larson MG, McCabe EL, et al. Distinct metabolomic signatures are associated with longevity in humans. Nat Commun. 2015;6:6791. doi:10.1038/ncomms7791
13. Collino S, Montoliu I, Martin FP, et al. Metabolic signatures of extreme longevity in northern Italian centenarians reveal a complex remodeling of lipids, amino acids, and gut microbiota metabolism. PLoS One. 2013;8(3):e56564. doi:10.1371/journal.pone.0056564
14. Auro K, Joensuu A, Fischer K, et al. A metabolic view on menopause and ageing. Nat Commun. 2014;5:4708. doi:10.1038/ncomms5708
15. Na L, Wu X, Feng R, et al. The Harbin Cohort Study on diet, nutrition and chronic non-communicable diseases: study design and baseline characteristics. PLoS One. 2015;10(4):e0122598. doi:10.1371/journal.pone.0122598
16. Yu L, Lai Q, Feng Q, Li Y, Feng J, Xu B. Serum metabolic profiling analysis of chronic gastritis and gastric cancer by untargeted metabolomics. Front Oncol. 2021;11:636917. doi:10.3389/fonc.2021.636917
17. Schallreuter KU. Functioning methionine-S-sulfoxide reductases A and B are present in human skin. J Invest Dermatol. 2006;126(5):947–949. doi:10.1038/sj.jid.5700086
18. Wijekoon EP, Skinner C, Brosnan ME, Brosnan JT. Amino acid metabolism in the Zucker diabetic fatty rat: effects of insulin resistance and of type 2 diabetes. Can J Physiol Pharmacol. 2004;82(7):506–514. doi:10.1139/y04-067
19. Yuan W, Zhang J, Li S, Edwards JL. Amine metabolomics of hyperglycemic endothelial cells using capillary LC-MS with isobaric tagging. J Proteome Res. 2011;10(11):5242–5250. doi:10.1021/pr200815c
20. Zeitoun-Ghandour S, Leszczyszyn OI, Blindauer CA, Geier FM, Bundy JG, Sturzenbaum SR. C. elegans metallothioneins: response to and defence against ROS toxicity. Mol Biosyst. 2011;7(8):2397–2406. doi:10.1039/c1mb05114h
21. Sell DR, Strauch CM, Shen W, Monnier VM. 2-aminoadipic acid is a marker of protein carbonyl oxidation in the aging human skin: effects of diabetes, renal failure and sepsis. Biochem J. 2007;404(2):269–277. doi:10.1042/BJ20061645
22. Wijeyesekera A, Selman C, Barton RH, Holmes E, Nicholson JK, Withers DJ. Metabotyping of long-lived mice using 1H NMR spectroscopy. J Proteome Res. 2012;11(4):2224–2235. doi:10.1021/pr2010154
23. Jiang N, Yan X, Zhou W, et al. NMR-based metabonomic investigations into the metabolic profile of the senescence-accelerated mouse. J Proteome Res. 2008;7(9):3678–3686. doi:10.1021/pr800439b
24. Pararasa C, Bailey CJ, Griffiths HR. Ageing, adipose tissue, fatty acids and inflammation. Biogerontology. 2015;16(2):235–248. doi:10.1007/s10522-014-9536-x
25. Han S, Schroeder EA, Silva-Garcia CG, Hebestreit K, Mair WB, Brunet A. Mono-unsaturated fatty acids link H3K4me3 modifiers to C. elegans lifespan. Nature. 2017;544(7649):185–190. doi:10.1038/nature21686
26. Kim S, Cheon HS, Song JC, Yun SM, Park SI, Jeon JP. Aging-related changes in mouse serum glycerophospholipid profiles. Osong Public Health Res Perspect. 2014;5(6):345–350. doi:10.1016/j.phrp.2014.10.002
27. Aiyar N, Disa J, Ao Z, et al. Lysophosphatidylcholine induces inflammatory activation of human coronary artery smooth muscle cells. Mol Cell Biochem. 2007;295(1–2):113–120. doi:10.1007/s11010-006-9280-x
28. Schmitz G, Ruebsaamen K. Metabolism and atherogenic disease association of lysophosphatidylcholine. Atherosclerosis. 2010;208(1):10–18. doi:10.1016/j.atherosclerosis.2009.05.029
29. Selman C, Lingard S, Choudhury AI, et al. Evidence for lifespan extension and delayed age-related biomarkers in insulin receptor substrate 1 null mice. FASEB J. 2008;22(3):807–818. doi:10.1096/fj.07-9261com
30. Edwards LM, Lawler NG, Nikolic SB, et al. Metabolomics reveals increased isoleukotoxin diol (12,13-DHOME) in human plasma after acute Intralipid infusion. J Lipid Res. 2012;53(9):1979–1986. doi:10.1194/jlr.P027706
31. Back M. Leukotriene receptors: crucial components in vascular inflammation. ScientificWorldJournal. 2007;7:1422–1439. doi:10.1100/tsw.2007.187
32. Heubi JE, Setchell KD, Jha P, et al. Treatment of bile acid amidation defects with glycocholic acid. Hepatology. 2015;61(1):268–274. doi:10.1002/hep.27401
33. Seo C, Hwang YH, Kim Y, et al. Metabolomic study of aging in mouse plasma by gas chromatography-mass spectrometry. J Chromatogr B Analyt Technol Biomed Life Sci. 2016;1025:1–6. doi:10.1016/j.jchromb.2016.04.052
34. Nevedomskaya E, Meissner A, Goraler S, et al. Metabolic profiling of accelerated aging ERCC1 d/- mice. J Proteome Res. 2010;9(7):3680–3687. doi:10.1021/pr100210k
 © 2021 The Author(s). This work is published and licensed by Dove Medical Press Limited. The full terms of this license are available at https://www.dovepress.com/terms.php and incorporate the Creative Commons Attribution - Non Commercial (unported, v3.0) License.
By accessing the work you hereby accept the Terms. Non-commercial uses of the work are permitted without any further permission from Dove Medical Press Limited, provided the work is properly attributed. For permission for commercial use of this work, please see paragraphs 4.2 and 5 of our Terms.
© 2021 The Author(s). This work is published and licensed by Dove Medical Press Limited. The full terms of this license are available at https://www.dovepress.com/terms.php and incorporate the Creative Commons Attribution - Non Commercial (unported, v3.0) License.
By accessing the work you hereby accept the Terms. Non-commercial uses of the work are permitted without any further permission from Dove Medical Press Limited, provided the work is properly attributed. For permission for commercial use of this work, please see paragraphs 4.2 and 5 of our Terms.