")
Back to Journals » Infection and Drug Resistance » Volume 14
Metabolomics Strategy Assisted by Transcriptomics Analysis to Identify Potential Biomarkers Associated with Tuberculosis
Authors Jiang J, Li Z, Chen C, Jiang W, Xu B, Zhao Q
Received 2 August 2021
Accepted for publication 28 October 2021
Published 15 November 2021 Volume 2021:14 Pages 4795—4807
DOI https://doi.org/10.2147/IDR.S330493
Checked for plagiarism Yes
Review by Single anonymous peer review
Peer reviewer comments 2
Editor who approved publication: Professor Suresh Antony
Jiayan Jiang,1 Zhipeng Li,1 Cheng Chen,2 Weili Jiang,1 Biao Xu,1 Qi Zhao1,3,4
1School of Public Health and Key Laboratory of Public Health Safety, Fudan University, Shanghai, People’s Republic of China; 2Department of Chronic Communicable Disease, Center for Disease Control and Prevention of Jiangsu Province, Nanjing, Jiangsu, People’s Republic of China; 3NHC Key Laboratory of Health Technology Assessment,Fudan University, Shanghai, People’s Republic of China; 4Shanghai Clinical Research Center for infectious disease (Tuberculosis), Shanghai, People’s Republic of China
Correspondence: Qi Zhao Tel/Fax +86-21-5423-7335
Email [email protected]
Purpose: To investigate the dysregulated pathways and identify reliable diagnostic biomarkers for tuberculosis using integrated analysis of metabolomics and transcriptomics.
Methods: Three groups of samples, untargeted metabolomics analysis of healthy controls (HC), latent tuberculosis infection patients (LTBI), and active tuberculosis patients (TB), were analyzed using gas chromatography time-of-flight mass spectrometry (GC-TOF MS) and ultra-high performance liquid chromatography-quantitative mass spectrometry (UHPLC-QE-MS). Both univariate and multivariate and statistical analyses were used to select differential metabolites (DMs) among group comparison, and LASSO regression analysis was employed to discover potential diagnostic biomarkers. Metabolite set enrichment analysis was performed to identify the altered metabolic pathways specifically in patients with TB. Meanwhile, a transcriptomic dataset GSEG4992 was downloaded from the GEO database to explore the differentially expressed genes (DEGs) between TB and HC identified in significantly enriched pathways. Finally, an integrative analysis of DMs and DEGs was performed to investigate the possible molecular mechanisms of TB.
Results: Thirty-three specific metabolites were significantly different between TB and HC, of which 7 (5-hydroxyindoleacetic acid, isoleucyl-isoleucine, heptadecanoic acid, indole acetaldehyde, 5-ethyl-2,4-dimethyloxazole, and 2-hydroxycaproic acid, unknown 71) were chosen as combinational potential biomarkers for TB. The area under the curve (AUC) value of these biomarkers was 0.97 (95% CI: 0.92– 1.00). Metabolites set enrichment analysis (MSEA) displayed that there were 3 significantly enriched pathways among all. The genes in 3 significantly enriched pathways were further analyzed, of which 9(ALDH3B1, BCAT1, BCAT2, GLYAT, GOT1, IL4I1, MIF, SDS, SDSL) were expressed differentially. The area under the curve (AUC) values of these DEGs enriched in pathways mostly were greater than 0.8. As a result, a connected network of metabolites and genes in the pathways were established, which provides insights into the credibility of selected metabolites.
Conclusion: The newly identified metabolic biomarkers display a high potential to be developed into a promising tool for TB screening, diagnosis, and therapeutic effect monitoring.
Keywords: biomarker, diagnostic, metabolites, genes, multi-omics
Introduction
Tuberculosis (TB) is a chronic respiratory infection caused by Mycobacterium tuberculosis (MTB). Currently, more than a third of the world population is diagnosed with MTB infection.1 According to the latest report made by the World Health Organization (WHO), it estimates that there are about 10 million cases and 1.4 million deaths in 2019 worldwide.2 Despite the recent progress made in TB control, the world still has a long way to go to achieve the goal of the “End TB Strategy”, which has brought new challenges to TB diagnosis and treatment. Consequently, the rapid and accurate detection of active tuberculosis remains a challenge in global efforts, with less than 60% of the estimated tuberculosis diagnosed bacteriologically in 2019.2 Smear microscopy is applied more often in countries with underdeveloped economy and healthcare and it is the main cause of delays in case detection and diagnosis. Also, the gold standard that tests MTB infection based on the culture, the Mycobacterium culture method, can usually take 2–6 weeks, let alone some testing facilities often lack the required resources for successful culture.3 Furthermore, all these bacteriological diagnosis methods require sputum samples, and many patients cannot adequately produce sputum samples. Given that the early diagnosis is critical to control bacterial infection, reduce the chance of transmission, and thus control the prevalence of TB, an effective approach is to develop a more accurate and rapid identification and diagnosis technology. On account of the limitations facing the current diagnostic tool and the critical purpose of TB early-stage detection, a more sensitive etiological diagnosis method for TB is needed.
Over the last decade, metabolomics has proved to be a very effective method to explore and identify novel diagnostic and prognostic biomarkers.4 Metabolites, the final products of various biological processes, hold promise as accurate biomarkers that reflect upstream biological events such as genetic mutations and environmental changes. By comparing metabolite profiles extracted from sputum, blood, breath, and urine samples, many biological processes of TB patients were found abnormal and disturbed than that of healthy people, specifically patients’ energy consumption, glycolysis, lipolysis, amino acid metabolism, and nucleotide biosynthesis.5–12 Notably, it is reported that amino acid metabolism changes during the disease progression of TB patients when comparing the metabolic characteristics of TB patients, latent TB infected people (LTBI), and healthy people (HC).7 However, biomarkers obtained from previous metabolomic studies on TB diagnostic exhibit greater heterogeneity which could not thoroughly explain and distinguish the substances and signal pathways involved in the development of tuberculosis, and the specificity of these biomarkers that distinguished TB from healthy controls was lower.9,10 Meanwhile, there were discrepancies between the findings from different biological samples.6,7,9,11 Besides, given that the disrupted metabolic pathways of tuberculosis were constructed mostly based on the changes of metabolite levels and that few of these biomarkers were validated by other omics techniques, the credibility and reproducibility of these diagnostic biomarkers were low.6,8,12 Therefore, a rigorous research design supported by multi-omics integrated analysis is needed to identify the exact biomarker of active tuberculosis and illustrate a fuller picture of the pathogenesis of tuberculosis. Due to the development of system biology and bioinformatics tools, there have been studies integrating metabolomics data and transcriptomics data, such as cancer-related research.13–15 In contrast, fewer studies have specifically used this approach in infectious diseases. The integration of metabolomics and transcriptomics will improve the credibility of discovered biomarkers, as well as shed light on tuberculosis pathogenesis through the lens of system biology.16 Although Dutta N K has found new biomarkers in the blood for tuberculosis diagnosis in children through the integration of metabolomics and transcriptomics, there are few studies investigated the pathogenesis of tuberculosis in adult by using the multi-omics technique.
In the present study, we integrated metabolomics data and transcriptomics data to explore the dysregulated pathways and discover more reliable and specific markers that can be used to diagnose tuberculosis. The integration of metabolomic profiling with transcriptomics data can be further used in validating the potential diagnostic biomarkers. Pathway and network analyses were then used to further explore the relationship between our selected metabolites and genes to substantiate the reliability of our results.
Materials and Methods
The complete analysis process regarding the integration of metabolomics and transcriptomics data is summarized in Figure 1.
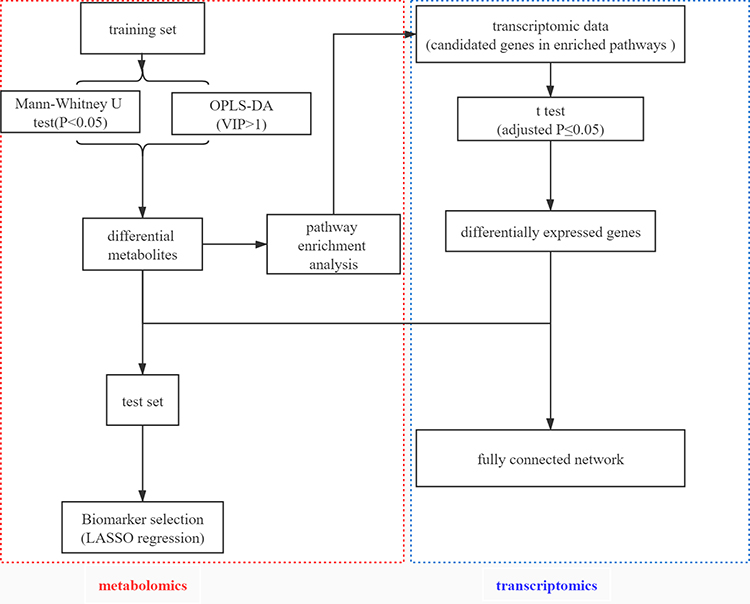 |
Figure 1 An overview workflow of the comprehensive analysis of metabolomics and transcriptomics in tuberculosis. |
Study Population
There were three groups of participants enrolled in this study (1) active tuberculosis patients (TB, n = 30), defined as patients with active pulmonary TB diagnosed based on microbiological, clinical, radiological, and pathological data. (2) Latent Tuberculosis Infected participants (LTBI, n = 30), defined as (i) no suggestive symptoms of TB; (ii) no history of TB; (iii) recent contact with active pulmonary TB patients; and (iv) a positive result from the T.SPOT (3) clinically healthy controls (HC, n = 30), the first three conditions of whom were the same compared with LTBI, but (iv) they had a negative result from the T.SPOT. In this study, a total of 90 subjects signed the consent form and participated the entire process.
Blood Samples Collection
Venous blood of each group was collected in polypropylene tubes in the early morning. Fresh blood was stored at 4°C, and it coagulated naturally after about 30 minutes. After centrifugation at 3000 g for 10 min, serum samples were obtained, and it was immediately stored at 80°C until analysis. A face-to-face investigation was conducted by a trained health professional to gather patients’ basic information including age, gender, smoking habits, etc.
GC-TOF MS and UHPLC-QE-MS Analysis and Data Preprocessing
Untargeted metabolomics analysis of serum samples stored at −80°C was performed using GC-TOF-MS and UHPLC-QE-MS assay.17 All plasma samples were processed and then analyzed by GC-TOF-MS with Agilent 7890 gas chromatography coupled with a time-of-flight mass spectrometer and the samples were also run through UHPLC-QE-MS using a UHPLC system (Vanquish, Thermo Fisher Scientific) with a UPLC BEH Amide column (2.1 mm × 100 mm, 1.7 μm) coupled with a Q Exactive HFX mass spectrometer (Orbitrap MS, Thermo). The quality control (QC) sample was prepared by mixing an equal aliquot of the supernatant from each sample. Details about metabolite extraction and metabolomics analysis are in Supplementary Material: Part A. Raw data analysis, as for GC-TOF-MS, including peak extraction, baseline adjustment, deconvolution, alignment, and integration, was finished with Chroma TOF (V 4.3x, LECO) software, and the LECO-Fiehn Rtx5 database was used for metabolite identification by matching the mass spectrum and retention index. Finally, the peaks detected in less than half of QC samples or RSD >30% in QC samples were removed; similarly, for UHPLC-QE-MS, the raw data were converted to the mzXML format using ProteoWizard and processed with an in-house program, which was developed using R and based on XCMS, for peak detection, extraction, alignment, and integration. This is followed by applying an in-house MS2 database (BiotreeDB) for metabolite annotation.18 The cutoff for annotation was set at 0.3.
As a result, the raw data included 13 quality control samples and 90 experiments with 949 peaks; then filtered a single peak to remove noise based on the coefficient of variation, and peaks whose area was no more than 50% null in a single group or no more than 50% in all groups were retained, then missing value was recorded based on the method of filling by the median value. Metabolomics data were normalized by dividing each variable by the standard deviation of each variable and then was log-transformed before multivariate analysis. There were 586 peaks retained after the data preprocessing.
Statistical Analysis
Continuous variables were expressed as the mean± (standard deviation [SD]) or median (interquartile range [IQR]) and the categorical variables were expressed as number (percent). To complete univariate statistical comparisons, chi-square test or Fisher’s exact test, Student’s t-test or ANOVA, and Wilcoxon signed rank test or Kruskal Wallis test were used to evaluate the corresponding variable, the categorical variables, normally distributed continuous variables, and non-normally distributed continuous variables, respectively. Results having a P-value below 0.05 were considered statistically significant.
After data transformation and normalized, MetaboAnalyst 4.0 (https://www.metaboanalyst.ca/) was used to carry out multivariate statistical analysis for comparison in pairs among the three groups, such as principal component analysis (PCA) and orthogonal partial least square to latent discriminant analysis (OPLS-DA).19 Principal component analysis (PCA) is a non-supervised statistical approach to get the most primitive sample situation to find and eliminate abnormal samples.20 Next, to produce accurate and objective analysis result, orthogonal partial least square to latent discriminant analysis (OPLS-DA), a supervised statistical approach, was applied to identify the variables most relevant for the discrimination between groups.21 The default method of 7-fold internal cross-validation was applied to verify the durability and effectiveness of the model, from which R2Y (goodness of fit parameter) and Q2(predictive ability parameter) values with the corresponding permutation tests (n = 100) were used for the OPLS-DA model evaluation. The univariate nonparametric Mann–Whitney U-test was performed for all metabolites in group comparison. The potential biomarkers were selected as univariate P value <0.05 and VIP >1, and the cutoff denotes a specifically distinguished value of metabolites in TB from HC.
A receiver operating characteristic (ROC) curve was generated for each biomarker, and specificity and sensitivity of the biomarker were determined by the AUC value and 95% confidence interval (CI). LASSO regression analysis was carried out to increase the diagnostic accuracy of combined changes in serum metabolites levels.
Specifically, LASSO regression is used for modeling, and assigning the slope coefficient of redundant markers to value 0. In other words, markers that are highly correlated with other markers were retained in the model.22 The penalty term in the estimation procedure ensures that similar coefficients to equal to 0 and achieve the optimal model fit. The penalty term has a tuning parameter that is usually referred as lambda and it controls how similar biomarkers should be before one of them receives a slope coefficient of 0. The optimal lambda, the values leading to the smallest prediction error, was determined by using cross-validation which was to have 90% of the data fit (“train”) the model and the remaining create a benchmark or be validated through comparison of observed data and predictions from the trained model. Optimal lambda values lead to optimal LASSO models. The use of cross-validation served as internal validation of the signatures. Ten-fold cross-validation carries out such comparisons ten times based on a random partitioning of the data into ten parts of equal size. However, ten-fold cross-validation may not necessarily produce the same results if being repeated because it relies on random sampling. Therefore, the five-fold cross-validation step was performed to stabilize the results. The LASSO regression models simultaneously included all above-mentioned biomarkers. Estimated intercept and slope coefficients for the identified biomarkers were reported. Receiver operating characteristic (ROC) curves were also shown and summarized using the area under the curve (AUC).
Joint Analysis of Metabolites and Genes
The integration of metabolomics and transcriptomics can efficiently identify the key metabolic pathways and functional genes of tuberculosis. MetaboAnalyst 4.0 (http://www.metaboanalyst.ca) was used for metabolic set enrichment analysis.18 After uploading differential metabolites on Metaboanalyst, the metabolites were then mapped to KEGG metabolic pathways enrichment analysis. Pathway significance was decided based on the total number of metabolites; pathway with P < 0.2 (TB vs HC) was considered as significantly enriched pathways, and candidate genes involved in the significantly enriched pathways were identified also based on KEGG.23,24 The transcriptomics data from the Gene Expression Omnibus (GEO, http://www.ncbi.nlm.nih.gov/geo/) database (accession number GSEG4992) comprised serum samples from 9 TB patients and 6 HC subjects were analyzed. Data analysis was conducted using R 4.0.5. The limma package was used to select differentially expressed genes (DEGs) that were identified in significantly enriched pathways. The dataset was normalized using log2 transformation and then screened for DEGs. Genes with an adjusted P-value≤0.05 were considered DEGs. Fully connected networks of metabolites and genes were built and analyzed in Metscape, which was a plug-in for Cytoscape. Metscape could help us build the network of metabolites and genes, trace the connections between them, and visualize compound networks.25
Results
Study Subject
A total of 90 participants participated in this study (Table 1), among which 30 patients have active pulmonary TB (age 54.5, [range 28–65] years; males, n = 25 [83.3%]), 30 patients have LTBI (age,44.5[range 27–60] years; males, n = 17 [56.7%]), and 30 healthy controls (age,47.5[range 27–61] years; males, n = 25 [83.3%]). There were no differences in baseline characteristics among the three groups except for sex.
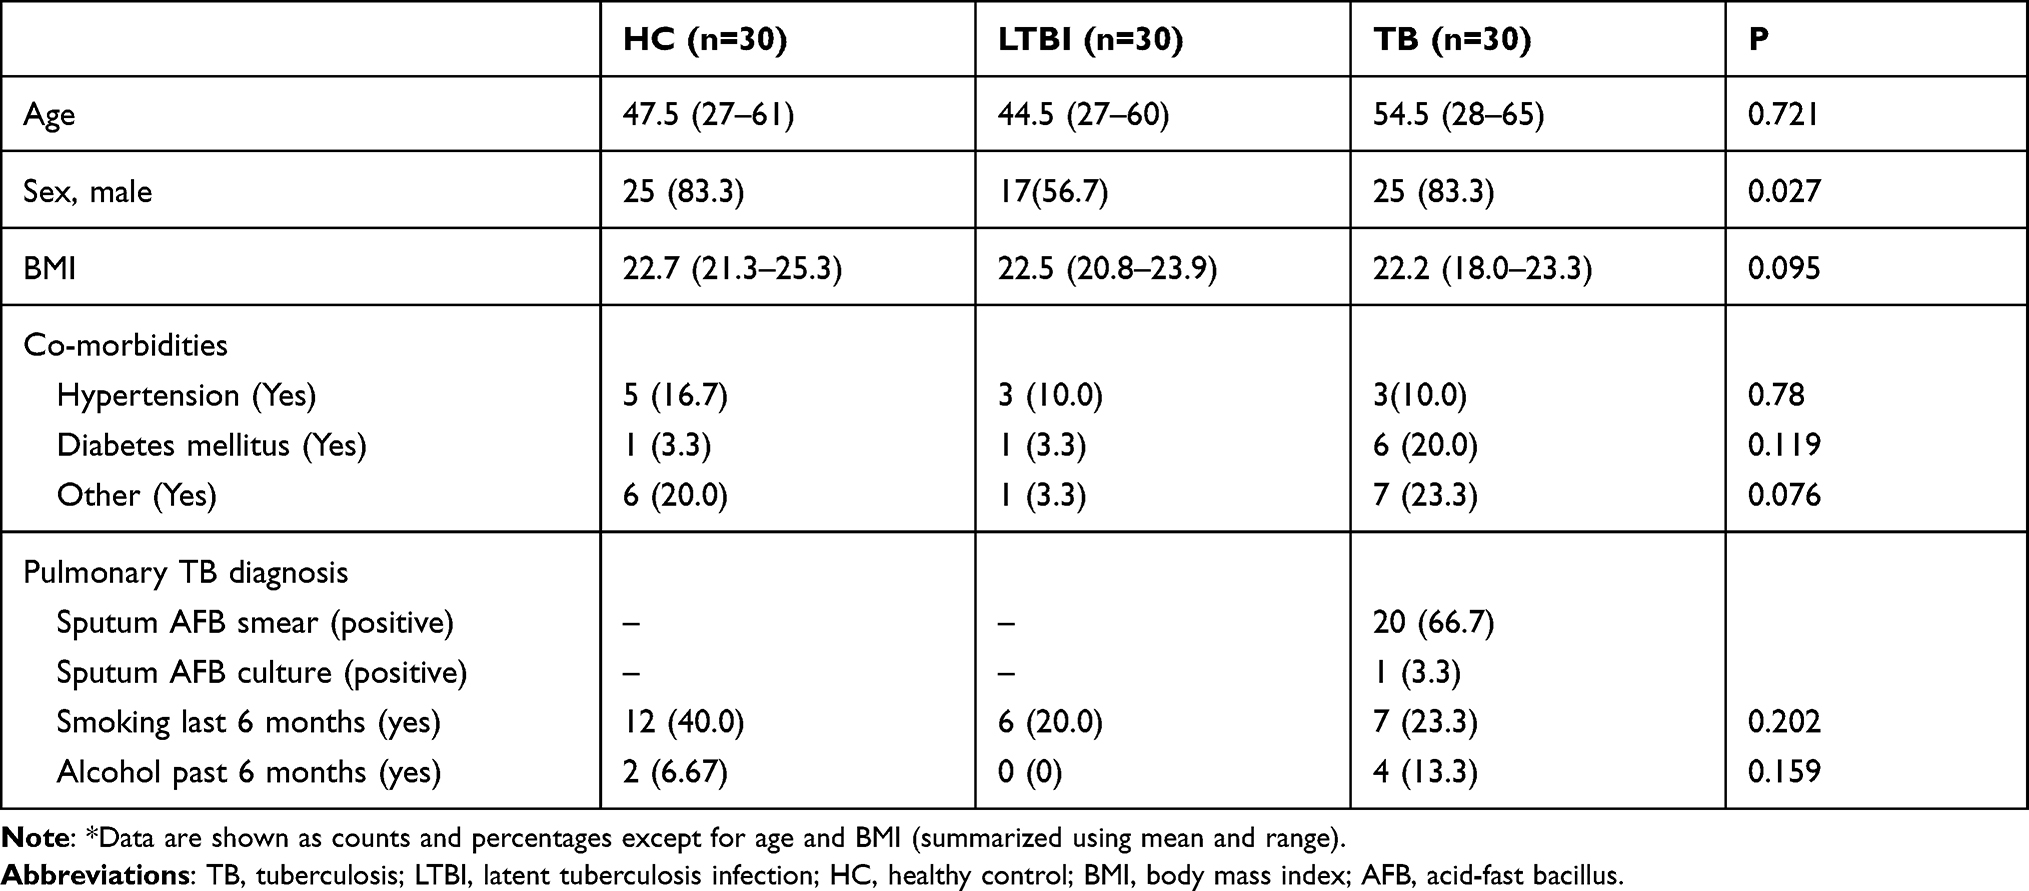 |
Table 1 Characteristics (n = 90) for TB Cases, LTBI and HC Subjects* |
Differential Metabolite Screening
Multivariate Analysis
As shown in the score scatter plot (Figure 2A), metabolomics data from the 90 samples through principal component analysis (PCA) demonstrated that active TB patients could be easily distinguished from the others. Meanwhile, this multivariate analysis could not distinguish participants with LTBI from healthy controls. However, to obtain more reliable information about the metabolite differences between groups, OPLS-DA can filter out the orthogonal variables in the metabolites that are unrelated to the classification and analyze the non-orthogonal variables and orthogonal variables, respectively. OPLS-DA built based on the comparisons between the groups included in the study revealed that serum samples from HC show a specific serum metabolic profile compared with LTBI patients (Figure 2B, R2Y=0.937, Q2= 0.135) and with TB patients (Figure 2C, R2Y=0.895, Q2=0.709). Similarly, the serum metabolic profile of LTBI and TB subjects showed a distinct metabolic profile of patients (Figure 2D, R2Y=0.952, Q2=0.776).
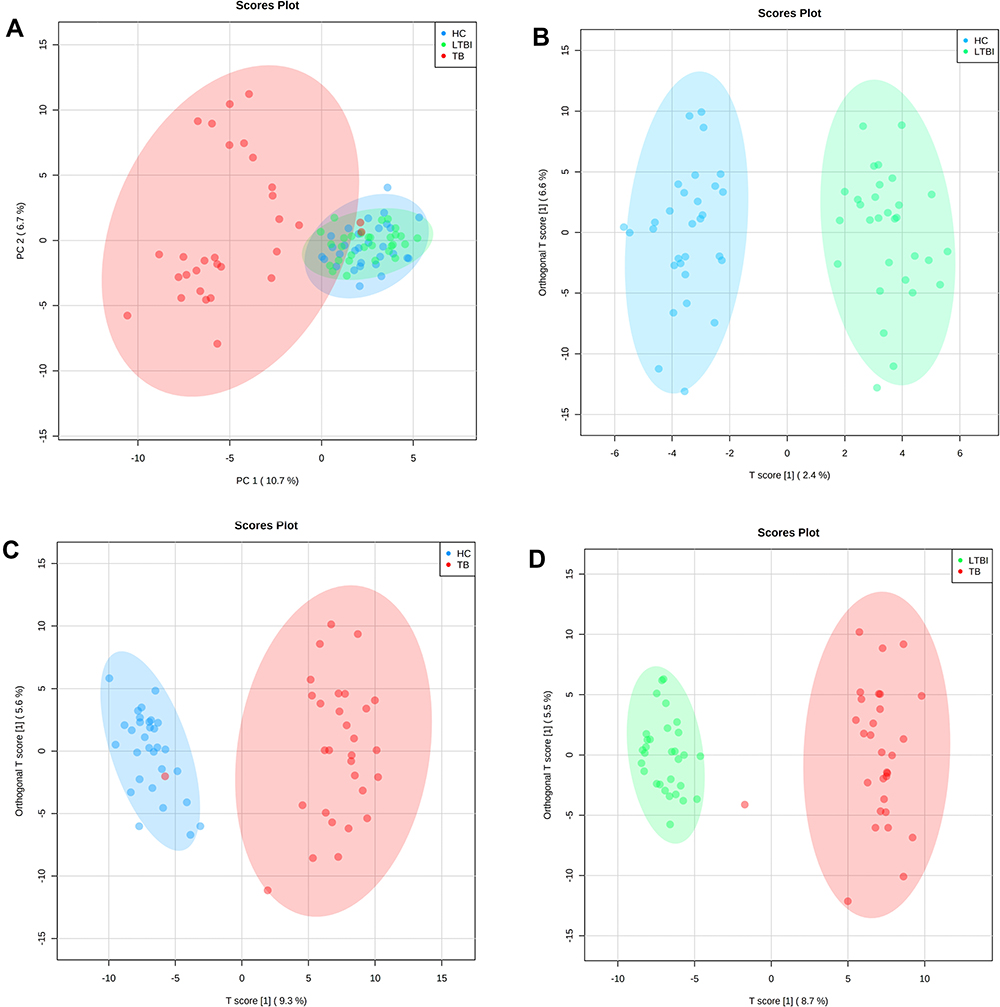 |
Figure 2 Multivariate statistical analyses of the different clinical groups in the study. (A) Principal component analysis (PCA) score plots of the TB patients (TB, red), latently infected tuberculosis (LTBI, green) and healthy controls (HC, blue) serum samples. Orthogonal partial least squares-discriminate analysis (OPLS-DA) score plots for the comparison between (B) HC (blue) and LTBI (green) (R2Y= 0.937, Q2= 0.135), (C) TB (red) and HC (blue) (R2Y= 0.895, Q2= 0.709) and (D) TB (red) and LTBI (green) (R2Y= 0.952, Q2= 0.776). |
Univariate Analysis
The Mann–Whitney U-test was used to determine the difference between groups (HC/LTBI groups, TB/LTBI groups, TB/HC groups) for the features in which the VIP value was >1 in the OPLS-DA model. The OPLS-DA models built for the groups of samples included in the study generated the VIP lists of metabolites allowed the assignment of the metabolites most relevant for the discrimination between groups. And metabolomics features that satisfied p < 0.05 and VIP >1 were filtered out. The serum metabolic profile of the LTBI group was characterized by 30 statistically different metabolites in comparison to HC. Similarly, when comparing HC with TB subjects, 167 features were statistically significant. Also, 179 metabolites in TB groups were significantly different than that of LTBI. The results are in the form of volcano plots (Figure 3). According to the Venn diagram, 33 differential metabolites were shown only in HC/TB comparison.
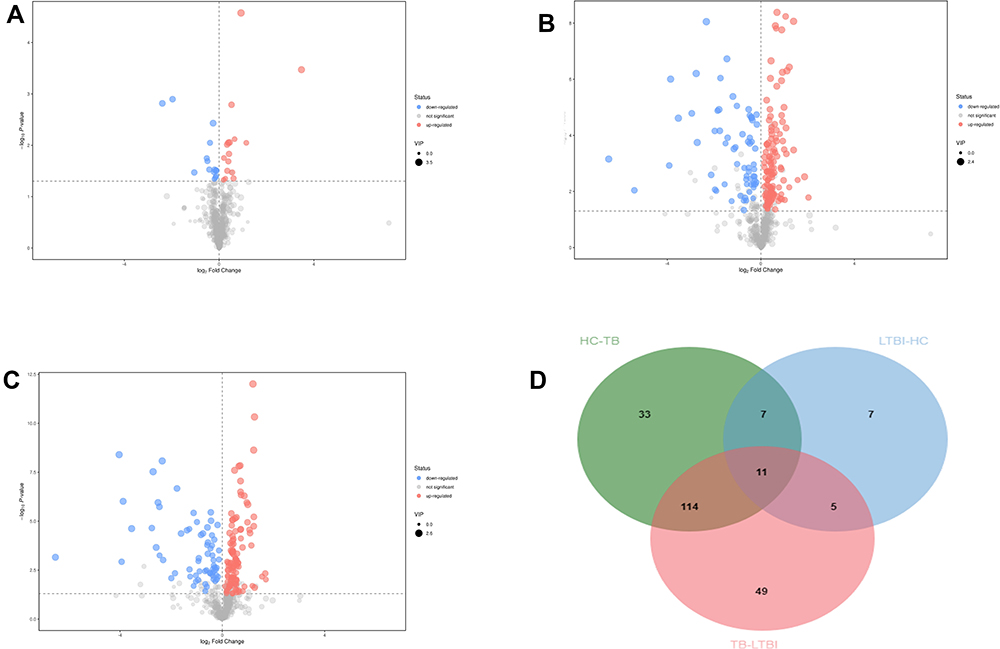 |
Figure 3 Volcanic map of differential metabolites. For the LTBI/HC group (A) and LTBI/TB (B) and TB/HC group (C). The abscissa represented the fold change of the group compared to each substance (take the base 2 logarithm), the ordinate represented the P-value (take the base 10 logarithm), and the scatter size represented the VIP value of the OPLS-DA model. The larger the scattering, the larger the VIP value. The scatter color represented the final screening result. Significantly up-regulated metabolites are shown in red (FC ≥1, P < 0.05), significantly down-regulated metabolites are shown in blue (FC ≤-1, P < 0.05), and non-significant differential metabolites are shown in gray. (D) The Venn diagrams show the overlap between different health statuses for metabolites with significant abundance differences (VIP ≥1 and P < 0.05) between LTBI/HC group, LTBI/TB, and TB/HC group. |
Diagnostic Ability of Metabolites
To further explore the clinical potential of the metabolites above-mentioned with significant alteration in this study, a LASSO regression analysis of the data was performed. To this end, when specifically comparing HC and TB patients, 33 metabolites whose levels showed statistically significant changes were evaluated to generate a regression equation. As a result, higher levels of 5-hydroxyindoleacetic acid and isoleucyl-isoleucine were found to be predictive of active TB in serum samples from TB and HC subjects; Heptadecanoic acid, indole acetaldehyde, 5-ethyl-2,4-dimethyloxazole, and 2-hydroxycaproic acid showed negative predictive value (Table 2). 5-fold-cross validation of the LASSO regression equation was performed by evaluating the AUC values of the ROC curves for each metabolite included in the equation and for the logistic regression equation. The results showed the AUC of combined metabolites was 0.97 (95% CI: 0.92–1.00) better than single metabolite (Figure 4).
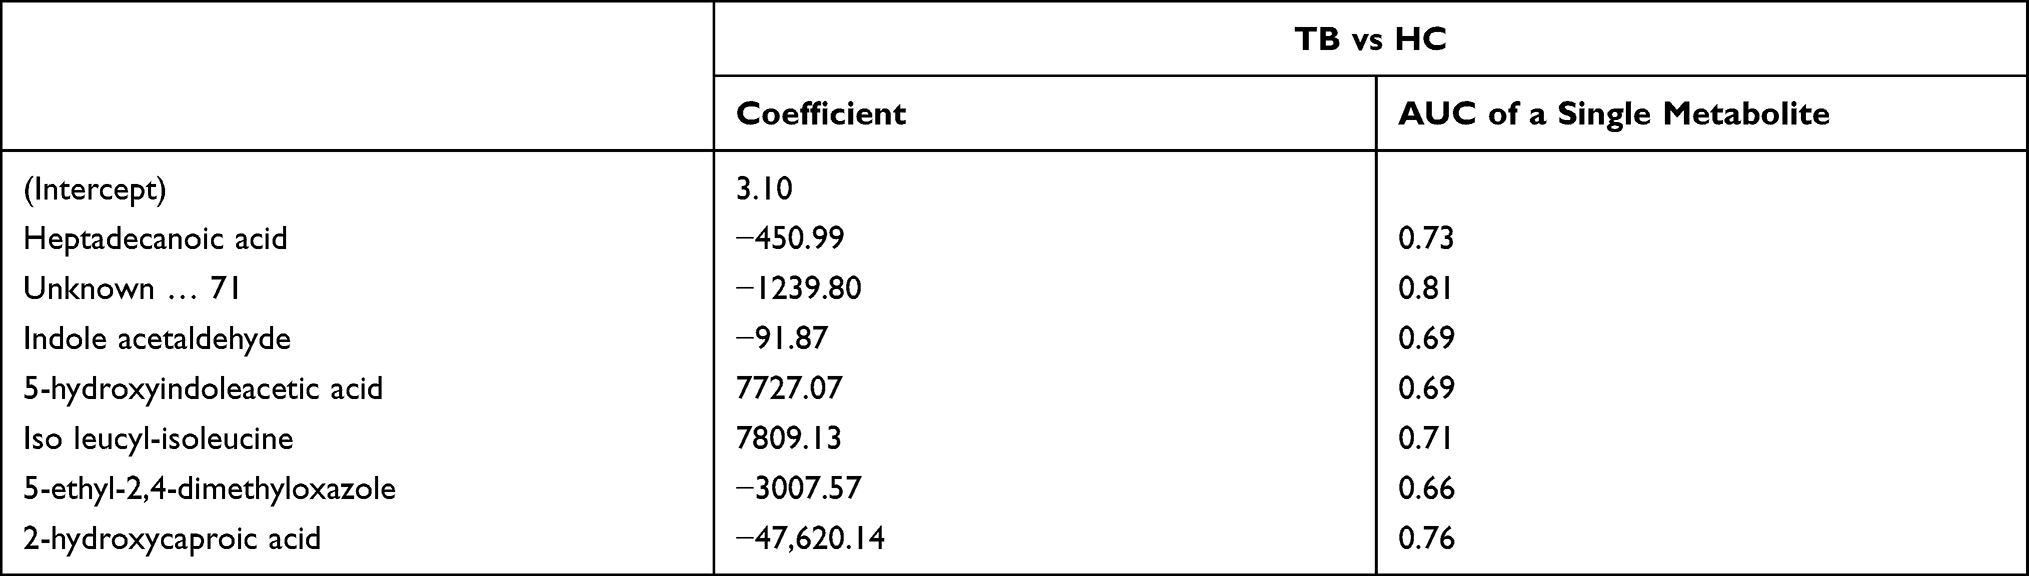 |
Table 2 Coefficient and Cut-off Using Metabolites Biomarkers Distinguishing Between TB and HC Subjects |
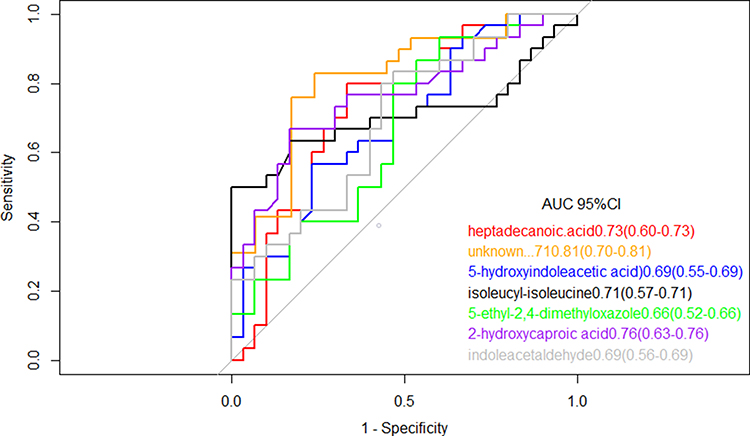 |
Figure 4 Receiver operating characteristic model of the single metabolites included in the LASSO regression equation. The ROC curves of each metabolite showed a moderate distinguishing efficiency in TB vs HC group. |
Metabolite Set Enrichment Analysis (MSEA)
MSEA aimed to identify the metabolic pathways specifically altered in patients with TB as compared with HC subjects. To determine if the specific metabolic alterations detected in the comparison between TB and HC groups were in keeping with the current knowledge about the biology and the metabolic changes associated with the active TB disease (Figure 5). A total of 3 out of the 8 metabolic pathways with a fold enrichment were higher than 1, while Phenylalanine, tyrosine, and tryptophan biosynthesis, Valine, leucine, and isoleucine biosynthesis, Phenylalanine metabolism, were statistically and significantly altered (P < 0.2).
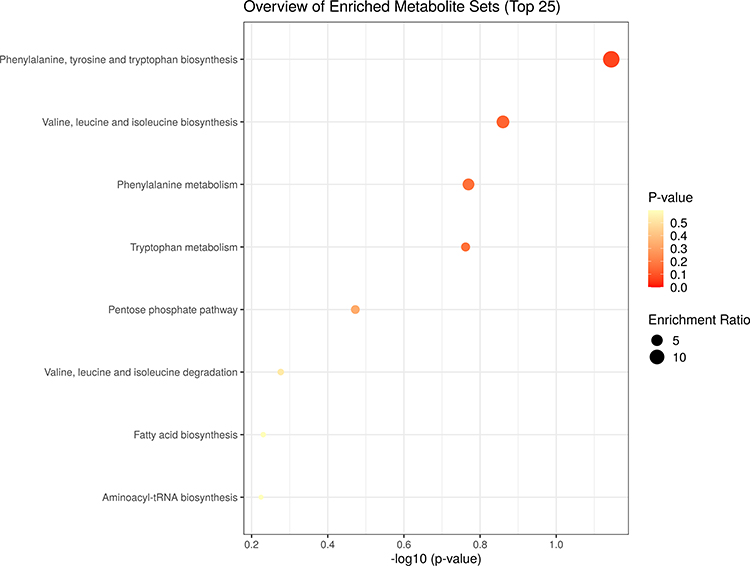 |
Figure 5 Metabolite set enrichment analysis (MSEA) of differentiating metabolites from TB patients and HC subjects. The scatter shows the most altered metabolic pathways with fold enrichment higher than 1 (increasing P-value coloured from red to white). |
Integrated Analysis of Transcriptomics and Metabolomics Data
To achieve mutual verification in the current work and seek more insights through this integrated omic-technology, a combination of metabolomics data and transcriptomics data analysis was conducted. The transcriptomics data analysis enabled validation of the metabolism dysregulations revealed by metabolomics work. Further, we found genes in 3 significant pathways with P < 0.2, and among the identified 27 genes in these pathways, 9 genes (33.3%) were differentially expressed with adjusted p≤ 0.05, namely ALDH3B1, BCAT1, BCAT2, GLYAT, GOT1, IL4I1, MIF, SDS, SDSL (Table 3). As shown in Table 3, four genes are involved in the biosynthesis of valine, leucine and isoleucine and the remaining 5 genes are involved in phenylalanine metabolism. The calculated ROC value of these 9 genes was greater than 0.8, which denoted a high diagnostic ability of TB. To better understand the metabolite mechanism and gene dysregulation, a fully connected network of metabolites and genes was built with Metscape (Figure S1) in the 3 selected pathways. Network analysis was conducted using the logarithm of the fold changes on levels of both metabolites between the HC and TB subjects and differentially expressed genes. A model of network illustrating connections of metabolites and genes was assembled. As shown in Figure S1 (Supplementary Material: Part B), metabolites and genes in the same pathway were found differentially expressed. The results therefore further increase the credibility of our selected metabolites, genes, and pathways.
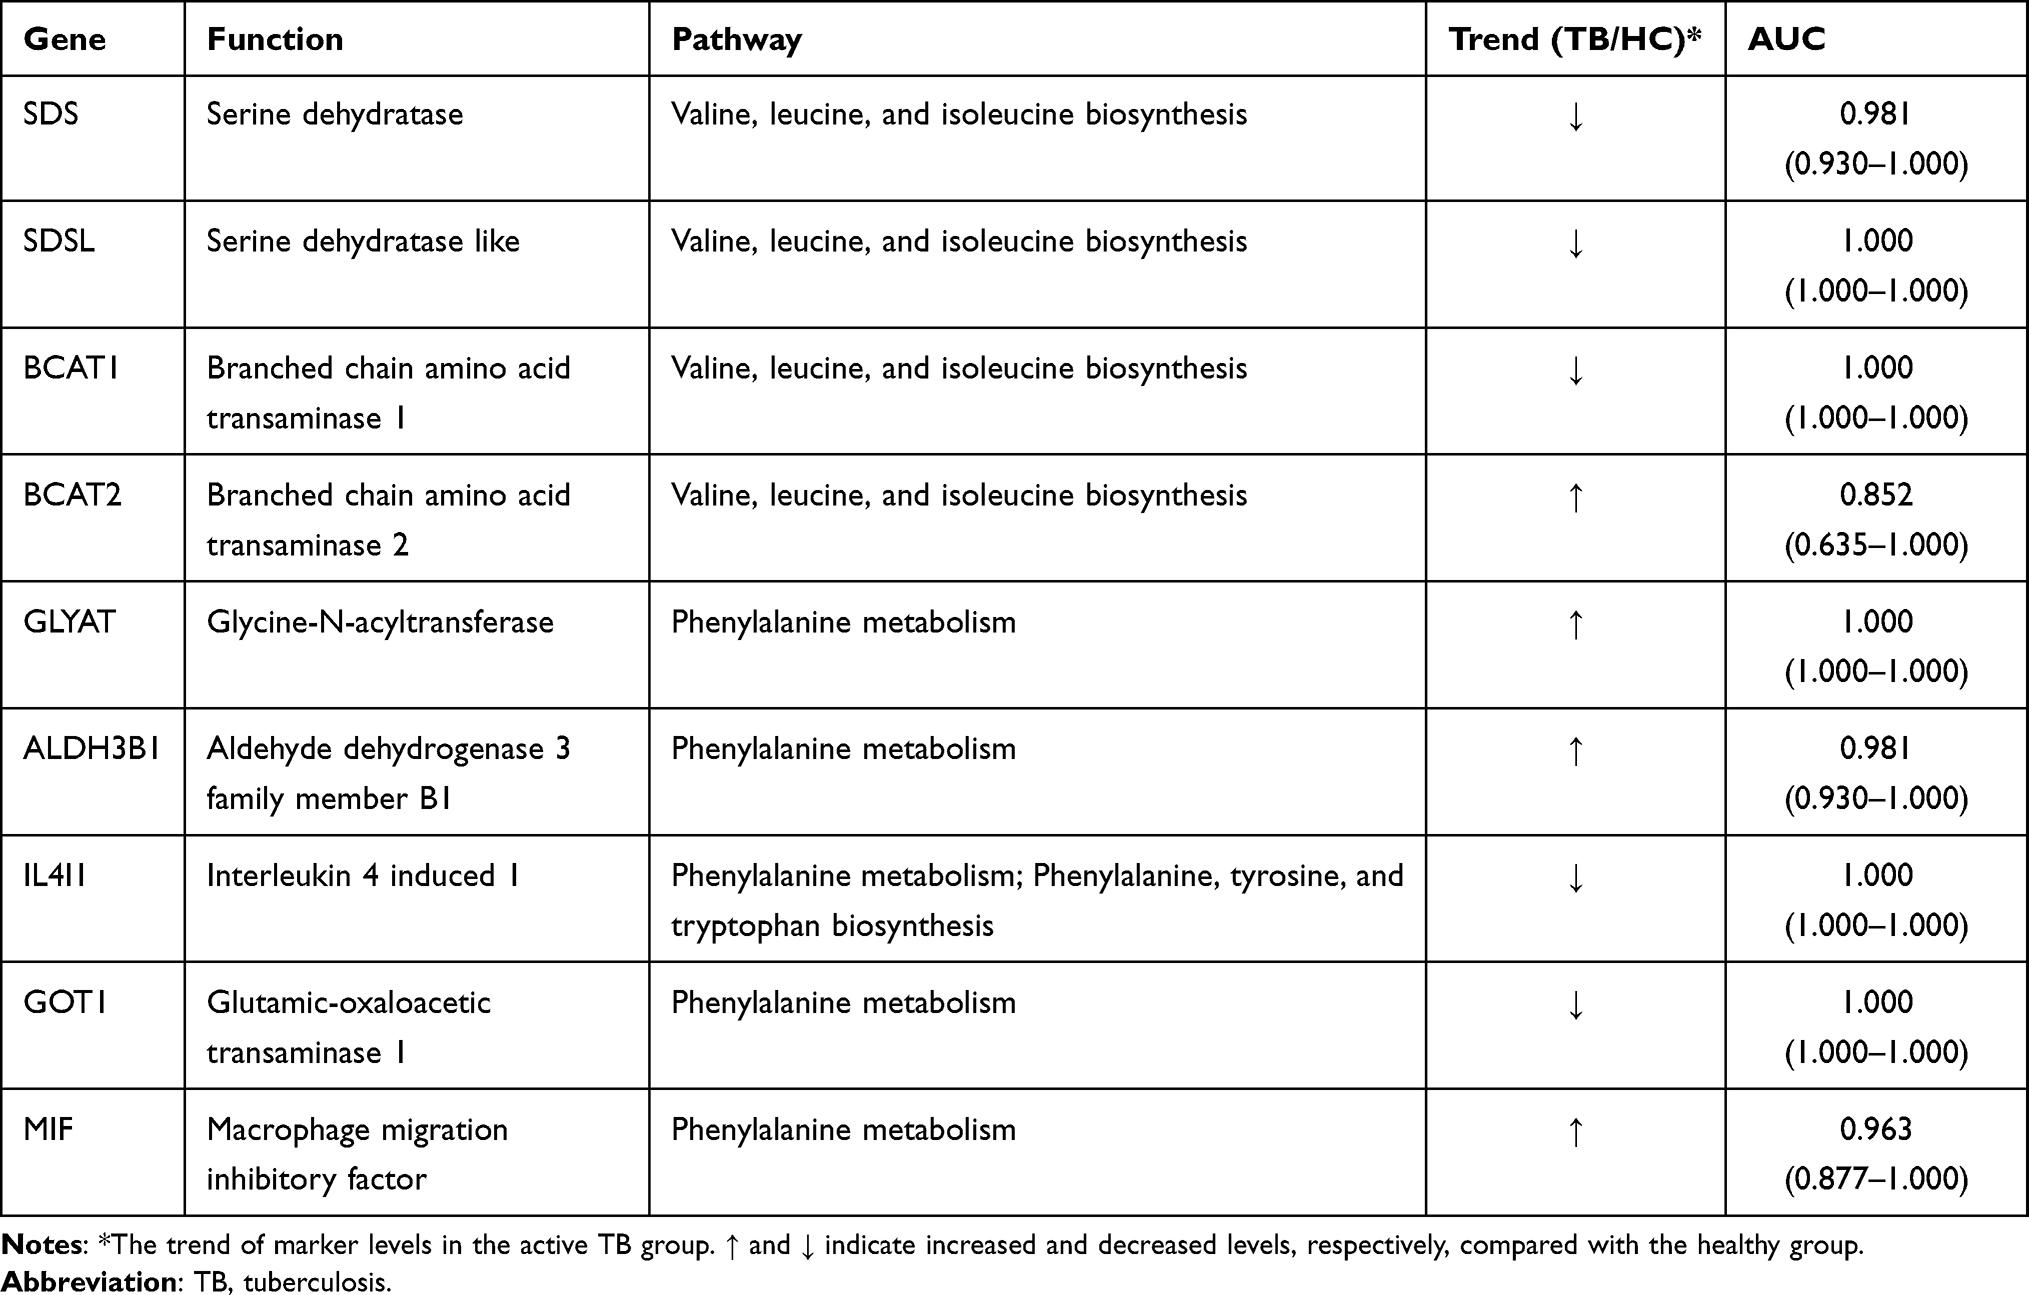 |
Table 3 Nine Genes Enriched in 3 Pathways |
Discussion
Effective TB control requires early identification and intervention of TB, and the identification of specific TB biomarkers could help better understand the pathogenesis of the disease and early-stage diagnosis. Despite a few studies having made progress in seeking new biomarkers of TB by using metabolomics, there were still some unclarified questions that rendered low reliability of the results.6–10 For example, various biomarkers generated from different types of samples might lack potentials to be based on for new diagnostic methods development. Also, a single strategy approach is regarded as inadequate to narrate a comprehensive story about the pathogenesis of tuberculosis.
Therefore, we performed the non-targeted quantitative metabolomics methods of gas chromatography-time-of-flight mass spectrometry (GC-TOF-MS) and ultra-high performance liquid chromatography-quantitative mass spectrometry (UHPLC-QE-MS) with the assistance of transcriptomics data analysis to characterize and compare the specific serum metabolic profiles of tuberculosis patients (TB) and healthy people (HC). The study aimed to explore the metabolic characteristics and biomarkers of TB. The selected metabolites and corresponding pathways were then validated by transcriptomics data from the GEO database. A total of 7 metabolites were selected as candidate biomarkers for TB diagnosis, the combination of which showed promising signs for TB diagnosis and screening by having an AUC of 0.97. Meanwhile, the AUC values of 9 genes in the 3 significantly enriched pathways were greater than 0.8.
Metabolomics studies showed different metabolic characteristics compared between HC, TB, and LTBI patients. Further analyses between HC/LTBI and TB/LTBI were conducted and a group of 33 specific metabolites was found to be significantly different in HC from TB. The variations in the intensities of all the metabolite are crucial in the discrimination models, which the variation revealed 3 pathways of TB patients are significantly altered compared to that of HC. The 3 pathways in this analysis are found to be associated with Amino acid metabolic (Phenylalanine, tyrosine, and tryptophan biosynthesis, Valine, leucine, and isoleucine biosynthesis, Phenylalanine metabolism). Amino acid metabolism is a complex process that involves many metabolites. Amino acid balance can be maintained by cells’ regulatory and metabolic events, such as proteolysis, gluconeogenesis, and oxidative catabolism. Amino acids are important precursors of gluconeogenesis, with an increasing level of such metabolic process, the amino acids present cannot be used to make protein and may cause disruption of the protein synthesis process. Interestingly, studies on the response of C57Bl/6 mice to the aerobic infection of Mycobacterium tuberculosis (MTB) have found that the levels of leucine, isoleucine, valine, and phenylalanine in rats infected with MTB all increased to some degrees, this finding suggested that the disorder of amino acid metabolism may be related to proteolysis, oxidative catabolism, and gluconeogenesis.26 Furthermore, the study focused on the metabolic characteristics of serum of tuberculosis patients and healthy people based on nuclear magnetic resonance (NMR) spectroscopy found that the concentrations of phenylalanine and tyrosine in TB patients increased and the degradation pathways of phenylalanine valine, leucine, and isoleucine significantly, which are related to MTB infection, were dysregulated.27 Furthermore, Song has found tyrosine, phenylalanine, and tryptophan to have strong effect on the binding affinity of MtbLrpA and vitamins, which provides a possible mechanism for vitamin-assisted treatment of tuberculosis.28 Additionally, one of the validated and widely recognized drug targets against TB, α-Isopropylmalate Synthase (α-IPMS) is extremely critical for the synthesis of leucine, isoleucine and valine.29 Similarly, studies have found that the tryptophan pathway is highly regulated in the host response to tuberculosis infection and disease, as well as to chemotherapy-mediated bacterial clearance, given which some scholars have taken the decreased level of tryptophan in tuberculosis patients as a prognostic marker at post-treatment stage.30,31 In fact, more and more studies have assured the importance of amino acid metabolism in the pathogenesis of tuberculosis.
Then a LASSO regression analysis was performed to evaluate the clinical potential of the metabolite alterations identified for the discrimination between HC and TB patients. The equation, with a specific combination of seven metabolites, distinguished TB patients from HC by showing an AUC value of 0.97. This value of the combined metabolites was better than that of a single metabolite. This suggests that 5-hydroxyindoleacetic acid and isoleucyl-isoleucine have a positive predictive ability of active TB. On the contrary, heptadecanoic acid, indole acetaldehyde, 5-ethyl-2,4-dimethyloxazole, and 2-hydroxycaproic acid were shown to have showed negative predictive ability. 5-hydroxyindoleacetic acid and indole acetaldehyde are both involved in the metabolism of tryptophan. 5-hydroxyindoleacetic acid is one of the metabolites of serotonin (5-HT) which is a metabolite of tryptophan. Studies have used 5-hydroxyindoleacetic acid as one of the biomarkers of vomiting after tumor chemotherapy.32 Acetaldehyde dehydrogenase mitochondria can catalyze the conversion of indole acetaldehyde to indole acetic acid; thus, the decrease of indole acetaldehyde will cause the decrease of indole acetic acid. The significant decrease of indole acetic acid serum concentration would cause the cytotoxic activity of uremia and promote the clearance of neutrophils.26 Isoleucyl-isoleucine is a dipeptide group composed of two isoleucine residues, which is an incomplete decomposition product of protein catabolism and has not been elucidated by relevant studies. Heptadecanoic acid is an exogenous fatty acid, while 2-hydroxy caproic acid is a hydroxyl fatty acid. Some related studies have indicated that fatty acid may be the carbon and energy source of Mycobacterium tuberculosis when lung tissue is continuously infected. It was also tested that an enhanced ketogenic effect of fatty acid in vivo can lead to a significant decrease of palmitic acid, phytic acid, and anisodeic acid.33,34 Nevertheless, most of these studies solely revealed the metabolic pathways of amino acids and fatty acids, further analyses with a focus on target analysis should be undertaken for these two kinds of metabolites.
Based on metabolite set enrichment analysis, it can be inferred that there are significant changes in amino acid metabolism occurring in patients with TB. There are 9 genes involved in the pathways of Phenylalanine, tyrosine and tryptophan biosynthesis, Valine, leucine and isoleucine biosynthesis, and Phenylalanine metabolism, all varying in expression between HC and TB when integrating analysis of DMs and DEGs. These genes showed excellent ability to distinguish tuberculosis which supports our findings in metabolomics research. The genes found in our study have a variety of important features. SDS and SDSL, which are found to be down-regulated in tuberculosis, encode one of three enzymes involved in metabolizing serine and glycine whose encoded protein is found predominantly in the liver. GLYAT is found to encode Glycine N-acyltransferase, a vital enzyme in the glycine metabolism and detoxification of endogenous and xenobiotic acyl-CoAs. Studies have found GLYAT as a good candidate to be a novel marker of hepatocellular carcinoma and may be a key molecule in the transition between differentiation and carcinogenesis of liver cells.35 Meanwhile, there was evidence showing that glycine has immunomodulatory properties and its levels could be an indicator to evaluate pulmonary tuberculosis and pulmonary tuberculosis with type 2 diabetes mellitus’ pathologic conditions; thus, SDS, SDSL and GLYAT should be considered for further research.36 Interestingly, studies have found polymorphism of the SDH gene may be associated with the onset of diabetic retinopathy.37 BCAT1 and BCAT 2, related to encoding a branched-chain aminotransferase have been characterized to be responsible for the biosynthesis of all branched-chain amino acids (leucine, isoleucine, and valine) in tuberculosis, were down-regulated in TB patients while several studies only focused on exploring their prognostic significance in cancers.38 Providing that Robert S Jansen has verified aspartate biosynthesis as potential species-selective drug targets in M. tuberculosis, GOT1 and GOT2 come into sight because they play a role in aspartate metabolism and the tricarboxylic acid cycles.39 IL4I1 was found to be down-regulated in TB patients whose expression is induced by the cytokine interleukin 4 in B cells to play a role in immune system escape. Studies have found certain levels of IL4I1 metabolic products in the infected lungs.40 A series of genes (GLYAT, ALDH3B1, MIF) were over-expressed in TB patients. Similarly, ALDH3B1 encoded aldehyde dehydrogenase, which may be related to the metabolism of 5-Hydroxyindoleacetate and indole-3-acetaldehyde, also play a major role in the detoxification of aldehydes generated by alcohol metabolism and lipid peroxidation and protection from oxidative stress.41 MIF encodes a lymphokine involved in cell-mediated immunity, immunoregulation, and inflammation. It takes part in regulating macrophage function in host defense through the suppression of anti-inflammatory effects of glucocorticoids. Studies have found MIF expression in COPD patients is more likely to be a consequence of disease-related factors rather than a cause of the disease.42 Overall, these DEGs may play important roles in the pathogenesis, therapy, and prognosis of pulmonary diseases. Given these points, there needs further studies to validate functions of the above genes in tuberculosis. In the meanwhile, network analysis revealed close connection between the identified metabolites and genes in our study, and indicated disturbances of their corresponding pathways.
By integrating metabolomics and transcriptomics in this study, the results revealed the significant alterations of 3 pathways in TB at both transcriptional and metabolic levels. Transcriptomics study complementarily validated the metabolomics studies and comprehensive analysis of these two omics data provided a systems-level perspective of dysregulated pathways that could facilitate the development of therapy and biomarkers for tuberculosis.
There are several limitations to our studies. To strengthen the study conclusion, some follow-up studies can be conducted for additional results validation by the inclusion of independent cohorts, and comparison with other pulmonary infectious diseases. Although the metabolomics and transcriptomics data of TB and HC were generated from different populations and technology platforms, the differences in metabolomics and transcriptomics data studies can generate more reliable results from a data analysis perspective. To conclude, integration of metabolomic and transcriptomic in biomarkers analysis has the potential to be applied as diagnostic models for early TB screening.
Conclusion
In summary, a comprehensive analysis of metabolomics and transcriptomics was performed to explore tuberculosis metabolism characteristics. We found a combination of 7 biomarkers that have been tested to show excellent performance in distinguishing TB and HC, the performances of which indicate a high potential for these biomarkers to be developed into promising and non-invasive tools for tuberculosis diagnosis and screening. Further, we explained the aberrant metabolism of tuberculosis at both transcriptional and metabolic levels, explored the roles of 9 key genes in tuberculosis which show great diagnostic ability of TB, and demonstrated that the comprehensive analysis of metabolomics and transcriptomics can be a promising method to discover more reliable biomarkers that aid early diagnosis and staging of TB.
Ethical Approval and Consent to Participate
The study was conducted in compliance with the Declaration of Helsinki, and ethical approval was obtained from the School of Public Health, Fudan University, Shanghai, China (IRB#2019-04-0737). All subjects gave written informed consent.
Acknowledgments
This study was funded by the Shanghai Clinical Research Center for the infectious disease (tuberculosis)(19MC1910800), the China National Key Project for Infectious Disease (2018ZX10715012) and the Shanghai New Three-year Action Plan for Public Health (Grant No. GWV-10.1-XK16).
Disclosure
The authors declare that they have no known competing financial interests or personal relationships that could have appeared to influence the work reported in this paper.
References
1. Glaziou P, Falzon D, Floyd K, et al. Global epidemiology of tuberculosis. Semin Respir Crit Care Med. 2013;34:3–16. doi:10.1055/s-0032-1333467
2. World Health Organization. Global tuberculosis report 2020. World Health Organization. Available from: https://www.who.int/tb/publications/global_report/TB20_Exec_Sum_20201014.pdf.
3. Pai M, Schito M. Tuberculosis diagnostics in 2015: landscape, priorities, needs, and prospects. J Infect Dis. 2015;211(Suppl 2):S21–28. doi:10.1093/infdis/jiu803
4. Dunn WB, Wilson ID, Nicholls AW, et al. The importance of experimental design and QC samples in large-scale and MS-driven untargeted metabolomic studies of humans. Bioanalysis. 2012;4:2249–2264. doi:10.4155/bio.12.204
5. Schoeman JC. A comparison of four sputum pre-extraction preparation methods for identifying and characterising Mycobacterium tuberculosis using GCxGC-TOFMS metabolomics. J Microbiol Methods. 2012;91:301–311. doi:10.1016/j.mimet.2012.09.002
6. Du Preez I, Loots DT. New sputum metabolite markers implicating adaptations of the host to Mycobacterium tuberculosis, and vice versa. Tuberculosis. 2013;93(330–337). doi:10.1016/j.tube.2013.02.008
7. Zhou A, Ni J, Xu Z, et al. Application of (1)h NMR spectroscopy-based metabolomics to sera of tuberculosis patients. J Proteome Res. 2013;12:4642–4649. doi:10.1021/pr4007359
8. Albors-Vaquer A, Rizvi A, Matzapetakis M, et al. Active and prospective latent tuberculosis are associated with different metabolomic profiles: clinical potential for the identification of rapid and non-invasive biomarkers. Emerg Microbes Infect. 2020;9:1131–1139. doi:10.1080/22221751.2020.1760734
9. Phillips M, Basa-Dalay V, Bothamley G, et al. Breath biomarkers of active pulmonary tuberculosis. Tuberculosis. 2010;90:145–151. doi:10.1016/j.tube.2010.01.003
10. Kolk AH, van Berkel JJ, Claassens MM, et al. Breath analysis as a potential diagnostic tool for tuberculosis. Int J Tuberc Lung Dis. 2012;16:777–782. doi:10.5588/ijtld.11.0576
11. Banday KM, Pasikanti KK, Chan EC, et al. Use of urine volatile organic compounds to discriminate tuberculosis patients from healthy subjects. Anal Chem. 2011;83:5526–5534. doi:10.1021/ac200265g
12. Mahapatra S, Hess AM, Johnson JL, et al. A metabolic biosignature of early response to anti-tuberculosis treatment. BMC Infect Dis. 2014;14:53. doi:10.1186/1471-2334-14-53
13. Hassan MA, Al-Sakkaf K, Shait Mohammed MR, et al. Integration of transcriptome and metabolome provides unique insights to pathways associated with obese breast cancer patients. Front Oncol. 2020;10:804. doi:10.3389/fonc.2020.00804
14. Ruiying C, Zeyun L, Yongliang Y, et al. A comprehensive analysis of metabolomics and transcriptomics in non-small cell lung cancer. PLoS One. 2020;15:e0232272. doi:10.1371/journal.pone.0232272
15. Yang K, Xia B, Wang W, et al. A comprehensive analysis of metabolomics and transcriptomics in cervical cancer. Sci Rep. 2017;7:43353. doi:10.1038/srep43353
16. Dutta NK, Tornheim JA, Fukutani KF, et al. Integration of metabolomics and transcriptomics reveals novel biomarkers in the blood for tuberculosis diagnosis in children. Sci Rep. 2020;10;19527.
17. Dunn WB, Broadhurst D, Begley P, et al. Procedures for large-scale metabolic profiling of serum and plasma using gas chromatography and liquid chromatography coupled to mass spectrometry. Nat Protoc. 2011;6:1060–1083. doi:10.1038/nprot.2011.335
18. Smith CA, Want EJ, O’Maille G, et al. XCMS: processing mass spectrometry data for metabolite profiling using nonlinear peak alignment, matching, and identification. Anal Chem. 2006;78:779–787. doi:10.1021/ac051437y
19. Chong J, Soufan O, Li C, et al. MetaboAnalyst 4.0: towards more transparent and integrative metabolomics analysis. Nucleic Acids Res. 2018;46:486–494. doi:10.1093/nar/gky310
20. Jolliffe. I. T.Principal component analysis. J Marketing Res. 2002;87(4):13.
21. Trygg J, Wold S. Orthogonal projections to latent structures (O-PLS). J Chemom. 2010;16(3):119–128. doi:10.1002/cem.695
22. Hastie T. The elements of statistical learning: data mining. J Royal Statistical Soc. 2004;167:192. doi:10.1111/j.1467-985X.2004.298_11.x
23. Kanehisa M, Sato Y, Kawashima M, et al. KEGG as a reference resource for gene and protein annotation. Nucleic Acids Res. 2016;44:D457–462. doi:10.1093/nar/gkv1070
24. Ogata H, Goto S, Sato K, et al. KEGG: Kyoto Encyclopedia of Genes and Genomes. Nucleic Acids Res. 1999;27:29–34. doi:10.1093/nar/27.1.29
25. Gao J, Tarcea VG, Karnovsky A, et al. Metscape: a Cytoscape plug-in for visualizing and interpreting metabolomic data in the context of human metabolic networks. Bioinformatics. 2010;26:971–973. doi:10.1093/bioinformatics/btq048
26. Weiner J
27. Shin JH, Yang JY, Jeon BY, et al. (1)H NMR-based metabolomic profiling in mice infected with Mycobacterium tuberculosis. J Proteome Res. 2011;10:2238–2247. doi:10.1021/pr101054m
28. Song N, Cui Y, Li Z, et al. New targets and cofactors for the transcription factor LrpA from Mycobacterium tuberculosis. DNA Cell Biol. 2016;35(4):167–176. doi:10.1089/dna.2015.3040
29. Pandey P, Lynn AM, Bandyopadhyay P. Identification of inhibitors against α-Isopropylmalate Synthase of Mycobacterium tuberculosis using docking-MM/PBSA hybrid approach. Bioinformation. 2017;13(5):144–148. doi:10.6026/97320630013144
30. Collins JM, Siddiqa A, Jones DP, et al. Tryptophan catabolism reflects disease activity in human tuberculosis. JCI Insight. 2020;5:10. doi:10.1172/jci.insight.137131
31. Tientcheu LD, Maertzdorf J, Weiner J, et al. Differential transcriptomic and metabolic profiles of M. africanum- and M. tuberculosis-infected patients after, but not before, drug treatment. Genes Immun. 2015;16:347–355. doi:10.1038/gene.2015.21
32. Yang DG, Chang YS, Kim YS, et al. Urinary 5-hydroxyindoleacetic acid (5-HIAA) excretion before and during cisplatin chemotherapy in patients with intrathoracic malignancy. Tuberc Respir Dis (Seoul). 1999;46:811–816. doi:10.4046/trd.1999.46.6.811
33. Vrieling F, Alisjahbana B, Sahiratmadja E. Plasma metabonomics in tuberculosis patients at different stages. Chine J Magnetic Resonance. 2016;33(2):224–235.
34. Feng S, Du YQ, Zhang L, et al. Analysis of serum metabolic profile by ultra-performance liquid chromatography-mass spectrometry for biomarkers discovery: application in a pilot study to discriminate patients with tuberculosis. Chin Med J. 2015;128:159–168. doi:10.4103/0366-6999.149188
35. Matsuo M, Terai K, Kameda N, et al. Designation of enzyme activity of glycine-N-acyltransferase family genes and depression of glycine-N-acyltransferase in human hepatocellular carcinoma. Biochem Biophys Res Commun. 2012;420:901–906. doi:10.1016/j.bbrc.2012.03.099
36. Zenil-Vega M, Cerón E, López-Bello G, et al. An association between glycine and insulin levels is observed in patients with pulmonary tuberculosis and type 2 diabetes. Clin Nutr. 2020;39(10):3019–3023. doi:10.1016/j.clnu.2020.02.007
37. Szaflik JP, Majsterek I, Kowalski M, et al. Association between sorbitol dehydrogenase gene polymorphisms and type 2 diabetic retinopathy. Exp Eye Res. 2008;86:647–652. doi:10.1016/j.exer.2008.01.009
38. Song Y, Zhao B, Xu Y, et al. Prognostic significance of branched-chain amino acid transferase 1 and CD133 in triple-negative breast cancer. BMC Cancer. 2020;20:584. doi:10.1186/s12885-020-07070-2
39. Jansen RS, Mandyoli L, Hughes R, et al. Aspartate aminotransferase Rv3722c governs aspartate-dependent nitrogen metabolism in Mycobacterium tuberculosis. Nat Commun. 2020;11(1):1960. doi:10.1038/s41467-020-15876-8
40. Seddigh P, Bracht T, Molinier-Frenkel V, et al. Quantitative analysis of proteome modulations in alveolar epithelial type II cells in response to pulmonary aspergillus fumigatus infection. Mol Cell Proteomics. 2017;16:2184–2198. doi:10.1074/mcp.RA117.000072
41. Marchitti SA, Orlicky DJ, Vasiliou V. Expression and initial characterization of human ALDH3B1. Biochem Biophys Res Commun. 2007;356:792–798. doi:10.1016/j.bbrc.2007.03.046
42. Florez-Sampedro L, Brandsma CA, de Vries M, et al. Genetic regulation of gene expression of MIF family members in lung tissue. Sci Rep. 2020;10:16980. doi:10.1038/s41598-020-74121-w
 © 2021 The Author(s). This work is published and licensed by Dove Medical Press Limited. The full terms of this license are available at https://www.dovepress.com/terms.php and incorporate the Creative Commons Attribution - Non Commercial (unported, v3.0) License.
By accessing the work you hereby accept the Terms. Non-commercial uses of the work are permitted without any further permission from Dove Medical Press Limited, provided the work is properly attributed. For permission for commercial use of this work, please see paragraphs 4.2 and 5 of our Terms.
© 2021 The Author(s). This work is published and licensed by Dove Medical Press Limited. The full terms of this license are available at https://www.dovepress.com/terms.php and incorporate the Creative Commons Attribution - Non Commercial (unported, v3.0) License.
By accessing the work you hereby accept the Terms. Non-commercial uses of the work are permitted without any further permission from Dove Medical Press Limited, provided the work is properly attributed. For permission for commercial use of this work, please see paragraphs 4.2 and 5 of our Terms.