")
Back to Journals » Neuropsychiatric Disease and Treatment » Volume 14
Metabolite-related antidepressant action of diterpene ginkgolides in the prefrontal cortex
Authors Hu Q, Shen P, Bai S , Dong M, Liang Z, Chen Z, Wang W, Wang H, Gui S, Li P, Xie P
Received 3 January 2018
Accepted for publication 23 February 2018
Published 13 April 2018 Volume 2018:14 Pages 999—1011
DOI https://doi.org/10.2147/NDT.S161351
Checked for plagiarism Yes
Review by Single anonymous peer review
Peer reviewer comments 2
Editor who approved publication: Professor Wai Kwong Tang
Qingchuan Hu,1–3,* Peng Shen,1,2,4,* Shunjie Bai,1–3,* Meixue Dong,1,2,4,* Zihong Liang,1,2,4,5 Zhi Chen,1,2,6 Wei Wang,1,2,6 Haiyang Wang,1,2 Siwen Gui,1,2 Pengfei Li,1,2 Peng Xie1–4,6
1Chongqing Key Laboratory of Neurobiology, 2Institute of Neuroscience and the Collaborative Innovation Center for Brain Science, 3Key Laboratory of Laboratory Medical Diagnostics of Education, Department of Laboratory Medicine, Chongqing Medical University, 4Department of Neurology, The First Affiliated Hospital of Chongqing Medical University, Chongqing, 5Department of Neurology, The Inner Mongolia Autonomous Region People’s Hospital, Hohhot, Inner Mongolia, 6Department of Neurology, Yongchuan Hospital, Chongqing Medical University, Chongqing, China
*These authors contributed equally to this work
Purpose: Ginkgo biloba extract (GBE) contains diterpene ginkgolides (DGs), which have been shown to have neuroprotective effects by a number of previous studies. We previously demonstrated part of the action of DG. However, the impact of DG on the prefrontal cortex (PFC) remains unclear. Here, we evaluated the effects of DG and venlafaxine (for comparison) on behavioral and metabolite changes in the PFC using mice models and gas chromatography–mass spectrometry-based metabolomics.
Materials and methods: Mice were randomly divided into control (saline), DG (12.18 mg/kg) and venlafaxine (16 mg/kg) groups. After 2 weeks of treatment, depression and anxiety-related behavioral tests were performed. Metabolic profiles of the PFC were detected by gas chromatography–mass spectrometry.
Results: The DG group exhibited positive effects in the sucrose preference test. The differential metabolites were mainly related to amino acid metabolism, energy metabolism and lipid metabolism. The results indicated that the DG group exhibited perturbed lipid metabolism, molecular transport and small-molecule biochemistry in the PFC. Compared with the control group, pathway analysis indicated that venlafaxine and DG had similar effects on alanine, aspartate and glutamate metabolism.
Conclusion: These findings demonstrate that DG has antidepressant-like, but not anxiolytic-like, effects in mice, suggesting that it might have therapeutic potential for the treatment of major depressive disorder.
Keywords: diterpene ginkgolides, antidepressant, metabolomics, prefrontal cortex, depressive disorder
Introduction
Along with an increase in interpersonal and work-related stress, the incidence of some mental illnesses has risen in recent years, imparting a heavy burden on patients and society.1 Mental illnesses such as depression and anxiety are major public health issues, and there is an urgent need to identify new effective drugs.2–5 Research has indicated that traditional Chinese medicines have great potential for treating these diseases. Moreover, compared with Western medicines, traditional Chinese medicines tend to have minor side effects,6,7 which is therapeutically advantageous.
Ginkgo biloba extract (GBE) contains many compounds, the most important of which are flavonoids (ginkgo-flavone glycosides) and terpenoids (ginkgolides and bilobalide).8,9 Recent studies have demonstrated that some components of GBE may exert antidepressant-like effects.10–14 The adverse effects of ginkgo are typically mild, transient and reversible, although potentially serious adverse effects include bleeding and seizures.15–18 Diterpene ginkgolides (DGs), components of GBE, yield a wide variety of biochemical properties and activities. Numerous pharmacologic studies have shown that DG, mainly composed of ginkgolides A, B and K (in the standardized extract EGb761), is responsible for the main pharmacologic (neuroprotective) effects of GBE.12,19–21 DG Meglumine Injection, a novel medicinal plant product, primarily contains ginkgolides A, B and K.
The prefrontal cortex (PFC) plays major roles in emotion, cognition and learning.22,23 Convergent evidence highlights the differential contributions to the various regions of the PFC in cognitive control. The PFC has been shown to be critical in the development and improvement of depression. Research in our laboratory has focused on major depressive disorders for many years,24–27 and our previous studies have demonstrated the key roles of the PFC in depression in animal models and patients.24,28–32
Metabolomics, which is the quantitative measurement of the dynamic metabolic response of living systems to pathophysiological stimuli or genetic modification, has recently been extensively used for investigating biochemical alterations, exploring potential pathophysiological mechanisms and evaluating the therapeutic effects of drugs.33 In this study, we used gas chromatography–mass spectrometry (GC-MS)-based metabolomics combined with principal component analysis (PCA) and partial least squares-discriminant analysis (PLS-DA) to examine the metabolite changes induced by DG in the PFC of mice. We also examined the effects of DG on behavioral function. Furthermore, we compared the effects of DG with those of venlafaxine, in an effort to provide insight into the therapeutic potential of DG for the treatment of mental illnesses such as depression.
Materials and methods
Animals
C57BL/6J male mice (age 8 weeks; weight 18–20 g) were obtained from the Chongqing Medical University Laboratory Animal Center. They were housed in a room at 23°C±1°C, with a 12/12 h light/dark cycle, 50%±5% humidity and free access to food and water. This study was approved by the Ethics Committee of Chongqing Medical University, and all procedures were conducted in accordance with the National Institutes of Health Guide for the Care and Use of Laboratory Animals.
Reagents
DG was injected at a dose of 25 mg/mL and was provided by Jiangsu Kanion Pharmaceutical Co., Ltd (Jiangsu, China). Venlafaxine was purchased from Sigma-Aldrich (Shanghai, China).
Experimental design
The mice were habituated to the housing conditions for 1 week, then divided into the following three groups: control (saline), DG (dose of 12.18 mg/kg)34 and venlafaxine (venlafaxine diluted in 0.9% NaCl solution to a dose of 16 mg/kg). Over the next 2 weeks, the mice were injected intraperitoneally daily between 8:00 AM and 10:00 AM with the same amount of solution.
Behavioral tests
We assessed behaviors using the sucrose preference test, the open field test and the elevated plus maze (EPM) test after treatment.
Sucrose preference test
Before the experiment, the mice were fed 1% sugar water for 72 h for habituation. Mice were then deprived of water and food for 24 h and given 1% sugar water and pure water. Then, 12 h later, the positions of the sugar water and pure water were switched. Thereafter, 24 h later, we calculated the preference for the sugar water.
Open field test
The open field test evaluates the spatial exploration behavior in rodents. The box (44×44×30 cm) was divided into two zones, with a 22×22 cm center zone. The mice were placed in the center of the box, habituated for 30 s and video-recorded for 5 min. We then measured the rearing time, the traveled distance, the permanence time and the number of entries into different zones using SMART software. All data were exported into an Excel file.
EPM test
The EPM is widely used to assess the anxiety-like behavior in rodents. In the current study, the maze was composed of two open arms and two closed arms (30×6 cm). The mice were placed in the center of the maze with the head toward the open arms, habituated for 30 s and video-recorded for 5 min. We then recorded the traveled distance, the permanence time and the number of entries into different zones using SMART software. All data were exported into an Excel file.
Tissue collection and processing
Mice were sacrificed by decapitation after a final injection. The PFCs were quickly frozen in liquid nitrogen and stored at −80°C until use in metabolomics analyses.
Sample processing
For the metabolomics study, the procedures were performed as in our previous study.31 Each PFC was treated with 20 μL internal standard (L-2 chlorophenylalanine, 0.03 mg/mL in methanol) and 500 μL of a methanol, water and chloroform solution (5:2:2, v/v/v; Tissuelyser-192; Jingxin, Shanghai, China). The mixture was then sonicated for 5 min, incubated at 4°C for 20 min and centrifuged at 14,000 rpm for 15 min at 4°C. The supernatant (300 μL) was transferred to a derivatization bottle and dried using a centrifugal concentration apparatus. Thereafter, 80 μL of a 15 mg/mL methoxyamine hydrochloride solution in pyridine was added to the vial, vortexed for 2 min and incubated for 90 min at 37°C for the oximation reaction. Subsequently, the solution was derivatized with 80 μL of BSTFA (1% TMCS) and 20 μL of n-hexane at 70°C for 60 min and then placed at room temperature for 30 min before GC-MS analysis.
GC-MS analysis
GC-MS analysis was performed using the Agilent 7890 a/5975 c GC/MSD system, with an Agilent HP-5 ms capillary chromatographic column (30 m, 0.25 mm, 0.25 μm). The parameters were as follows: injection port temperature, 280°C; EI ion source temperature, 230°C; quadrupole temperature, 150°C; helium (purity >99.999%) as the carrier; carrier gas velocity, 6 mL/min; each sample was applied for metabolite separation; sample quantity, 0.5 μL; initial temperature of 70°C for 2 min, rate of 6°C/min until 160°C, then a rate of 10°C/min to 240°C, and a final rate of 20°C/min to 300°C, maintained for 6 min. Full scan mode was used to detect the mass spectrum, and the range of mass spectrometry detection was 50–600 (m/z). Continuous sample analysis using random order was performed, and the impact of instrument signal fluctuation was corrected.
Metabolite identification and data processing
GC-MS metabolite profiles were converted into the NetCdf file format using TagFinder for peak integration.35 Low-molecular-weight metabolites were identified as chromatographic peaks in total ion current chromatograms. The R software platform was used for data preprocessing, including baseline filtering, peak identification, integration, correcting retention time and attribution analysis of mass spectrometry fragments. Excel software was used to correct for loss from the column and for rejecting impurity peaks and quantitating the ions. The final results were converted to a two-dimensional data matrix containing sample information, retention times and the response intensity of the mass spectrum. The internal standard was used for data quality control. Finally, we obtained 242 components. The peak area normalization method was used to normalize response spectrum peak intensity, and a data matrix was generated.
The data matrix was imported into a SIMCA-P+ 11.5 software package. We used unsupervised PCA to study the distribution between samples and the stability of the whole process of analysis. PCA is an unsupervised multidimensional statistical analysis method, which can assess the overall metabolic differences between groups and the variability within each group. To identify the differential metabolites among groups, we evaluated the overall difference with supervised PLS-DA. Variable weight (variable importance in projection [VIP]) >1 was considered to indicate a differential variable. To prevent overfitting, seven round cross-validation and 200-response permutation tests were used to verify the PLS-DA model.
We combined the PLS-DA and t-test were combined to screen for metabolites among groups (VIP >1, p<0.05). Differences in metabolites were identified using the workstation software, which can compare the characteristics of each compound’s fragmentation patterns with a standardized fragment ion spectral library in the National Institute of Standards and Technology and Fiehn metabolomics databases. In general, a similarity of >70% can be considered to indicate a match with the standard.
Cytoscape software 3.4.0 was used to build the correlation network between these differential metabolites in venlafaxine or DG. The correlation analyses between the behavioral results and the metabolites were performed using Pearson’s correlation coefficients.
Bioinformatics analysis
Ingenuity Pathways Analysis (IPA; Ingenuity Systems)56 was used to analyze the metabolomics data for the various groups (DG, control and venlafaxine).36 In addition, we used MetaboAnalyst 3.037 to obtain detailed information about the differential metabolites and to create heat maps of all the metabolites. This program employs the Kyoto Encyclopedia57 of Genes and Genomes.
Statistical analysis
The behavioral and molecular data were expressed as means ± standard error of the mean and analyzed with one-way analysis of variance using SPSS 21.0 (IBM Corporation, Armonk, NY, USA). GraphPad Prism 7.0 was used for plotting all data. A p-value of <0.05 was considered to indicate a significant difference.
Results
Behavioral testing
The sucrose preference test revealed a significant increase in sucrose preference in the DG group, consistent with our previous findings34 (Figure 1A). The open field test and the EPM were used to evaluate the level of anxiety-like behavior of rodents. There were no significant differences in the EPM test (Figure 1B and C; p>0.05). In the open field test, there was no significant difference among the three groups when analyzed using the standard distance in the center zone, duration time in the center zone and rearing behavior (Figure 1D–F).
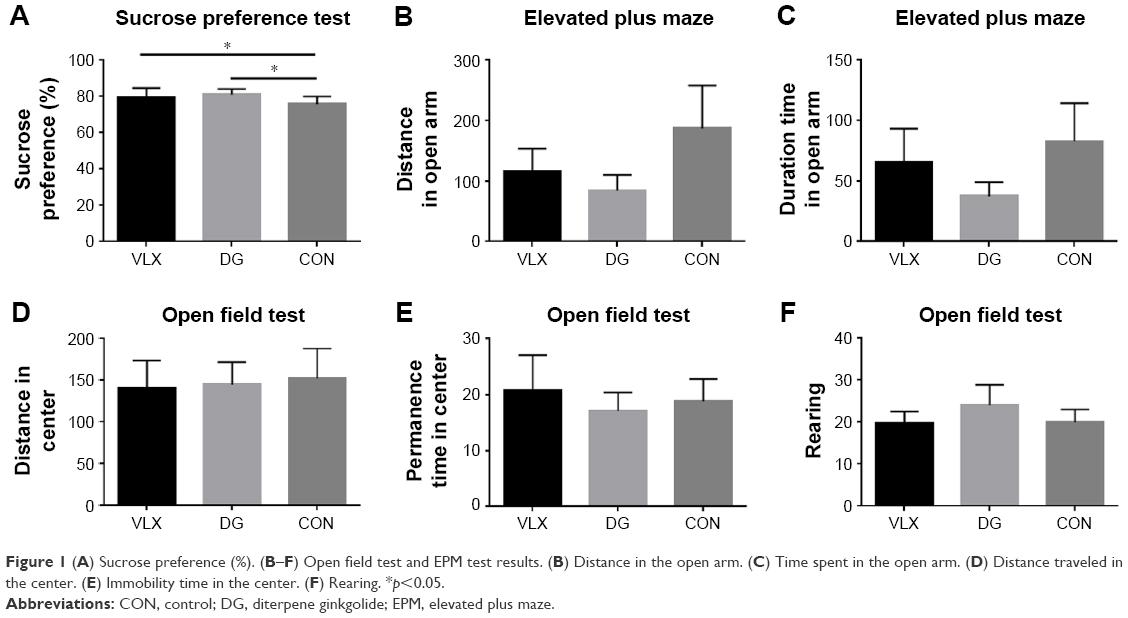 | Figure 1 (A) Sucrose preference (%). (B–F) Open field test and EPM test results. (B) Distance in the open arm. (C) Time spent in the open arm. (D) Distance traveled in the center. (E) Immobility time in the center. (F) Rearing. *p<0.05. |
Metabolomic analysis
We performed the following comparisons: venlafaxine vs DG, venlafaxine vs control and venlafaxine vs DG, using PCA and PLS-DA. The PCA results were as follows: venlafaxine vs DG (R2X=0.598, Q2=0.376), venlafaxine vs control (R2X=0.569, Q2=0.324) and DG vs control (R2X=0.431, Q2=0.197). The main components of PCA are R2X and Q2. Generally, the main parameter for judging the quality of the model is R2X, which represents how well the model explains the data. An R2X value >0.4 indicates that the model is reliable. Therefore, the PCA model is suitable for explaining the metabolic differences among the three groups. The PLS-DA results were as follows: venlafaxine vs DG (R2X=0.844, R2Y=0.964, Q2=0.882), venlafaxine vs control (R2X=0.871, R2Y=0.996, Q2=0.974) and DG vs venlafaxine (R2X=0.722, R2Y=0.718, Q2=0.3). In the supervised PLS-DA, R2Y and Q2 are the two important parameters. Q2 >0.5 indicates that the model performs well in discriminant analysis (the greater the value, the better the performance in discriminant analysis). The results of the PCA and PLS-DA models are shown in Figure 2. We examined the stability of the model with a permutation test using 200 iterations. The PLS-DA model was validated, with no overfitting (Figure 3). The criteria for significant metabolic differences were VIP >1 and p<0.05 (Table 1).
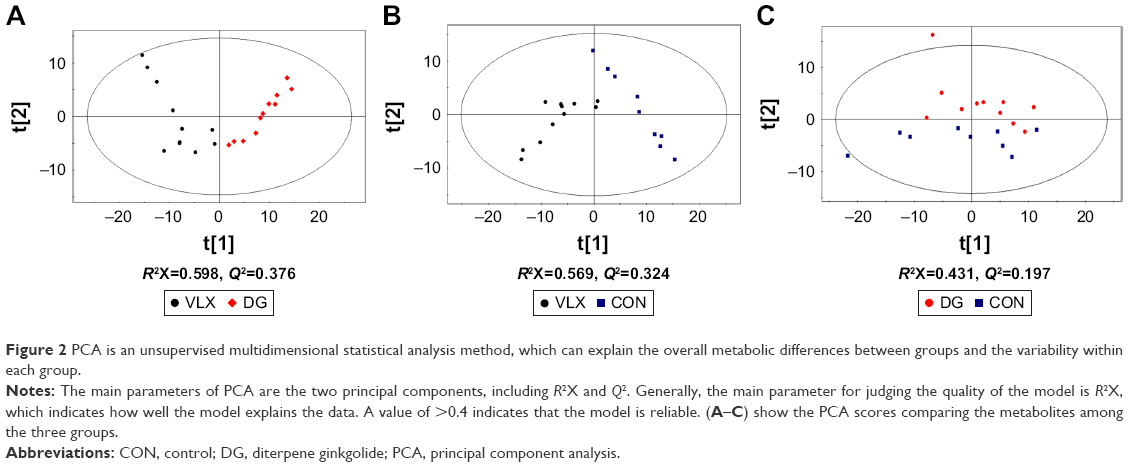 | Figure 2 PCA is an unsupervised multidimensional statistical analysis method, which can explain the overall metabolic differences between groups and the variability within each group. |
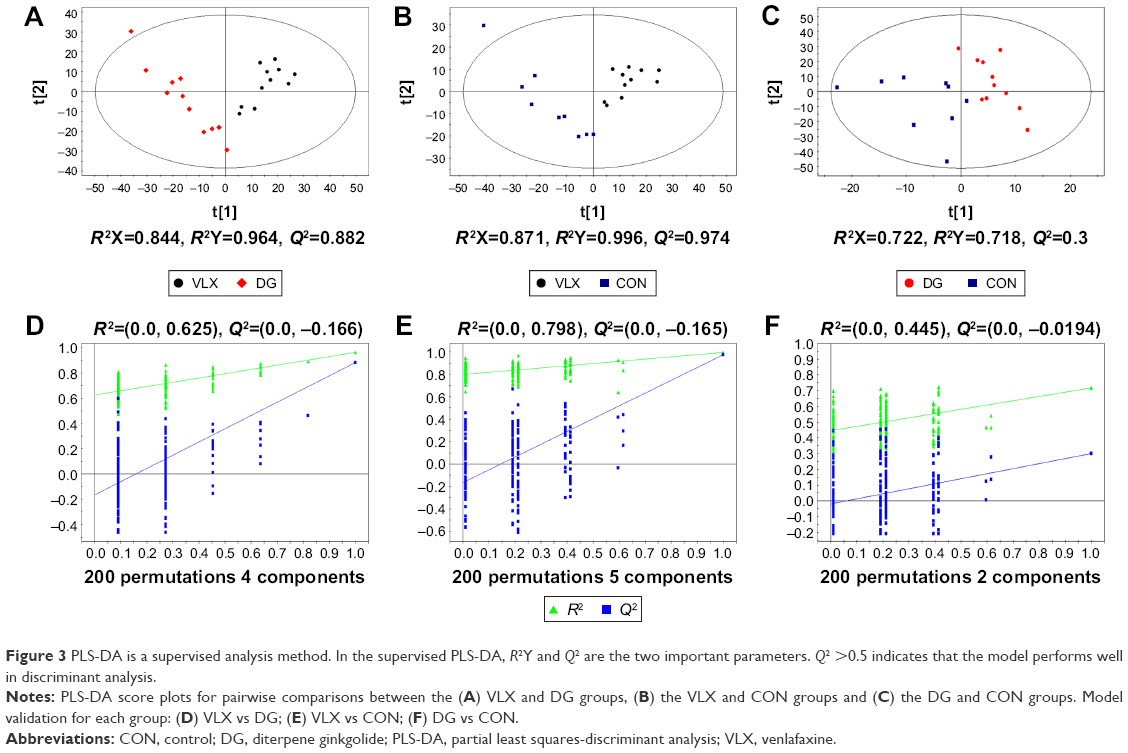 | Figure 3 PLS-DA is a supervised analysis method. In the supervised PLS-DA, R2Y and Q2 are the two important parameters. Q2 >0.5 indicates that the model performs well in discriminant analysis. |
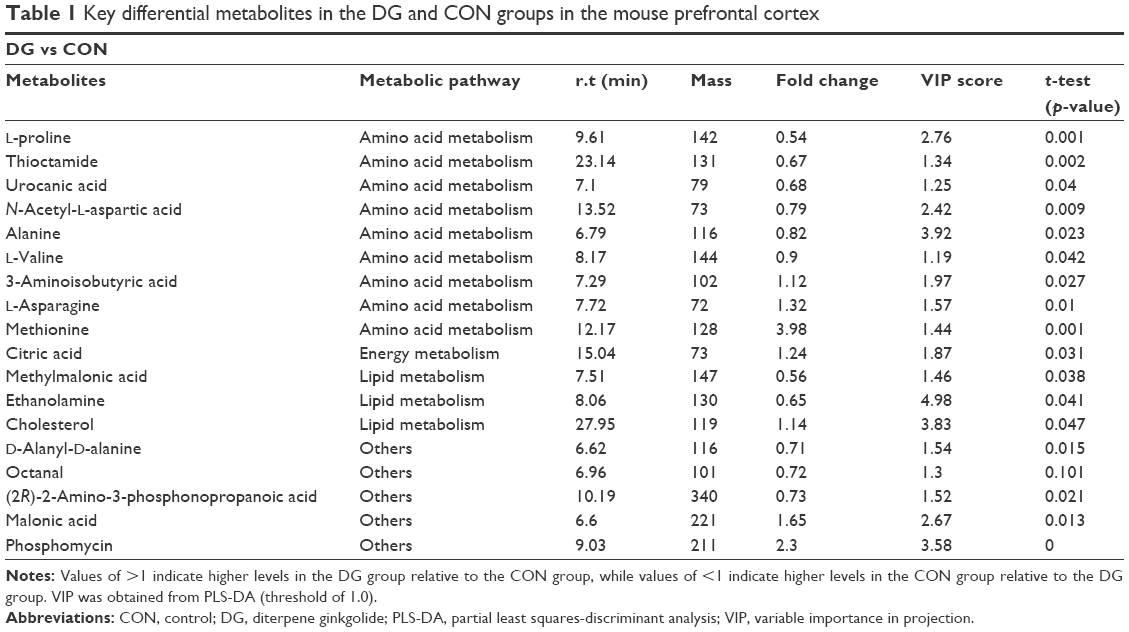 | Table 1 Key differential metabolites in the DG and CON groups in the mouse prefrontal cortex |
A total of 18 differentially expressed metabolites were identified by comparing the differences between the DG group and the control group (Figure 4). The results for the Venlafaxine (VLX) group and the control group are shown in Figure 5. These metabolites were subsequently uploaded to the IPA web site for molecular interaction network analysis. The most significantly altered network was then generated with a score of 34. The differential metabolites of VLX and DG groups are shown in Figure 6. The network involved 12 metabolites, including citric acid, cholesterol, 3-aminoisobutyric acid, methionine, asparagine, malonic acid, alanine, octanal, ethanolamine, N-acetyl-L-aspartic acid (NAA), methylmalonic acid and L-proline (Figure 7A). Another network of venlafaxine is shown in Figure 7B. The differential metabolites of VLX and DG groups are shown in Figure 6.
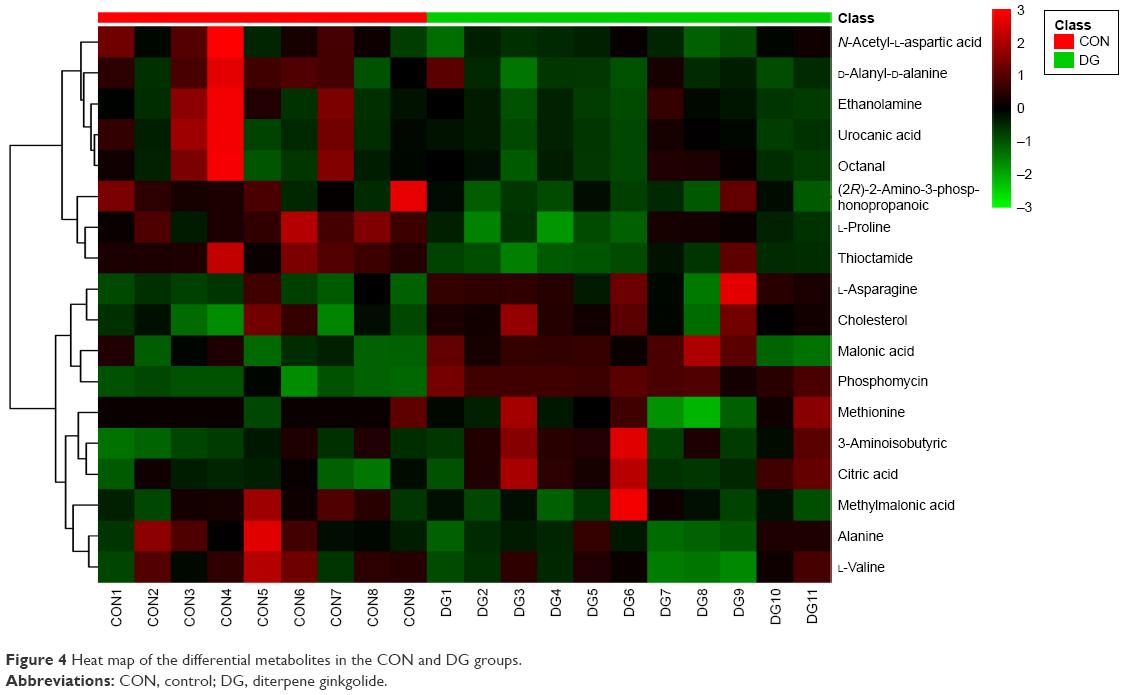 | Figure 4 Heat map of the differential metabolites in the CON and DG groups. |
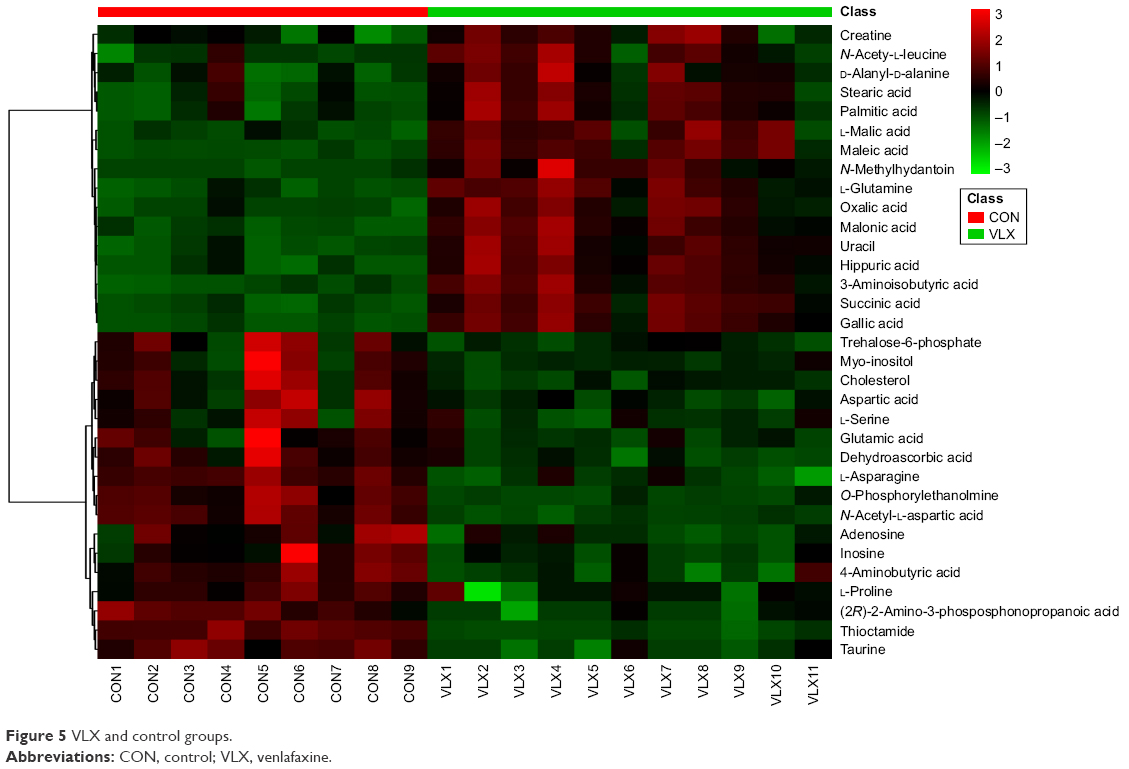 | Figure 5 VLX and control groups. |
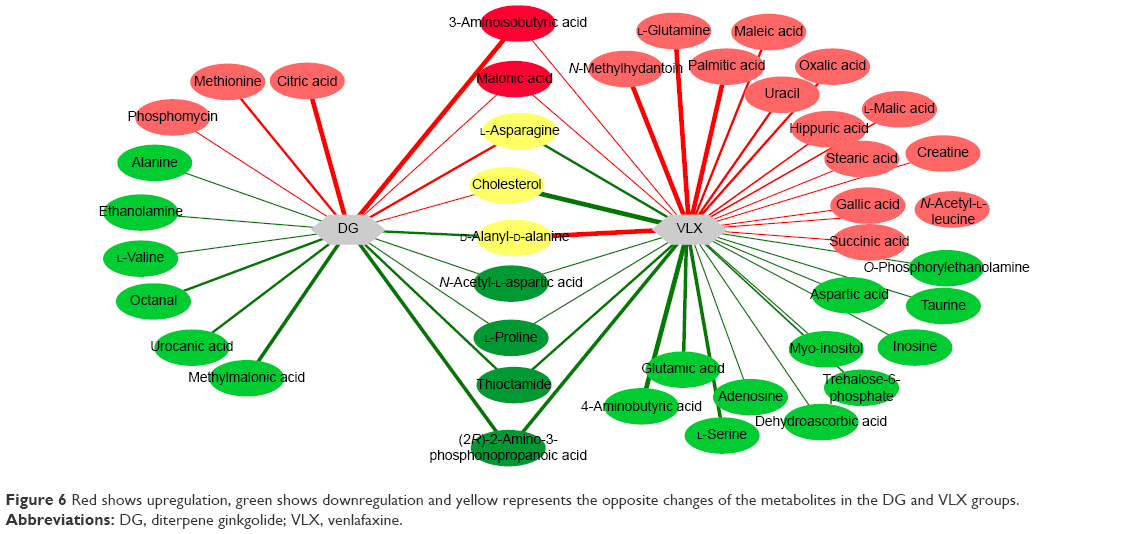 | Figure 6 Red shows upregulation, green shows downregulation and yellow represents the opposite changes of the metabolites in the DG and VLX groups. |
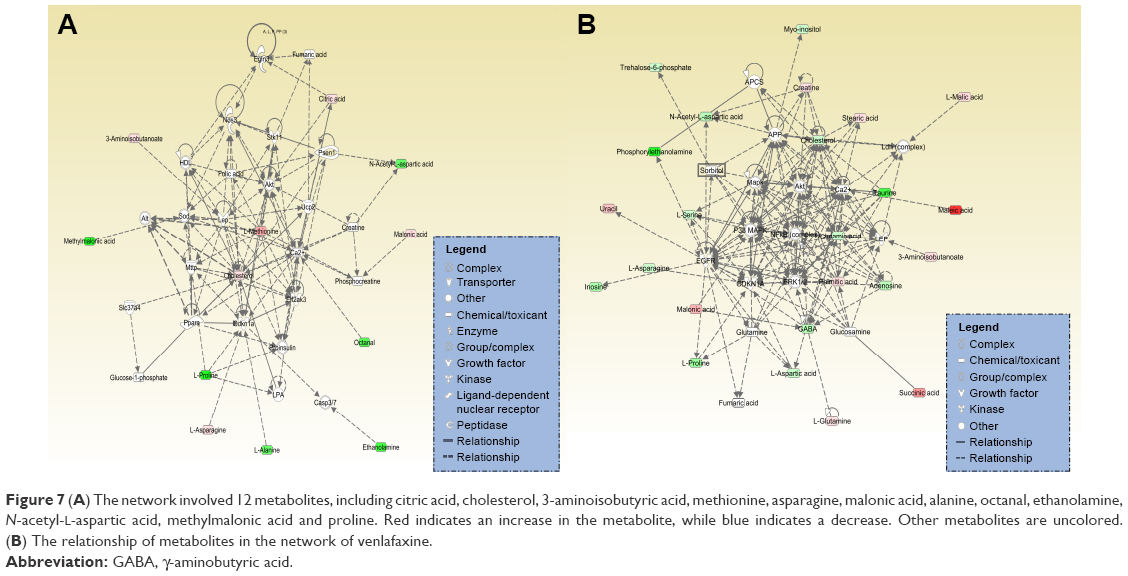 | Figure 7 (A) The network involved 12 metabolites, including citric acid, cholesterol, 3-aminoisobutyric acid, methionine, asparagine, malonic acid, alanine, octanal, ethanolamine, N-acetyl-L-aspartic acid, methylmalonic acid and proline. Red indicates an increase in the metabolite, while blue indicates a decrease. Other metabolites are uncolored. (B) The relationship of metabolites in the network of venlafaxine. |
We also imported the differential metabolites of DG group into MetaboAnalyst 3.0 to identify the significant pathways. The major pathways were alanine, aspartate and glutamate metabolism, aminoacyl-tRNA biosynthesis, citrate cycle (tricarboxylic acid cycle) and pyrimidine metabolism (Figure 8A). These molecules are mainly involved in amino acid metabolism, energy metabolism and lipid metabolism. Similarly, the significant pathways in the venlafaxine group were alanine, aspartate and glutamate metabolism, arginine and proline metabolism, nitrogen metabolism, aminoacyl-tRNA biosynthesis, D-glutamate metabolism and cyanoamino acid metabolism (Figure 8B).
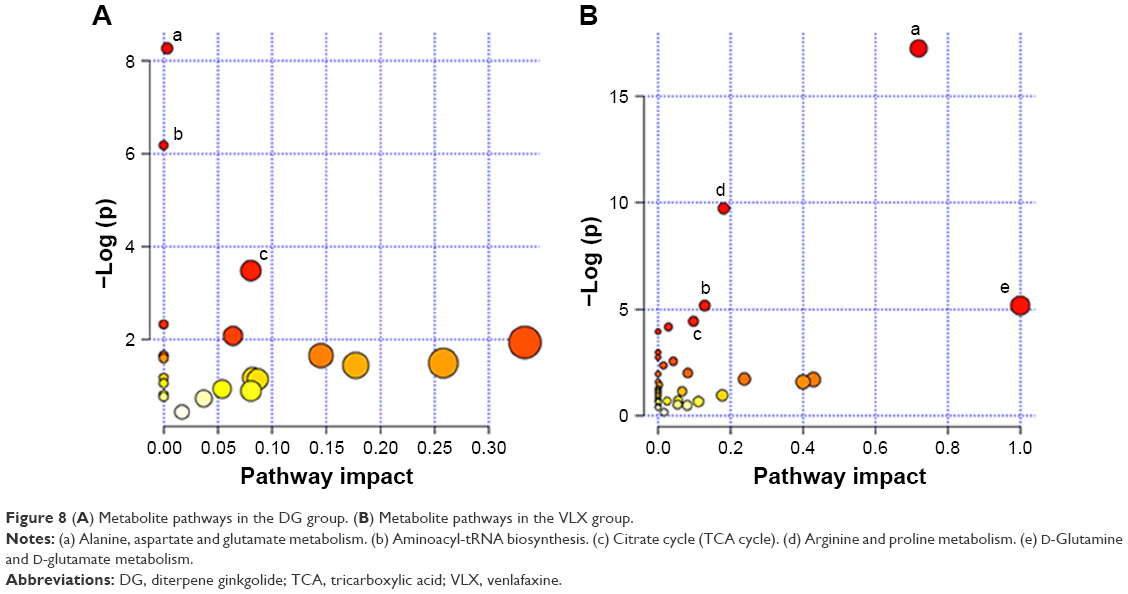 | Figure 8 (A) Metabolite pathways in the DG group. (B) Metabolite pathways in the VLX group. |
Correlation analysis was conducted between metabolites and behaviors. The results are shown in Figures 9 and 10. Comparing the VLX and control groups, N-methylhydantoin and sucrose preference test exhibited a positive correlation (Figure 9). Correlation analysis of the DG group revealed a positive association of citric acid and phosphomycin in the sucrose preference test, a negative correlation of L-proline and thioctamide in the sucrose preference test and a negative association of phosphomycin in the EPM (Figure 10).
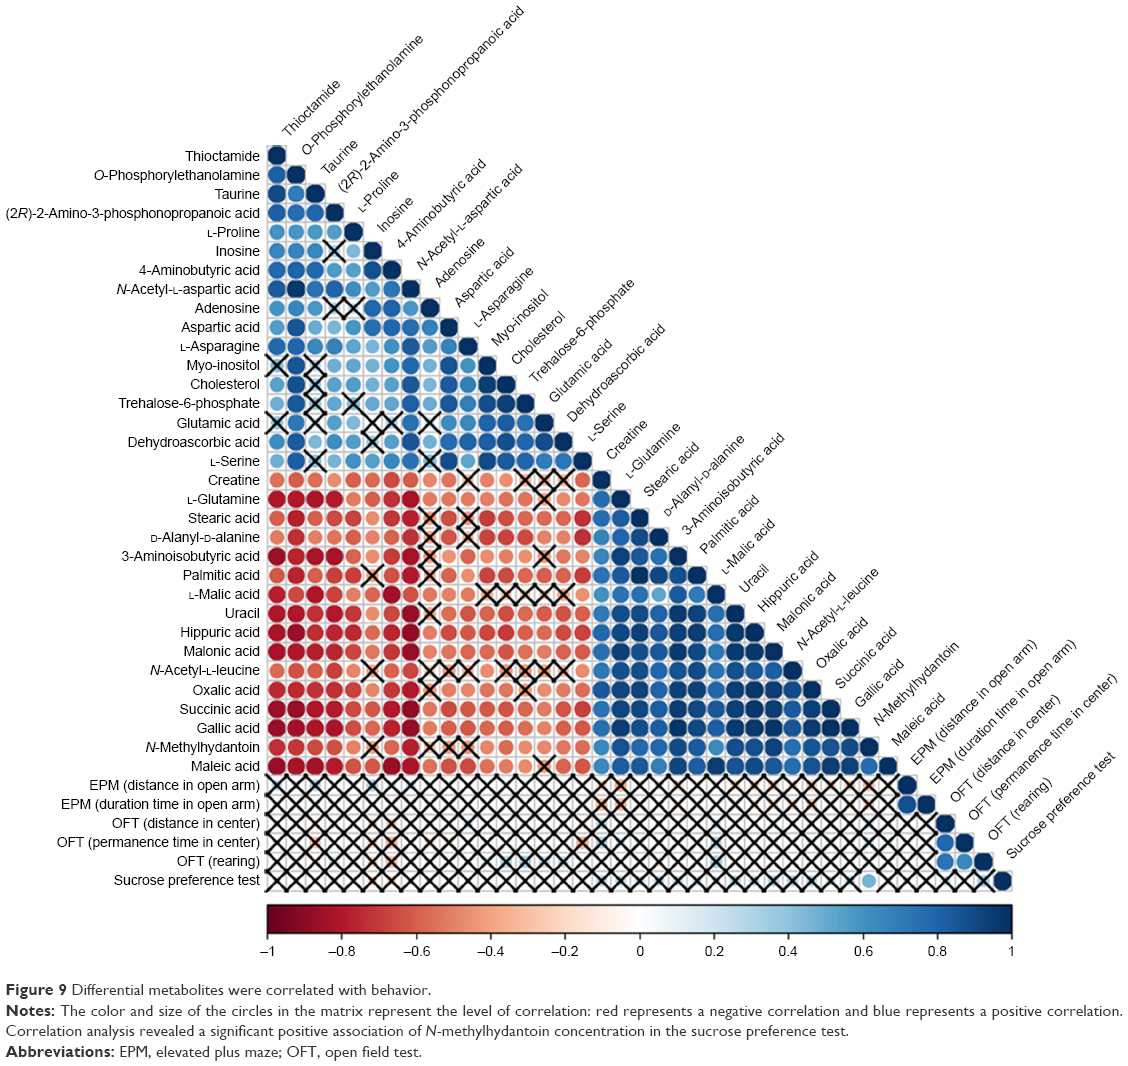 | Figure 9 Differential metabolites were correlated with behavior. |
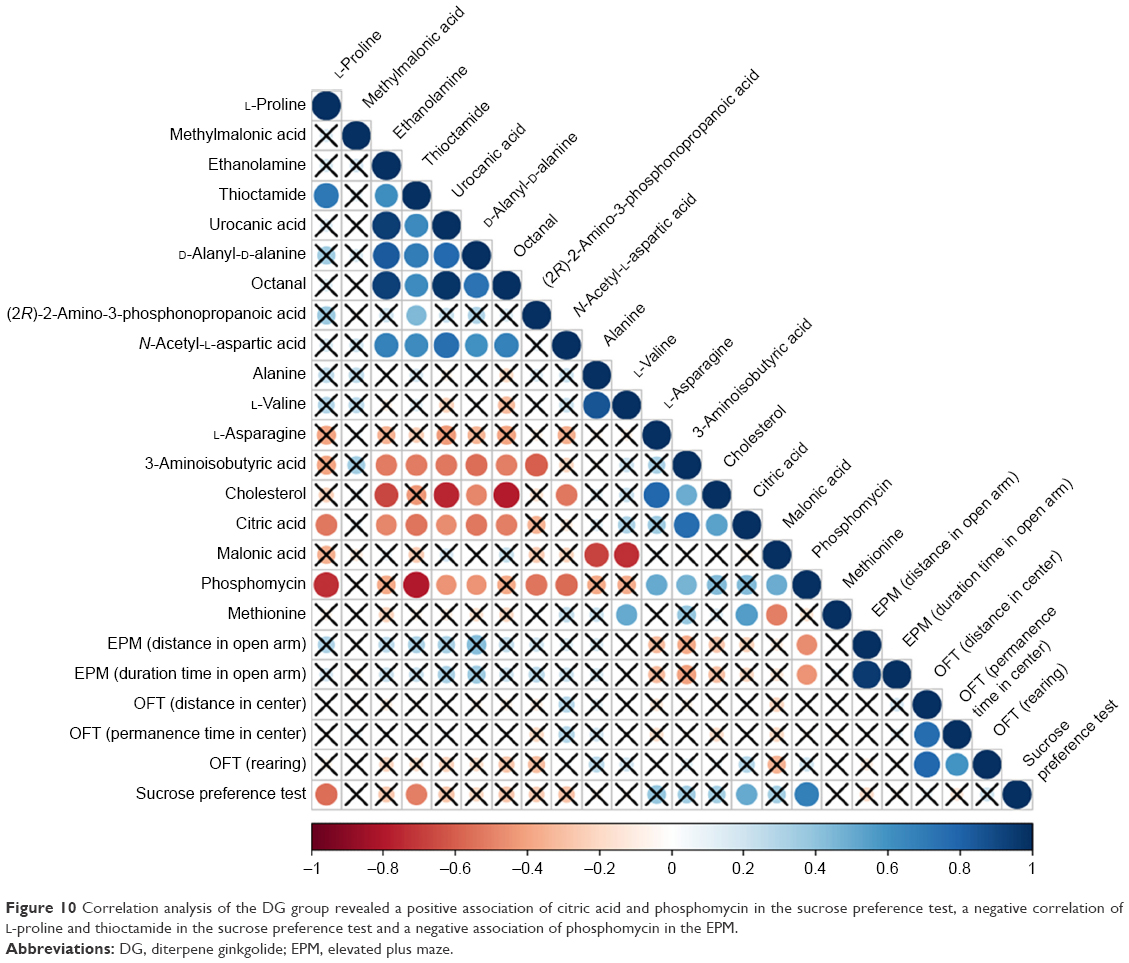 | Figure 10 Correlation analysis of the DG group revealed a positive association of citric acid and phosphomycin in the sucrose preference test, a negative correlation of L-proline and thioctamide in the sucrose preference test and a negative association of phosphomycin in the EPM. |
Discussion
Proton nuclear magnetic resonance, GC-MS and liquid chromatography–mass spectrometry are the main analytical platforms adopted in metabolomics studies, but proton nuclear magnetic resonance suffers from low sensitivity and may not detect metabolites with low abundance.38 In recent years, combinations of gas chromatography–quadrupole time-of-flight mass spectrometry and liquid chromatography–quadrupole time-of-flight mass spectrometry have been applied successfully in numerous metabolomics studies to achieve more sensitive and accurate metabolic profiling and screening of biomarkers.39 Gas chromatography–quadrupole time-of-flight mass spectrometry is a possible method that could be used for analyzing the metabolite changes and pathways.
DG-induced behavior change
Our previous studies on DG, using the sucrose preference test and the tail suspension test, revealed an antidepressant-like behavioral effect of the medicine. Our present findings are consistent with previous observations. However, there were no significant differences in the open field test or the EPM. Our findings revealed that DG improves depression-like behavior but does not exert an anxiolytic-like effect. Mice treated with venlafaxine exhibited little change in the open field and EPM tests, compared with the control or DG group. This is consistent with a previous study showing that venlafaxine does not ameliorate anxiety-like behavior in the EPM test.40
Amino acid metabolism
The differential amino acids included proline, thioctamide, urocanic acid, alanine, valine, asparagine, NAA, 3-aminoisobutyric acid and methionine. Among these metabolites, asparagine, 3-aminoisobutyric acid and methionine were upregulated. The other metabolites were decreased. The enzyme asparagine synthetase produces asparagine, adenosine monophosphate, glutamate and pyrophosphate from aspartate, glutamine and adenosine triphosphate. Glutamine’s major role in the brain is that of a precursor of the neurotransmitter amino acids: the excitatory amino acids, glutamate (Glu) and aspartate (Asp), and the inhibitory amino acid, γ-aminobutyric acid (GABA). It is reported to be decreased in models of depression.41 The increased concentration of asparagine suggests that asparagine synthetase is more active, which might increase glutamine and adenosine triphosphate levels. Moreover, NAA was decreased compared with the control group. NAA is a derivative of aspartic acid that is mainly stored in the neurons and can be used as an indicator or observation index in central nervous system diseases. Previous studies have shown that higher concentrations of NAA could be found in depressed rats,28,41 and antidepressants can downregulate its concentration. In the current study, NAA was also decreased in the venlafaxine group, consistent with previous findings. Therefore, the results indicated that DG can exert antidepressive effects. NAA may stimulate metabotropic glutamate receptors to affect neurons in CA3, which is one of the most vital regions of the hippocampus. Previous research in our laboratory suggested that the concentration of NAA and aspartic acid was lower in the hippocampus. The pathogenesis of depression is currently unclear, and the mechanisms underlying the action of antidepressants remain to be further elucidated. Some networks are known to operate between the hippocampus and PFC, and NAA may play a role in these networks when treating depression with antidepressants. All these require further research.42
As the raw material of GABA, alanine can regulate the excitability of neurons, and chronic treatment with alanine can have an antianxiety-like effect. In addition, alanine can inhibit oxidative stress to relieve the cortical spread of depression. However, in the current study, alanine was downregulated compared with the control group.
The differential metabolites (malonic acid and 3-aminoisobutyric acid) were upregulated compared with the control group after treatment with DG and venlafaxine. The downregulated differential metabolites were l-proline, NAA, thioctamide and (2R)-2-amino-3-phosphonopropanoic acid, and the alanine, aspartate and glutamate metabolism pathways showed significant effects. Aspartate and glutamate are the major neurotransmitters in the central nervous system, and the latter is the precursor of GABA. GABA is a crucial inhibitory transmitter; hence, a perturbation in GABA levels might lead to anxiety or depression. Clinical data suggest that the deficit of GABA can relate to anxiety and panic disorder.43 Therefore, the absence of alteration of GABA in our study suggests that even though DG has an antidepressant-like effect similar to venlafaxine,44,45 its anxiolytic-like effects remain to be discovered.
Energy metabolism
Citric acid is an intermediary substance in energy metabolism and can be found in all animal tissues. Previous studies demonstrated that chronic fluoxetine treatment can direct energy metabolism toward the citric acid cycle and oxidative phosphorylation.46 The results suggested that citric acid could improve the symptoms of depression. Citric acid can also act as an antioxidant to enhance the resistance to oxidative stress.47 Unopposed oxidative stress is linked to neurodegenerative diseases and depression.48 Thus, DG treatment may be beneficial for nervous system function. Furthermore, the correlation analysis of the DG group and behavior revealed that citric acid was significantly increased in the sucrose preference test. Thus, DG may exert antidepressant-like effects by changing the concentration of citric acid.
Lipid metabolism
Lipid metabolism is critical for numerous cell biologic processes, playing a key role in energy metabolism in specialized tissues, such as the liver and adipose tissue. It is also important for the hormonal and neurologic control of cell functions that affect gene expression and cell signaling.49 Previous studies by our research group identified a correlation between depression and lipid metabolism.31,50 Indeed, the IPA revealed that ethanolamine, which is correlated with lipid metabolism, was decreased. Ethanolamine can inhibit mitochondrial function and has been implicated in the pathophysiology of affective illnesses such as depression and bipolar disorder.51 Other research groups have also demonstrated that ethanolamine has direct inhibitory effects on the mitochondrial electron transfer chain and oxidative phosphorylation in vitro. These findings suggest a close relationship between mitochondrial dysfunction and altered phospholipid content in the brains of patients with depression and bipolar disorder.52 Therefore, DG may improve the symptoms of depression and bipolar disorder, at least in part, by altering lipid metabolism.
All of the metabolites included in energy metabolism were increased, while lipids were decreased. A number of previous studies have reported that depression is associated with changes in lipid levels, which can be altered by antidepressants.25,42,53,54 A previous study in our laboratory suggested that DG might inhibit lipid metabolism, thereby exerting an antidepressant effect.34
In addition to the differential metabolites previously identified in the hippocampus,34 we found that alanine and NAA were decreased in both the hippocampus and the PFC. In addition, asparagine was decreased and ethanolamine was increased in the hippocampus. However, opposite changes were observed in the PFC. Alanine is a precursor to glutamate, glutamine, β-alanine and GABA. These molecules play key roles in excitatory and inhibitory transmission in the brain.55 The opposite changes in ethanolamine and asparagine levels in the PFC and hippocampus suggest that these brain regions may show different responses to DG. Further studies are needed to clarify the differential effects of DG in the brain and to further elucidate the specific metabolite changes and pathways involved.
Conclusion
The current study revealed an antidepressant-like behavioral effect of DG in mice, but not an anxiolytic-like effect. The major metabolite changes were in amino acid metabolism, energy metabolism and lipid metabolism. Our findings indicated that DG improves the symptoms of depression, and that it might yield neuroprotective effect. However, clinical data have not yet been obtained, highlighting the need for further research into the use of DG for the treatment of depression and other mental illnesses.
Acknowledgments
This work was supported by the National Key R&D Program of China 2017YFA0505700 and the National Natural Science Foundation of China (grant nos 81401140 and 81371310).
Disclosure
The authors report no conflicts of interest in this work.
References
Zheng P, Zeng B, Zhou C, et al. Gut microbiome remodeling induces depressive-like behaviors through a pathway mediated by the host’s metabolism. Mol Psychiatry. 2016;21(6):786–796. | ||
Ng QX, Peters C, Ho CYX, Lim DY, Yeo WS. A meta-analysis of the use of probiotics to alleviate depressive symptoms. J Affect Disord. 2017;228:13–19. | ||
Ng QX, Venkatanarayanan N, Ho CY. Clinical use of hypericum perforatum (St John’s wort) in depression: a meta-analysis. J Affect Disord. 2017;210:211–221. | ||
Kirsch I, Deacon BJ, Huedo-Medina TB, Scoboria A, Moore TJ, Johnson BT. Initial severity and antidepressant benefits: a meta-analysis of data submitted to the food and drug administration. PLoS Med. 2008;5(2):e45. | ||
Jakobsen JC, Katakam KK, Schou A, et al. Selective serotonin reuptake inhibitors versus placebo in patients with major depressive disorder. A systematic review with meta-analysis and trial sequential analysis. BMC Psychiatry. 2017;17(1):58. | ||
Cai SQ, Wang X, Shang MY, Xu F, Liu GX. [“Efficacy yheory” may help to explain characteristic advantages of traditional Chinese medicines]. Zhongguo Zhong Yao Za Zhi. 2015;40(17):3435–3443. Chinese. | ||
Wong TW, Wong SL, Donnan SPB. Traditional Chinese medicine and Western medicine in Hong Kong: a comparison of the consultation processes and side effects. J Hong Kong Med Assoc. 1993;45(4):278–284. | ||
Itil T, Martorano D. Natural substances in psychiatry (Ginkgo biloba in dementia). Psychopharmacol Bull. 1995;31(1):147–158. | ||
Kleijnen J, Knipschild P. Ginkgo biloba. Lancet. 1992;340(8828):1136–1139. | ||
Yeh KY, Shou SS, Lin YX, Chen CC, Chiang CY, Yeh CY. Effect of Ginkgo biloba extract on lipopolysaccharide-induced anhedonic depressive-like behavior in male rats. Phytother Res. 2015;29(2):260–266. | ||
Zhao Y, Zhang Y, Pan F. The effects of EGb761 on lipopolysaccharide-induced depressive-like behaviour in C57BL/6J mice. Cent-Eur J Immunol. 2015;40(1):11–17. | ||
Ma S, Liu X, Xu Q, Zhang X. Transport of ginkgolides with different lipophilicities based on an hCMEC/D3 cell monolayer as a blood-brain barrier cell model. Life Sci. 2014;114(2):93–101. | ||
Rojas P, Serrano-Garcia N, Medina-Campos ON, Pedraza-Chaverri J, Ogren SO, Rojas C. Antidepressant-like effect of a Ginkgo biloba extract (EGb761) in the mouse forced swimming test: role of oxidative stress. Neurochem Int. 2011;59(5):628–636. | ||
Ma L, Wang S, Tai F, et al. Effects of bilobalide on anxiety, spatial learning, memory and levels of hippocampal glucocorticoid receptors in male Kunming mice. Phytomedicine. 2012;20(1):89–96. | ||
Ernst E. Harmless herbs? A review of the recent literature. Am J Med. 1998;104(2):170–178. | ||
Ernst E. Possible interactions between synthetic and herbal medicinal products. Part 2: a systematic review of the direct evidence. Perfusion. 2000;13(2):60–70. | ||
Ernst E. Professional’s handbook of complementary and alternative medicines. Focus Altern Complement Ther. 2000;5(1):56. | ||
DeFeudis FV. Ginkgo biloba Extract: Pharmacological Activities and Clinical Applications. Amsterdam: Elsevier; 1991. | ||
Maclennan KM, Darlington CL, Smith PF. The CNS effects of Ginkgo biloba extracts and ginkgolide B. Prog Neurobiol. 2002;67(3):235–257. | ||
Oberpichler H, Sauer D, Rossberg C, Mennel HD, Krieglstein J. PAF antagonist ginkgolide B reduces postischemic neuronal damage in rat brain hippocampus. J Cereb Blood Flow Metab. 1990;10(1):133–135. | ||
Liebgott T, Miollan M, Berchadsky Y, Drieu K, Culcasi M, Pietri S. Complementary cardioprotective effects of flavonoid metabolites and terpenoid constituents of Ginkgo biloba extract (EGb 761) during ischemia and reperfusion. Basic Res Cardiol. 2000;95(5):368–377. | ||
Cardinal RN, Parkinson JA, Hall J, Everitt BJ. Emotion and motivation: the role of the amygdala, ventral striatum, and prefrontal cortex. Neurosci Biobehav Rev. 2002;26(3):321–352. | ||
Murray EA, Wise SP. Interactions between orbital prefrontal cortex and amygdala: advanced cognition, learned responses and instinctive behaviors. Curr Opin Neurobiol. 2010;20(2):212–220. | ||
Wang Z, Li W, Chen J, et al. Proteomic analysis reveals energy metabolic dysfunction and neurogenesis in the prefrontal cortex of a lipopolysaccharide-induced mouse model of depression. Mol Med Rep. 2016;13(2):1813–1820. | ||
Zheng P, Chen JJ, Huang T, et al. A novel urinary metabolite signature for diagnosing major depressive disorder. J Proteome Res. 2013;12(12):5904–5911. | ||
Liu X, Zheng P, Zhao X, et al. Discovery and validation of plasma biomarkers for major depressive disorder classification based on liquid chromatography-mass spectrometry. J Proteome Res. 2015;14(5):2322–2330. | ||
Zhou X, Hetrick SE, Cuijpers P, et al. Comparative efficacy and acceptability of psychotherapies for depression in children and adolescents: a systematic review and network meta-analysis. World psychiatry. 2015;14(2):207–222. | ||
Chen G, Yang D, Yang Y, et al. Amino acid metabolic dysfunction revealed in the prefrontal cortex of a rat model of depression. Behav Brain Res. 2015;278:286–292. | ||
Liu L, Zhou X, Zhang Y, et al. The identification of metabolic disturbances in the prefrontal cortex of the chronic restraint stress rat model of depression. Behav Brain Res. 2016;305:148–156. | ||
Wang W, Guo H, Zhang SX, et al. Targeted metabolomic pathway analysis and validation revealed glutamatergic disorder in the prefrontal cortex among the chronic social defeat stress mice model of depression. J Proteome Res. 2016;15(10):3784–3792. | ||
Wu Y, Fu Y, Rao C, et al. Metabolomic analysis reveals metabolic disturbances in the prefrontal cortex of the lipopolysaccharide-induced mouse model of depression. Behav Brain Res. 2016;308:115–127. | ||
Yang Y, Yang D, Tang G, et al. Proteomics reveals energy and glutathione metabolic dysregulation in the prefrontal cortex of a rat model of depression. Neuroscience. 2013;247:191–200. | ||
Nicholson JK, Wilson ID. Opinion: understanding “global” systems biology: metabonomics and the continuum of metabolism. Nat Rev Drug Discov. 2003;2(8):668–676. | ||
Liang Z, Bai S, Shen P, et al. GC-MS-based metabolomic study on the antidepressant-like effects of diterpene ginkgolides in mouse hippocampus. Behav Brain Res. 2016;314:116–124. | ||
Luedemann A, Strassburg K, Erban A, Kopka J. TagFinder for the quantitative analysis of gas chromatography-mass spectrometry (GC-MS)-based metabolite profiling experiments. Bioinformatics. 2008;24(5):732–737. | ||
Mayburd AL, Martlinez A, Sackett D, et al. Ingenuity network-assisted transcription profiling: identification of a new pharmacologic mechanism for MK886. Clin Cancer Res. 2006;12(6):1820–1827. | ||
Xia J, Sinelnikov IV, Han B, Wishart DS. MetaboAnalyst 3.0-making metabolomics more meaningful. Nucleic Acids Res. 2015;43(W1):W251–W257. | ||
Ong ES, Cui FC, Zou L, Ong CN. A multi-analytical approach for metabolomic profiling of zebrafish (Danio rerio) livers. Mol Biosyst. 2009;5(3):288–298. | ||
Zhang B, Zhang H, Du C, et al. Metabolic responses of the growing Daphnia similis to chronic AgNPs exposure as revealed by GC-Q-TOF/MS and LC-Q-TOF/MS. Water Res. 2017;114:135–143. | ||
Lapmanee S, Charoenphandhu J, Charoenphandhu N. Beneficial effects of fluoxetine, reboxetine, venlafaxine, and voluntary running exercise in stressed male rats with anxiety- and depression-like behaviors. Behav Brain Res. 2013;250:316–325. | ||
Ni Y, Su M, Lin J, et al. Metabolic profiling reveals disorder of amino acid metabolism in four brain regions from a rat model of chronic unpredictable mild stress. FEBS Lett. 2008;582(17):2627–2636. | ||
Bai S, Zhou C, Cheng P, et al. 1H NMR-based metabolic profiling reveals the effects of fluoxetine on lipid and amino acid metabolism in astrocytes. Int J Mol Sci. 2015;16(4):8490–8504. | ||
Goddard AW. Cortical and subcortical gamma amino acid butyric acid deficits in anxiety and stress disorders: clinical implications. World J Psychiatry. 2016;6(1):43–53. | ||
Gonzalez-Burgos G, Lewis DA. GABA neurons and the mechanisms of network oscillations: implications for understanding cortical dysfunction in schizophrenia. Schizophr Bull. 2008;34(5):944–961. | ||
Rawls SM, Gomez T, Stagliano GW, Raffa RB. Measurement of glutamate and aspartate in Planaria. J Pharmacol Toxicol Methods. 2006;53(3):291–295. | ||
Filipovic D, Costina V, Peric I, Stanisavljevic A, Findeisen P. Chronic fluoxetine treatment directs energy metabolism towards the citric acid cycle and oxidative phosphorylation in rat hippocampal nonsynaptic mitochondria. Brain Res. 2017;1659:41–54. | ||
Abdel-Salam OM, Youness ER, Mohammed NA, Morsy SM, Omara EA, Sleem AA. Citric acid effects on brain and liver oxidative stress in lipopolysaccharide-treated mice. J Med Food. 2014;17(5):588–598. | ||
Ng QX, Koh SSH, Chan HW, Ho CYX. Clinical use of curcumin in depression: a meta-analysis. J Am Med Dir Assoc. 2017;18(6):503–508. | ||
Wang SP, Yang H, Wu JW, Gauthier N, Fukao T, Mitchell GA. Metabolism as a tool for understanding human brain evolution: lipid energy metabolism as an example. J Hum Evol. 2014;77:41–49. | ||
Wu Y, Tang J, Zhou C, et al. Quantitative proteomics analysis of the liver reveals immune regulation and lipid metabolism dysregulation in a mouse model of depression. Behav Brain Res. 2016;311:330–339. | ||
Kato T, Kato N. Mitochondrial dysfunction in bipolar disorder. Bipolar Disord. 2000;2(3 Pt 1):180–190. | ||
Modica-Napolitano JS, Renshaw PF. Ethanolamine and phosphoethanolamine inhibit mitochondrial function in vitro: implications for mitochondrial dysfunction hypothesis in depression and bipolar disorder. Biol Psychiatry. 2004;55(3):273–277. | ||
Bilici M, Efe H, Koroglu MA, Uydu HA, Bekaroglu M, Deger O. Antioxidative enzyme activities and lipid peroxidation in major depression: alterations by antidepressant treatments. J Affect Disord. 2001;64(1):43–51. | ||
Maes M, Smith R, Christophe A, et al. Lower serum high-density lipoprotein cholesterol (HDL-C) in major depression and in depressed men with serious suicidal attempts: relationship with immune-inflammatory markers. Acta Psychiatr Scand. 1997;95(3):212–221. | ||
Francisco Eda S, Guedes RC. Neonatal taurine and alanine modulate anxiety-like behavior and decelerate cortical spreading depression in rats previously suckled under different litter sizes. AminoAacids. 2015;47(11):2437–2445. | ||
Krämer A, Green J, Pollard J Jr, et al. Causal analysis approaches in Ingenuity Pathway Analysis. Bioinformatics. 2014;30(4):523–530. | ||
Hashimoto K, Goto S, Kawano S, et al. KEGG as a glycome informatics resource. Glycobiology. 2006;16(5):63R–70R. |
 © 2018 The Author(s). This work is published and licensed by Dove Medical Press Limited. The full terms of this license are available at https://www.dovepress.com/terms.php and incorporate the Creative Commons Attribution - Non Commercial (unported, v3.0) License.
By accessing the work you hereby accept the Terms. Non-commercial uses of the work are permitted without any further permission from Dove Medical Press Limited, provided the work is properly attributed. For permission for commercial use of this work, please see paragraphs 4.2 and 5 of our Terms.
© 2018 The Author(s). This work is published and licensed by Dove Medical Press Limited. The full terms of this license are available at https://www.dovepress.com/terms.php and incorporate the Creative Commons Attribution - Non Commercial (unported, v3.0) License.
By accessing the work you hereby accept the Terms. Non-commercial uses of the work are permitted without any further permission from Dove Medical Press Limited, provided the work is properly attributed. For permission for commercial use of this work, please see paragraphs 4.2 and 5 of our Terms.