")
Back to Journals » Vascular Health and Risk Management » Volume 16
Metabolite Profiling of Osteoporosis and Atherosclerosis in Postmenopausal Women: A Cross-Sectional Study
Authors Värri M , Niskanen L , Tuomainen TP, Honkanen R, Kröger H, Tuppurainen MT
Received 30 August 2020
Accepted for publication 19 November 2020
Published 2 December 2020 Volume 2020:16 Pages 515—524
DOI https://doi.org/10.2147/VHRM.S279028
Checked for plagiarism Yes
Review by Single anonymous peer review
Peer reviewer comments 2
Editor who approved publication: Dr Takashi Kajiya
Miika Värri,1 Leo Niskanen,2 Tomi-Pekka Tuomainen,3 Risto Honkanen,1,4 Heikki Kröger,1,5 Marjo T Tuppurainen1,6
1Kuopio Musculoskeletal Research Unit (KMRU), Surgery, Institute of Clinical Medicine, University of Eastern Finland, Kuopio, Finland; 2Department of Endocrinology and Metabolism, Abdominal Centre, Helsinki University Hospital, Universities of Helsinki and Eastern Finland, Helsinki, Finland; 3Institute of Public Health and Clinical Nutrition, University of Eastern Finland, Kuopio, Finland; 4Lapland Hospital District, Rovaniemi, Finland; 5Department of Orthopaedics, Traumatology and Hand Surgery, Kuopio University Hospital, Kuopio, Finland; 6Department of Obstetrics and Gynaecology, Kuopio University Hospital, Kuopio, Finland
Correspondence: Miika Värri
Kuopio Musculoskeletal Research Unit (KMRU), Surgery, Institute of Clinical Medicine, University of Eastern Finland, P.O. Box 1627, Kuopio FI-70211, Finland
Tel +358503655083
Fax +358 17 172 611
Email [email protected]
Purpose: Atherosclerosis (AS) and osteoporosis (OP) are common causes of morbidity and mortality in postmenopausal women and are connected via an unknown mechanistic link. Metabolite profiling of blood samples may allow the identification of new biomarkers and pathways for this enigmatic association.
Patients and Methods: We studied the difference in 148 metabolite levels from serum samples in postmenopausal women with AS and OP compared with those in healthy participants in this cross-sectional study. Quantitative AS was assessed by carotid artery intima-media thickness (cIMT) and carotid artery calcifications (CACs) by ultrasound, as well as OP by femoral neck (FN) bone mineral density (BMD) and 148 metabolic measures with high-throughput proton (1H) nuclear magnetic resonance (NMR) in serum samples from 280 postmenopausal (PM) women. Subjects were a randomly selected subsample from the population-based Kuopio Osteoporosis Risk Factor and Prevention (OSTPRE) study. The final study population included the following groups: OP with CAC (n=16, group I), non-OP with no CAC (n=59, group II), high cIMT tertile with OP (n=11, group III) and low cIMT tertile without OP (n=48, group IV).
Results: There were differences in several metabolite levels between groups I and II. The acetate level was lower in group I compared to that in group II (group I mean ± SD: 0.033 ± 0.0070; group II: 0.041 ± 0.014, CI95%: 0.018‒0.15, p=0.014). The result was similar with diacylglycerol (p=0.002), leucine (p=0.031), valine (p=0.022) and several very low-density lipoprotein (VLDL) metabolite levels, which were lower in group I compared to those in group II. However, no associations were found in adjusted analyses with total body (TB) fat mass (FM), age and statin use (p> 0.05).
Conclusion: Our novel study found differences in the metabolite profiling of altered amino acid and lipoprotein metabolism in participants with OP and AS compared with those in healthy women. The causative mechanisms remain unknown and further studies are needed.
Keywords: metabolomics, carotid artery calcification, postmenopausal women, osteoporosis, carotid intima-media thickness, acetate
Introduction
Previously, low bone mineral density (BMD) has been shown to be an independent predictor of the development of atherosclerosis (AS) in elderly individuals.1–3 The underlying mechanisms are unknown, but indirect associations via genetics or the environment have been suggested.4
Metabolic profiling of serum samples is possible by nuclear magnetic resonance (NMR) spectrometry, which is a novel technology for the profiling of small molecules (metabolites) and proteins.5 NMR offers multifaceted approaches to detect and identify a variety of metabolites and accurately measure their concentrations.6 The application of metabolomics in osteoporosis (OP) could provide researchers the opportunity to gain new insight into the metabolic profiling and pathophysiological mechanisms.
Differences in plasma lipid levels or their modifications, such as oxidation, have been suggested as a link between BMD and AS.4,7 In previous studies with mice, the oxidized lipids inhibited the differentiation of osteoblasts.8 On the other hand, oxidized low-density lipoprotein (OxLDL) particles were phagocyted much faster in macrophages than in non-OxLDL particles and OxLDLs are known to be present in plasma in AS, both in human and animal models.9 Although these findings have not been confirmed in all studies and the role of antioxidants is controversial, especially in preventing AS.9–11
Considering the other lipid particles, subjects with low BMD showed higher high-density lipoprotein (HDL) cholesterol levels in the Asian population.12,13 In general, HDL protects against the development of AS by enhancing reverse cholesterol removal.10,14 Elevated LDL cholesterol levels are causally related to the development of AS,9 and elevated LDL cholesterol levels have been associated, albeit weakly, with lower BMD.7 However, contrasting results have also been shown.15 Furthermore, qualitative changes in LDL particles, such as oxidation, promote osteoporotic bone loss by directing progenitor marrow mesenchymal stromal cells to differentiate into adipogenic lineages instead of osteogenic differentiation, in line with “the lipid hypothesis of osteoporosis”.16 In previous population-based studies, metabolite profiling, including lipid profiling, has found new biomarkers beyond conventional cardiovascular disease (CVD) risk markers,17 and similar biomarker associations with BMD have also been found.18 In previous studies, monounsaturated fatty acids (MUFA) and phenylalanine have been associated with a higher risk for CVD events,17 and CYP3A5 and SULT2A1 genetic loci were found to be important in the regulation of metabolites causing OP.18
In relation to our subject, a few studies have compared metabolic profiles between osteoporotic and normal BMD populations; these have suggested differences between the groups.19,20 For example, the dipeptide Gly-Gly and cysteine levels were significantly lower in the low BMD group compared to those in the normal BMD group in Japanese women aged between 39 and 64, but BMD was assessed with ultrasound.19
We have previously shown that postmenopausal (PM) osteoporotic women have more carotid artery calcifications (CACs) compared to those in PM women with normal BMD.2 Our aim was to study the differences in 148 metabolite levels between women with OP and AS compared with those in healthy PM women without these ailments in this cross-sectional study.
Patients and Methods
Population
This Kuopio Osteoporosis Risk Factor and Prevention-Bone, Brain, and Atherosclerosis (OSTPRE-BBA) study was performed to study the associations between brain function, bone and adiposity in 458 randomly selected PM women from the original OSTPRE study population. This study population is a random subsample from the original OSTPRE study cohort (n=14,220). The final study sample (n=280) included women who participated in carotid ultrasound measurements (2009), BMD measurements (2009–2011) and gave a blood sample (2009) for the NMR analyses (2014). In total, 168 women were excluded, because they did not attend either ultrasound or DXA measurement, and 10 serum samples were excluded for a number of reasons in metabolomics sampling quality checks (2014); five of the samples were missing, three samples had high ethanol levels due to the sampling process, one sample had a low protein level, and one sample had a quality problem. The population selection process was previously described in detail2 and is shown in Figure 1.
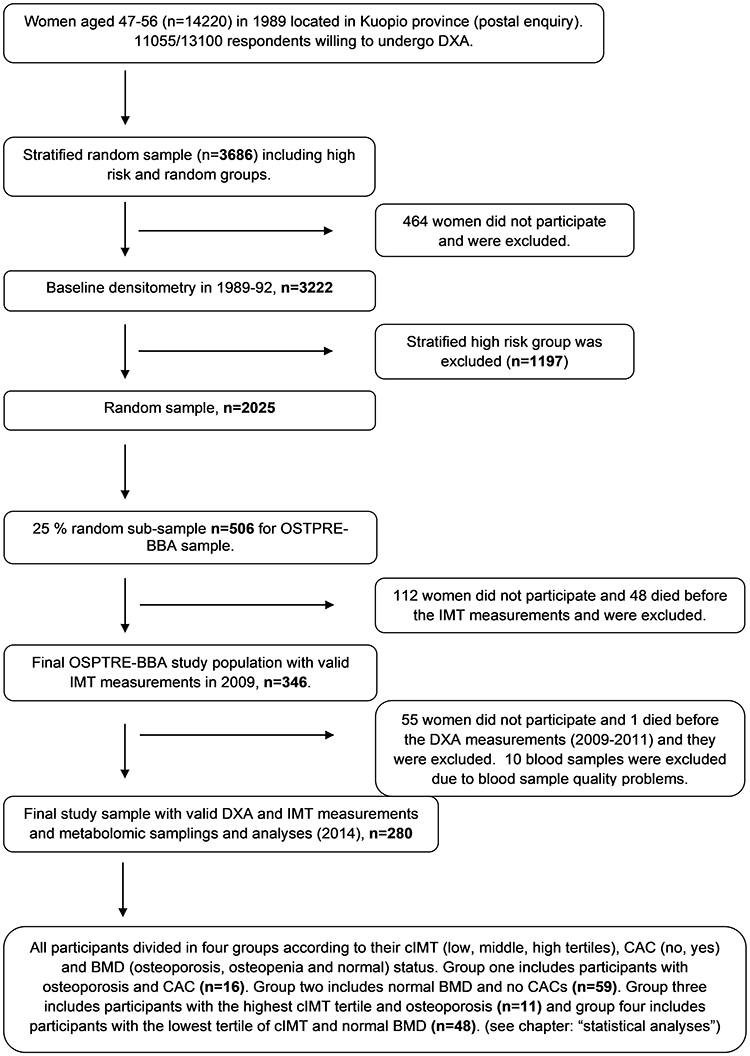 |
Figure 1 Population selection process. |
All participants provided informed written consent. The North Savo Health Care District Ethics Committee approved this study (number 112/2009), and the study complies with the Declaration of Helsinki.
Carotid Ultrasound and Carotid Intima-Media Thickness (cIMT) Measurements
Carotid ultrasound and cIMT measurements were carried out on 346 OSTPRE-BBA participants in 2009 at the Kuopio Musculoskeletal Research Unit (KMRU) at the University of Eastern Finland, Kuopio, using the Technos MP ESAOTE ultrasound device (Esaote, Italy) with a B-type linear transducer at a frequency of 9 MHz. IMT was measured over a 1 cm long segment from the distal common carotid artery (CCA) just before the bifurcation, as described previously.2
Two IMT measurements were established and used herein: CAC and the maximum cIMT. CACs were categorized into two different groups: the presence or absence of calcifications. The maximum cIMT variable was formed from the highest cIMTs in both carotid arteries (the average of both). It was used to demonstrate the highest protrusion in the lumen and quantitative AS.
BMD and Body Composition
Total body (TB) fat mass (FM) (kg) and femoral neck (FN) BMD (g/cm2) were measured using DXA in 2009–2011 for 290 participants whose cIMTs were measured previously.2 Measurements were carried out by trained personnel at the University of Eastern Finland, KMRU, using the General Electric Lunar Prodigy DXA device (Madison, WI, USA).
Blood Sampling and NMR Spectrometry
All blood samples were overnight fasting samples. Samples were taken at local health-care centers in 2009 and frozen at −80°C. The final number of analyzed serum samples was 280. A total of 10 blood samples were excluded for a number of reasons; the ethanol level was high in three samples due to the sampling process, the protein level was low in one sample, one sample had a quality problem and five of the samples were missing.
A high-throughput proton (1H) NMR spectrometry metabolomics platform was used at the University of Eastern Finland in 2014 to quantify up to 148 metabolic phenotypes from serum samples that represent systemic metabolism.6 The measured samples included multiple metabolic variables, including lipoprotein lipids and subclasses, fatty acids and fatty acid compositions, amino acids and glycolysis precursors. Briefly, in NMR spectroscopy, each molecule containing hydrogen atoms gives a specific signal in a magnetic field and the concentration and composition of the molecule can be quantified through these signals.21
First, the frozen samples were handled in plates, which included quality control samples. Control samples were used as a technical reference to monitor the performance of the automated liquid handler and spectrometer and to monitor the consistency of quantifications. A sodium phosphate buffer (75 mmol/L Na2HPO4 in 80%/20% H2O/D2O, pH 7.4; also including 0.08% sodium 3-(trimethylsilyl)propionate-2,2,3,3-d4 and 0.04% sodium azide) was mixed into the sample before the NMR measurements (260 μL of serum and 260 μL of a buffer). The PerkinElmer JANUS Automated Workstation was used to handle the samples. Bruker AVANCE III 500 MHz and Bruker AVANCE III HD 600 MHz spectrometers were used for NMR metabolomics laboratory setup. The data were collected automatically with the 600 MHz or the 500 MHz spectrometer. Standardized parameters were used for data acquisitions. After these measurements, the same samples went through a standardized lipid extraction procedure based on extraction steps. The extraction procedure was done manually using an Integra Biosciences VIAFLO 96 channel electronic pipette. The lipid extracts were moved into the NMR tubes and the extracted lipid data were collected with the 600 MHz instrument using a standard parameter set. The raw data processing was done automatically, and it included overall signal check for missing/extra peaks, baseline removal, spectral area-specific signal alignments and background control. For the raw data that passed all the quality control steps, regression modelling was performed to produce the actual molecular data. In addition, the individual metabolic measurements underwent various statistical quality control phases. After quality control, the metabolomic data were formed.21
In this data, all of the lipid particles (very low-density lipoprotein [VLDL], intermediate-density lipoprotein [IDL], LDL, and HDL) were grouped according to size (extremely large and chylomicrons, large, medium, small, and extra small). In addition, concentration, total cholesterol, cholesterol esters, free cholesterol, triglycerides, total lipids and phospholipids were separately grouped according to the size of the lipid particles. The currently applied NMR-based metabolic profiling has been used in various recent epidemiological and genetic studies; the method and process used in this study were previously described in detail.6,21 Batch effect was minimized by quality checks during the sample analysis and using linear models in statistical analyses (see statistical analyses section).
The full metabolite list is provided in Supplementary Table 1.
Other Variables
Weight and height were measured in connection with the DXA densitometry. The body mass index (BMI) was calculated as body weight/height2 (kg/m2). Current smoking habits (no/yes), physical exercise with shortness of breath (hours in a week) and medications were based on a postal enquiry in 2009, with the question on chronic health disorders being verified by a physician.
Statistical Analyses
Values are expressed as the percentage or mean ± SD. The Kolmogorov–Smirnoff test or histogram inspections were used to ensure the normality of the variables. All of the participants (n=280) were divided into the groups according to their cIMT (low, middle, or high tertiles), CAC (no, yes) and T-score (OP, osteopenia and normal) status. Group I included participants with OP (FN BMD, T-score ≤-2.5 SD) and CAC (n=16); group II included participants with normal T-scores and no CAC (n=59), so it was used as a control group; group III (n=11) included participants with the highest cIMT tertiles and OP; and group IV (n=48) included participants with the lowest cIMT tertiles and normal T-scores, so it was used as a control group. All other groups were excluded. Student’s t-test was used to study the differences in metabolite levels between groups I–II and III–IV, respectively. Similar analysis models were applied in univariate analysis using metabolite levels as a dependent variable and the dichotomic group I–II or III–IV variable as an independent variable, adjusted by age (years), TB FM (kg) and statin use (no/yes). Adjusted analyses were undertaken if p<0.10. The false discovery rate (FDR) was used to control for false-positive errors when a high number of analyses were performed. p<0.05 was considered statistically significant.
Results
The mean age of the study population was 73.6 ± 2.8 years. Overall, 23.6% of women were obese (BMI >30 kg/m2) and 3.6% of women were current smokers. CACs were found in 168 (60%) cases. Regarding the use of drugs, 6.1% of patients used OP medication, 4.6% used inhaled corticosteroids and 1.7% used corticosteroids orally. The FM and BMI were significantly lower in groups I and III compared to those in groups II and IV (Table 1).
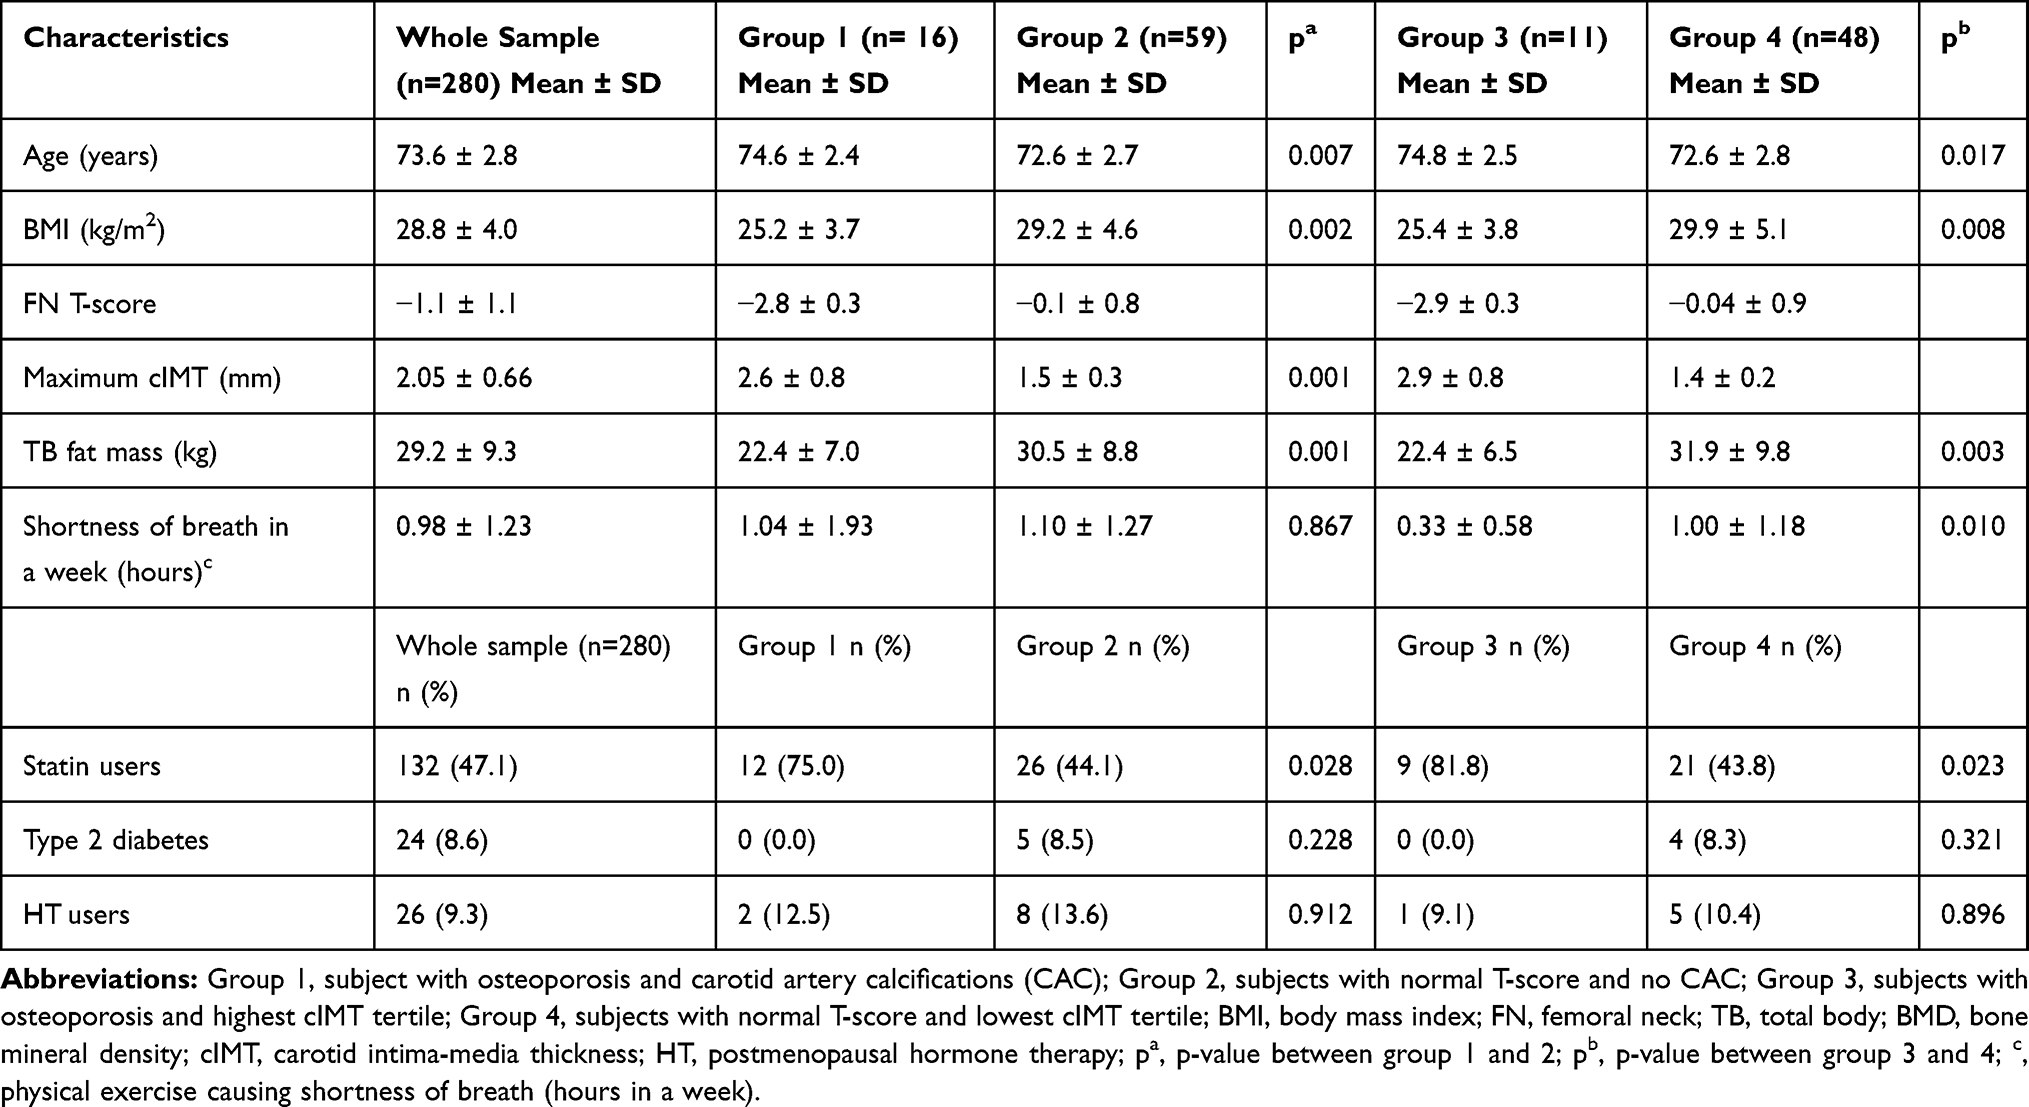 |
Table 1 Characteristics of the Study Population and the Subgroups |
Metabolomic Distinction Between BMD and CAC
The differences in metabolite levels between the osteoporotic subjects with CAC (group I, n=16) compared to those with normal T-scores and no CAC (group II, n=59) are shown in Figure 2. In group 1, the metabolite levels were significantly lower in the majority of the VLDL particles measured and diacylglycerol, apolipoprotein B (APOB), leucine, valine and acetate levels (p<0.05). All of the associations vanished after adjustments (Figure 2). In addition, there were no differences in the ratio of phenylalanine to tyrosine between the groups (p>0.05).
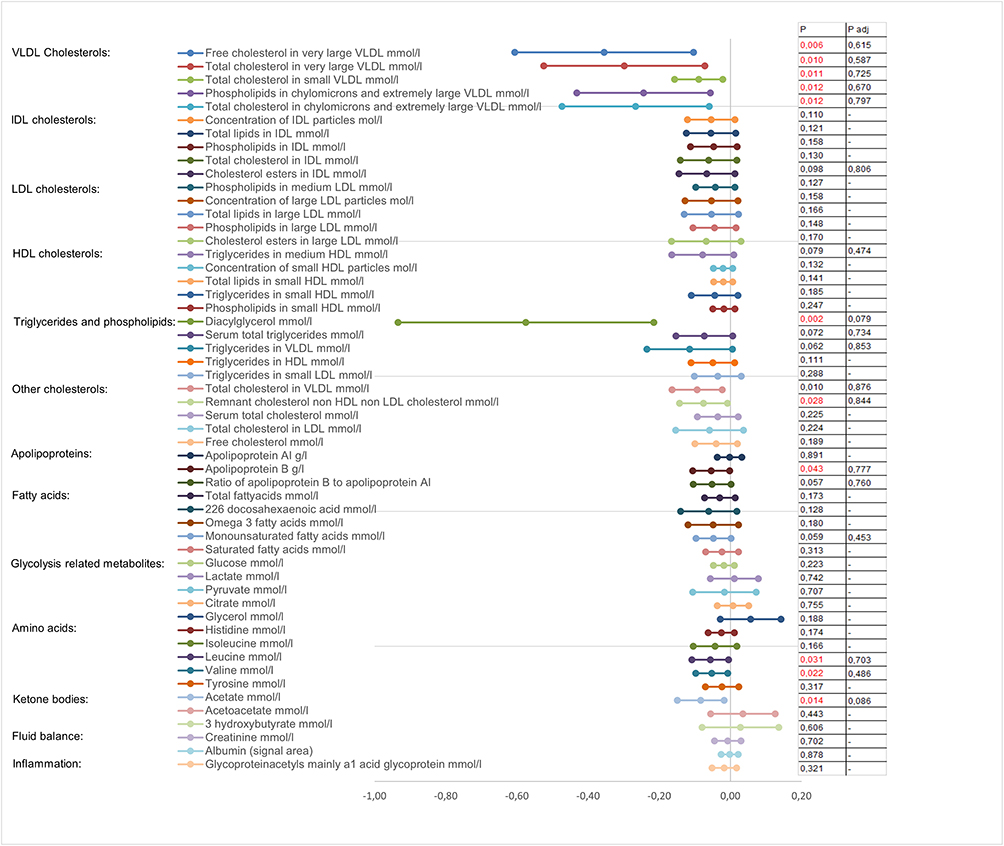 |
Figure 2 The differences in metabolomics between group I and group II. Notes: The mean difference in the 95% confidence intervals between group I (n=16, osteoporosis with CACs) and group II (n=59, normal T-score and no CACs). Group II was used as a reference group. Only the five most remarkable variables (p-values) from each metabolic group are shown in the figure. Logarithm modifications were made to ensure the variables had normal distributions. P-values indicated with red color were statistically significant. P = p-value; adj = adjusted with age, total body fat mass and statin use. |
Metabolomic Distinction Between BMD and cIMT
When the high cIMT tertile and OP group (group III, n=11) was compared with the low cIMT tertile and normal BMD group (group IV, n=48), only free cholesterol in very large VLDL and diacylglycerol and acetate levels were slightly lower in group III (p<0.05). All associations vanished after adjustments for age, TB FM and statin use. In addition, there were no differences in the ratio of phenylalanine to tyrosine between the groups (p>0.05). The exact results are shown in Figure 3.
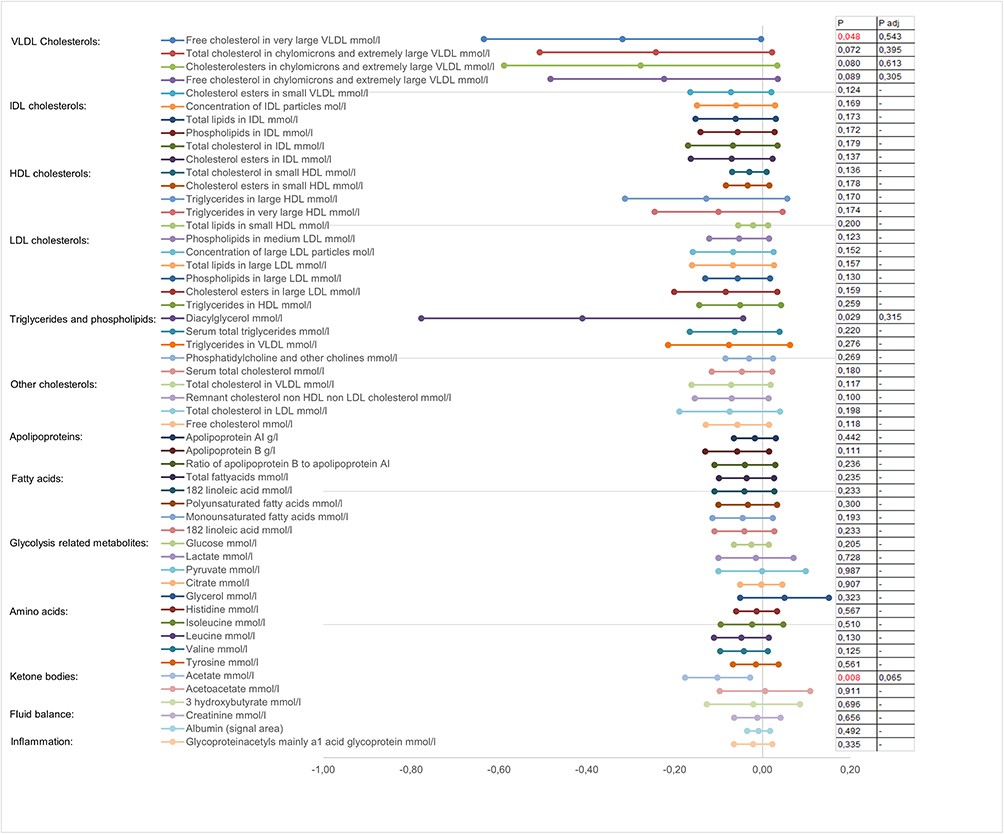 |
Figure 3 The differences in metabolomics between group III and group IV. Notes: The mean difference with the 95% confidence intervals between group III (n=11, osteoporosis with highest CIMT tertile) and group IV (n=48, normal T-score and low CIMT). Group IV was used as a reference group. Only the five most remarkable variables (p-values) from each metabolic group are shown in the figure. Logarithm modifications were made to ensure variables normal distributions. P-values indicated with red color were statistically significant. P = p-value; adj = adjusted with age, total body fat mass and statin use. |
False discovery rate (FDR) analyses were performed for all metabolic variables, but no associations were found (data not shown).
We noticed that levels of alanine, glutamine and lactate were slightly higher and the levels of histidine, acetate and acetoacetate were lower in our study sample compared to those in the larger OSTPRE populations.
Supplementary Table 1 shows all the numerical metabolite levels in groups I to IV.
Discussion
To the best of our knowledge, this is the first study to compare metabolic profiles between the well-established markers of AS and OP derived from a population-based study on PM women. With NMR, we were able to verify almost 150 lipid subclasses and amino acids and study the possible associations between amino acid and lipoprotein metabolite levels between women with a presence of CAC, high cIMT and low BMD compared to those in healthy women.
The methods used in this study, including DXA,22 carotid ultrasound,23 and NMR,21 are widely used methods to measure BMD, cIMT and metabolite profile. NMR is not the most sensitive method for metabolite detection when compared with that of mass spectrometry. The measurement time is only a few minutes but is sufficient to quantitatively capture analyses from a serum sample.21
We have previously shown that subjects with OP have more CACs than subjects without OP.2 It has been shown that elevated LDL and low HDL levels are associated with arterial calcifications.24 As shown by our results, several VLDL particle subgroup levels were significantly lower in the OP and CAC group, but no differences were found with other cholesterol particles, including IDL, LDL and VLDL subclasses. Previously, VLDL has been positively associated with CAC in patients with diabetes,25 which is a result the opposite of ours, but the number of diabetics in our study was small. On the contrary, in the previous study of Turkish PM women, VLDL was not associated with vertebral fracture or OP.26 In our study, associations were found with the CAC groups only but not with the high cIMT group. This suggests that VLDL may reflect the link between bone loss and vascular calcifications. Lipid metabolism may be accelerated in subjects with CAC and OP compared with that in the healthy group, which could explain the low VLDL particle levels. However, adjustments with the use of statins weakened the association in our study, which may be due to the effects of statins on lipoprotein metabolism.
Other lipid particles, such as APOB, have been previously associated with AS27,28 and predicted cardiovascular events in a 15-year follow-up study.17 Subjects carrying the mutations for a familial deficiency or distorted function of APOB-100 have been shown to have low BMD.28 These subjects have high LDL levels27 and obviously enhanced AS. However, independent associations between LDL and BMD have also been shown.28 An APOB-100 genetic deficiency has also been associated with coronary artery calcifications,27 which is in line with our results considering CACs.
From the less well-studied biomarkers, amino acids and other metabolites, such as acetate, valine, leucine and diacylglycerol levels, were lower in the CAC and OP group than those in the healthy group. This pattern could represent a new metabolic pathway between OP and CAC. Previously, higher leucine and valine dietary intakes have been associated with low BMD in spinal cord injury subjects,29 in contrast with our results. Thus, nutrition may explain this discrepancy. Short-term overfeeding seems to correlate positively with plasma levels of valine, leucine, phenylalanine and tyrosine,30 but it is not known how well the dietary patterns reflect the measured amino acid levels.
In previous population-based studies, metabolites have been associated with cardiovascular disease (CVD) risk.17 For example, phenylalanine was associated with a higher risk of CVD events at a younger age in the FINRISK study,17 while phenylalanine showed a strong association with death from coronary heart disease, but not with stroke, in a meta-analysis.17 Our results showed no differences in phenylalanine levels between different CAC and BMD groups, but this does not mean that they would not be predictive factors during the follow-up. The FINRISK study also showed that tyrosine, lactate and pyruvate were associated with higher CVD risk and that citrate was protective in this regard,17 but we did not find any differences between the BMD and CAC groups considering these amino acids. In addition, we did not find any differences in the ratio of phenylalanine to tyrosine, which is in line with the FINRISK follow-up study.17 The ratio of phenylalanine to tyrosine has been suggested to describe phenylalanine hydroxylase activity, which has been previously associated with coronary artery disease.31 In a previous study, the acetate level was higher in patients with coronary stenosis and artery microvascular changes than in controls, although the number of participants was low (n=32).32 Previously, a high acetate level was thought to be a slightly protective factor for CVD events,17 and in our study, the acetate levels were lower in the OP with CAC group. However, one confounding factor may be the high level of statin use, which was very common in this population, particularly in group I with OP and CAC. Nevertheless, the acetate level increases with the HMG-CoA enzyme inhibition by statins, because acetate is used in the early steps of cholesterol formation.33
Considering the BMD, cIMT and metabolomics, it has been previously shown that an atherosclerotic lipid profile (high LDL cholesterol) is associated with low BMD.7 However, a Korean study with 4613 premenopausal and 2661 PM women showed no association with BMD and LDL or HDL.12 It is well known that cIMT is a well-established marker of both carotid and coronary AS, and it is therefore obvious that high LDL and low HDL levels have been associated with high cIMT or predict its progression.24,34 However, there were no differences in the lipid profiles between the cIMT and BMD groups. A confounding factor may be related to the long-term use of statins. The current use of statins is quite high in groups with AS and probably impacts on the results. Statins decrease LDL cholesterol levels while increasing HDL cholesterol and lowering triglycerides to a lesser extent; they may also increase BMD, as shown in a recently widely published epidemiological study.35
In our study, the amount of physical exercise was much lower in the cIMT and OP group than that in the healthy group, but no difference was found between the CAC groups. These data could be in line with the preventive effects of physical activity on AS and OP36 or because subjects with these disorders do not engage in exercise. On the other hand, physical activity may affect CAC and OP via mechanisms other than weight-bearing loading and cardiorespiratory fitness. To support this, no differences were previously found between physical exercise and coronary artery calcium score, but the prevalence of coronary artery disease was still higher in the inactive group compared to that in the active group.37
There were a few limitations of our study. First, the subjects of this study were elderly women forming part of the OSTPRE study, which is a representative population-based sample. The final study sample (n=280) consisted of a small part of the original OSTPRE study cohort (n=14,220), so the risk of selection bias should be considered. Regarding this issue, we have previously shown that the main data variables (FN, BMD and BMI) do not differ from the original OSTPRE study sample 2. Second, the small number of participants decreased the power of the study findings and may have also caused abnormal statistical variations. Third, the high number of variables highlights the statistical coincidences and increases the FDR. Fourth, the cross-sectional design may reveal associations but is not indicative of causality. Fifth, we acknowledge the lack of dietary information. Finally, the study was carried out in Finnish PM women, so generalization to other ethnic groups will require verification.
Conclusion
In conclusion, our study showed that there were novel differences in metabolite profiling between subjects with OP and AS compared with those in the group with normal BMD without AS. In particular, acetate, valine, leucine, diacylglycerol and several VLDL particle levels were lower in subjects with OP and CAC, suggesting that altered amino acid and lipid metabolism may be linked to both disorders. Wide metabolomic analyses may provide a new insight for clinical practice to estimate the risk of possible cross-linking endpoints (eg, stroke or fracture in a population having OP or AS). In other words, change in certain metabolite levels may be a risk predictor for AS in patients having OP. Further, follow-up studies with larger samples are needed to verify the results and find the risk predictors.
Abbreviations
AS, atherosclerosis; OP, osteoporosis; cIMT, carotid intima-media thickness; CAC, carotid artery calcification; CVD, cardiovascular disease; PM, postmenopausal; DXA, dual energy X-ray absorptiometry; CCA, common carotid artery; FDR, false discovery rate; MUFA, monounsaturated fatty acid; OSTPRE, Kuopio Osteoporosis Risk Factor and Prevention Study; OSTPRE-BBA, Kuopio Osteoporosis Risk Factor and Prevention Study – Bone, Brain and Atherosclerosis; 1H, proton; APOB, apolipoprotein B; HMG-CoA, 3-hydroxy-3-methylglutaryl-CoA; TB, total body; FN, femoral neck; FM, fat mass; BMD, bone mineral density; NMR, nuclear magnetic resonance; BMI, body mass index; HT, postmenopausal hormone therapy; VLDL, very low density lipoprotein; IDL, intermediate density lipoprotein; LDL, low-density lipoprotein; HDL, high-density lipoprotein.
Acknowledgments
We thank Jussi Paananen and Oskari Timonen for statistical help with metabolomics data, Mika Alakorpela and Pasi Soininen for NMR analyses and Jarmo Tiikkainen for performing IMT measurements. We also thank Tuomas Selander for the help with statistical analyses.
Funding
Academy of Finland (Kröger H, grant number 250707), Kuopio University Hospital EVO-grants (Tuppurainen M, grant number 5302460), Kuopio University Hospital Funding (V.T.R. grant number 5203024), the Ministry of Education and Culture of Finland (grant numbers 116/626/2012, 46/627/2011 and 93/627/2010), and Strategic Funding of the University of Eastern Finland (grant number 931053) provided funding for this study. The foregoing grants were appropriated for the original OSTPRE study for 20- and 25-year follow-up measurements and analyses. Finnish Medical Society Duodecim grant of a young researcher (Eka Grant, 2016), abetment grant (grant number 2038) and Finnish Menopause Society personal grant (2018) were appropriated as personal grants for MV for his PhD thesis.
Disclosure
All authors report no conflict of interests in this work.
References
1. Tamaki J, Iki M, Hirano Y, et al. Low bone mass is associated with carotid atherosclerosis in postmenopausal women: the Japanese Population-based Osteoporosis (JPOS) Cohort Study. Osteoporos Int. 2009;20(1):53–60. doi:10.1007/s00198-008-0633-z
2. Varri M, Tuomainen T-P, Honkanen R, et al. Carotid intima-media thickness and calcification in relation to bone mineral density in postmenopausal women—The OSTPRE-BBA study. Maturitas. 2014;78(4):304–309. doi:10.1016/j.maturitas.2014.05.017
3. Ye C, Xu M, Wang S, et al. Decreased bone mineral density is an independent predictor for the development of atherosclerosis: a systematic review and meta-analysis. PLoS One. 2016;11(5):e0154740. doi:10.1371/journal.pone.0154740
4. Bagger YZ, Rasmussen HB, Alexandersen P, et al. Links between cardiovascular disease and osteoporosis in postmenopausal women: serum lipids or atherosclerosis per se? Osteoporos Int. 2007;18(4):505–512. doi:10.1007/s00198-006-0255-2
5. Ala-Korpela M, Kangas AJ, Soininen P. Quantitative high-throughput metabolomics: a new era in epidemiology and genetics. Genome Med. 2012;4(4):36. doi:10.1186/gm335
6. Soininen P, Kangas AJ, Wurtz P, et al. High-throughput serum NMR metabonomics for cost-effective holistic studies on systemic metabolism. Analyst. 2009;134(9):1781–1785. doi:10.1039/b910205a
7. Makovey J, Chen JS, Hayward C, Williams FMK, Sambrook PN. Association between serum cholesterol and bone mineral density. Bone. 2009;44(2):208–213. doi:10.1016/j.bone.2008.09.020
8. Parhami F, Garfinkel A, Demer LL. Role of lipids in osteoporosis. Arterioscler Thromb Vasc Biol. 2000;20(11):2346–2348. doi:10.1161/01.ATV.20.11.2346
9. Steinberg D. The LDL modification hypothesis of atherogenesis: an update. J Lipid Res. 2009;50(Supplement):S376–S381. doi:10.1194/jlr.R800087-JLR200
10. Buizert PJ, van Schoor NM, Lips P, Deeg DJ, Eekhoff EM. Lipid levels: a link between cardiovascular disease and osteoporosis? J Bone Miner Res. 2009;24(6):1103–1109. doi:10.1359/jbmr.081262
11. Kris-Etherton PM, Lichtenstein AH, Howard BV, Steinberg D, Witztum JL. Nutrition Committee of the American Heart Association Council on Nutrition, Physical Activity, and Metabolism. Antioxidant vitamin supplements and cardiovascular disease. Circulation. 2004;110(5):637–641. doi:10.1161/01.CIR.0000137822.39831.F1
12. Jeong I-K, Cho SW, Kim SW, et al. Lipid profiles and bone mineral density in pre- and postmenopausal women in Korea. Calcif Tissue Int. 2010;87(6):507–512. doi:10.1007/s00223-010-9427-3
13. Li S, Guo H, Liu Y, et al. Relationships of serum lipid profiles and bone mineral density in postmenopausal Chinese women. Clin Endocrinol (Oxf). 2015;82(1):53–58. doi:10.1111/cen.12616
14. D’Amelio P, Di Bella S, Tamone C, et al. HDL cholesterol and bone mineral density in normal-weight postmenopausal women: is there any possible association? Panminerva Med. 2008;50(2):89–96.
15. Go J-H, Song Y-M, Park J-H, Park J-Y, Choi Y-H. Association between serum cholesterol level and bone mineral density at lumbar spine and femur neck in postmenopausal korean women. Korean J Fam Med. 2012;33(3):166–173. doi:10.4082/kjfm.2012.33.3.166
16. Parhami F, Jackson SM, Tintut Y, et al. Atherogenic diet and minimally oxidized low density lipoprotein inhibit osteogenic and promote adipogenic differentiation of marrow stromal cells. J Bone Miner Res. 1999;14(12):2067–2078. doi:10.1359/jbmr.1999.14.12.2067
17. Wurtz P, Havulinna AS, Soininen P, et al. Metabolite profiling and cardiovascular event risk: A prospective study of 3 population-based cohorts. Circulation. 2015;131(9):774–785. doi:10.1161/CIRCULATIONAHA.114.013116
18. Moayyeri A, Cheung C-L, Tan KC, et al. Metabolomic pathways to osteoporosis in middle-aged women: a genome-metabolome-wide mendelian randomization study. J Bone Miner Res. 2018;33(4):643–650. doi:10.1002/jbmr.3358
19. Miyamoto T, Hirayama A, Sato Y, et al. A serum metabolomics-based profile in low bone mineral density postmenopausal women. Bone. 2017;95:1–4. doi:10.1016/j.bone.2016.10.027
20. Qi H, Bao J, An G, et al. Association between the metabolome and bone mineral density in pre- and post-menopausal chinese women using GC-MS. Mol Biosyst. 2016;12(7):2265–2275. doi:10.1039/C6MB00181E
21. Soininen P, Kangas AJ, Wurtz P, Suna T, Ala-Korpela M. Quantitative serum nuclear magnetic resonance metabolomics in cardiovascular epidemiology and genetics. Circ Cardiovasc Genet. 2015;8(1):192–206. doi:10.1161/CIRCGENETICS.114.000216
22. Bonjour P, Clark P, Cooper C, et al. WHO scientific group on the assessment of osteoporosis at primary health care level. J Med. 2004;7:2020.
23. Aguilar-Shea AL, Gallardo-Mayo C, Garrido-Elustondo S, Calvo-Manuel E, Zamorano-Gomez JL. Carotid intima-media thickness as a screening tool in cardiovascular primary prevention. Eur J Clin Invest. 2011;41(5):521–526. doi:10.1111/j.1365-2362.2010.02440.x
24. Raynor LA, Schreiner PJ, Loria CM, Carr JJ, Pletcher MJ, Shikany JM. Associations of retrospective and concurrent lipid levels with subclinical atherosclerosis prediction after 20 years of follow-up: the Coronary Artery Risk Development in Young Adults (CARDIA) study. Annals of Epidemiology. 2013;23(8):492–497. doi:10.1016/j.annepidem.2013.06.003
25. Prenner SB, Mulvey CK, Ferguson JF, Rickels MR, Bhatt AB, Reilly MP. Very low density lipoprotein cholesterol associates with coronary artery calcification in type 2 diabetes beyond circulating levels of triglycerides. Atherosclerosis. 2014;236(2):244–250. doi:10.1016/j.atherosclerosis.2014.07.008
26. Sivas F, Alemdaroglu E, Elverici E, Kulug T, Ozoran K. Serum lipid profile: its relationship with osteoporotic vertebrae fractures and bone mineral density in turkish postmenopausal women. Rheumatol Int. 2009;29(8):885–890. doi:10.1007/s00296-008-0784-4
27. Shen H, Damcott CM, Rampersaud E, et al. Familial defective apolipoprotein B-100 and increased low-density lipoprotein cholesterol and coronary artery calcification in the old order amish. Arch Intern Med. 2010;170(20):1850–1855. doi:10.1001/archinternmed.2010.384
28. Yerges-Armstrong LM, Shen H, Ryan KA, Streeten EA, Shuldiner AR, Mitchell BD. Decreased bone mineral density in subjects carrying familial defective apolipoprotein B-100. J Clin Endocrinol Metab. 2013;98(12):1999–2005. doi:10.1210/jc.2013-2471
29. Sabour H, Nazari M, Latifi S, et al. The relationship between dietary intakes of amino acids and bone mineral density among individuals with spinal cord injury. Oman Med J. 2016;31(1):22–28. doi:10.5001/omj.2016.05
30. Bray GA, Redman LM, de Jonge L, Rood J, Sutton EF, Smith SR. Plasma amino acids during 8 weeks of overfeeding: relation to diet body composition and fat cell size in the PROOF study. Obesity. 2018;26(2):324–331. doi:10.1002/oby.22087
31. Murr C, Grammer TB, Meinitzer A, Kleber ME, Marz W, Fuchs D. Immune activation and inflammation in patients with cardiovascular disease are associated with higher phenylalanine to tyrosine ratios: the ludwigshafen risk and cardiovascular health study. J Amino Acids. 2014;2014:783730. doi:10.1155/2014/783730
32. Deidda M, Piras C, Cadeddu Dessalvi C, et al. Blood metabolomic fingerprint is distinct in healthy coronary and in stenosing or microvascular ischemic heart disease. J Transl Med. 2017;15(1):112. doi:10.1186/s12967-017-1215-7
33. Boogaard A, Griffioen M, Cohen LH. Regulation of 3-hydroxy-3-methylglutaryl-coenzyme A reductase in human hepatoma cell line hep G2. Effects of inhibitors of cholesterol synthesis on enzyme activity. Biochem J. 1987;241(2):345–351. doi:10.1042/bj2410345
34. Rosvall M, Persson M, Ostling G, et al. Risk factors for the progression of carotid intima-media thickness over a 16-year follow-up period: the Malmö Diet and Cancer Study. Atherosclerosis. 2015;239(2):615–621. doi:10.1016/j.atherosclerosis.2015.01.030
35. Li GH, Cheung CL, Au PC, Tan KC, Wong IC, Sham PC. Positive effects of low LDL-C and statins on bone mineral density: an integrated epidemiological observation analysis and mendelian randomization study. Int J Epidemiol. 2019;dyz145.
36. Warburton DE. Health benefits of physical activity: the evidence. CMAJ. 2006;174(6):801–809. doi:10.1503/cmaj.051351
37. Feuchtner G, Langer C, Barbieri F, et al. Relationship of exercise to coronary artery disease extent, severity and plaque type: a coronary computed tomography angiography study. Journal of Cardiovascular Computed Tomography. 2019;13(3):34–40. doi:10.1016/j.jcct.2019.02.001
 © 2020 The Author(s). This work is published and licensed by Dove Medical Press Limited. The full terms of this license are available at https://www.dovepress.com/terms.php and incorporate the Creative Commons Attribution - Non Commercial (unported, v3.0) License.
By accessing the work you hereby accept the Terms. Non-commercial uses of the work are permitted without any further permission from Dove Medical Press Limited, provided the work is properly attributed. For permission for commercial use of this work, please see paragraphs 4.2 and 5 of our Terms.
© 2020 The Author(s). This work is published and licensed by Dove Medical Press Limited. The full terms of this license are available at https://www.dovepress.com/terms.php and incorporate the Creative Commons Attribution - Non Commercial (unported, v3.0) License.
By accessing the work you hereby accept the Terms. Non-commercial uses of the work are permitted without any further permission from Dove Medical Press Limited, provided the work is properly attributed. For permission for commercial use of this work, please see paragraphs 4.2 and 5 of our Terms.