")
Back to Journals » Diabetes, Metabolic Syndrome and Obesity » Volume 15
Metabolism Score for Visceral Fat (METS-VF): A New Predictive Surrogate for CKD Risk
Authors Feng L, Chen T, Wang X, Xiong C, Chen J, Wu S, Ning J , Zou H
Received 10 April 2022
Accepted for publication 13 July 2022
Published 29 July 2022 Volume 2022:15 Pages 2249—2258
DOI https://doi.org/10.2147/DMSO.S370222
Checked for plagiarism Yes
Review by Single anonymous peer review
Peer reviewer comments 5
Editor who approved publication: Professor Ming-Hui Zou
Ling Feng,1,2,* Tong Chen,3,* Xuan Wang,1 Chongxiang Xiong,1,4 Jianhui Chen,1 Shiquan Wu,3 Jing Ning,3 Hequn Zou1,3
1Department of Nephrology, The Third Affiliated Hospital, Southern Medical University, Guangzhou, People’s Republic of China; 2Department of Nephrology, Shenzhen Hospital, Southern Medical University, Shenzhen, People’s Republic of China; 3Department of Nephrology, South China Hospital of Shenzhen University, Shenzhen, People’s Republic of China; 4Department of Nephrology, The First Dongguan Affiliated Hospital of Guangdong Medical University, Dongguan, People’s Republic of China
*These authors contributed equally to this work
Correspondence: Hequn Zou, Department of Nephrology, The Third Affiliated Hospital, Southern Medical University, 183, Zhongshan West Avenue, Tianhe District, Guangzhou, 510630, People’s Republic of China, Email [email protected]
Purpose: Metabolic disorders are closely related to the occurrence and development of chronic kidney disease (CKD). We explored the prospective association between the Metabolic Score for Visceral Fat (METS-VF) and CKD in a 5-year follow-up study.
Patients and Methods: In this cohort study, 631 adults not suffering from CKD from Wanzhai Town, in China in 2012 were included at baseline and followed up in 2017 and 2018. Multivariable logistic regression was used to calculate odds ratios (ORs) and 95% confidence intervals (CIs) for the association between METS-VF and CKD risk. Area under the receiver operating characteristic curve (AUC) analyses were used to evaluate the ability of METS-VF, waist-to-height ratio (WhtR), visceral adiposity index (VAI), homeostatic model assessment of insulin resistance (HOMA-IR), body mass index (BMI) to predict CKD risk.
Results: We identified 103 CKD cases during follow-up. After adjustment for confounding factors, comparing the lowest quartile of METS-VF, the OR (95% CI) of CKD risk in the highest quartile was 3.04 (1.39– 6.64). The per Standard deviation (SD) increase in METS-VF was positively correlated with CKD risk. The AUC of METS-VF for predicting CKD risk was, in general, higher than that for WhtR, VAI, HOMA-IR, and BMI.
Conclusion: METS-VF may be an indicator for predicting CKD risk.
Keywords: CKD, METS-VF, visceral obesity
Introduction
It is estimated that by 2040, the number of deaths worldwide due to chronic kidney disease (CKD) will reach 3.1 million. Between 1990 and 2017, fasting plasma glucose (FPG), body mass index (BMI) and systolic blood pressure (SBP) were the main metabolic factors used to measure CKD risk. Further analyses of the summary-exposure value of CKD risk showed that BMI and a high FPG level increased significantly by 70% and 38%, respectively, whereas high SBP decreased by 2%.1,2 A study of 2.7 million participants in China found that more than one in seven met criteria for overall obesity and one third met criteria for abdominal obesity.3 In a large, retrospective, 10-year study in central China involving 34,630 hospitalized patients who underwent renal biopsy, the prevalence of obesity-related renal disease increased from 0.62% in 2009 to 2.25% in 2018.4 Increasing numbers of studies have shown that metabolic disorders based on visceral adipose tissue (VAT) are associated with the risk of cardiovascular disease and neurological disease.5,6 Furthermore, perirenal adipose tissue has been shown to be closely related to kidney disease in obese individuals.7 Therefore, there is an urgent need for an accurate evaluation index to link the metabolic status of VAT with CKD risk.
Magnetic resonance imaging (MRI) is the “gold standard” for VAT but it’s application is limited due to the high operating costs and need for highly trained personnel.8 Metabolic Score for Visceral Fat (METS-VF) combines age, sex, waist-to-height ratio (WhtR), metabolic score for insulin resistance (METS-IR), as well as levels of FPG and triglycerides (TG). METS-VF has been used to predict intra-abdominal fat volume and cardiometabolic health in the Mexican population.9 In this study, we explored if METS-VF can also be used as a predictor of CKD.
Methods
Ethical Approval of the Study Protocol
The study protocol was approved (201708011) by the Ethics Committee of the Third Affiliated Hospital of Southern Medical University (Guangdong, China). The study was conducted in accordance with the Declaration of Helsinki 1964 and its later amendments. All participants provided written informed consent.
Study Population
Participants were recruited from a population-based cohort study in six communities in Wanzhai Town (Zhuhai City, Southern China). Random sampling of clusters at multiple stages was used. Adults (age ≥ 18 years) living in these six communities were invited to participate in the survey. We excluded people with CKD or cancer, and 1450 adults not suffering from CKD between June to October 2012 were included at baseline. After 5-year follow-up, 721 dropped out of the study, and 98 people who had missing data for all components of METS-VF were excluded. Finally, 631 participants were followed up from December 2017 to April 2018. A detailed Flowchart of our study is shown as Figure 1.
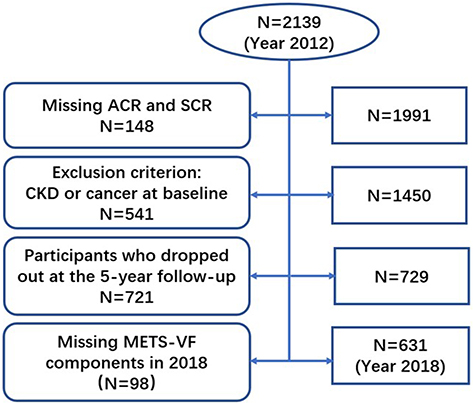 |
Figure 1 Flowchart for the selection of study subjects. Abbreviations: ACR, urinary microalbumin to creatinine ratio; SCR, serum creatinine; CKD, chronic kidney disease; METS-VF, Metabolism Score for Visceral Fat. |
Data Collection
Medical staff and medical students helping to carry out this study received standardized training. Basic information regarding age, sex, tabacco smoking, alcohol consumption, education level, physical activity, and disease history was obtained through a questionnaire. A mercury sphygmomanometer was used to measure the blood pressure of each participant after resting for ≥ 5 min, and then the mean value of three measurements was calculated. Participants were requested to wear light clothes as well as to stand and breathe naturally. The waist circumference (WC) between the lower costal margin of the midline of the axilla and iliac crest was measured. A blood test was carried out after an overnight fast ≥10 h. Blood samples were cryopreserved and sent for assay to the central laboratory of the Third Affiliated Hospital of Southern Medical University. To measure the indicators of glucose metabolism, a standard enzymatic method was used to measure the FPG level and an electrochemiluminescence method was employed to measure the fasting insulin (FINS) level. To measure blood lipid levels, a colorimetric method was employed to determine levels of TG, total cholesterol (TC), high-density lipoprotein-cholesterol (HDL-C), and low-density lipoprotein-cholesterol (LDL-C). To measure biochemical indicators, the improved Jaffe method was used to determine the serum creatinine (SCr) level using a Cobas 6000 system (Roche, Basel, Switzerland). To measure the indicators of oxidative stress and inflammation risk, enzyme-linked immunosorbent assays were used to measure the superoxide dismutase (SOD) level and immunoturbidimetry was employed to measure the high-sensitivity C-reactive protein (hs-CRP) concentration. In addition, we measured the albumin and creatinine concentrations (ACR) of random urine samples.
Definition and Calculations
BMI was calculated as BMI=weight(kg)/height2(m2).
WhtR was calculated as WhtR= waist(cm)/height(cm).
The estimated glomerular filtration rate (eGFR) was determined using the Modification of Diet in Renal Disease equation:

CKD was defined as ACR ≥ 3 (mg/g) and/or eGFR < 60 (mL/min/1.73 m2).
The Homeostatic Model Assessment for Insulin Resistance (HOMA-IR) was calculated as:
HOMA-IR= FPG (mmol/L) × FINS(mU/L)/22.5. Insulin resistance was defined as HOMA-IR>2.69.10
Obesity was defined as BMI ≥ 28.0 kg/m2, or WC (male) ≥ 90cm, or WC (female) ≥ 85cm.11
METS-IR,12 METS-VF,9 and VAI13 were calculated as shown below.


Statistical Analyses
SPSS 20 (IBM, Armonk, NY, USA) and MedCalc (www.medcalc.org) were used to analyze data. Continuous variables with a normal distribution are displayed as mean±SD, and the independent sample t-test was used for comparison of differences. Continuous variables with a non-normal distribution are presented as median (25th–75th percentile), and the Mann–Whitney U-test and Kruskal–Wallis test were used for a comparison of differences. Count data are expressed as percentages, and the chi-square test was employed for comparison of differences. Participants were classified into quartiles, with the lowest quartile as the reference. We also estimated CKD risk with per-SD increase in METS-VF. The specific quartiles of METS-VF were grouped, with Quartile 1(Q1) being METS-VF≤5.75, Quartile 2(Q2) being 5.57<METS-VF≤6.23, Quartile 3(Q3) being 6.23<METS-VF≤6.56, and Quartile 4(Q4) being METS-VF>6.56. We use multivariable logistic regression to assess whether METS-VF could be used to predict the potential risk of CKD.
We established three models. Model 1 was unadjusted. Model 2 was adjusted for tabacco smoking, alcohol consumption, education level, physical activity. Model 3 was adjusted for tabacco smoking, alcohol consumption, education level, physical activity, SBP, diastolic blood pressure (DBP), hs-CRP level, SOD level. Results are presented as odds ratio (ORs) and 95% confidence intervals (CIs). A receiver operating characteristic curve (ROC) was employed to analyze the efficacy of METS-VF, WhtR, VAI, HOMA-IR, and BMI for diagnosing CKD. p <0.05 (two-tailed) was considered significant.
Results
Clinical and Demographic Characteristics in the Non-CKD and CKD Group
Table 1 shows the demographic characteristics of the 631 eligible participants who had or did not have CKD, as well as 103 CKD cases identified during a mean follow-up of 5.4 years. Participants with CKD were older, and had higher BMI, WC, WHtR, SBP, DBP, HOMA-IR, METS-IR, VAI, METS-VF, as well as higher levels of SCr, ACR, TG, FPG, and FINS. In participants with CKD, a higher prevalence of diabetes mellitus, obesity and hypertension, as well as a lower prevalence of high school or higherer education and physical activity, were noted. However, the prevalence of tobacco smoking, alcohol consumption as well as levels of TC, HDL-C, LDL-C, hs-CRP, and SOD did not differ in those suffering from CKD or not suffering from CKD.
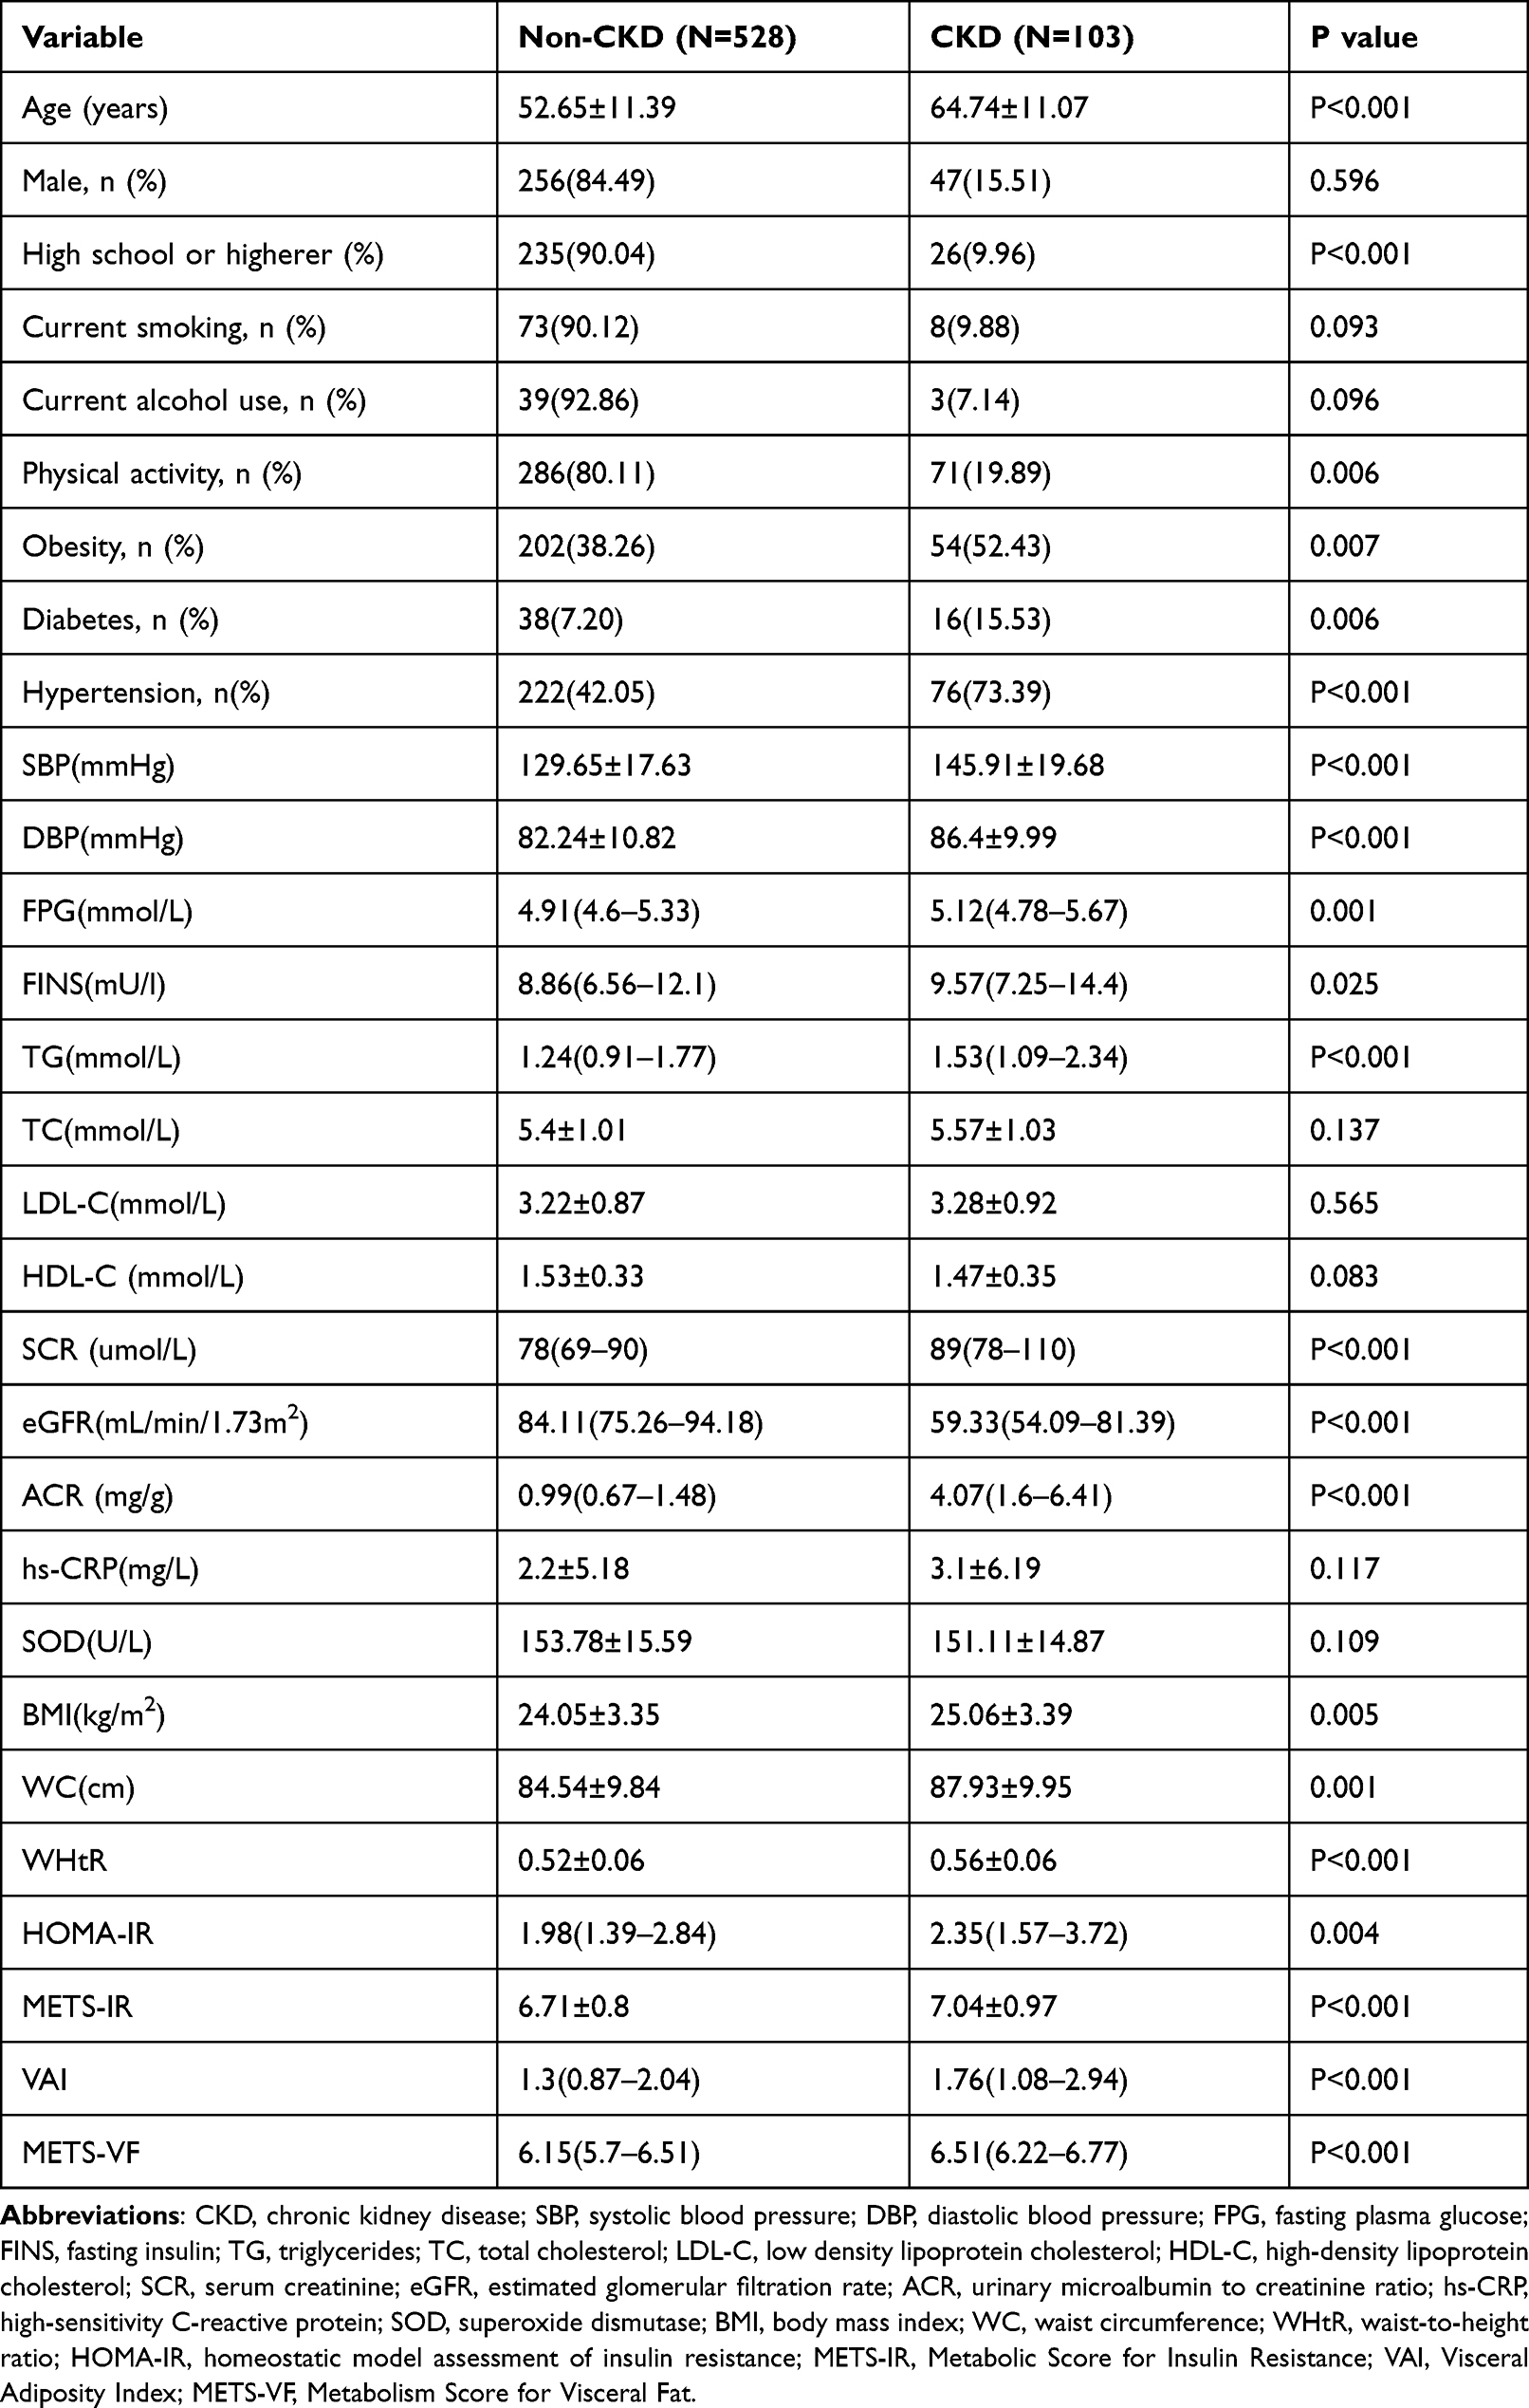 |
Table 1 Clinical and Demographic Characteristics of Participants |
Correlation Analysis Between METS-VF and CKD Risk
The ability of METS-VF to predict the CKD risk is shown in Table 2. The CKD prevalence increased with increasing quartiles of METS-VF. The prevalence (95% CI) of CKD for Q1, Q2, Q3, and Q4 was 6.37 (2.51–10.23),10.06 (5.34–14.79),19.48 (13.15–25.81), and 29.19 (22.09–36.29), respectively. A positive association between METS-VF and CKD risk was observed among the three models. After adjustment for the education level, tobacco smoking, alcohol consumption, physical activity, SBP, DBP, hs-CRP level, and SOD level, the OR (95% CI) of CKD for Q2, Q3, and Q4 was 1.19 (0.5–2.79),1.91 (0.85–4.27, and 3.04 (1.39–6.64), respectively. For each increase in SD in METS-VF among three models, the adjusted OR (95% CI) of CKD was 2 (1.58–2.54), 2 (1.56–2.55), and 1.58 (1.21–2.06), respectively.
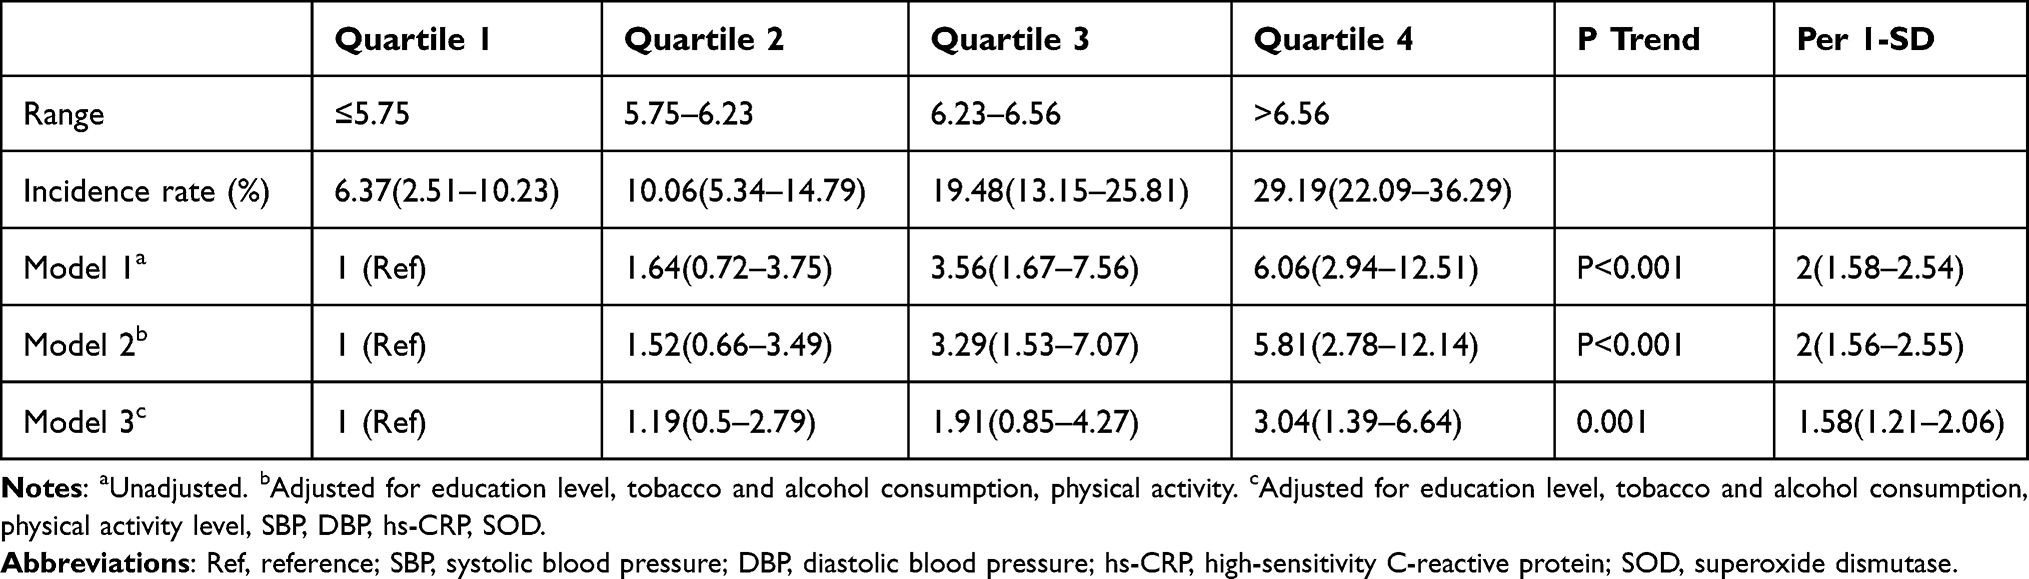 |
Table 2 Multivariable Logistic Regression to Analyze the Correlation Between Metabolic Score for Visceral and CKD Risk |
Subgroups Analysis of the Association Between METS-VF and CKD Risk
We undertook subgroup analyses of the association between METS-VF and CKD risk. The positive association between METS-VF and CKD risk was still observed in male, insulin resistance, and obesity subgroups. After adjustment for the education level, tobacco smoking, and alcohol consumption, physical activity, SBP, DBP, hs-CRP, SOD, the OR (95% CI) of CKD was 2.38 (1.44–3.93), 2.43 (1.47–4.02), 2.12 (1.43–3.13), respectively (Figure 2).
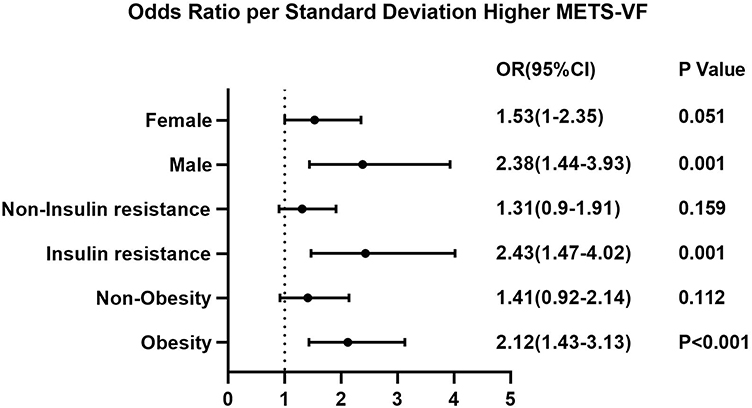 |
Figure 2 Subgroup analyses of the association between metabolic score for visceral fat and CKD risk. Abbreviations: OR, odd ratios; CI, confidence interval; METS-VF, Metabolism Score for Visceral Fat. |
Comparative Analysis of ROC Curves of METS-VF, WHtR, VAI, HOMA-IR and BMI in Predicting CKD Risk
Table 3 shows the aera under the ROC curve (AUC) value (95% CI), optimal cutoff, sensitivity, specificity, and Youden index for each parameter used to predict CKD risk. METS-VF, WHtR, VAI, HOMA-IR, and BMI were used as detection variables. CKD was used as the outcome variable for analyses of ROC curves. The AUC (95% CI) of METS-VF, WHtR, VAI, HOMA-IR, and BMI was 0.692 (0.654–0.728), 0.652 (0.613–0.689), 0.626 (0.587–0.664), 0.589 (0.549–0.628), 0.585 (0.545–0.623), respectively. METS-VF had the largest AUC (95% CI) among METS-VF, WHtR, VAI, HOMA-IR, and BMI, and the difference was significant. Compared with WHtR, VAI, HOMA-IR, and BMI, the Youden index of METS-VF was 0.3122, which was the highest value of all indices tested. Analyses of the ROC curves of the association between METS-VF, WHtR, VAI, HOMA-IR, and BMI, and CKD are shown in Figure 3.
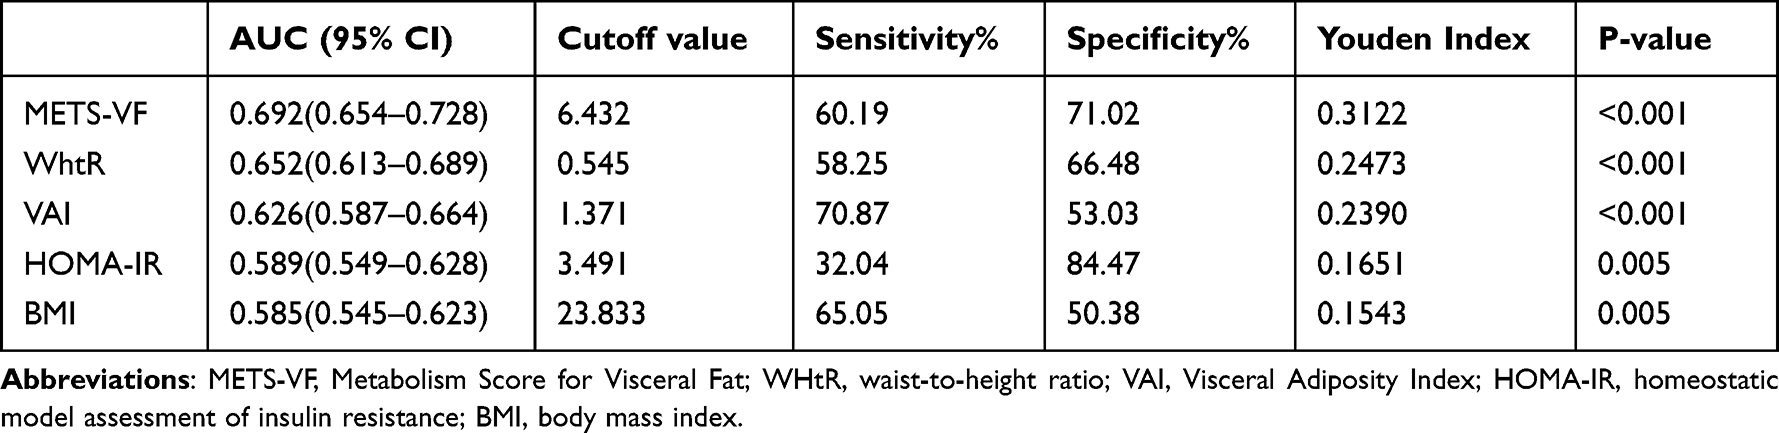 |
Table 3 Comparison of Values for Area Under the Receiver Operating Characteristic Curve for METS-VF, WHtR, VAI, HOMA-IR, and BMI with CKD Risk |
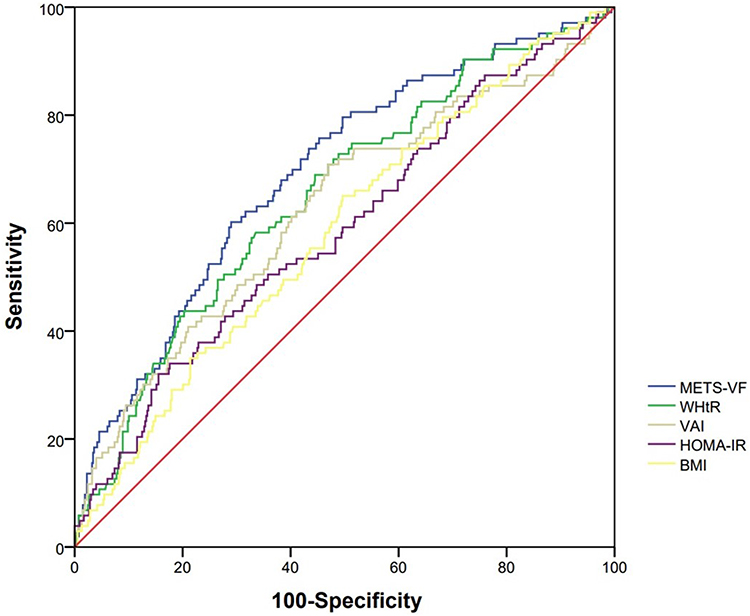 |
Figure 3 Comparison of the correlation between METS-VF, WHtR, VAI, HOMA-IR, and BMI and CKD risk. Abbreviations: METS-VF, Metabolism Score for Visceral Fat; WHtR, waist-to-height ratio; VAI, Visceral Adiposity Index; HOMA-IR, homeostatic model assessment of insulin resistance; BMI, body mass index. |
Discussion
We showed that METS-VF was positively associated with CKD risk. For Q1, Q2, Q3, and Q4 of METS-VF, the CKD prevalence was 6.37%, 10.06%, 19.48% and 29.19%, respectively. After adjustment for confounders, the CKD risk at Q2, Q3, and Q4 of METS-VF increased by 1.19-, 1.91-and 3.04-times, respectively, compared with Q1. METS-VF had the largest AUC and Youden index for prediction of CKD risk compared with that of WHtR, VAI, HOMA-IR, and BMI. The optimal value of METS-VF for predicting CKD was 6.432, with a sensitivity of 60.19% and specificity of 71.02%.
Visceral obesity increases the risk of kidney disease. Under normal physiological conditions, adipose tissue coordinates the balance between systemic nutritional status and energy metabolism through adipokines. Under pathological conditions, excessive expansion and accumulation of adipose tissue leads to biological abnormalities and dysfunction of adipose tissue. These actions are accompanied by accumulation of ectopic fat, which leads to impairment of organ functions.14 Analyses of the potential causal effects of obesity on kidney health from the United Kingdom showed that blood pressure was responsible for approximately 13–16% of cases and type 2 diabetes mellitus was responsible for 21–26% of cases; in enrichment analyses, 61 signaling pathways were found to be correlated with obesity measures.15 In an obese population not suffering from hypertension or diabetes mellitus and with normal renal function, the thickness of visceral fat (measured using ultrasound) was found to inversely correlated with eGFR, and the latter decreased as visceral fat increases.16 In our study, METS-VF was higher in the CKD group than in the control group. In a study of the obese subgroup, we found that, for each SD increase in METS-VF, the CKD risk increased by 2.12-times.
Disorders in the metabolism of glucose and lipids metabolism and insulin resistance increase the risk of kidney disease. The balance between glucose metabolism and lipid metabolism helps to maintain the normal function of the kidneys. However, under pathological conditions, excessive fatty acids form TG droplets in renal tubular epithelial cells, excessive accumulation of cholesterol in podocytes ruptures the integrity of the cleft septum, and high glucose can induce upregulation expression of lipogenic gene and reduce β-oxidation of fatty acids. All of these abnormalities in glycolipid metabolism leads to damage to cellular architecture and an inflammatory response in the kidneys.17–19 In addition, if excessive accumulation of visceral fat leads to the impairment of insulin clearance and transmission of signaling pathways in pancreatic islets, it affects the energy supply of the kidneys which, eventually, leads to kidney damage.20–22 In our study, levels of TG, FPG, and HOMA-IR were increased in the CKD group, and the differences were significant. In the HOMA-IR subgroup, the CKD risk increased by 2.43-times for each SD increase in METS-VF.
Studies have shown that aging and overnutrition can lead to accumulation of senescent adipocytes in adipose tissue. Simultaneously, this action is accompanied by damage to adipose progenitor cells, which results in disorders of glucose metabolism, lipid metabolism, endocrine dysfunction, and immune disregulation in adipose tissue.23,24 There are differences in the metabolic rate in men and women. In men, there may be significant accumulation of intra-abdominal fat due to more glucocorticoid receptors being present in intra-abdominal fat than that in women. In women, especially after the age of 60 years, due to a decline in estrogen levels, blood pressure and adipose-tissue redistribution is affected.25,26 BMI can better define overweight and obesity, whereas WC can better define abdominal obesity. Impairment of insulin clearance in obese individuals, and the accompanying insulin resistance and disorders of glucose metabolism in tissues and organs, promote morbidly obesity.20,27 Increased circulating levels of TGs, decreased clearance of LDL-C, and long-term maintenance of lower levels of HDL-C are involved in obesity development.28,29 METS-VF integrates the above parameters stated above to assess the metabolic status of visceral fat, which can reflect the risk of human disease to a certain extent.9
The gold standard for VAT evaluation is MRI, and the other detection methods are computed tomography, dual X-ray absorptiometry (DXA), and bioelectrical impedance analysis (BIA).30 However, application of these detection methods in daily clinical practice is limited by the requirement of equipment and specialist training. METS-VF is a surrogate index for estimating intra-abdominal adipose tissue and VAT based on DXA, but also has good consistency when compared with visceral-fat parameters measured by DXA, MRI, and BIA to some extent. Moreover, METS-VF can also reflect an unfavorable adipokine profile in people suffering from obesity.9
In a study of non-obese individuals, METS-VF was significantly associated with hyperuricemia risk and had the highest predictive ability in women.31 A cohort study from Henan (China), revealed METS-VF to be positively correlated with the risk of hypertension and type-2 diabetes mellitus.32,33 In our study, with an increase in METS-VF quartile, CKD risk increased gradually, reaching 29.19% in Q4. Compared with Q1, the CKD risk increased by 3.04-times in Q4.
Due to the unfavorable changes in diets, the prevalence of obesity and metabolic abnormalities has increased year-by-year in China,34 and the prevalence of metabolic abnormalities-related kidney diseases has also increased gradually. Studies have shown that increasing age,23 overnutrition,24 sex differences in the number of lipid glucocorticoid receptors and estrogen secretion,25,26 abnormal lipid levels,28,29 and insulin resistance20,27 are involved in the development of morbid obesity. We attempted to predict CKD risk using the anthropometric indicators BMI, WHtR,35,36 visceral fat index,37 and insulin resistance.38,39 Although these indices had a certain value, they had certain limitations. In our study, METS-VF had the largest AUC and Youden index for predicting CKD risk compared with that using WhtR, VAI, HOMA-IR, and BMI.
The main advantage of the present study was that it was the first time to investigate the longitudinal association between METS-VF and CKD risk, and we compared it with other metabolic indices (WhtR, VAI, HOMA-IR, BMI) that assess CKD risk. However, our study had three main limitations. First, we adjusted only for the confounding factors of education level, physical activity, tobacco smoking, alcohol consumption, lipid levels in blood, SBP, DBP, hs-CRP levels, SOD levels. Other unknown or unmeasured confounding variables may affect the predictive value of METS-VF for CKD risk. Secondly we lacked validated data on assessment of visceral fat using MRI or computed tomography. Third, we studied the population in Wanzhai Town, but whether METS-VF can be used to predict CKD risk in other parts of China is not known.
Conclusion
The performance of METS-VF in predicting CKD was higher than that of other indicators (WhtR, VAI, HOMA-IR, BMI). METS-VF could be a useful indicator for predicting CKD.
Funding
This study was supported by the Shenzhen Municipal Science and Technology Innovation Commission Stability Support Program for Higher Education Institutions (20200822123122001), Key Technology Research Project of Shenzhen Science and Technology Innovation Commission (JSGG20200225152709802), Science and Technique Program of Guangzhou (81873620), Guangdong Province Basic and Applied Basic Research Fund Project (2021A1515010972), Provincial Major Projects of Education Department of Guangdong Province (Natural Science) (2014KZDXM019), and General project of Guangdong Provincial Administration of Traditional Chinese Medicine (20202125).
Disclosure
The authors report no conflicts of interest in this work.
References
1. Bikbov B, Purcell CA, Levey AS. Global, regional, and national burden of chronic kidney disease, 1990–2017: a systematic analysis for the Global Burden of Disease Study 2017. Lancet. 2020;395(10225):709–733. doi:10.1016/S0140-6736(20)30045-3
2. Fraser SDS, Roderick PJ. Kidney disease in the Global Burden of Disease Study 2017. Nat Rev Nephrol. 2019;15(4):193–194. doi:10.1038/s41581-019-0120-0
3. Mu L, Liu J, Zhou G, et al. Obesity prevalence and risks among chinese adults: findings from the China PEACE million persons project, 2014–2018. Circ Cardiovasc Qual Outcomes. 2021;14(6):e007292. doi:10.1161/CIRCOUTCOMES.120.007292
4. Hu R, Quan S, Wang Y, et al. Spectrum of biopsy proven renal diseases in Central China: a 10-year retrospective study based on 34,630 cases. Sci Rep. 2020;10(1):10994. doi:10.1038/s41598-020-67910-w
5. Huang Y, Liu Y, Ma Y, et al. Associations of visceral adipose tissue, circulating protein biomarkers, and risk of cardiovascular diseases: a mendelian randomization analysis. Front Cell Dev Biol. 2022;10:840866. doi:10.3389/fcell.2022.840866
6. Kim S, Yi HA, Won KS, et al. Association between visceral adipose tissue metabolism and Alzheimer’s disease pathology. Metabolites. 2022;12(3):258. doi:10.3390/metabo12030258
7. Sun X, Han F, Miao W, et al. Sonographic evaluation of para- and perirenal fat thickness is an independent predictor of early kidney damage in obese patients. Int Urol Nephrol. 2013;45(6):1589–1595. doi:10.1007/s11255-013-0404-4
8. Shuster A, Patlas M, Pinthus JH, et al. The clinical importance of visceral adiposity: a critical review of methods for visceral adipose tissue analysis. Br J Radiol. 2012;85(1009):1–10. doi:10.1259/bjr/38447238
9. Bello-Chavolla OY, Antonio-Villa NE, Vargas-Vázquez A, et al. Metabolic Score for Visceral Fat (METS-VF), a novel estimator of intra-abdominal fat content and cardio-metabolic health. Clin Nutr. 2020;39(5):1613–1621. doi:10.1016/j.clnu.2019.07.012
10. Xing XY, Yang WY. The diagnostic significance of homeostasis model assessment of insulin resistance in metabolic syndrome among subjects with different glucose tolerance. Chin J Diabetes. 2004:12(3):182–186.
11. Chinese Medical Association. Guideline for primary care of obesity: practice version (2019). Chin J Gen Pract. 2020;2:102–107.
12. Bello-Chavolla OY, Almeda-Valdes P, Gomez-Velasco D, et al. METS-IR, a novel score to evaluate insulin sensitivity, is predictive of visceral adiposity and incident type 2 diabetes. Eur J Endocrinol. 2018;178(5):533–544. doi:10.1530/EJE-17-0883
13. Amato MC, Giordano C, Galia M, et al. Visceral Adiposity Index: a reliable indicator of visceral fat function associated with cardiometabolic risk. Diabetes Care. 2010;33(4):920–922. doi:10.2337/dc09-1825
14. Ghaben AL, Scherer PE. Adipogenesis and metabolic health. Nat Rev Mol Cell Biol. 2019;20(4):242–258. doi:10.1038/s41580-018-0093-z
15. Xu X, Eales JM, Jiang X, et al. Contributions of obesity to kidney health and disease - insights from mendelian randomisation and the human kidney transcriptomics. Cardiovasc Res. 2021. doi:10.1093/cvr/cvab357
16. Kang Y, Huang L, Wang R, et al. Relationship between the estimated glomerular filtration rate and visceral fat thickness based on ultrasound in patients with obesity who have normal renal function without hypertension or diabetes. J Ultrasound Med. 2019;38(9):2287–2294. doi:10.1002/jum.14921
17. Jao TM, Nangaku M, Wu CH, et al. ATF6α downregulation of PPARα promotes lipotoxicity-induced tubulointerstitial fibrosis. Kidney Int. 2019;95(3):577–589. doi:10.1016/j.kint.2018.09.023
18. Tufro A. Cholesterol accumulation in podocytes: a potential novel targetable pathway in diabetic nephropathy. Diabetes. 2013;62(11):3661–3662. doi:10.2337/db13-1167
19. Chen N, Mu L, Yang Z, et al. Carbohydrate response element-binding protein regulates lipid metabolism via mTOR complex1 in diabetic nephropathy. J Cell Physiol. 2021;236(1):625–640. doi:10.1002/jcp.29890
20. Fu Z, Wu Q, Guo W, et al. Impaired insulin clearance as the initial regulator of obesity-associated hyperinsulinemia: novel insight into the underlying mechanism based on serum bile acid profiles. Diabetes Care. 2021;45(2):425–435.
21. Marini MA, Frontoni S, Succurro E, et al. Differences in insulin clearance between metabolically healthy and unhealthy obese subjects. Acta Diabetol. 2014;51(2):257–261. doi:10.1007/s00592-013-0511-9
22. Lu H, Bogdanovic E, Yu Z, et al. Combined hyperglycemia- and hyperinsulinemia-induced insulin resistance in adipocytes is associated with dual signaling defects mediated by PKC-ζ. Endocrinology. 2018;159(4):1658–1677. doi:10.1210/en.2017-00312
23. Liu Z, Wu KKL, Jiang X, et al. The role of adipose tissue senescence in obesity- and ageing-related metabolic disorders. Clin Sci. 2020;134(2):315–330. doi:10.1042/CS20190966
24. Gao Z, Daquinag AC, Fussell C, et al. Age-associated telomere attrition in adipocyte progenitors predisposes to metabolic disease. Nat Metab. 2020;2(12):1482–1497. doi:10.1038/s42255-020-00320-4
25. Yoo JK, Fu Q. Impact of sex and age on metabolism, sympathetic activity, and hypertension. FASEB J. 2020;34(9):11337–11346. doi:10.1096/fj.202001006RR
26. Hill JL, Solomon MB, Nguyen ET, et al. Glucocorticoids regulate adipose tissue protein concentration in a depot- and sex-specific manner. Stress. 2020;23(2):243–247. doi:10.1080/10253890.2019.1658736
27. Tamura Y. Ectopic fat, insulin resistance and metabolic disease in non-obese Asians: investigating metabolic gradation. Endocr J. 2019;66(1):1–9. doi:10.1507/endocrj.EJ18-0435
28. Molina-Vega M, Castellano-Castillo D, Sánchez-Alcoholado L, et al. Relationship of zonulin with serum PCSK9 levels after a high fat load in a population of obese subjects. Biomolecules. 2020;10(5):748. doi:10.3390/biom10050748
29. Yang Y, Wan YP, Fan ZP, et al. Metabolically healthy obesity is associated with longitudinal changes in high-density lipoprotein cholesterol in Chinese adults. Eat Weight Disord. 2021;26(1):263–272. doi:10.1007/s40519-020-00847-1
30. Fang H, Berg E, Cheng X, et al. How to best assess abdominal obesity. Curr Opin Clin Nutr Metab Care. 2018;21(5):360–365. doi:10.1097/MCO.0000000000000485
31. Liu XZ, Chen DS, Xu X, et al. Longitudinal associations between metabolic score for visceral fat and hyperuricemia in non-obese adults. Nutr Metab Cardiovasc Dis. 2020;30(10):1751–1757. doi:10.1016/j.numecd.2020.06.001
32. Feng Y, Yang X, Li Y, et al. Metabolic Score for Visceral Fat: a reliable indicator of visceral obesity for predicting risk for hypertension. Nutrition. 2021;93:111443.
33. Feng Y, Yang X, Li Y, et al. Metabolic Score for Visceral Fat: a novel predictor for the risk of type 2 diabetes mellitus. Br J Nutr. 2021:1–8. doi:10.1017/S0007114521004116
34. Zhao P, Gu X, Qian D, et al. Socioeconomic disparities in abdominal obesity over the life course in China. Int J Equity Health. 2018;17(1):96. doi:10.1186/s12939-018-0809-x
35. Yang S, Li M, Chen Y, et al. Comparison of the correlates between body mass index, waist circumference, waist-to-height ratio, and chronic kidney disease in a rural Chinese adult population. J Renal Nutr. 2019;29(4):302–309.e301. doi:10.1053/j.jrn.2018.10.008
36. Memarian E, Nilsson PM, Zia I, et al. The risk of chronic kidney disease in relation to anthropometric measures of obesity: a Swedish cohort study. BMC Nephrol. 2021;22(1):330. doi:10.1186/s12882-021-02531-7
37. Bamba R, Okamura T, Hashimoto Y, et al. The visceral adiposity index is a predictor of incident chronic kidney disease: a population-based longitudinal study. Kidney Blood Press Res. 2020;45(3):407–418. doi:10.1159/000506461
38. Gu S, Wang A, Ning G, et al. Insulin resistance is associated with urinary albumin-creatinine ratio in normal weight individuals with hypertension and diabetes: the REACTION study. J Diabetes. 2020;12(5):406–416. doi:10.1111/1753-0407.13010
39. Hu Y, Shi LX, Zhang Q, et al. Increased risk of chronic kidney diseases in patients with metabolic syndrome: a 3-year prospective cohort study. Curr Med Sci. 2019;39(2):204–210. doi:10.1007/s11596-019-2020-8
 © 2022 The Author(s). This work is published and licensed by Dove Medical Press Limited. The full terms of this license are available at https://www.dovepress.com/terms.php and incorporate the Creative Commons Attribution - Non Commercial (unported, v3.0) License.
By accessing the work you hereby accept the Terms. Non-commercial uses of the work are permitted without any further permission from Dove Medical Press Limited, provided the work is properly attributed. For permission for commercial use of this work, please see paragraphs 4.2 and 5 of our Terms.
© 2022 The Author(s). This work is published and licensed by Dove Medical Press Limited. The full terms of this license are available at https://www.dovepress.com/terms.php and incorporate the Creative Commons Attribution - Non Commercial (unported, v3.0) License.
By accessing the work you hereby accept the Terms. Non-commercial uses of the work are permitted without any further permission from Dove Medical Press Limited, provided the work is properly attributed. For permission for commercial use of this work, please see paragraphs 4.2 and 5 of our Terms.