")
Back to Journals » OncoTargets and Therapy » Volume 9
Metabolism-related enzyme alterations identified by proteomic analysis in human renal cell carcinoma
Authors Lu Z, Yao Y, Song Q, Yang J, Zhao X, Yang P, Kang J
Received 7 July 2015
Accepted for publication 23 December 2015
Published 9 March 2016 Volume 2016:9 Pages 1327—1337
DOI https://doi.org/10.2147/OTT.S91953
Checked for plagiarism Yes
Review by Single anonymous peer review
Peer reviewer comments 3
Editor who approved publication: Professor Daniele Santini
Zejun Lu,1,* Yuqin Yao,2,* Qi Song,3 Jinliang Yang,4 Xiangfei Zhao,1 Ping Yang,1 Jingbo Kang1
1Department of Radiation Oncology, Naval General Hospital of People’s Liberation Army, Beijing, 2Research Center for Public Health and Preventive Medicine, West China School of Public Health/No 4 West China Teaching Hospital, Sichuan University, Chengdu, 3Department of Gynaecology and Obstetrics, The General Hospital of Chinese People’s Armed Police Force, Beijing, 4State Key Laboratory of Biotherapy/Collaborative Innovation Center for Biotherapy, West China Hospital, Sichuan University, Chengdu, People’s Republic of China
*These authors contributed equally to this work
Abstract: The renal cell carcinoma (RCC) is one of the most common types of kidney neoplasia in Western countries; it is relatively resistant to conventional chemotherapy and radiotherapy. Metabolic disorders have a profound effect on the degree of malignancy and treatment resistance of the tumor. However, the molecular characteristics related to impaired metabolism leading to the initiation of RCC are still not very clear. In this study, two-dimensional electrophoresis (2-DE) and mass spectra (MS) technologies were utilized to identify the proteins involved in energy metabolism of RCC. A total of 73 proteins that were differentially expressed in conventional RCC, in comparison with the corresponding normal kidney tissues, were identified. Bioinformatics analysis has shown that these proteins are involved in glycolysis, urea cycle, and the metabolic pathways of pyruvate, propanoate, and arginine/proline. In addition, some were also involved in the signaling network of p53 and FAS. These results provide some clues for new therapeutic targets and treatment strategies of RCC.
Keywords: renal cell cancer, metabolism, two-dimensional electrophoresis, proteome
Introduction
The early stage diagnosis of renal cell carcinoma (RCC) in many countries is probably associated with the observed plateau in RCC mortality in the US and in many European countries. Nevertheless, ~50% of patients diagnosed across all stages of this disease die within the first 5 years after diagnosis.1,2 Conventional chemotherapy and radiotherapy does not exert a significant long-term benefit on RCC; instead, it has been found to decrease the length or quality of life. RCC is not a single disease; rather, it is a compilation of several types of cancer that occur in the kidney. The poor prognosis of RCC is largely due to the effects of different oncogenes, each having a different histology and response to therapy.3 Metabolic control analysis is useful in assessing the influence of metabolic pathways on the course and treatment of complex diseases.4,5 Since the metabolic environment influences the rate-controlling steps of enzymes in metabolic pathways, the management of complex disease phenotypes is largely dependent on the expression of the entire collection of genes involved than on any particular gene or enzyme.6,7 This means that the management of complex disease phenotypes relies on a collection of system-wide interconnected processes that involve glycolysis and respiration. Successful manipulations of metabolic networks can lead to restoration of order and adaptive behavior in disordered states that involve complex gene–environment interactions.8,9
Metabolic control analysis is especially important in kidney cancer management, because disorder and abnormal energy metabolism are characteristics of RCC.10 However, there are few specific studies that identify the tumor-related metabolic proteins in RCC. In the present study, a comprehensive bioinformatics approach was applied to tissue proteomic data to identify those metabolic steps and networks that have a role in RCC onset and development. In kidney cancer, the expression of proteins involved in metabolism, cell growth, morphology, and the heat shock response is deregulated. Therefore, we hypothesize that the defects in identified pathways should serve as targets for the development of effective and long-lasting kidney cancer therapies that will be superior to those presently in use.
Materials and methods
Tissue samples
Surgical specimens of five patients from the Navy General Hospital, obtained after radical nephrectomy, were used to prepare tissue samples of conventional RCC and the surrounding noncancerous kidney tissues. The mean age of the patients was 55.8 years. The tumor stage of the patients ranged from pT1 to pT3. Macroscopic cell type of samples (benign or cancer) was examined histologically. The tumor stage was determined according to the 1997 TNM (tumor, node, metastasis) criteria. The samples were not necrotic. Table 1 shows a summary of detailed clinicopathologic data of patients included in the study. Institutional Ethics Committee of the Navy General Hospital approved this project, and informed consent were obtained from all patients, or their relatives, prior to commencing the study. A pathologist examined all specimens. The samples were immediately frozen in liquid nitrogen and stored at −80°C until use.
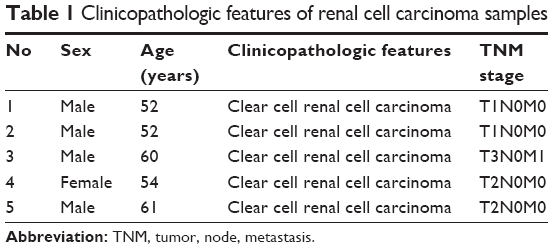 | Table 1 Clinicopathologic features of renal cell carcinoma samples |
2-DE and image analysis
Two-dimensional electrophoresis (2-DE) was performed as described previously.11 Briefly, cells were lysed in the lysis buffer (8 M urea, 2 M thiourea, 4% CHAPS, 100 mM DTT, and 0.2% pH 3–10 ampholyte; Bio-Rad Laboratories Inc., Hercules, CA, USA) containing a protease inhibitor. After sonication and centrifugation, the supernatant was retrieved, and protein concentrations were determined using the DC protein assay kit (Bio-Rad Laboratories Inc.). Protein samples (1 mg) were applied to a immobilized pH gradient strip (17 cm, pH 3–10 non-linear [NL], Bio-Rad Laboratories Inc.) using a passive rehydration method. For the second dimension, a 30 mA constant current was applied to 12% sodium dodecyl sulfate polyacrylamide gel electrophoresis gel after isoelectric focusing and equilibration. The gels were stained using CBB R-250 (EMD Millipore, Billerica, MA, USA) and scanned with a Bio-Rad GS-800 scanner (Bio-Rad Laboratories Inc.). The 2-DE analyses were independently repeated three times. The maps were analyzed by PDQuest software, Version 6.1 (Bio-Rad Laboratories Inc.). The quantity of each spot in the gel was normalized as the percentage of the total quantity of all spots in that gel and evaluated in terms of optical density (OD). The paired t-test was performed to compare the data from three repeated experiments. Only those spots that showed consistent and significant differences (>1.5-fold, P<0.05) were selected for further analysis with mass spectra (MS).
In-gel digestion
In-gel digestion of proteins was performed using mass spectrometry grade Trypsin Gold (Promega Corporation, Madison, WI, USA). Briefly, the spots were cut out of the gel (1–2 mm diameter) using a razor blade and destained twice with 100 mM NH4HCO3/50% acetonitrile (ACN) at 37°C for 45 minutes in each treatment. After drying, the gels were preincubated in 10–20 μL trypsin solution for 1 hour. Following, 15 μL digestion buffer was added (40 mM NH4HCO3/10% ACN) to cover each gel and incubated overnight at 37°C. Tryptic digests were extracted using Milli-Q water initially, followed by two 1 hour repeat extractions with 50% ACN/5% trifluoroacetic acid. The combined extracts were dried in a vacuum concentrator at room temperature. The samples were then subjected to mass spectrometric analysis.
MS/MS analysis and protein identification
Mass spectra were acquired using a quadrupole time-of-flight mass spectrometer (Micromass, Manchester, UK) fitted with an electrospray ionization or matrix-assisted laser desorption/ionization source (Micromass). The MS/MS analysis was performed as described previously.12 The MS/MS data were acquired and processed using MassLynx V 4.1 software (Micromass) and converted to PKL performed using ProteinLynx 2.2.5 software (Waters Corp, Milford, MA, USA). The pkl files were analyzed using the MASCOT search engine (http://www.matrixscience.com). The following search parameters were used: database, Swiss-Prot, taxonomy, Homo sapiens, enzyme, and trypsin. One missed cleavage was allowed. Carbamidomethylation was selected as a fixed modification, and oxidation of methionine was set as the variable. The peptide and fragment mass tolerance were set at 0.1 Da and 0.05 Da, respectively. Positively identified proteins had at least one peptide exceeding their score threshold (P<0.05), and their molecular weight and isoelectric point consistent with the gel regions from which the spots were excised. The spectra of proteins identified by a single peptide, and with a score >40 (lower were discarded) were manually inspected.
Immunoblot
The radioimmunoprecipitation assay lysis buffer (50 mM Tris-HCl [pH 7.4], 1% NP-40, 0.25% Na-deoxycholate, 150 mM NaCl, 1 mM ethylenediaminetetraacetic acid, 1 mM phenylmethylsulfonyl fluoride, 1 mg/mL aprotinin, 1 mM Na3VO4, and 1 mM NaF) was used to break open the cells. The proteins were then suspended in the Lammli sample buffer and centrifuged at 15,000 rpm for 30 minutes. The supernatant was recovered for analysis. Each protein sample of 10 μg was loaded per well and separated with 12.5% sodium dodecyl sulfate polyacrylamide gel electrophoresis. The proteins inside the gel were electroblotted onto polyvinylidene fluoride membranes (EMD Millipore) by wet blotting. After incubation in the blocking buffer (1× Tris-buffered saline, 0.1% Tween-20, and 5% w/v dry nonfat milk) for 1 hour at room temperature, the membranes were incubated by primary antibodies. Following, the membrane were incubated with secondary antibodies for 45 minutes at room temperature. Enhanced chemiluminescence was used to detect reactive bands (Amersham Biosciences Corp, Piscataway, NJ, USA).
Bioinformatics and statistical analysis
Gene Ontology search was used to (www.geneontology.org) classify and determine the functions of identified proteins. Pathway data were obtained from the Kyoto Encyclopedia of Genes and Genomes (http://www.genome.jp/kegg) – a collection of online databases dealing with genomes, enzymatic pathways, and biological chemicals.13 Protein–protein interactions were identified with the search tool STRING database. Both direct (physical) and indirect (functional) protein associations were examined.14,15
The two-tailed Student’s t-test was used to determine the significant differences between the control and the exposure groups. Statistical analysis was performed using SPSS 16.0 software (SPSS Inc., Chicago, IL, USA), and P<0.05 was considered statistically significant.
Results
2-DE profiling of differentially expressed proteins
Protein expression in RCC tissues and the corresponding normal kidney tissues was examined by 2-DE. Figure 2 shows a pair of representative 2-DE maps. Proteins extracted from RCC tissues and the corresponding normal kidney tissues was resolved by 2-DE and visualized by CBB R-250 staining. Those protein spots with a P-value <0.05 according to the Student’s t-test and reproducible changes in intensity >1.5-fold were identified. The analysis resulted in a total of 90 protein spots that were differentially expressed between RCC tissues and the corresponding normal kidney tissues; of those, 73 proteins were successfully identified by MS/MS (Table 2). Twenty-six proteins were downregulated and 47 proteins were upregulated in RCC tissues (Figures 1 and 2).
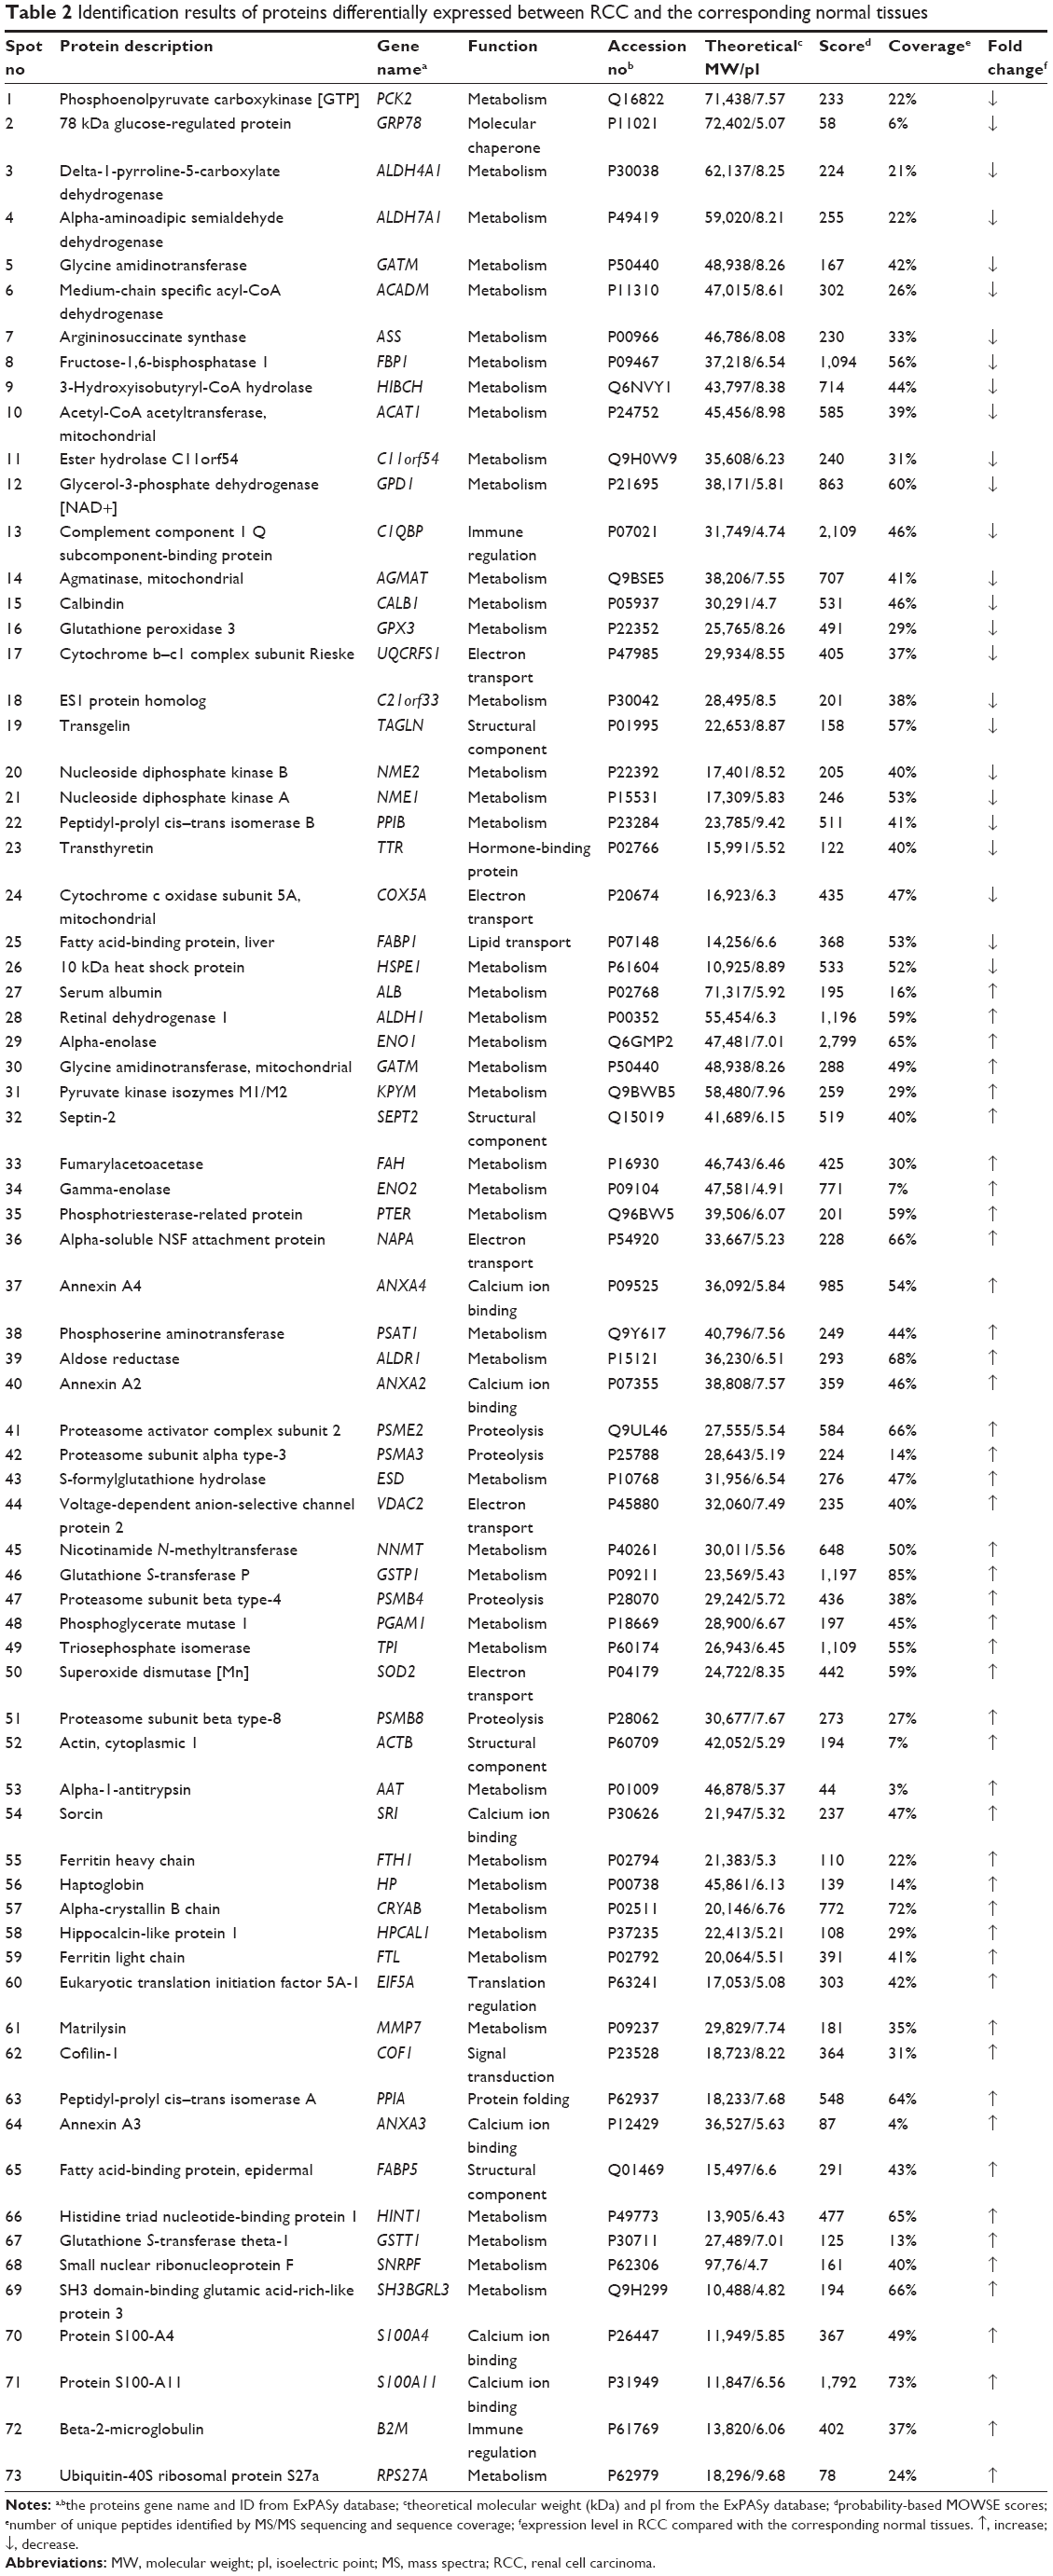 | Table 2 Identification results of proteins differentially expressed between RCC and the corresponding normal tissues |
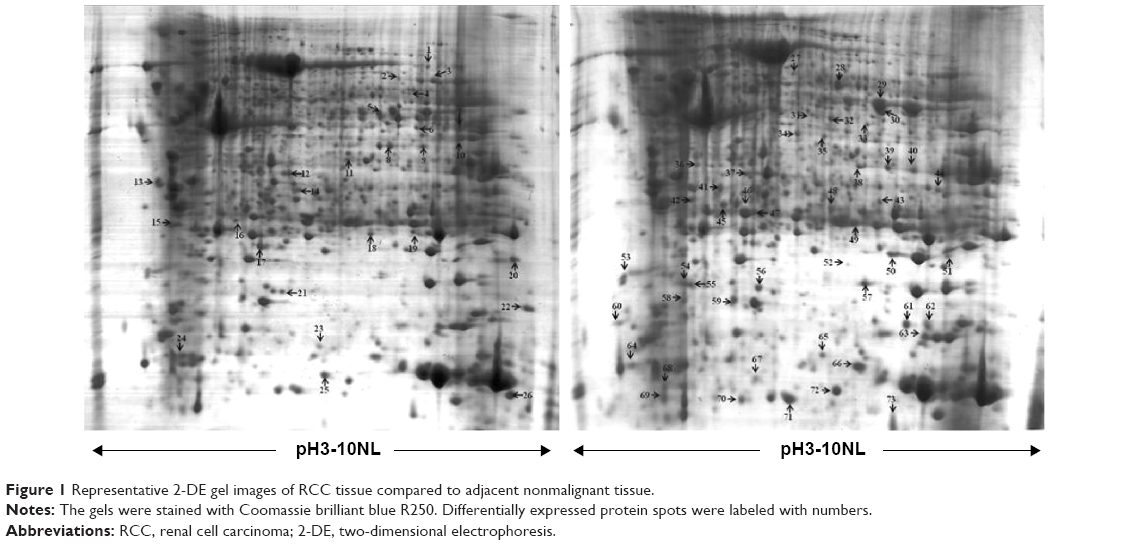 | Figure 1 Representative 2-DE gel images of RCC tissue compared to adjacent nonmalignant tissue. |
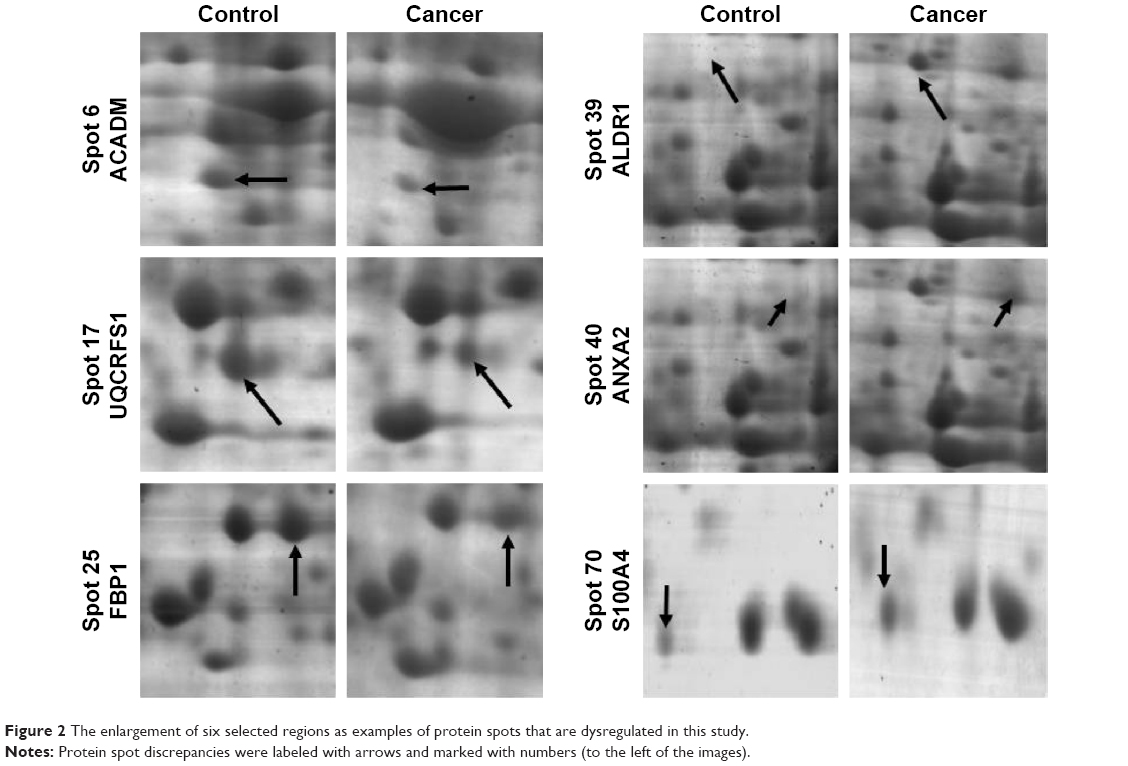 | Figure 2 The enlargement of six selected regions as examples of protein spots that are dysregulated in this study. |
Protein identification and functional classification
Seventy-three proteins were identified (Figure 1) and are listed Table 2. The MS/MS data, which included the mass and intensity values, and the charge of the precursor ions, were compared against the SWISS-PROT protein database using a licensed copy of the MASCOT 2.0 program. Figure 3 shows a representative MS/MS map of spot #9. Among them, HIBCH was downregulated in RCC tissues in comparison with the adjacent nonmalignant tissues (P<0.05). Furthermore, MS/MS analysis revealed 12 matching peptides, with 44% sequence coverage and a MOWSE score of 714 (Figure 3).
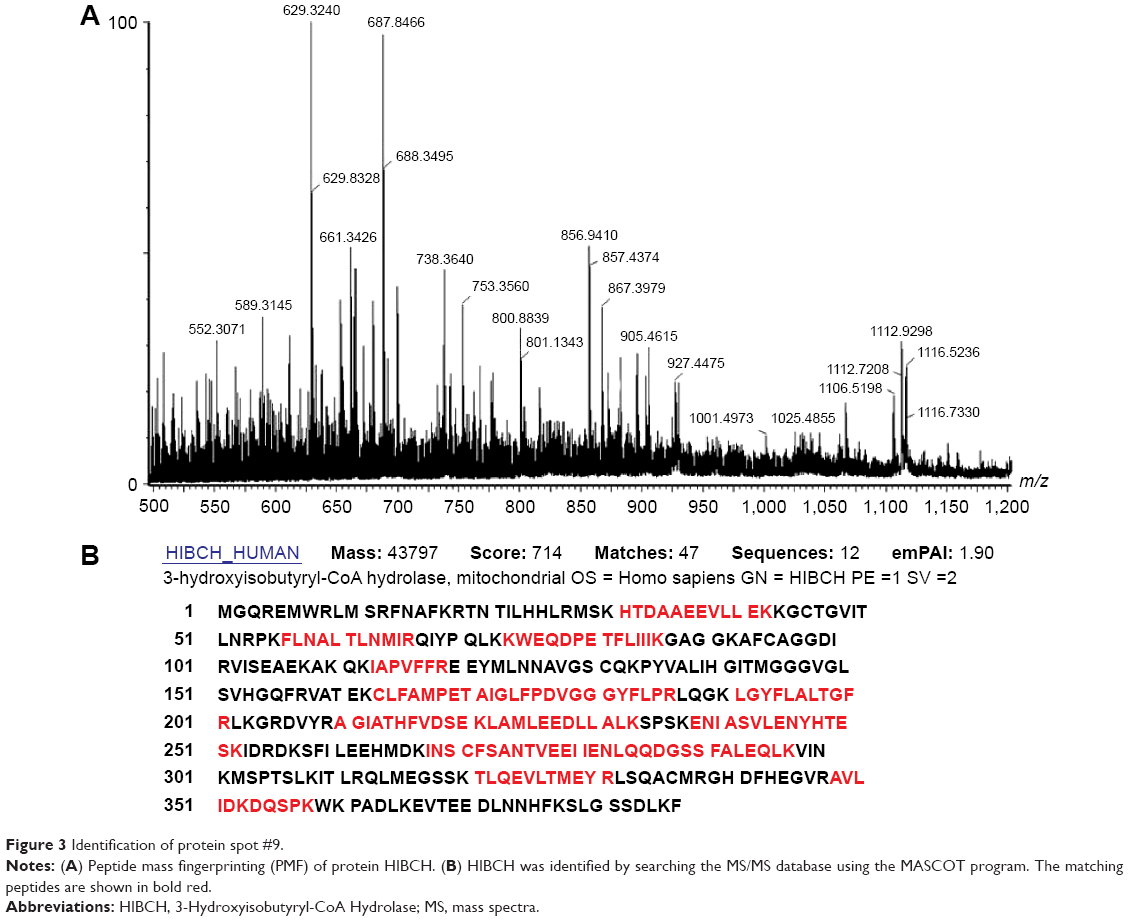 | Figure 3 Identification of protein spot #9. |
Immunoblotting validation for differentially expressed proteins
Two altered proteins, EIF5A and PKM2, were further validated by Western blotting. As shown in Figure 4, EIF5A and PKM2 were upregulated in RCC tissue in comparison with adjacent nonmalignant tissue, which was consistent with the 2-DE results (P<0.05).
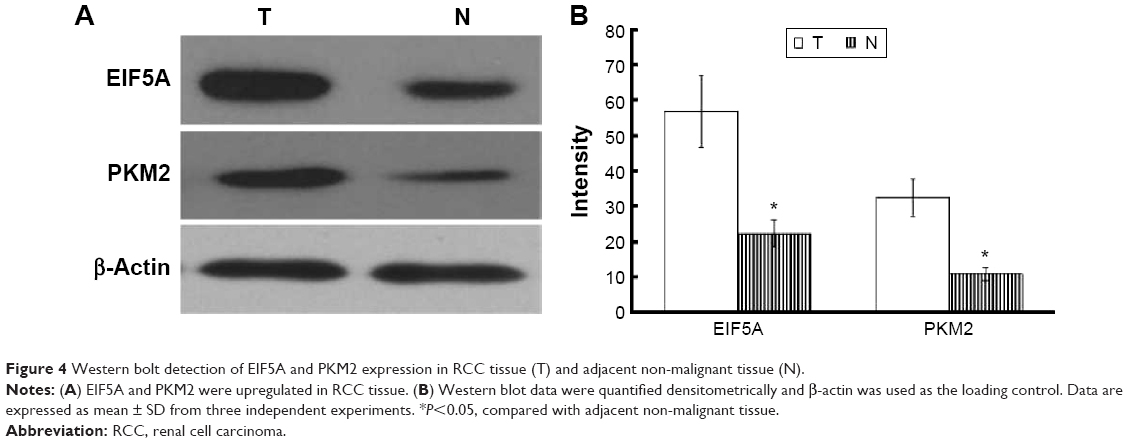 | Figure 4 Western bolt detection of EIF5A and PKM2 expression in RCC tissue (T) and adjacent non-malignant tissue (N). |
Network, pathway, and process analyses of significantly changed proteins
Table 2 lists differentially expressed proteins in RCC and the corresponding normal tissues, as confirmed by mass spectrometry. Their molecular function and biological processes are included in Table 2. Interactions exist among these proteins, and most of them are a part of a biological network, as illustrated by STRING (Figure 5). Out of 73 identified proteins, 63 were interconnected and ten proteins did not show any type of connection at the selected confidence level (STRING score =0.4). The following significant functions are associated with this network of proteins: metabolism, transcription, proteolysis, electron transport, and molecular chaperoning. ENO1, ENO2, AKR1A1, PGAM1, and PGA are important proteins in gluconeogenesis, while PSME2, PSMA3, PSMB4, and PSMB8 are involved in proteasome-related proteolysis. The proteins were divided into several classes as a result of bioinformatic analysis based on the Kyoto Encyclopedia of Genes and Genomes pathway, which included: gluconeogenesis, the urea cycle and amino acid metabolism, proteasome, fatty acid metabolism, glutathione (GSH) metabolism, and so forth (Table 3).
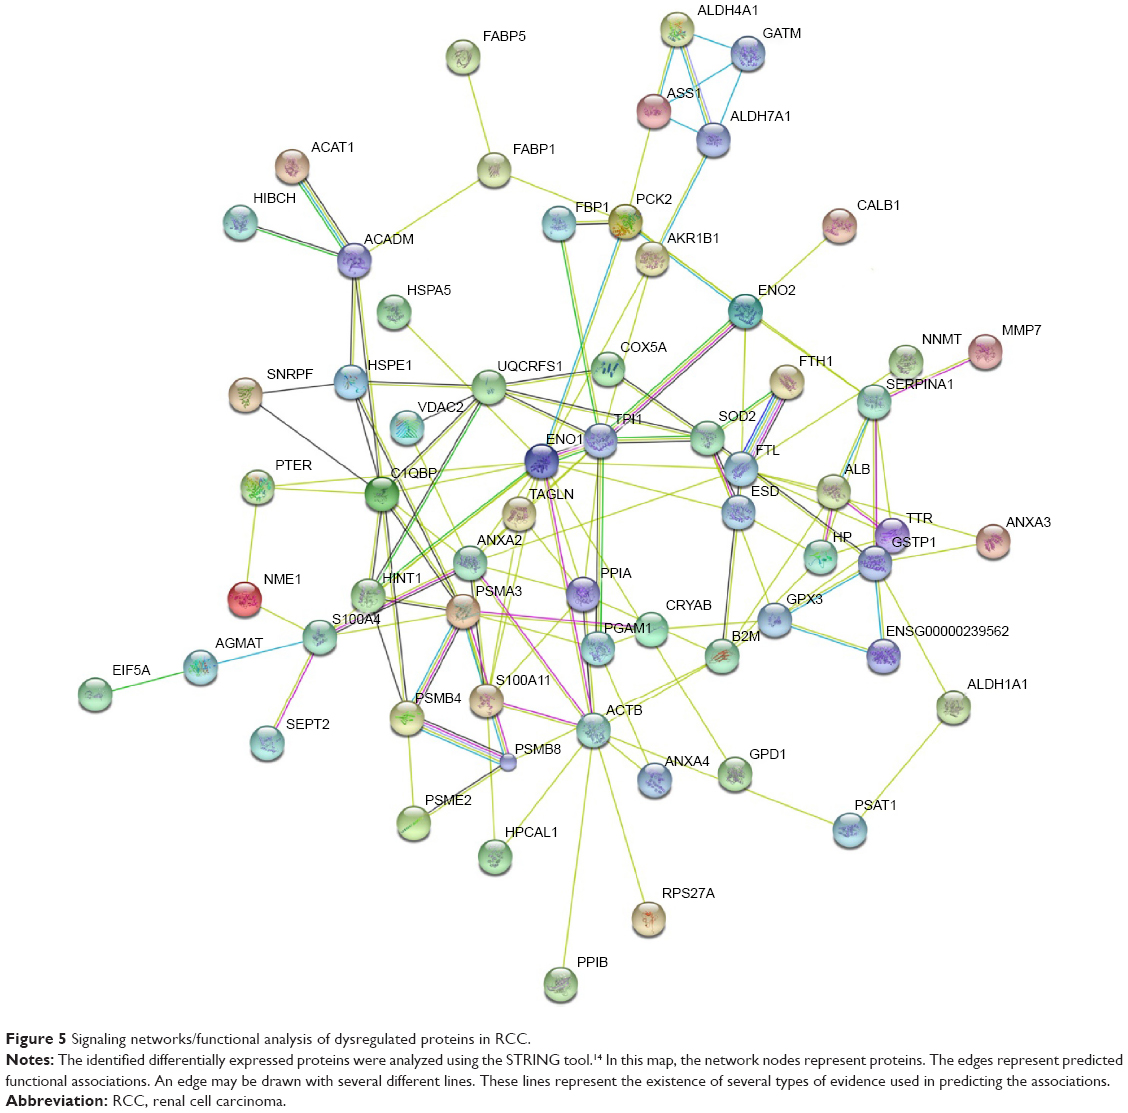 | Figure 5 Signaling networks/functional analysis of dysregulated proteins in RCC. |
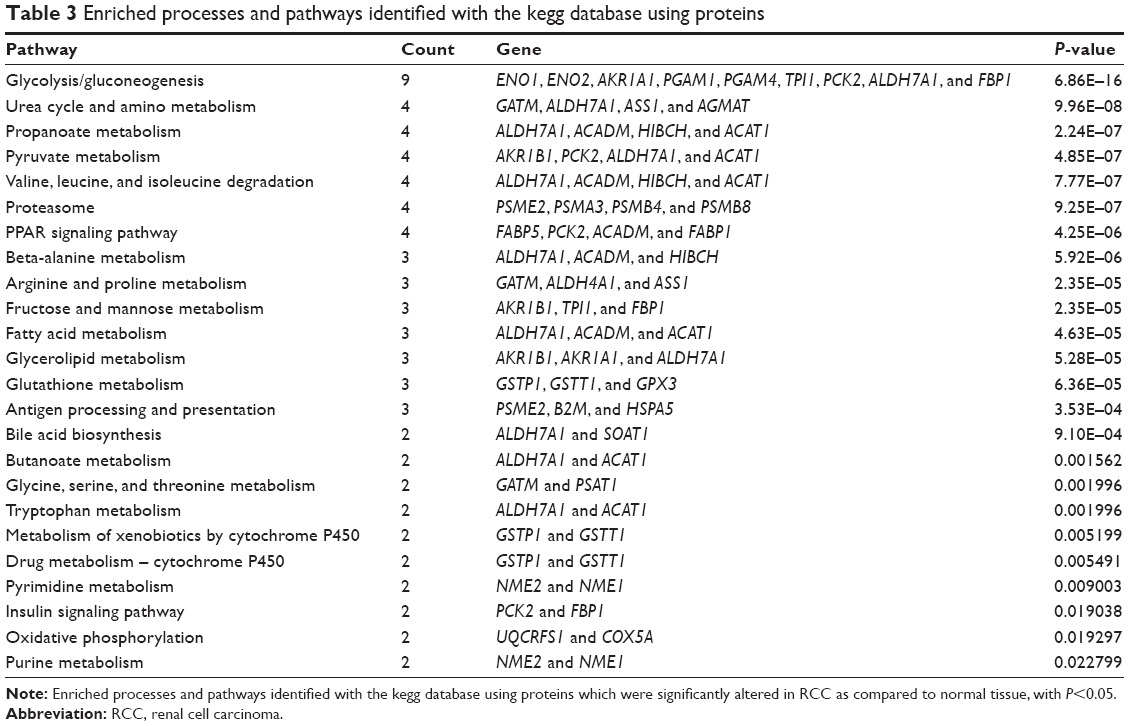 | Table 3 Enriched processes and pathways identified with the kegg database using proteins |
Discussion
Identifying the changes in protein expression in cancer cells is a useful predictor of potential changes in the functional pathways, which are, in turn, directly related to the basic mechanism of cancer onset and progression. Analysis at the proteome level enables the identification of proteins that are differentially expressed in RCC and adjacent normal tissues. These RCC-specific protein biomarkers might facilitate more efficient subclassification and early diagnosis of RCC.16,17 In this study, we analyzed the expression of proteins in eleven pairs of RCC tissues and matching normal kidney tissues from RCC patients utilizing two-dimensional electrophoresis and matrix-assisted laser desorption/ionization time-of-flight mass spectrometry. We found that 47 proteins were overexpressed and 26 proteins underexpressed in RCC. An altered expression of some of these proteins has previously been observed in RCC.18 The analysis of biochemical pathways conducted in this study has led to identification of protein networks, which play important roles in oncogenesis or progression of clear cell RCC (ccRCC).
The finding that glycolysis enzyme levels are most significantly altered in ccRCC is in accordance with the results of other independent studies conducted in different types of cancers.19–21 Increased aerobic glycolysis in cancer, a phenomenon known as the Warburg effect, is characterized by increased metabolism of glucose to lactate in the presence of sufficient oxygen. There is a strong connection between this effect and malignant transformation, as evidenced from studies conducted on various tumor cells.22–24 p53 and c-myc are considered to be the key tumor genes and the master regulators of metabolism.25,26 The pyruvate kinase (PK) gene, which encodes a protein that converts phosphoenolpyruvate to pyruvate with release of an adenosine triphosphate, is the target gene of Myc and HIF-1.27 The dimeric form of M2-PK is another protein specific for tumor cells (known as tumor M2-PK), the dimerization seems to be caused by the interaction of M2-PK with certain oncoproteins. It is believed that this adaptive mechanism allows tumor cells to survive in environments where the levels of oxygen and nutrients are not constant.28 The interconversion of glycerate-3-phosphate and glycerate-2-phosphate is catalyzed by the glycolytic enzyme phosphoglycerate mutase, while enolase catalyzes the conversion of 2-phosphoglycerate to phosphoenolpyruvate. The expression of enolase is regulated both developmentally and specifically within the tissues. Proteome analysis reported in a recent study has shown that both phosphoglycerate mutase and enolase seem to be differentially overexpressed in human lung squamous carcinoma. Our data suggest that anaerobic glycolysis-related enzyme PK, enolase, is upregulated, whereas the other carbohydrate metabolism-related enzymes, phosphoenolpyruvate carboxy kinase (PCK2) and acetyl-CoA acetyltransferase (ACAT1), are downregulated in RCC, which is consistent with the results from other laboratories.29,30 Recently, the role of agents targeting glycolytic activity and glycolysis-linked metabolic processes is being studied for reversal of Warburg effect.31,32 Proteasomes and ubiquitin (Ub) are key participants of the energy-dependent, nonlysosomal proteolytic pathway. Previous studies have indicated that cell proliferation and apoptosis are regulated by the Ub–proteasome system. The research community is focusing its efforts on identifying the potential role of certain proteasome inhibitors to act as novel anticancer agents.33 In this work, Ubiquitin-40S ribosomal protein S27a and four members of the proteasome family, PSME2, PSMA3, PSMB4, and PSMB8 were highly expressed in RCC, which is consistent with one previous study.34 Other studies have suggested that proteasomes and Ub also have important roles in various nonproteolytic functions. Proteasomes are thought to regulate the translational activities of cytoplasmic mRNAs.35 Ub has been found to have many apparently distinct roles, such as DNA repair, cell cycle progression, modification of polypeptide receptors, and biogenesis of ribosomes.36,37
GSH has multiple roles in the body; it is involved in cell differentiation, proliferation, and apoptosis, as well as antioxidant defense and nutrient metabolism.38 It has been shown that enzymes involved in GSH metabolism, particularly glutathione S-transferase and glutathione peroxidase, play a role in multistage carcinogenesis.39 Our results point to significant variations in the GSH-dependent enzyme activity in RCC and support the finding that GSH metabolism is important in RCC onset and progression. Because they have high energy demands, cancer cells are forced to tap into alternative sources of energy, such as fatty acid oxidation and other nonglycolytic pathways. Our findings suggest that the products of fatty acid metabolism have a key role in RCC metabolism. Fatty acid-binding proteins (FABPs) are involved in lipid metabolism, regulation of gene expression, cell signaling, cell growth, and differentiation.40 Moreover, FABPs also have an important role in carcinogenesis.41 Studies identifying FABP as tumor markers of RCC emphasize the significant role of fatty acid metabolism in the biology of RCC.42,43 In comparison with normal tissues, we found that liver-type FABP was expressed at lower rates in 53% of all tumors, which is consistent with the findings from other studies.44
The results of this study indicate that other pathways closely associated with gluconeogenesis, such as the urea cycle, pyruvate, pentanoate, and butanoate metabolism, as well as arginine and proline metabolism, are downregulated in ccRCC. In contrast, an increase in one of the key glycolytic enzymes, pyruvate, was observed.
Our study outlines the metabolic phenotype of RCC tissue in detail. Using proteomic analysis to determine which pathways and processes are likely involved in kidney cancer, we found that the glycolysis pathway is significantly altered in ccRCC. Alterations to these pathways will allow clinicians to identify those molecules that affect metabolic regulation, such as activators or inhibitors of HIF-1, mTOR, and AMP kinase, as well as assess the effectiveness of therapy at the molecular level.
Disclosure
The authors report no conflicts of interest in this work.
References
Chow WH, Dong LM, Devesa SS. Epidemiology and risk factors for kidney cancer. Nat Rev Urol. 2010;7:245–257. | ||
Cho E, Adami HO, Lindblad P. Epidemiology of renal cell cancer. Hematol Oncol Clin North Am. 2011;25:651–665. | ||
Linehan WM, Walther MM, Zbar B. The genetic basis of cancer of the kidney. J Urol. 2003;170:2163–2172. | ||
Veech RL. The therapeutic implications of ketone bodies: the effects of ketone bodies in pathological conditions: ketosis, ketogenic diet, redox states, insulin resistance, and mitochondrial metabolism. Prostaglandins Leukot Essent Fatty Acids. 2004;70:309–319. | ||
Greene AE, Todorova MT, Seyfried TN. Perspectives on the metabolic management of epilepsy through dietary reduction of glucose and elevation of ketone bodies. J Neurochem. 2003;86:529–537. | ||
Strohman R. Maneuvering in the complex path from genotype to phenotype. Science. 2002;296:701–703. | ||
Merida I, Avila-Flores A. Tumor metabolism: new opportunities for cancer therapy. Clin Transl Oncol. 2006;8:711–716. | ||
Moreno-Sánchez R, Rodríguez-Enríquez S, Marín-Hernández A, Saavedra E. Energy metabolism in tumor cells. FEBS J. 2007;274:1393–1418. | ||
Locasale JW, Cantley LC. Altered metabolism in cancer. BMC Biol. 2010;8:88. | ||
Linehan WM, Srinivasan R, Schmidt LS. The genetic basis of kidney cancer: a metabolic disease. Nat Rev Urol. 2010;7:277–285. | ||
Lu ZJ, Liu SY, Yao YQ, et al. The effect of miR-7 on behavior and global protein expression in glioma cell lines. Electrophoresis. 2011;32:3612–3620. | ||
Lu ZJ, Song QF, Jiang SS, et al. Identification of ATP synthase beta subunit (ATPB) on the cell surface as a non-small cell lung cancer (NSCLC) associated antigen. BMC Cancer. 2009;9:16. | ||
Kanehisa M. Molecular network analysis of diseases and drugs in KEGG. Methods Mol Biol. 2013;939:263–275. | ||
Franceschini A, Szklarczyk D, Frankild S, et al. STRING v9.1: protein-protein interaction networks, with increased coverage and integration. Nucleic Acids Res. 2013;41:D808–D815. | ||
Yuan Y, Xue L, Fan H. Screening of differentially expressed genes related to esophageal squamous cell carcinoma and functional analysis with DNA microarrays. Int J Oncol. 2014;44:1163–1170. | ||
Hwa JS, Park HJ, Jung JH, et al. Identification of proteins differentially expressed in the conventional renal cell carcinoma by proteomic analysis. J Korean Med Sci. 2005;20:450–455. | ||
Aggelis V, Craven RA, Peng J, et al. Proteomic identification of differentially expressed plasma membrane proteins in renal cell carcinoma by stable isotope labelling of a von Hippel-Lindau transfectant cell line model. Proteomics. 2009;9:2118–2130. | ||
Linehan WM, Bratslavsky G, Pinto PA, et al. Molecular diagnosis and therapy of kidney cancer. Annu Rev Med. 2010;61:329–343. | ||
Pelicano H, Martin DS, Xu RH, Huang P. Glycolysis inhibition for anticancer treatment. Oncogene. 2006;25:4633–4646. | ||
Hammoudi N, Ahmed KB, Garcia-Prieto C, Huang P. Metabolic alterations in cancer cells and therapeutic implications. Chin J Cancer. 2011;30:508–525. | ||
Sinreih M, Hevir N, Rizner TL. Altered expression of genes involved in progesterone biosynthesis, metabolism and action in endometrial cancer. Chem Biol Interact. 2013;202:210–217. | ||
Chen Z, Lu W, Garcia-Prieto C, Huang P. The Warburg effect and its cancer therapeutic implications. J Bioenerg Biomembr. 2007;39:267–274. | ||
Lopez-Lazaro M. The Warburg effect: why and how do cancer cells activate glycolysis in the presence of oxygen? Anticancer Agents Med Chem. 2008;8:305–312. | ||
Bensinger SJ, Christofk HR. New aspects of the Warburg effect in cancer cell biology. Semin Cell Dev Biol. 2012;23:352–361. | ||
Wu W, Zhao S. Metabolic changes in cancer: beyond the Warburg effect. Chin J Biochem Biophys. 2013;45:18–26. | ||
Guihard S, Ramolu L, Macabre C, et al. The NEDD8 conjugation pathway regulates p53 transcriptional activity and head and neck cancer cell sensitivity to ionizing radiation. Int J Oncol. 2012;41:1531–1540. | ||
Dang CV, Hamaker M, Sun P. Therapeutic targeting of cancer cell metabolism. J Mol Med. 2011;89:205–212. | ||
Diaz-Ruiz R, Uribe-Carvajal S, Devin A, Rigoulet M. Tumor cell energy metabolism and its common features with yeast metabolism. Biochim Biophys Acta. 2009;1796:252–265. | ||
Perego RA, Bianchi C, Corizzato M, et al. Primary cell cultures arising from normal kidney and renal cell carcinoma retain the proteomic profile of corresponding tissues. J Proteome Res. 2005;4:1503–1510. | ||
Perroud B, Lee J, Valkova N, et al. Pathway analysis of kidney cancer using proteomics and metabolic profiling. Mol Cancer. 2006;5:64. | ||
Zhao Y, Liu H, Riker AI, et al. Emerging metabolic targets in cancer therapy. Front Biosci. 2011;16:1844–1860. | ||
Zhang Y, Yang JM. Altered energy metabolism in cancer: a unique opportunity for therapeutic intervention. Cancer Biol Ther. 2013;14:81–89. | ||
An J, Sun Y, Fisher M, Rettig MB. Maximal apoptosis of renal cell carcinoma by the proteasome inhibitor bortezomib is nuclear factor-kappaB dependent. Mol Cancer Ther. 2004;3:727–736. | ||
Kanayama H, Tanaka K, Aki M, et al. Changes in expressions of proteasome and ubiquitin genes in human renal cancer cells. Cancer Res. 1991;51:6677–6685. | ||
Issaenko OA, Bitterman PB, Polunovsky VA, Dahlberg PS. Cap-dependent mRNA translation and the ubiquitin-proteasome system cooperate to promote ERBB2-dependent esophageal cancer phenotype. Cancer Gene Ther. 2012;19:609–618. | ||
Nakamura M, Tanigawa Y. Biochemical analysis of the receptor for ubiquitin-like polypeptide. J Biol Chem. 1999;274:18026–18032. | ||
Vaziri SA, Grabowski DR, Hill J, et al. Inhibition of proteasome activity by bortezomib in renal cancer cells is p53 dependent and VHL independent. Anticancer Res. 2009;29:2961–2969. | ||
Franco R, Schoneveld OJ, Pappa A, Panayiotidis MI. The central role of glutathione in the pathophysiology of human diseases. Arch Physiol Biochem. 2007;113:234–258. | ||
Lusini L, Tripodi SA, Rossi R, et al. Altered glutathione anti-oxidant metabolism during tumor progression in human renal-cell carcinoma. Int J Cancer. 2001;91:55–59. | ||
Dutta-Roy AK. Cellular uptake of long-chain fatty acids: role of membrane-associated fatty-acid-binding/transport proteins. Cell Mol Life Sci. 2000;57:1360–1372. | ||
Ohlsson G, Moreira JM, Gromov P, Sauter G, Celis JE. Loss of expression of the adipocyte-type fatty acid-binding protein (A-FABP) is associated with progression of human urothelial carcinomas. Mol Cell Proteomics. 2005;4:570–581. | ||
Teratani T, Domoto T, Kuriki K, et al. Detection of transcript for brain-type fatty acid-binding protein in tumor and urine of patients with renal cell carcinoma. Urology. 2007;69:236–240. | ||
Forootan FS, Forootan SS, Malki MI, et al. The expression of C-FABP and PPARgamma and their prognostic significance in prostate cancer. Int J Oncol. 2014;44:265–275. | ||
Tölle A, Suhail S, Jung M, Stephan C. Fatty acid binding proteins (FABPs) in prostate, bladder and kidney cancer cell lines and the use of IL-FABP as survival predictor in patients with renal cell carcinoma. BMC Cancer. 2011;11:302. |
 © 2016 The Author(s). This work is published and licensed by Dove Medical Press Limited. The full terms of this license are available at https://www.dovepress.com/terms.php and incorporate the Creative Commons Attribution - Non Commercial (unported, v3.0) License.
By accessing the work you hereby accept the Terms. Non-commercial uses of the work are permitted without any further permission from Dove Medical Press Limited, provided the work is properly attributed. For permission for commercial use of this work, please see paragraphs 4.2 and 5 of our Terms.
© 2016 The Author(s). This work is published and licensed by Dove Medical Press Limited. The full terms of this license are available at https://www.dovepress.com/terms.php and incorporate the Creative Commons Attribution - Non Commercial (unported, v3.0) License.
By accessing the work you hereby accept the Terms. Non-commercial uses of the work are permitted without any further permission from Dove Medical Press Limited, provided the work is properly attributed. For permission for commercial use of this work, please see paragraphs 4.2 and 5 of our Terms.