")
Back to Journals » Drug Design, Development and Therapy » Volume 13
Metabolism of remimazolam in primary human hepatocytes during continuous long-term infusion in a 3-D bioreactor system
Authors Freyer N, Knöspel F , Damm G, Greuel S, Schneider C, Seehofer D, Stöhr T, Petersen KU , Zeilinger K
Received 7 September 2018
Accepted for publication 18 January 2019
Published 2 April 2019 Volume 2019:13 Pages 1033—1047
DOI https://doi.org/10.2147/DDDT.S186759
Checked for plagiarism Yes
Review by Single anonymous peer review
Peer reviewer comments 3
Editor who approved publication: Dr Sukesh Voruganti
Nora Freyer,1 Fanny Knöspel,1 Georg Damm,2 Selina Greuel,1 Christin Schneider,1 Daniel Seehofer,2 Thomas Stöhr,3 Karl-Uwe Petersen,3 Katrin Zeilinger1
1Berlin Brandenburg Center for Regenerative Therapies (BCRT), Charité – Universitätsmedizin Berlin, Berlin 13353, Germany; 2Department of Hepatobiliary Surgery and Visceral Transplantation, University of Leipzig, Leipzig 04103, Germany; 3PAION Deutschland GmbH (Non-clinical development), Aachen 52062, Germany
Background: Remimazolam is an ultra-short acting benzodiazepine under development for procedural sedation and general anesthesia. It is hydrolyzed by CES1 to an inactive metabolite (CNS7054).
Purpose: In this study, the effect of continuous remimazolam exposure on its metabolism and on CES1 expression was investigated in a dynamic 3-D bioreactor culture model inoculated with primary human hepatocytes.
Methods: Remimazolam was continuously infused into bioreactors for 5 days at a final concentration of 3,000 ng/ml (6.8 µM). In parallel, 2-D cultures were run with cells from the same donors, but with discontinuous exposure to remimazolam.
Results: Daily measurement of clinical chemistry parameters (glucose, lactate, urea, ammonia, and liver enzymes) in culture supernatants indicated no noxious effect of remimazolam on hepatocyte integrity as compared to untreated controls. Concentrations of remimazolam reached steady-state values of around 250 ng/ml within 8 hours in 3-D bioreactors whereas in 2-D cultures remimazolam concentrations declined to almost zero within the same time frame. Levels of CNS7054 showed an inverse time-course reaching average values of 1,350 ng/ml in perfused 3-D bioreactors resp. 2,800 ng/ml in static 2-D cultures. Analysis of mRNA expression levels of CES1 indicated no changes in gene expression over the culture period.
Conclusion: The results indicated a stable metabolism of remimazolam during 5 days of continuous exposure to clinically relevant concentrations of the drug. Moreover, there was no evidence for a harmful effect of remimazolam exposure on the integrity and metabolic activity of in vitro cultivated primary human hepatocytes.
Keywords: benzodiazepine, metabolite, CNS7054, carboxylesterase 1, steady state
Introduction
Remimazolam is a new ultrashort-acting benzodiazepine developed for use in sedation and anesthesia. Its sedative effect is caused by γ-aminobutyric acid–receptor modulation, similarly to other sedatives. The drug contains a metabolically labile ester moiety and is rapidly hydrolyzed by tissue esterases.1 In the liver, hydrolysis is mainly catalyzed by CES12 resulting in an inactive carboxylic acid metabolite (CNS7054, Figure 1). This mechanism is responsible for the ultrashort action of the drug, similar to the tandem fentanyl–remifentanil. To date, four clinical trials for procedural sedation have been published, showing a favorable safety profile for remimazolam with rapid sedation and recovery.3–6 However, exposure to remimazolam for >24 hours in an intensive care unit was associated with higher plasma concentrations than known from healthy volunteers, consistent with the possibility (reported for other drugs) that prolonged exposure under traumatizing conditions may favor metabolic alterations.7 Since the liver is the main site of CES1 expression,2 alterations in hepatic functionality and CES1 expression might lead to drug accumulation after long-term exposure.
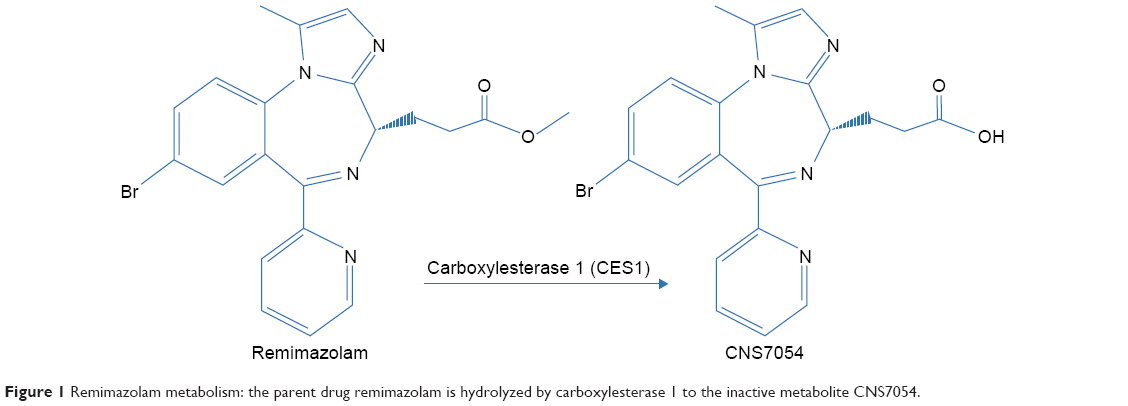 | Figure 1 Remimazolam metabolism: the parent drug remimazolam is hydrolyzed by carboxylesterase 1 to the inactive metabolite CNS7054. |
In order to test the long-term stability of human remimazolam metabolism and elucidate possible effects of prolonged drug application on hepatic functionality, we used an in vitro model of primary human liver cells cultured in a perfused 3-D bioreactor system, which enables extended preservation of cell functionality. This bioreactor system consists of a capillary network enabling countercurrent medium perfusion, decentralized oxygenation, and CO2 removal, while providing a scaffold for adherence and reorganization of inoculated liver cells similar to the in vivo environment.8 The bioreactor was originally developed for extracorporeal liver support and successfully applied in a pilot study to support patients suffering from liver failure.9 In a further approach, the bioreactor was downscaled to analytical-scale variants to enable its application for pharmacological in vitro studies.10,11 The suitability of the bioreactor technology to assess human-liver drug metabolism and toxicity in vitro has been shown using different model drugs, such as paracetamol or diclofenac.12–14
In the present study, a dynamic 3-D bioreactor system containing primary human hepatocytes was used to investigate the effects of continuous remimazolam application over 5 days, thereby mimicking the situation of a patient receiving a continuous infusion of the drug. The effect of remimazolam on cell integrity and functionality in the 3-D bioreactor was assessed by daily measurement of clinical chemistry parameters (glucose, lactate, urea, ammonia, and liver enzymes). Possible alterations in remimazolam metabolism were evaluated by analyzing the time course of remimazolam decrease and formation of its metabolite – CNS7054. In addition, mRNA expression of the CES1 gene, encoding CES1, the enzyme mainly involved in remimazolam metabolism, was determined at the end of remimazolam exposure. In parallel, experiments in conventional collagen-coated 2-D plates were performed with cells from the same donors, but with discontinuous exposure to remimazolam. Therefore, direct comparison of remimazolam effects and metabolism in dynamic and static culture systems was possible.
Methods
Human liver-cell isolation
The study was performed in three independent experiments with primary human hepatocytes from three different donors (Table 1). Cells were isolated from liver tissue resected due to tumor disease, with written informed consent by the patients. The study was conducted in accordance with the Declaration of Helsinki and with approval of the ethics committee of the Charité – Universitätsmedizin Berlin (EA2/026/09, February 27, 2014). Cells were obtained by collagenase digestion from macroscopically healthy tissue as described elsewhere.15,16
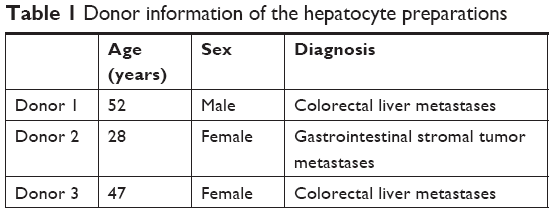 | Table 1 Donor information of the hepatocyte preparations |
Bioreactor
The 3-D hollow-fiber bioreactor system (Stem Cell Systems, Berlin, Germany) used in this study consists of three independent but interwoven capillary bundles (Figure 2): two of them serve for countercurrent medium perfusion (media I and II) and the third for internal oxygenation (gas). Cells are cultured in the extracapillary space, which has a volume of 0.5 mL. They are allowed to adhere to the hollow-fiber scaffold and supplied with nutrients and oxygen through the capillary membranes (Figure 3A and C).
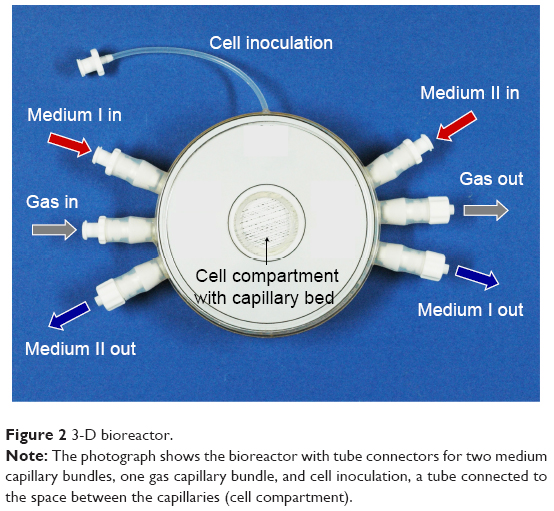 | Figure 2 3-D bioreactor. |
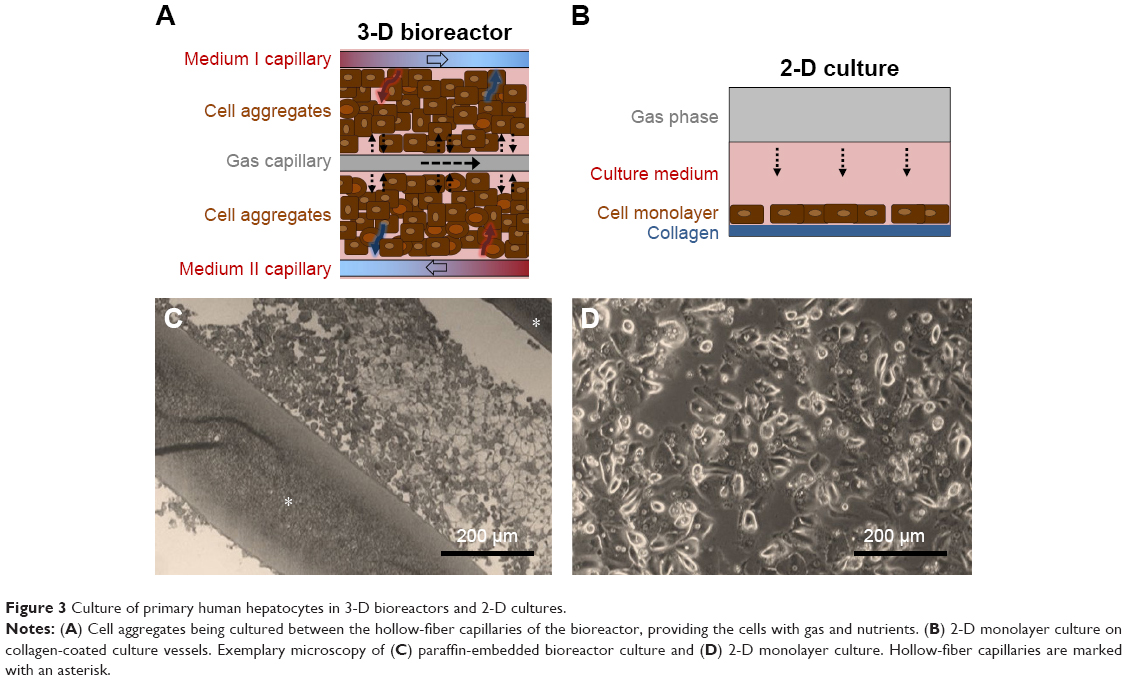 | Figure 3 Culture of primary human hepatocytes in 3-D bioreactors and 2-D cultures. |
The capillary bed is incorporated into a polyurethane housing equipped with connectors for mounting the perfusion tubing and for cell inoculation. The structure of the perfusion circuit is shown in Figure 4. Culture medium is constantly recirculated through the bioreactor by means of a peristaltic pump. At the same time, fresh culture medium is fed into the perfusion circuit via a second pump, while the corresponding excess medium is rinsed out into the waste vessel. A port integrated into the perfusion circuit enables substance injection and sampling from the recirculating medium. An electronic gas-mixing unit enables supply of air–CO2 at a defined mixture and flow rate.
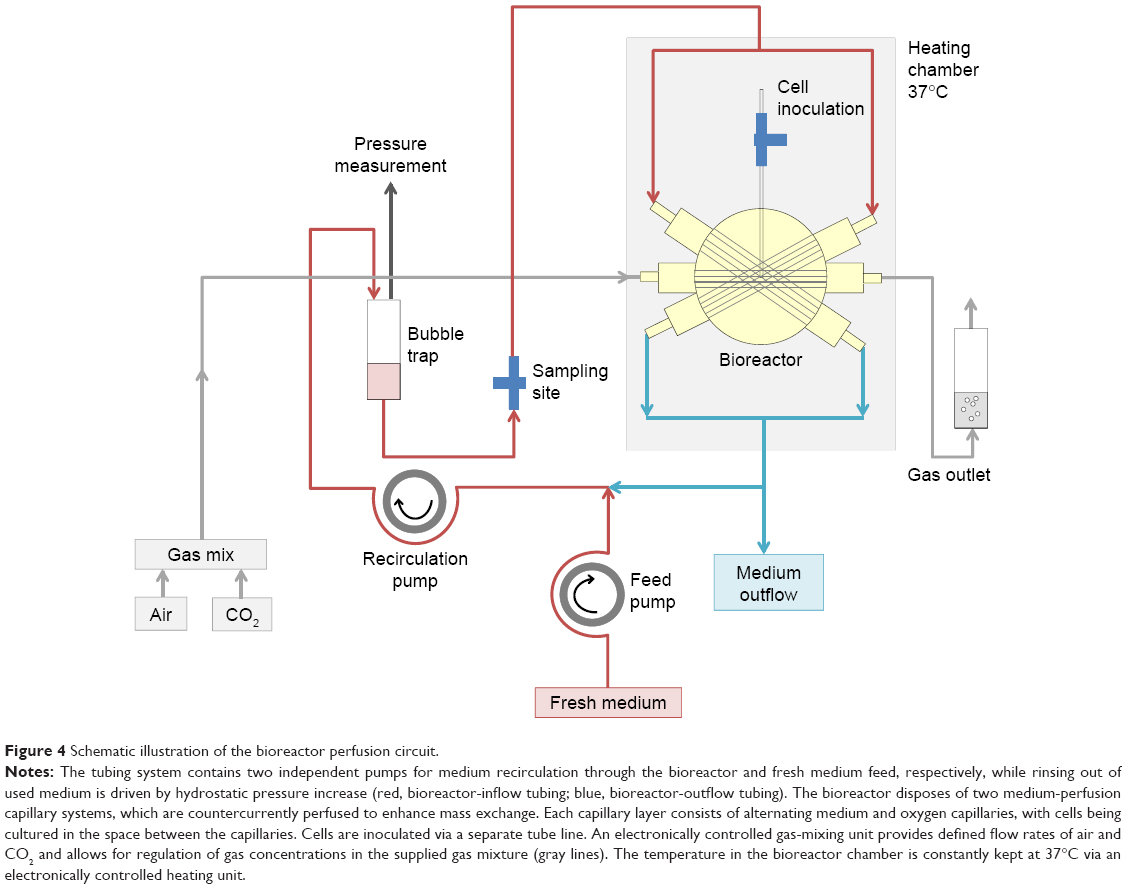 | Figure 4 Schematic illustration of the bioreactor perfusion circuit. |
3-D culture of hepatocytes in bioreactors
In order to minimize dilution of medium components and cell products in the perfusion circuit, the perfusion length and volume were kept as small as possible, while addressing technical requirements (pump segments, bubble trap), resulting in the experimental conditions summarized in Table 2. Flow rates of the recirculating medium were optimized to enable optimal mass exchange via diffusion through the capillary membranes. The medium-feed rate was set according to glucose levels measured in the perfused medium to prevent glucose starvation of the cultured cells. To allow the formation of parenchyma-like 3-D cell aggregates in spaces between the capillaries, inoculated cell numbers were determined based on the cell-compartment volume, approximating typical cell concentrations in the liver. Bioreactors were perfused with serum-free Heparmed culture medium (Biochrom, Berlin, Germany), a modification of the Williams Medium E developed for serum-free 3-D liver-cell culture. The medium was supplemented with ITG supplements (final concentrations: 0.8 mg/L insulin, 5 mg/L transferrin, and 3 μg/L glucagon) and penicillin–streptomycin (100,000 U/L–100 mg/L), all purchased from Biochrom. The waste vessel was emptied daily, after taking samples for analysis.
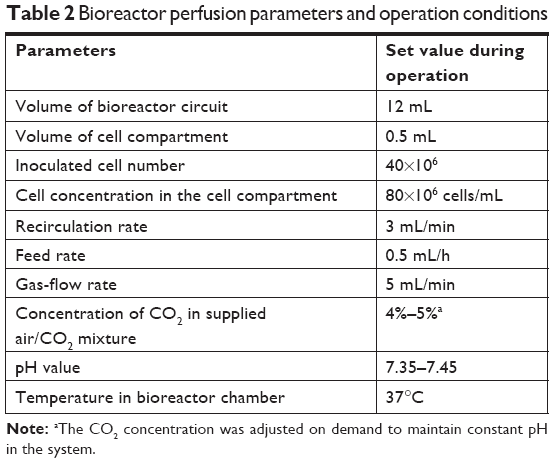 | Table 2 Bioreactor perfusion parameters and operation conditions |
2-D hepatocyte culture
In parallel to bioreactor cultures, experiments with cells from the same donor were performed in 2-D plates for comparison. Six-well culture plates (Falcon; BD Biosciences, San Jose, CA, USA) were coated with rat-tail collagen prepared according to a protocol described previously.17 Freshly isolated human hepatocytes were suspended in Williams Medium E with GlutaMax (Thermo Fisher Scientific, Waltham, MA, USA), containing penicillin–streptomycin (100,000 U/L–100 mg/L), 15 mM HEPES, 1 mM sodium pyruvate, 1% non essential amino acids, 10% FBS (all Thermo Fisher Scientific), 0.8 mg/L dexamethasone (Fortecortin; Merck, Darmstadt, Germany), and 1 mM human insulin (Sanofi Aventis, Frankfurt am Main, Germany), referred to as “full medium”. Cells were seeded in the collagen-coated plates at a density of 1.4 million cells per well (Figure 3B and D). From 24 hours onward, the culture medium was exchanged daily with the same medium, but without FBS and hormones (starving medium).
Preparation of remimazolam solution
Remimazolam (PAION UK Ltd, Cambridge, UK) was dissolved in water for injection at a concentration of 2.5 mg/mL, followed by dilution in 0.9% NaCl solution, resulting in a substance concentration of 100 μg/mL. This solution was further diluted in culture medium to the desired concentration prior to use.
Remimazolam application in 3-D bioreactors
In a preliminary study, the adsorption behavior of remimazolam was investigated in a cell-free bioreactor. Remimazolam was applied at a final concentration of 500 ng/mL (1.1 μM) into the bioreactor circuit, and perfusion with the substance was performed over 24 hours in a closed circuit. Remimazolam concentrations, analyzed at 0 hours (after starting closed recirculation), 1 hour, 2 hours, 4 hours, 8 hours, and 24 hours, revealed a substance loss of nearly 85% in the system (data available online at http://doi.org/10.5281/zenodo.1493510, file Adsorption_study). Based on these results, the concentration of remimazolam in the bioreactor perfusate was increased to 3,000 ng/mL (6.8 μM) in the main study, which resulted in a concentration of around 850 ng/mL in cell-free bioreactors (data available online at http://doi.org/10.5281/zenodo.1240206, file Remimazolam_3D_bioreactors), which is in the range of clinically observed plasma concentrations.
The experimental design of the main study is depicted in Figure 5. Subsequently to cell inoculation, cultures were maintained for 3 days without drug application to allow the cells to recover from cell isolation and adapt to the system. The application of remimazolam was initiated on day 3 and continued until day 8 of bioreactor culture. To achieve an immediate final concentration of 3,000 ng/mL (6.8 μM) in the perfusion circuit, 1 mL culture medium containing the 12-fold concentration of remimazolam was injected into the recirculating medium, simulating a bolus application in the clinical setting. Subsequently, perfusion was performed with constant feed of remimazolam at a concentration of 3,000 ng/mL (6.8 μM) into the circuit, thereby mimicking an infusion regime following a bolus.
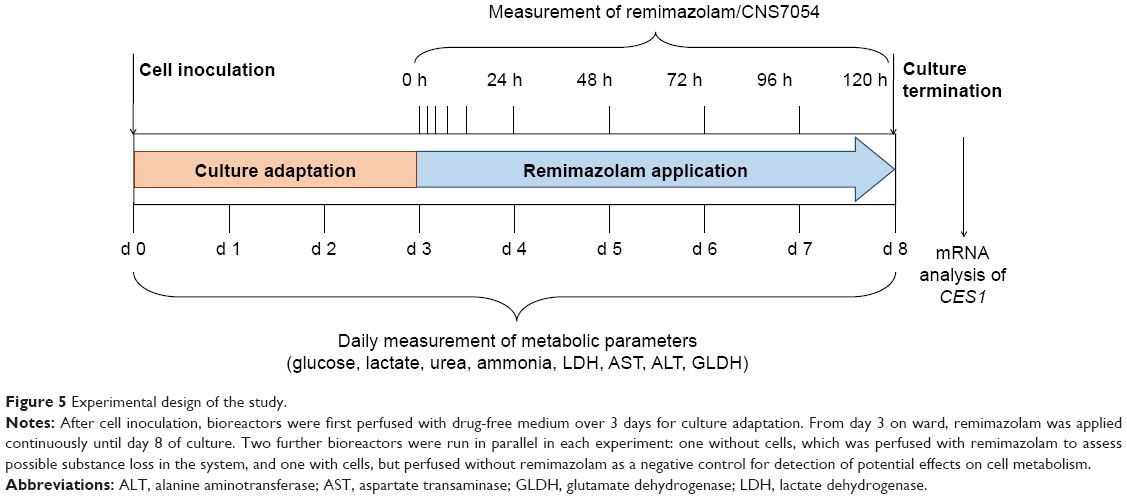 | Figure 5 Experimental design of the study. |
In each experiment, a further bioreactor run in parallel without hepatocytes was exposed to remimazolam to enable point-to-point corrections for nonmetabolic loss of remimazolam in the device. A third bioreactor was inoculated with hepatocytes, but not treated with remimazolam to provide a negative control for evaluation of possible remimazolam effects on the cultured primary human hepatocytes.
Remimazolam exposure in 2-D cultures
In parallel with 3-D cultures, 2-D hepatocyte cultures were incubated from day 3 to day 8 of culture with starving medium containing remimazolam at a final concentration of 3,000 ng/mL (6.8 μM). Parallel cultures were maintained without remimazolam exposure as a negative control. The culture medium was exchanged daily after taking samples for analysis. Since preliminary studies performed in cell-free culture plates revealed no relevant substance loss in 2-D systems (data available online at http://doi.org/10.5281/zenodo.1493510, file Adsorption_study), cell-free controls were not included in 2-D experiments.
Analysis of clinical chemistry parameters
Parameters reflecting the cell integrity and metabolic activity were measured on a daily basis in the recirculating medium of 3-D hepatocyte bioreactors and in supernatants of parallel 2-D cultures. Concentrations of lactate dehydrogenase (LDH), alanine aminotransferase (ALT), aspartate transaminase (AST), glutamate dehydrogenase (GLDH), ammonia, and urea were determined at Labor Berlin, Berlin, Germany using clinical analyzers. Glucose and lactate concentrations were measured with a blood-gas analyzer (Radiometer, Copenhagen, Denmark).
Analysis of remimazolam metabolism
Samples for analysis of remimazolam and its main metabolite, CNS7054, were collected from the recirculating medium and waste vessels of bioreactors at 0 hours (after starting the substance application), 1 hour, 2 hours, 4 hours, 8 hours, and 24 hours, and thereafter daily at 48 hours, 72 hours, 96 hours, and 120 hours. Samples from supernatants of parallel 2-D cultures were taken at the same time points, using individual wells for each time point of analysis. Concentrations of remimazolam and CNS7054 were analyzed at Aptuit (Verona, Italy) using a validated method. Compounds were extracted by protein precipitation and analysis performed by using HPLC with tandem mass spectrometry detection as previously described.3
Analysis of CES1 gene expression
Cell samples for gene-expression analysis of CES1 were collected from 3-D bioreactors exposed or not exposed to remimazolam upon culture termination on day 8. Samples from parallel 2-D cultures were taken at 0 hours (after starting the experiment), 24 hours, 72 hours, and 120 hours using individual wells for each time point of analysis. RNA was extracted using Trizol reagent (Thermo Fisher Scientific) according to the manufacturer’s instructions. Afterward, genomic DNA was digested with an RNase-free DNase set (Qiagen, Venlo, the Netherlands). RNA concentrations were measured using spectrometry (Thermo Fisher Scientific), and 1 μg RNA served as a template to synthesize cDNA with a high-capacity cDNA reverse-transcription kit with RNase inhibitor (Thermo Fisher Scientific). Each cDNA template was mixed with PCR Master Mix (Thermo Fisher Scientific) and human-specific primers and probes for CES1 (Hs00275607_m1, TaqMan gene-expression assay system; Thermo Fisher Scientific). Quantitative real-time PCR was performed using a real-time cycler (Mastercycler Ep Realplex 2; Eppendorf, Hamburg, Germany). Expression of CES1 was normalized to expression values of the housekeeping gene GAPDH (Hs03929097_g1) and fold changes of expression levels calculated with the ΔΔCt method.18
Data calculation and evaluation
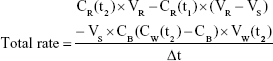
Data were evaluated using GraphPad Prism 5.0 (GraphPad Software, San Diego, CA, USA). Experiments were performed with cells of three different donors, and results are presented as means ± SD. Total rates of remimazolam decrease and CNS7054 formation rates in bioreactors were calculated using Equation 1, where CR(t) is concentration in recirculation at time t, CW(t2) concentration in waste at time t2, CB medium blank concentration, VR recirculating volume, Vs sampling volume, VW waste volume, and Δt time interval between sampling at t1 and t2. Net decrease/formation rates were calculated by subtracting values of cell-free bioreactors from those in cell-containing bioreactors using Equation 2.
|
|
|
|

Results
Influence of remimazolam on cell integrity and functionality
In order to evaluate a possible effect of remimazolam on the integrity and metabolic activity of primary human hepatocytes in the 3-D bioreactors or 2-D cultures, glucose and nitrogen metabolism and enzyme release were determined in daily samples from cultures with or without remimazolam application.
In general, the time courses of clinical chemistry parameters were similar in cultures exposed or not exposed to remimazolam, indicating the absence of noxious effects of remimazolam and its metabolites on hepatocyte integrity and functionality during the course of the experiment (Figures 6 and 7).
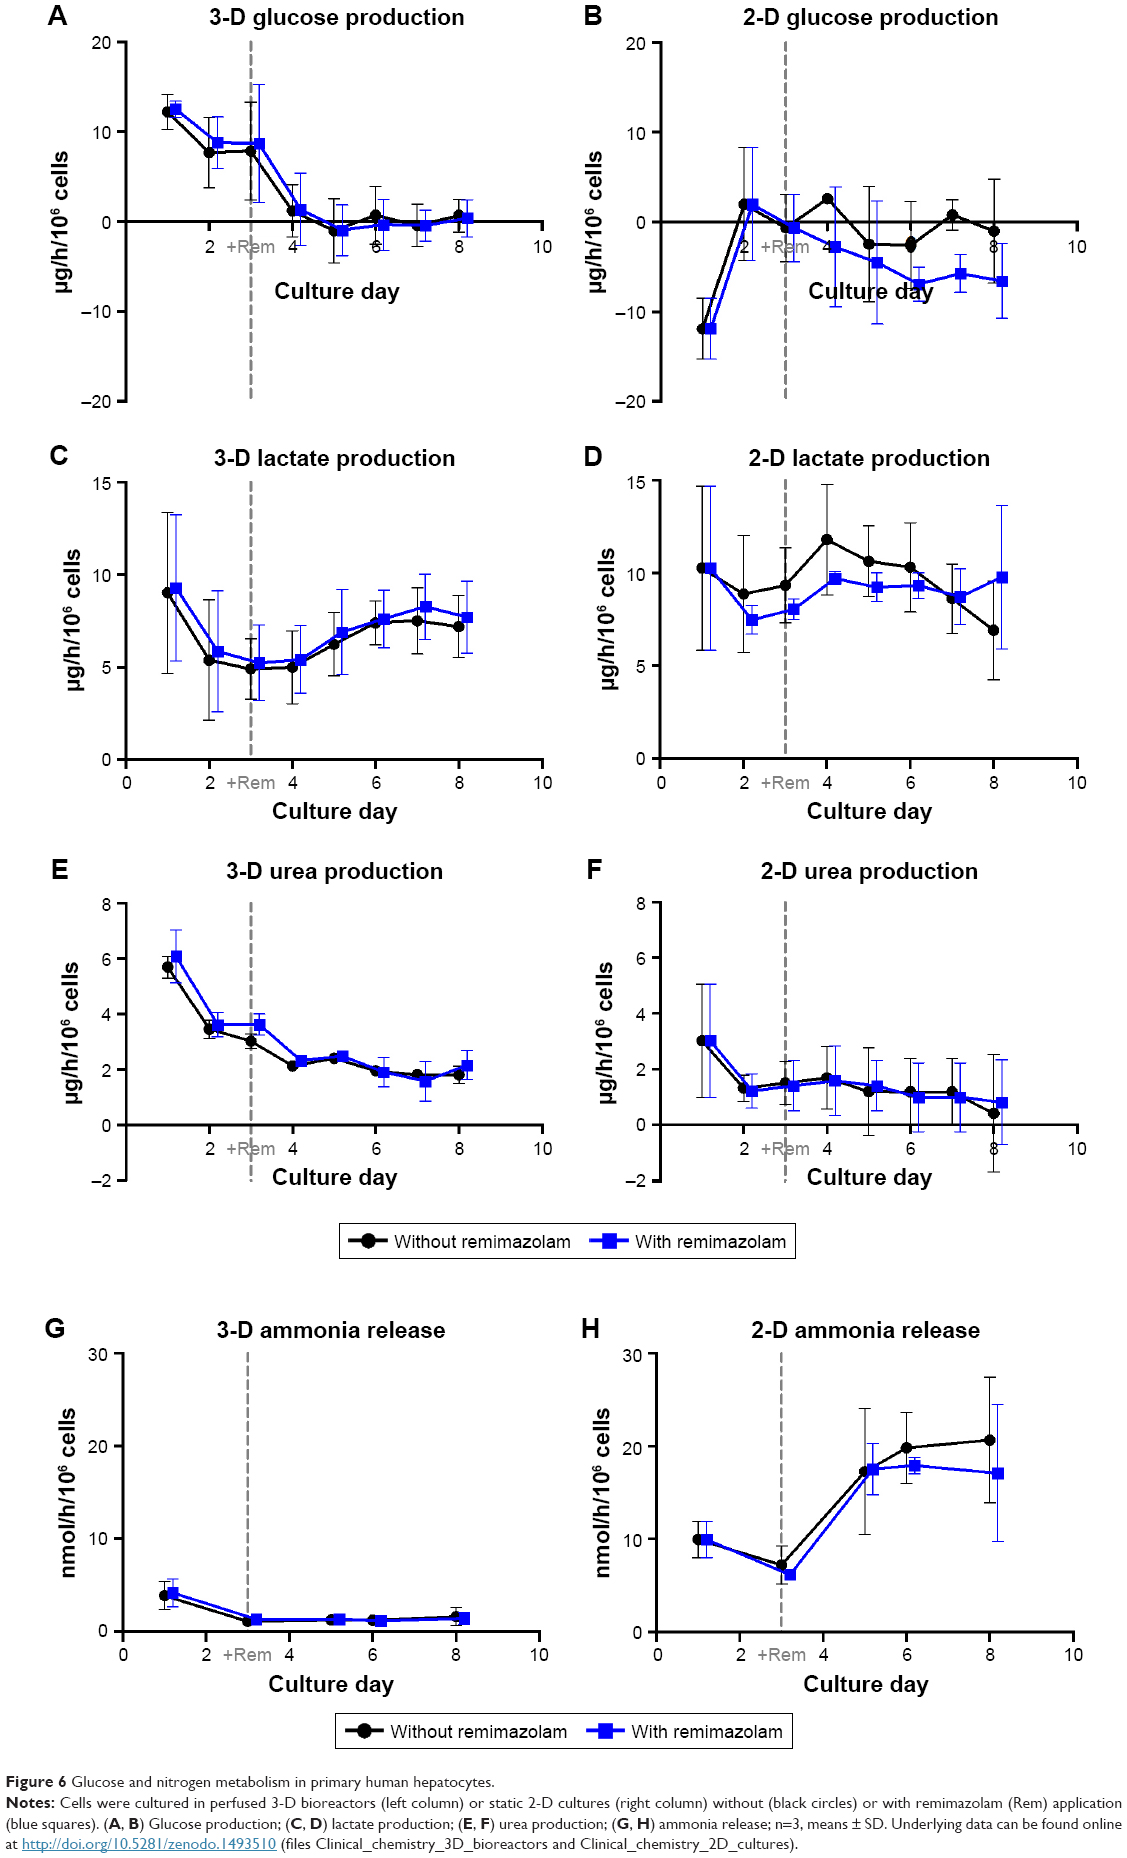 | Figure 6 Glucose and nitrogen metabolism in primary human hepatocytes. |
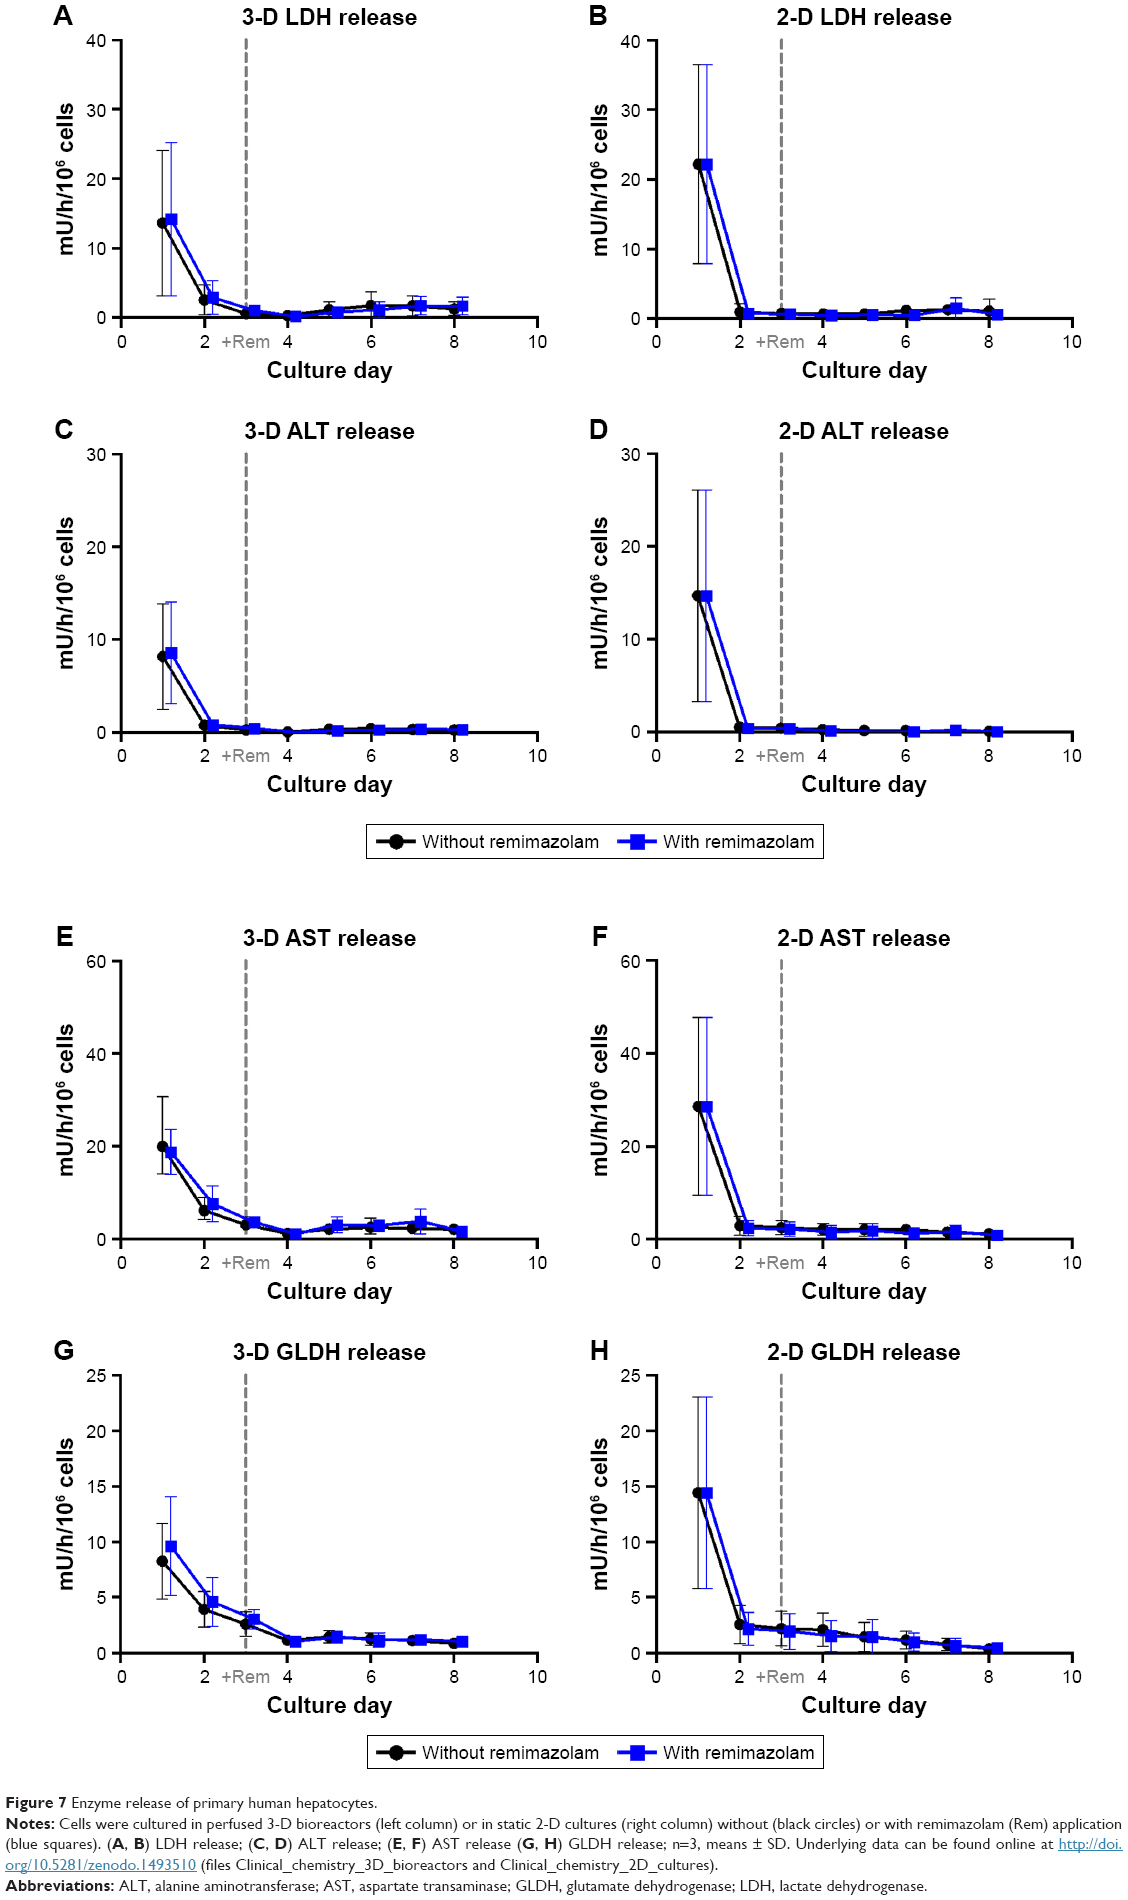 | Figure 7 Enzyme release of primary human hepatocytes. |
Glucose and lactate production, investigated as parameters for energy metabolism, showed slight differences in time courses between 3-D and 2-D cultures. In bioreactor cultures, initial net glucose release during the first days of culture was followed by net equilibrium between glucose influx and efflux from day 4 onward (Figure 6A). In contrast, 2-D cultures showed a net uptake of glucose on the first day, while maintaining a net equilibrium between influx and efflux from day 2 onward or returning to a net uptake of glucose from day 4 onward for 2-D cultures with remimazolam application (Figure 6B). Lactate production showed a similar time course in 3-D and 2-D cultures, with decreasing values during the first days of culture and a subsequent increase reaching a maximum on day 7 (3-D) or day 4 (2-D) of culture (Figure 6C and D). Urea synthesis to assess cell capacity for nitrogen elimination was higher in 3-D than in 2-D cultures. After an initial peak, urea-secretion rates declined in both culture systems until day 2 (2-D) or day 4 (3-D), followed by a stable phase in 3-D cultures, whereas 2-D cultures showed a tendency toward a decrease (Figure 6E and F). Ammonia release was investigated as a further parameter for nitrogen metabolism, and showed a similar time course as urea production rates in 3-D bioreactors, characterized by an initial peak followed by stable values from day 3 onward (Figure 6G). In contrast, ammonia release in 2-D cultures showed a distinct increase over time (Figure 6H).
Release rates of LDH (Figure 7A and B) and the liver enzymes ALT, GLDH, and AST (Figure 7C–H) showed a steady decline during the first days of culture and remained on basal levels afterward in both culture systems, providing no indication of cell injury caused by remimazolam application.
Time-dependent metabolism of remimazolam
Time courses of remimazolam decrease and formation of its main metabolite CNS7054 were studied in primary human hepatocytes cultured in 3-D bioreactors or 2-D cultures during an exposure period of 5 days (120 hours). Investigation of remimazolam concentrations in recirculating media of bioreactor cultures showed a decrease from an initial 2,947±320 ng/mL, which corresponds to the applied final concentration, to steady-state values in the range of 250 ng/mL (Figure 8A). The steady state was reached after 4 hours and maintained until the end of the experiment. Concentrations of remimazolam’s main metabolite CNS7054 showed an inverse course, with a strong increase within 4 hours after remimazolam application in the recirculating medium (Figure 8A). A stable level at an average of 1,350 ng/mL was attained after ~24 hours and maintained throughout the test period. Measurements performed in 2-D cultures during the first 24 hours showed that concentrations of remimazolam in culture supernatants decreased rapidly from an initial value of 2,274±83 ng/mL to 68±46 ng/mL within 4 hours and to nearly zero within 24 hours after drug application (Figure 8B). Measured concentrations of CNS7054 presented an inverse curve, showing an increase from zero to 2,412±551 ng/mL 2 hours after remimazolam application, followed by a slower increase to a maximum concentration of 2,763±618 ng/mL after 24 hours (Figure 8B). Concentrations of remimazolam and CNS7054 determined at 48 hours, 72 hours, 96 hours, and 120 hours were similar to those detected at 24 hours.
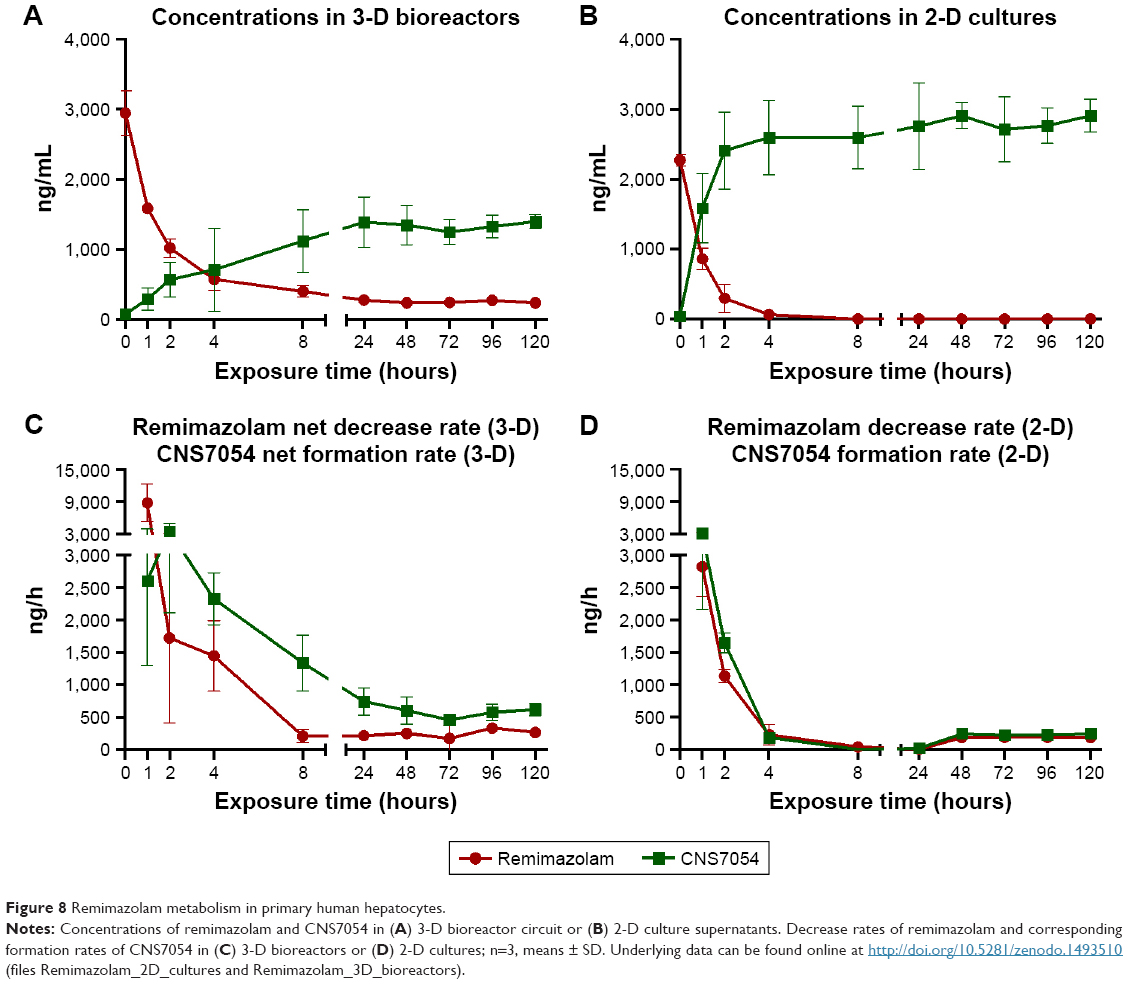 | Figure 8 Remimazolam metabolism in primary human hepatocytes. |
Based on concentrations measured in 3-D bioreactors, total decrease rates of remimazolam and corresponding total formation rates of CNS7054 were calculated and corrected with respect to concentration changes observed in cell-free bioreactors to obtain cell-specific net decrease rates and net formation rates (Figure 8C). Net rates of remimazolam decrease and CNS7054 formation showed maximum values 1–2 hours after substance application, with net rates amounting to 8,736+3,494 ng/h for remimazolam and to 3,512+1,401 ng/h for CNS7054 (Figure 8C). Afterward, values decreased until 24 hours after remimazolam application, followed by a continuous metabolic decrease of remimazolam at an average net rate of ~250 ng/h. The concurrent formation of CNS7054 amounted to an average net rate of ~600 ng/h, and hence calculated net formation rates of CNS7054 exceeded net decrease rates of remimazolam.
In 2-D cultures, decrease rates of remimazolam and formation rates of CNS7054 calculated from concentration profiles reached maximum values during the first hour of incubation, amounting to 2,821±454 ng/h for remimazolam decrease and 3,088±927 ng/h for CNS7054 formation rate (Figure 8D). Both rates declined to almost zero within 8 hours. From 24 hours on ward, calculated average drug decrease and product formation rates were maintained at stable values amounting to ~190 ng/h for remimazolam and to ~240 ng/h for CNS7054, indicating a slight imbalance toward product formation (Figure 8D). On the basis of the concentration profile determined for the first 24 hours over several time points, concentration profiles were modeled for the following 96 hours, assuming an identical time course as on the first day, to display the actual time course in discontinuous 2-D cultures (Figure 9). Here, it became apparent that cells in 2-D cultures were exposed to remimazolam for only the first few hours after medium exchange (Figure 9A) until the drug had completely converted to CNS7054 (Figure 9B). Therefore, in 2-D cultures, cells were exposed to strongly fluctuating concentrations of the drug and its metabolite, which is in contrast to the dynamic 3-D bioreactors, where a steady state was reached through constant infusion of the parent drug.
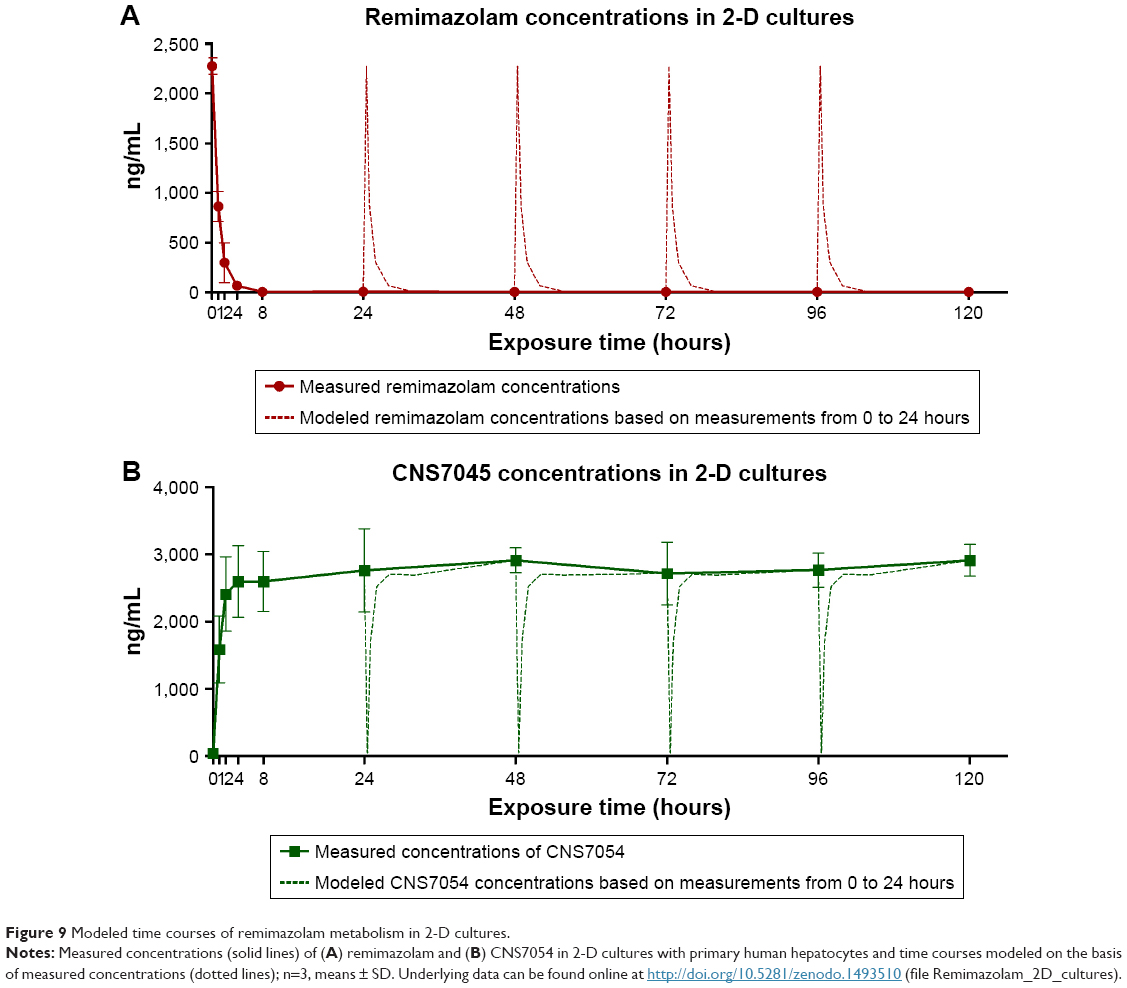 | Figure 9 Modeled time courses of remimazolam metabolism in 2-D cultures. |
Neither culture system showed a manifest decline in remimazolam decrease or product formation during the incubation period of 5 days.
Gene expression of CES1
mRNA expression of CES1 was analyzed in 3-D bioreactors after 120 hours (Figure 10A), and in 2-D cultures after 24 hours, 72 hours, and 120 hours of remimazolam incubation (Figure 10B). Relative expression levels of CES1 in drug-treated cultures were marginally increased (1.3–1.5-fold) compared to the respective untreated controls. As such, the data indicated no significant effect of remimazolam on the expression level of CES1.
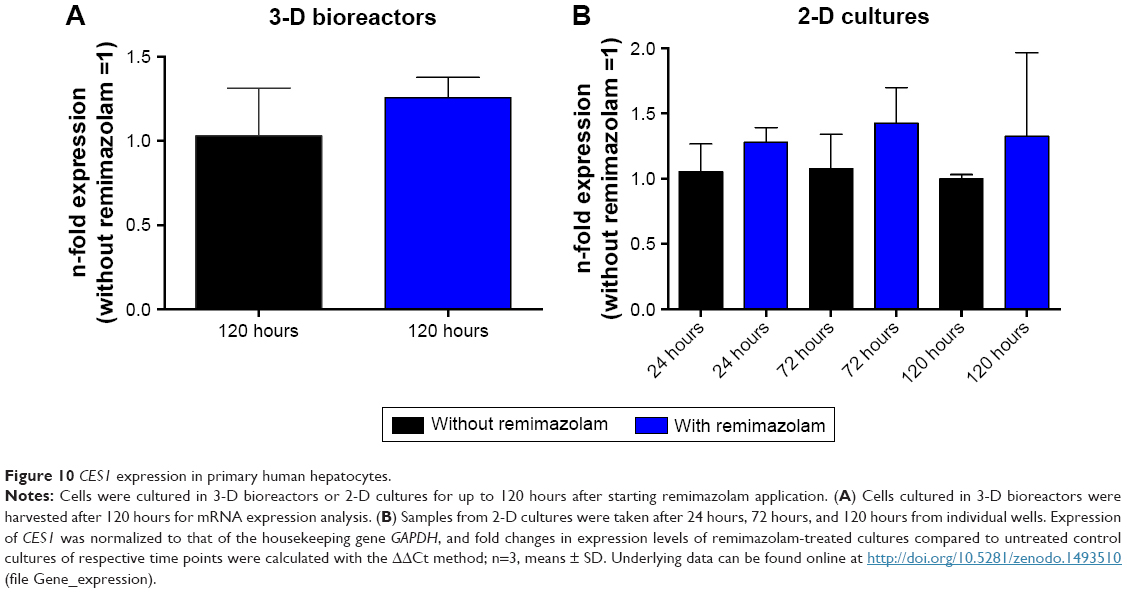 | Figure 10 CES1 expression in primary human hepatocytes. |
Discussion
In this study, the metabolism of remimazolam to its main metabolite CNS7054 and possible effects of remimazolam exposure on the cell integrity and metabolic activity of primary human hepatocytes were investigated. The cells were cultured in a dynamic bioreactor system, which enabled continuous application of remimazolam, simulating clinical drug administration via infusion. Parallel experiments were performed in static 2-D cultures with discontinuous drug application.
In accordance with previous observations,12–14 concentrations of metabolic parameters, including glucose, lactate, urea, and liver enzymes, showed increased values in both culture systems during the first few days of culture, ie, prior to drug application. It has been shown that the isolation process leads to oxidative stress in primary hepatocytes.19 Therefore, the finding of enhanced metabolite release could have been due to cell stress resulting from liver digestion. Parameters reached a stable level after a few days, indicating cell recovery and adaptation to the system. In the following experimental period, characterized by remimazolam application beginning on day 3 for a period of 5 days, stable maintenance of most metabolic parameters was observed in both 3-D bioreactors and 2-D cultures. Notably, the observed increase of ammonia release in 2-D cultures indicated a decrease in nitrogen elimination, which was not detected in 3-D cultures. Neither metabolic markers nor enzyme release pointed to possible noxious effects of remimazolam or its main metabolite CNS7054 during the course of experiments. Studies have shown that the applied 3-D culture model is able to detect toxic effects in primary human hepatocytes applying the known hepatotoxic drugs diclofenac or paracetamol.12,13 In both studies, lactate and ammonia release rates were significantly affected in 3-D bioreactor cultures treated with increased drug concentrations compared to untreated control cultures.
The results from measuring remimazolam decrease and CNS7054 formation indicated stable remimazolam metabolism in the bioreactor system, with no manifest decline during the observed culture period of 5 days. The finding of a peak in net drug decrease and product formation during the first few hours of exposure can be attributed to increased concentrations of remimazolam immediately after drug application, which would correspond to a bolus injection in patients. After 8 (remimazolam) and 24 hours (CNS7054), steady states were reached in the bioreactor system and maintained over the following culture period of 5 days.
A similar time course for remimazolam metabolism was observed in 2-D cultures. However, it has to be taken into account that the remimazolam application was discontinuous in 2-D cultures, ie, fresh medium was only provided every 24 hours. Therefore, daily values reflected the average metabolism of remimazolam within 24 hours, whereas the actual time course between each medium exchange was characterized by an exponential decrease, similarly to that of the first day of culture. This leads to the conclusion that in the present study, the main advantage of the 3-D bioreactor model appears to be the perfusion condition and not the cultivation in a 3-D environment. Subsequent studies should be designed to separate the effects of perfusion and cultivation to allow detailed conclusions regarding the effect of the culture environment on drug metabolism in human hepatocytes.
Several studies have shown dedifferentiation processes in 2-D cultures, including lower drug-metabolizing activities,11,20,21 that can be attributed to the lack of physiological cell reorganization and cell–cell contacts.22 A previous study examining the CYP-dependent metabolism of standard compounds, such as diclofenac and midazolam, showed distinct differences between 2-D and 3-D cultured primary human hepatocytes.11 The metabolic pattern of diclofenac and formation rates of corresponding metabolites exponentially decreased in 2-D cultures over 6 days, whereas stable conversion rates were maintained in perfused 3-D bioreactors.11 As such, the finding that CES1 activity remained unchanged in 2-D cultures over the investigated time period indicated that CES1 was less affected by dedifferentiation processes than other enzyme systems, such as CYP enzymes.
A correction of values was required in 3-D bioreactors, considering the nonmetabolic disappearance of remimazolam, which can be explained by substance adsorption in plastic tubing used for bioreactor perfusion, which is a well-known phenomenon in dynamic in vitro systems.23–25 The investigation of remimazolam decrease in cell-free bioreactors indicated a remarkable loss of the substance, which can be ascribed to adsorption processes. The calculation of net decrease rates was based on subtracting the rates measured in cell-free bioreactors from those measured in cellularized bioreactors. The observation that the net rate of CNS7054 formation exceeded the net rate of remimazolam decrease in hepatocyte bioreactors may be explained by a lower adsorption of remimazolam to bioreactor materials in the presence of cells. In 2-D culture systems, which showed no substantial drug loss under cell-free conditions, remimazolam decrease and CNS7054 formation rates were almost identical, which further confirms the hypothesis of an overestimation of adsorption rates when calculating net rates in 3-D bioreactors.
However, the finding of stable remimazolam metabolism was not affected by possible overcorrection, since the bioreactor cultures showed fairly constant levels of the free drug and its main metabolite from about 8 hours onward, CNS7054 reaching its steady state somewhat later compared to remimazolam. In addition, steady-state concentrations of remimazolam measured in this study (250 ng/mL) were in the range of venous plasma concentrations obtained during a phase I clinical study, where maximum remimazolam concentrations of 190–6,100 ng/mL (corresponding to unbound drug concentrations of 15–720 ng/mL with human protein binding of 92%) were observed depending on the applied drug dose.3 Moreover, there was no difference in CES1 expression between drug-treated and untreated cultures, which further confirms stable preservation of remimazolam metabolism over the experimental period. To validate this observation further, CES1 expression should be analyzed at the protein level in future studies. The influence of remimazolam and its metabolite on CYP gene and protein expression was not investigated in this study, since results from metabolite analysis in plasma and urine samples from patients indicate that CYP enzymes do not substantially contribute to remimazolam metabolism.26
In contrast to the 3-D bioreactor cultures, which allow continuous drug infusion and thus maintenance of a constant drug concentration, the available drug concentration in 2-D cultures is strongly fluctuating, since the parent drug is quickly hydrolyzed and the metabolite accumulates under the conditions of discontinuous medium exchange. Therefore, the dynamic 3-D bioreactor more closely reflects the situation of a patient receiving a constant infusion of remimazolam during induction and maintenance of general anesthesia. On the other hand, 2-D cultures have the advantage that cell samples can be taken on a daily basis to investigate the time course of gene expression and/or other investigations, eg, protein determination. In the applied bioreactor system, regular cell-sample taking would destroy reorganized 3-D cell aggregates, and for this reason cell analyses were performed only at the end of the experiment. In addition, the experimental design needs to consider possible substance adsorption to plastic tubing used for bioreactor perfusion. As such, both culture systems have valid reasons for being applied in in vitro pharmacological studies.
Conclusion
Exposure to remimazolam over 5 days at clinically relevant concentrations did not significantly influence remimazolam metabolism in the present in vitro study. The gene expression of CES1, the enzyme responsible for metabolic inactivation of remimazolam, was not affected either. Moreover, there was no indication of a harmful effect of remimazolam exposure on the integrity and metabolic activity of hepatocytes.
As such, the results of the present study provide no indication that the phenomenon of high plasma concentrations observed in patients during long-term treatment with remimazolam in the intensive care unit is related to a direct (auto)inhibitive effect of the parent drug or its metabolite(s) on function and expression of CES1. However, it has to be considered that systemic factors, which cannot be detected in the in vitro liver model used, may influence remimazolam metabolism during long-term exposure in severely ill patients. In addition, longer study periods would be of interest for future studies to exclude a functional decrease occurring after >120 hours. Such studies may be increasingly needed, as the number of drugs undergoing CES-mediated hydrolysis is steadily growing.27,28
Acknowledgments
This study was funded by PAION UK Ltd., Cambridge, UK. We acknowledge support for open-access publication from the German Research Foundation (DFG) and the Open Access Publication Fund of Charité – Universitätsmedizin Berlin.
Disclosure
PAION UK Ltd. contributed to the design of the study, collection, analysis, and interpretation of data, writing of the manuscript, and the decision to publish the results. This research was presented at Euroanaesthesia 2016 in London (May 28–30, 2016) as a poster with interim findings, and the abstract was published online under the title “Metabolism of remimazolam in primary human hepatocytes during continuous long-term infusion (five days) in a 3D bioreactor system”, https://www.esahq.org/~/media/ESA/Files/Downloads/Resources-Abstracts-Euroanaesthesia2016/ESA2016_MID.ashx.
References
Kilpatrick GJ, McIntyre MS, Cox RF, et al. CNS 7056: a novel ultra-short-acting benzodiazepine. Anesthesiology. 2007;107(1):60–66. | ||
Hosokawa M. Structure and catalytic properties of carboxylesterase isozymes involved in metabolic activation of prodrugs. Molecules. 2008;13(2):412–431. | ||
Antonik LJ, Goldwater DR, Kilpatrick GJ, Tilbrook GS, Borkett KM. A placebo- and midazolam-controlled phase I single ascending-dose study evaluating the safety, pharmacokinetics, and pharmacodynamics of remimazolam (CNS 7056): Part I. safety, efficacy, and basic pharmacokinetics. Anesth Analg. 2012;115(2):274–283. | ||
Borkett KM, Riff DS, Schwartz HI, et al. A phase IIA, randomized, double-blind study of remimazolam (CNS 7056) versus midazolam for sedation in upper gastrointestinal endoscopy. Anesth Analg. 2015;120(4):771–780. | ||
Pambianco DJ, Borkett KM, Riff DS, et al. A phase IIb study comparing the safety and efficacy of remimazolam and midazolam in patients undergoing colonoscopy. Gastrointest Endosc. 2016;83(5):984–992. | ||
Worthington MT, Antonik LJ, Goldwater DR, et al. A phase Ib, dose-finding study of multiple doses of remimazolam (CNS 7056) in volunteers undergoing colonoscopy. Anesth Analg. 2013;117(5):1093–1100. | ||
Petersen KU. Pre-clinical profile of remimazolam and pharmacokinetics. In: Oral presentation at: 37th Annual Meeting of the Japan Society for Clinical Anaesthesia; November 4; 2017; Tokyo, Japan. | ||
Gerlach JC, Mutig K, Sauer IM, et al. Use of primary human liver cells originating from discarded grafts in a bioreactor for liver support therapy and the prospects of culturing adult liver stem cells in bioreactors: a morphologic study. Transplantation. 2003;76(5):781–786. | ||
Sauer IM, Zeilinger K, Pless G, et al. Extracorporeal liver support based on primary human liver cells and albumin dialysis – treatment of a patient with primary graft non-function. J Hepatol. 2003;39(4):649–653. | ||
Zeilinger K, Schreiter T, Darnell M, et al. Scaling down of a clinical three-dimensional perfusion multicompartment hollow fiber liver bioreactor developed for extracorporeal liver support to an analytical scale device useful for hepatic pharmacological in vitro studies. Tissue Eng Part C Methods. 2011;17(5):549–556. | ||
Hoffmann SA, Müller-Vieira U, Biemel K, et al. Analysis of drug metabolism activities in a miniaturized liver cell bioreactor for use in pharmacological studies. Biotechnol Bioeng. 2012;109(12):3172–3181. | ||
Freyer N, Greuel S, Knöspel F, et al. Microscale 3D liver bioreactor for in vitro hepatotoxicity testing under perfusion conditions. Bioengineering. 2018;5(1):24. | ||
Knöspel F, Jacobs F, Freyer N, et al. In vitro model for hepatotoxicity studies based on primary human hepatocyte cultivation in a perfused 3D bioreactor system. Int J Mol Sci. 2016;17(4):584. | ||
Lübberstedt M, Müller-Vieira U, Biemel KM, et al. Serum-free culture of primary human hepatocytes in a miniaturized hollow-fibre membrane bioreactor for pharmacological in vitro studies. J Tissue Eng Regen Med. 2015;9(9):1017–1026. | ||
Kegel V, Deharde D, Pfeiffer E, Zeilinger K, Seehofer D, Damm G. Protocol for isolation of primary human hepatocytes and corresponding major populations of non-parenchymal liver cells. J Vis Exp. 2016;(109):e53069. | ||
Pfeiffer E, Kegel V, Zeilinger K, et al. Featured article: isolation, characterization, and cultivation of human hepatocytes and non-parenchymal liver cells. Exp Biol Med. 2015;240(5):645–656. | ||
Rajan N, Habermehl J, Coté M-F, Doillon CJ, Mantovani D. Preparation of ready-to-use, storable and reconstituted type I collagen from rat tail tendon for tissue engineering applications. Nat Protoc. 2007;1(6):2753–2758. | ||
Livak KJ, Schmittgen TD. Analysis of relative gene expression data using real-time quantitative PCR and the 2(-Delta Delta C(T)) Method. Methods. 2001;25(4):402–408. | ||
Tormos AM, Taléns-Visconti R, Bonora-Centelles A, Pérez S, Sastre J. Oxidative stress triggers cytokinesis failure in hepatocytes upon isolation. Free Radic Res. 2015;49(8):927–934. | ||
Bell CC, Dankers ACA, Lauschke VM, et al. Comparison of hepatic 2D sandwich cultures and 3D spheroids for long-term toxicity applications: a multicenter study. Toxicol Sci. 2018;162(2):655–666. | ||
Schyschka L, Sánchez JJ, Wang Z, et al. Hepatic 3D cultures but not 2D cultures preserve specific transporter activity for acetaminophen-induced hepatotoxicity. Arch Toxicol. 2013;87(8):1581–1593. | ||
Elaut G, Henkens T, Papeleu P, et al. Molecular mechanisms underlying the dedifferentiation process of isolated hepatocytes and their cultures. Curr Drug Metab. 2006;7(6):629–660. | ||
Gitlin L, Schulze P, Ohla S, Bongard HJ, Belder D. Surface modification of PDMS microfluidic devices by controlled sulfuric acid treatment and the application in CHIP electrophoresis. Electrophoresis. 2015;36(3):449–456. | ||
Gokaltun A, Yarmush ML, Asatekin A, Usta OB. Recent advances in nonbiofouling PDMS surface modification strategies applicable to microfluidic technology. Technology. 2017;05(01):1–12. | ||
Unger JK, Kuehlein G, Schroers A, Gerlach JC, Rossaint R. Adsorption of xenobiotics to plastic tubing incorporated into dynamic in vitro systems used in pharmacological research – limits and progress. Biomaterials. 2001;22(14):2031–2037. | ||
Zhou Y, Hu P, Jiang J. Metabolite characterization of a novel sedative drug, remimazolam in human plasma and urine using ultra high-performance liquid chromatography coupled with synapt high-definition mass spectrometry. J Pharm Biomed Anal. 2017;137:78–83. | ||
Buchwald P, Bodor N. Recent advances in the design and development of soft drugs. Pharmazie. 2014;69(6):403–413. | ||
Sneyd JR, Rigby-Jones AE. New drugs and technologies, intravenous anaesthesia is on the move (again). Br J Anaesth. 2010;105(3):246–254. |
 © 2019 The Author(s). This work is published and licensed by Dove Medical Press Limited. The full terms of this license are available at https://www.dovepress.com/terms.php and incorporate the Creative Commons Attribution - Non Commercial (unported, v3.0) License.
By accessing the work you hereby accept the Terms. Non-commercial uses of the work are permitted without any further permission from Dove Medical Press Limited, provided the work is properly attributed. For permission for commercial use of this work, please see paragraphs 4.2 and 5 of our Terms.
© 2019 The Author(s). This work is published and licensed by Dove Medical Press Limited. The full terms of this license are available at https://www.dovepress.com/terms.php and incorporate the Creative Commons Attribution - Non Commercial (unported, v3.0) License.
By accessing the work you hereby accept the Terms. Non-commercial uses of the work are permitted without any further permission from Dove Medical Press Limited, provided the work is properly attributed. For permission for commercial use of this work, please see paragraphs 4.2 and 5 of our Terms.