")
Back to Journals » Drug Design, Development and Therapy » Volume 14
Metabolic Stability Assessment of Larotrectinib Using Liquid Chromatography Tandem Mass Spectrometry
Authors Attwa MW , Kadi AA, Darwish HW
Received 25 October 2019
Accepted for publication 20 December 2019
Published 10 January 2020 Volume 2020:14 Pages 111—119
DOI https://doi.org/10.2147/DDDT.S235934
Checked for plagiarism Yes
Review by Single anonymous peer review
Peer reviewer comments 2
Editor who approved publication: Dr Georgios Panos
Mohamed W Attwa, 1, 2 Adnan A Kadi, 1 Hany W Darwish 1, 3
1Department of Pharmaceutical Chemistry, College of Pharmacy, King Saud University, Riyadh 11451, Saudi Arabia; 2Students’ University Hospital, Mansoura University, Mansoura 35516, Egypt; 3Analytical Chemistry Department, Faculty of Pharmacy, Cairo University, Cairo 11562, Egypt
Correspondence: Hany W Darwish Tel +966 1146 77343
Fax +966 1146 76 220
Email [email protected]
Introduction: Larotrectinib (VITRAKVI) is an orally potent tropomyosin receptor kinase (Trk) inhibitor that acts by competitive inhibition of all corresponding receptor kinases. It demonstrated a marked response rate (75%) and robust anticancer activity in Trk fusion-positive patients. This response is independent of cancer type, age and gender.
Methods: In this study, an efficient and accurate LC-MS/MS analytical method was developed for Larotrectinib (LRB) quantification in addition to evaluation of its metabolic stability. LRB and lapatinib (LTP) (which is chosen as an internal standard; IS) were eluted utilizing an isocratic mobile phase with a reversed phase elution system (C 18 column).
Results and Discussion: The linearity range of the established method was 5– 500 ng/mL (r 2 ≥ 0.9999) in the human liver microsomes (HLMs) matrix. Various parameters were calculated to validate the method sensitivity (limit of quantification was 5 ng/mL) and reproducibility (inter and intra-day accuracy and precision were below 3% in all samples) of our methodology. For evaluation of LRB metabolic stability in HLMs matrix, in vitro half-life (48.8 min) and intrinsic clearance (14.19 μL/min/mg) were computed.
Conclusion: Accordingly, we can conclude that LRB is a moderate extraction ratio drug when compared with other tyrosine kinase inhibitors (TKIs). According to our knowledge, the discussed procedure in this study is the first LC-MS/MS analytical method for evaluating LRB metabolic stability.
Keywords: larotrectinib, human liver microsomes, metabolic stability evaluation, tandem mass spectrometry
Introduction
Solid tumors that harbored tropomyosin receptor kinase (Trk) gene fusions occurred in many types of cancers that affect adults as well as children.1 These fusions initiate ligand-independent activation and constitutive expression of the Trk kinase and are considered oncogenic. Fusions involving one or more of the neurotrophic tropomyosin receptor kinase (NTRK) genes happen in various pediatric cancers and adult malignancies, such as colorectal cancer, non-small cell lung cancer, and glioblastoma. It was reported that about 40% Trk fusions are existing in uncommon pediatric tumors, like high-grade glioblastoma, papillary thyroid cancer and others.2 Accordingly tumors with positive Trk fusion represent a distinctive molecular subcategory of solid tumors present in infants in addition to adults.3,4
LRB (LOXO-101, VITRAKVI) is a TKI for solid tumors harboring tropomyosin receptor kinase (Trk) gene fusions. LRB (Figure 1) is the first highly potent orally administered ATP-competitive inhibitor of all three Trks (TrkA, TrkB, and TrkC).3,5 On 26 November 2018, the FDA granted accelerated approval to LRB for pediatric and adult patients suffered from solid tumors that have a neurotrophic tropomyosin receptor kinase (NTRK) gene fusion.6 LRB adverse reactions were dizziness, nausea, fatigue, vomiting, diarrhea, increased AST, cough, increased ALT, and constipation.5 The recommended LRB orally doses are 100 mg twice a day for adults and 100 mg/m2 twice a day for pediatric patients.7
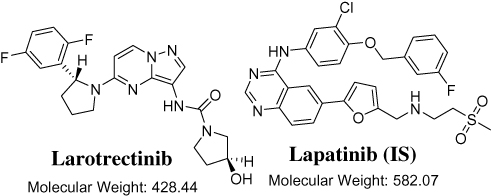 |
Figure 1 Chemical structures of larotrectinib and lapatinib (IS). |
Until writing this manuscript, no single published research was found regarding the determination of LRB in HLMs or LRB metabolic stability assessment. Consequently, these findings prompted us to establish an accurate and reliable method for the determination of LRB level. Accordingly, an isocratic liquid chromatography tandem mass spectrometry (LC–MS/MS) analytical method was utilized for the assessment of LRB concentration in HLMs matrix. The discussed procedure provided about 99% recoveries which are quite better than the reported one (around 90%), additionally, isocratic mobile phase was adopted for elution of the two analytes.8,9
LRB is mainly metabolized in the liver by CYP 3A4 and is highly vulnerable to drug-drug interactions with co-administered CYP 3A modulators, so the dose should be recalculated either dose increase (CYP 3A inducers) or dose decrease by half (CYP3A inhibitors),5 so it is very important to study LRB metabolic stability using HLMs as it is mostly metabolized through liver. For determination of in vivo metabolic clearance rate from in vitro intrinsic clearance, three main models: venous equilibrium, parallel tube and dispersion.10,11 In the current work, the metabolic stability of LRB including intrinsic clearance and in vitro half-life [t1/2] in HLMs were computed according to “in vitro half-life” approach, using the “well-stirred” model12,13 as it is simple and it is considered the most widely utilized model in in vitro drug metabolism experiments. These parameters (intrinsic clearance and in vitro t1/2) could be used for further calculation of various physiological parameters (e.g. hepatic clearance and in vivo t1/2). The determination of bioavailability of a drug provides a picture of its metabolic pathway. If the tested drug is rapidly metabolized, it will exhibit a low in vivo bioavailability value and short duration of action.14 According to this concept, LRB is considered as a moderate extraction ratio drug that exhibited medium excretion rate from the human body if compared to other previous studied TKIs.15–18 This indicates a less probability of accumulating in the body than that of other TKIs (e.g. dacomitinib).
Experimental
Materials
Pooled HLMs (Male human liver) was procured from Sigma-Aldrich (USA). The purchased HLMs (Product Number: M 0567 stored at −70 °C) contains a mixture of liver microsomes pooled from different individual human donors. As stated in the product information sheet: (1) The pathogenicity testing of all liver specimens has been performed using a PCR protocol, (2) The donors were human males of mixed age, (3) The donors were in various states of health, however each liver tested negative for HTLV1&2, HIV1&2, and hepatitis B and C and (4) The protein content is 20 mg/mL in 250 mM sucrose. Total cytochrome P450 enzymes and FMO activities are also reported in the product information sheet. Standard powders are of analytical grade (AR) and organic solvents are HPLC grade. HPLC grade water (H2O) was arranged by in situ Milli-Q plus filtration system (USA). LRB (98.92%) and lapatinib (99.83%) were purchased from Med Chem. Express Company (USA). Acetonitrile, ammonium formate (NH4COOH) and formic acid (HCOOH) were procured from Sigma-Aldrich (USA).
LC-MS/MS Methodology
LC-MS/MS analytical parameters were adjusted to achieve the optimum resolution of LRB and LTP (IS) with good separation (Table 1). A triple quadrupole (QqQ) mass analyzer operated in the positive charge mode with an ESI was utilized for estimation. Nitrogen gas (11 L/min) was used for drying of spray in the ESI source and for collision (55 psi) for fragmentation studies in the collision cell. Flow injection analysis was utilized to optimize all mass spectrometric parameters to achieve the highest ion intensity. The values of ESI temperature (T) and capillary voltage (V) were set at 350°C and 4000 V, respectively. Data acquisition was managed using the Mass Hunter software. LRB was estimated utilizing multiple reactions monitoring (MRM) mode for the mass transitions (parent to daughter ions) from 429→342 and 429→88 for LRB and 581→365 and 581→350 for LTP (Scheme 1). The fragmentor voltage (FV) was adjusted at 135 and 140 V with collision energy (CE) of 18 eV and 20 eV for LRB, and FV of 140 V and 145 V with CE of 30 eV and 32 eV for LTP. MRM mode was used for LRB quantification to discard any interference from the HLMs matrix constituents and elevate the LC-MS/MS method sensitivity (Figure 2).
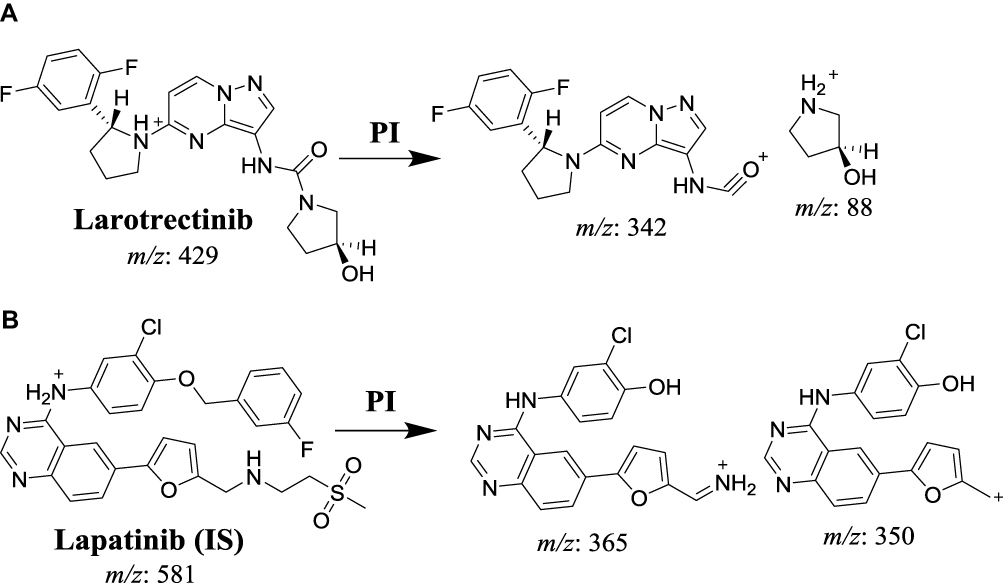 |
Scheme 1 MRM mass transitions (A) larotrectinib and (B) lapatinib (IS). |
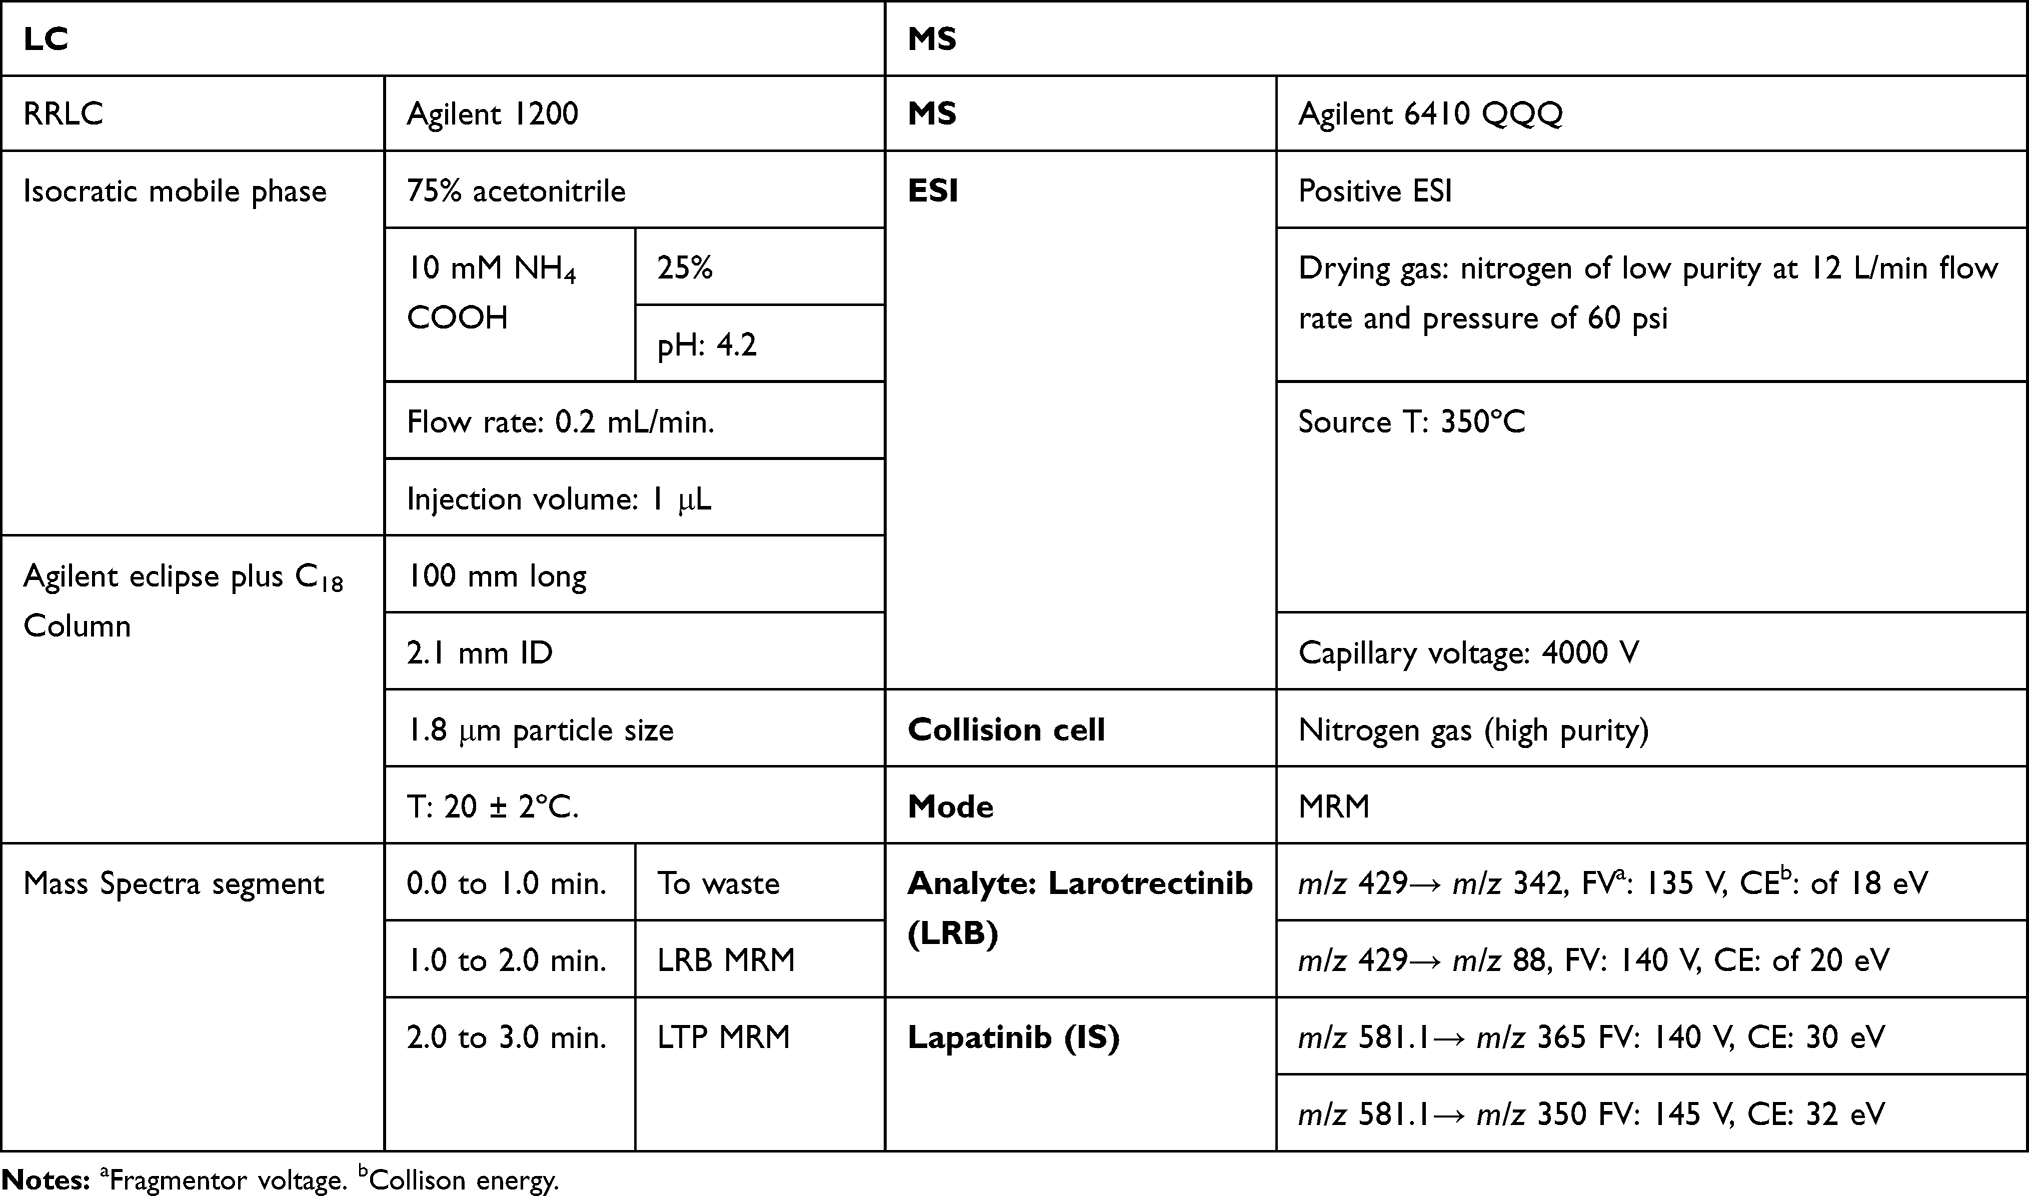 |
Table 1 Analytical Parameters |
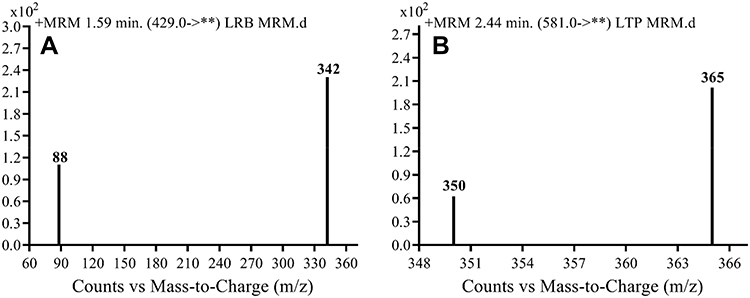 |
Figure 2 MRM mass transitions of (A) larotrectinib LRB) and (B) lapatinib (IS). |
LRB Stock Solutions
LRB and LTP are dimethyl sulfoxide soluble. LRB working solution 1 (WK1, 200 µg/mL) was prepared by ten times dilution of LRB (2 mg/mL) in dimethyl sulfoxide with the mobile phase then further dilution yields WK2 (20 µg/mL). LTP WK3 (2 µg/mL) was prepared by diluting LTP (100 µg/mL) in DMSO 50 times with mobile phase.
LRB Calibration Standards
WK2 was mixed with a 30 µL HLMs matrix (1 mg protein) to prepare 9 calibration standards: 5, 10, 30, 50, 80, 100, 200, 300 and 500 ng/mL that were utilized for calibration curve construction. Four concentrations (5, 15, 150, and 400 ng/mL) were chosen as the lower limit of quantification (LLOQ), low quality control (LQC), medium quality control (MQC), and high quality control (HQC), respectively. Fifty µL of WK3 was then added to each standard. Protein precipitation method was used for the successful extraction of LRB and LTP.19–21 First, 2 mL of acetonitrile was added to1 mL of the standard solution. Second, centrifugation for the mixture at 14,000 rpm for 12 min was done in a cooled centrifuge (4°C) to remove proteins and purify the standard from undesired materials. Third, filtration for one mL of each supernatant was done using a 0.22 µm syringe filter. Fourth, the filtered samples were loaded in 1.5 mL HPLC vials. Last, 1 µL was injected into the detection system. Control samples were prepared following the last five steps except not using HLMs matrix to confirm the absence of any interference from the matrix at the retention times of analytes. A linear calibration curve was constructed by plotting the peak area ratio of LRB to LTP (y-axis) and nominal values of LRB (x-axis). The linearity of the described methodology was confirmed by computing the linear regression equation.
Method Validation
Different parameters (mentioned later) were calculated for confirming validation of the depicted methodology. The details of validation parameters’ calculation were discussed in our previous publications.19,22 The least squared statistical method (y = ax + b) was applied to calculate the equation of the constructed calibration curve. A linear fit was verified by the r2, which exhibited linearity ranged from 5 ng/mL to 500 ng/mL.
LRB Metabolic Stability
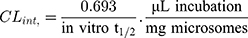
The LRB metabolic stability was analyzed by computing the LRB level after incubation with HLMs. Briefly, 1 µM of LRB was incubated with 30 µL HLMs (1 mg microsomal protein) in 1 mL phosphate buffer and the same experiment was done three times to confirm results. The metabolic reaction was done at pH 7.4 (phosphate buffer) and 3.3 mM magnesium chloride. First, pre-incubation was done at 37°C for 10 min. Second, the initiation of the metabolic reactions was done using NADPH (1 mM) for a specific time. Third, stopping of the reaction was performed at time intervals: 0, 0.5, 2.5, 5.0, 10, 15, 30 and 50 min. by adding 2 mL acetonitrile. From the generated data after sample analysis, LRB metabolic stability curve was established. The LRB percent remaining is plotted versus time. From this plot, time points in the linear range are chosen to plot the natural logarithm of percent parent compound remaining versus time. The slope of the linear part gives the rate constant for the disappearance of LRB that was used for in vitro t1/2 calculation using the following equation:
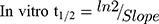
Then LRB intrinsic clearance was calculated by applying using the next equation:23
Results and Discussions
LC–MS/MS Methodology
LTP was selected as IS in LRB quantification as the same extraction technique could be applied for both substances in the HLMs matrix (LRB and LTP recoveries were 99.65 ± 1.31% and 97.2 ± 1.3%, respectively) and the retention time of LTP is near to that of LRB. The established procedure is fast with a 3 min run time. Both LRB and LTP are TKIs and were not given to the same patient, so the established method could be utilized for therapeutic drug monitoring or pharmacokinetics for persons under LRB treatment.
Chromatographic parameters that control the separation of analytes, involving mobile phase composition, pH and stationary phase nature were adjusted. The aqueous part pH of the mobile phase (10 mM ammonium formate) was fixed at 4.2 as higher pH caused a retention time delay and peak tailing. The aqueous/organic part (acetonitrile) ratio was fixed at 25:75% as acetonitrile increase generated overlapped peaks and bad resolution while acetonitrile decrease generated elution time increase. Different stationary phases were used as HILIC columns but LRB and LTP were not retained and the best results were achieved using a C18 column. MRM was applied for LRB quantification to discard any interference from the HLMs matrix components and increase the developed method sensitivity (Figure 2).
The retention times for LRB and LTP were 1.59 min. and 2.44 min, respectively with good base peak separation. The total run time for the developed analytical method was 3 min. There was no noticeable carryover in the blank HLMs matrix. Figure 3C displays the LRB LQC MRM chromatograms.
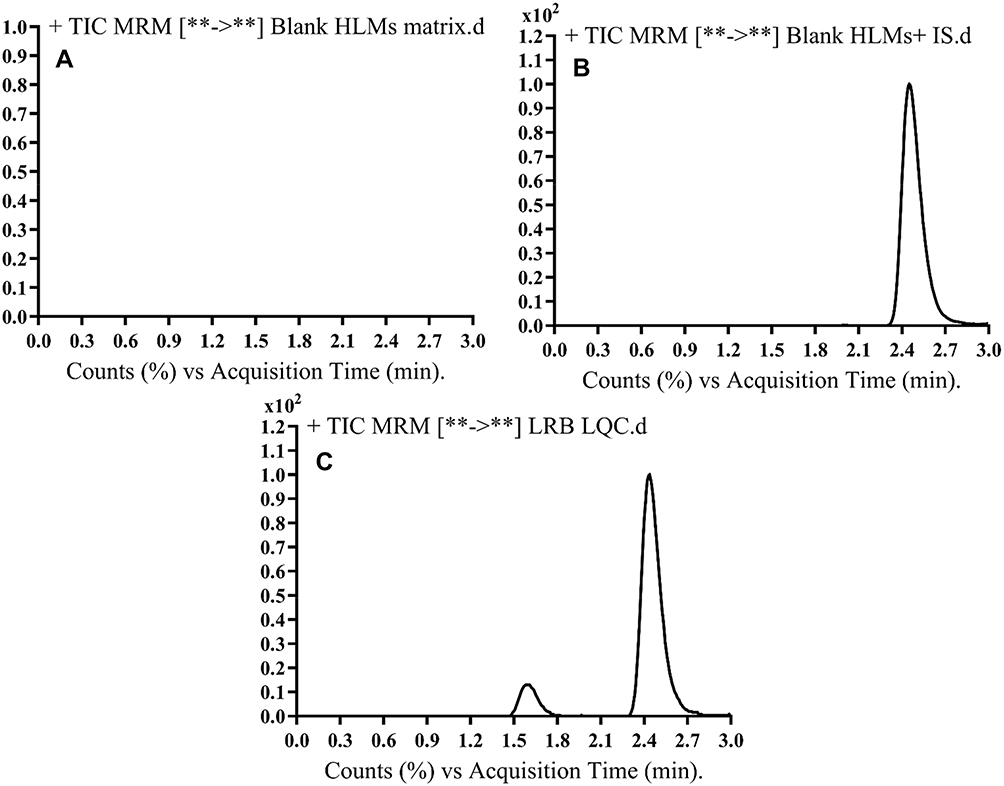 |
Figure 3 MRM chromatograms of (A) blank HLMs, (B) blank HLMs with IS, and (C) LQC of LRB (15 ng/mL) showing LRB peak (1.59 min.) and LTP peak (2.44 min.). |
Validation Parameters
Specificity
Figure 3 shows good resolution of the LRB and LTP peaks and the nonexistence of foreign peaks in the blank HLMs matrix at the specified elution times that approved the specificity of the presented analytical method. No carry-over effect of LRB and LTP was observed in the MRM mass spectra chromatograms.
Sensitivity and Linearity
The linearity range and r2 for the proposed analytical method were 5–500 ng/mL and ≥ 0.9999, respectively. The linear regression equation of LRB calibration curve was y= 1.531x+ 4.7294. LLQC peak exhibited a high signal to noise (S/N) ratio and a perfect peak shape confirming the sensitivity of the LC-MS/MS method. RSD values for the six repetitions of each standard level were < 2.34% (Table 2). The LOD and LOQ were 0.58 ng/mL and 1.93 ng/mL, respectively. Back calculations for the 12 LRB standards (calibration standards and QC samples) in the HLMs matrix firmly established the successfulness of the depicted analytical method.
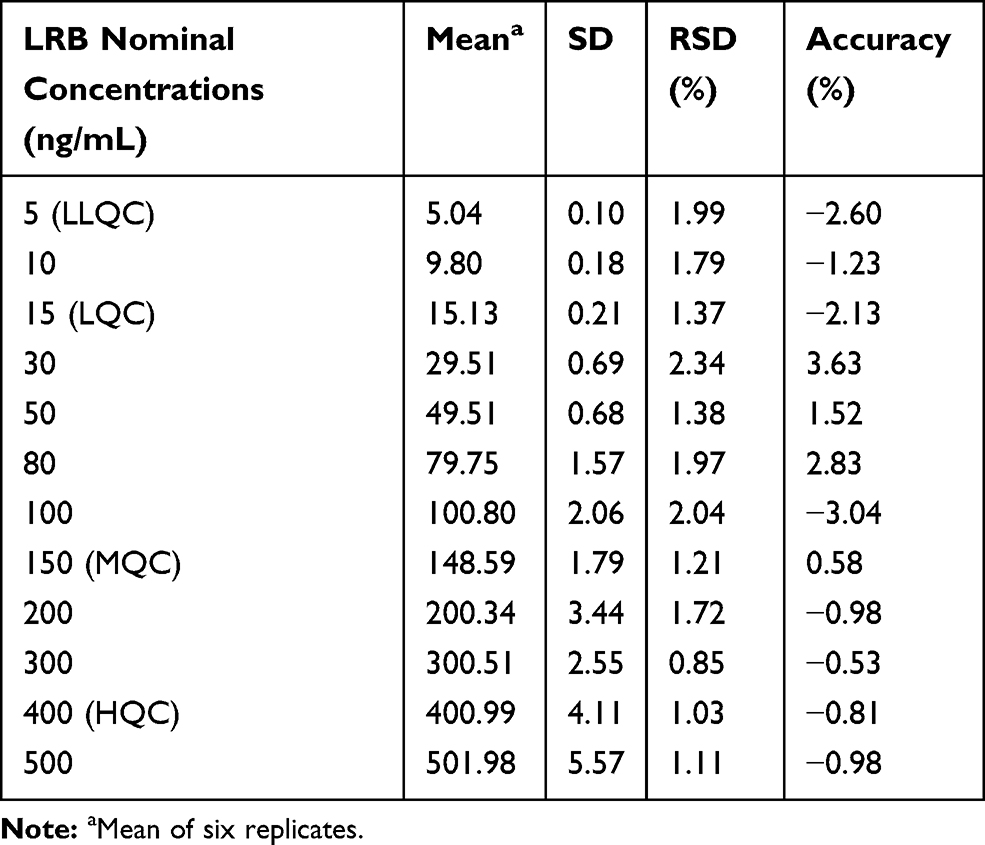 |
Table 2 LRB Back-Calculated Calibration Levels |
Precision and Accuracy
Accuracies and precisions values are acceptable according to the FDA guidelines.24 The values of intra-day and inter-day precision and accuracy of the adopted methodology were −2.6 to 0.58 and 0.89 to 2.75, respectively (Table 3). The average LRB recoveries were 99.79 ± 2.14%.
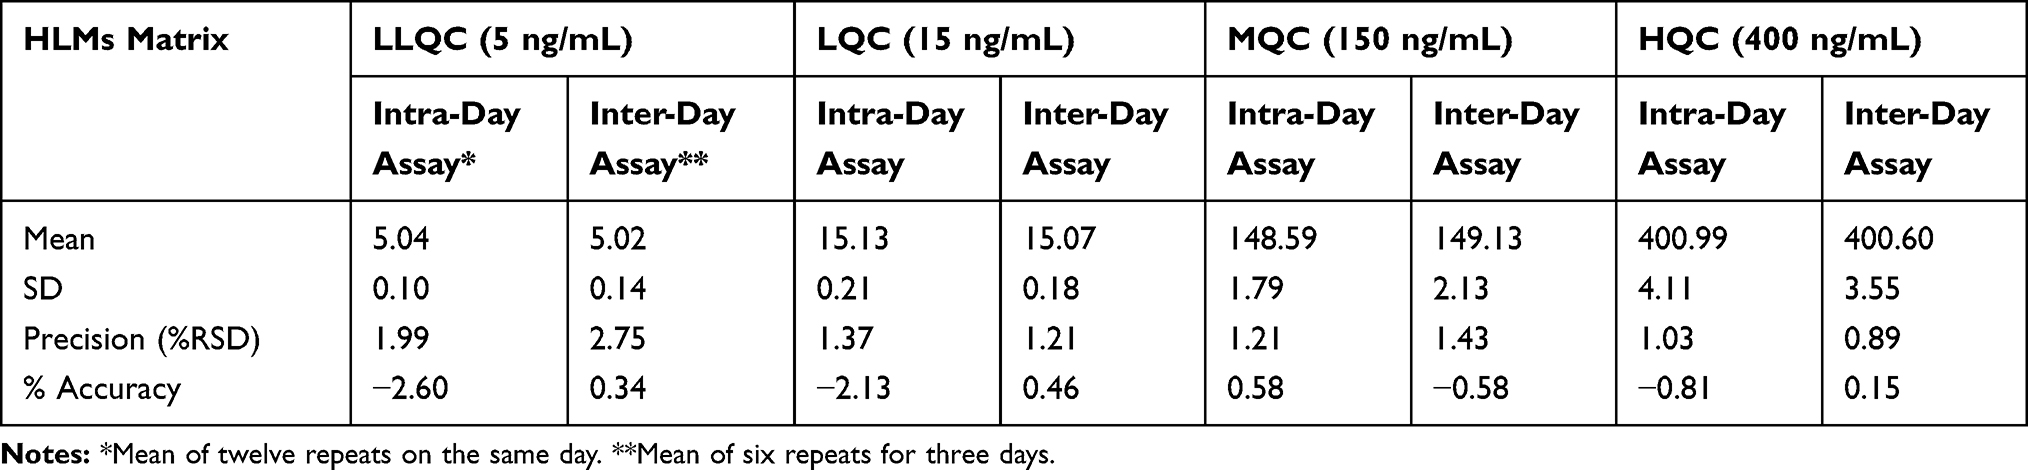 |
Table 3 Intra-Day and Inter-Day (Accuracy and Precision) of Established Method |
Extraction Recovery and Matrix Effects
Table 4 shows the recovery percentages of the QC samples for computing the LRB concentration in the HLMs matrix. The recovery of LRB in the spiked HLMs matrix was 99.79 ± 1.32% (relative standard deviation [RSD] < 1.12%). LTP recovery was 97.2 ± 1.3%. Matrix effect absence on LRB or LTP was validated by analyzing two HLMs batches (set 1), which were spiked with the LRB LQC (15 ng/mL) and LTP (100 ng/mL). Set 2 batches were prepared using the mobile phase instead of the HLMs matrix. Matrix effect factor for LRB and LTP was computed by applying the next equation:
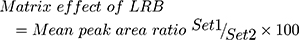

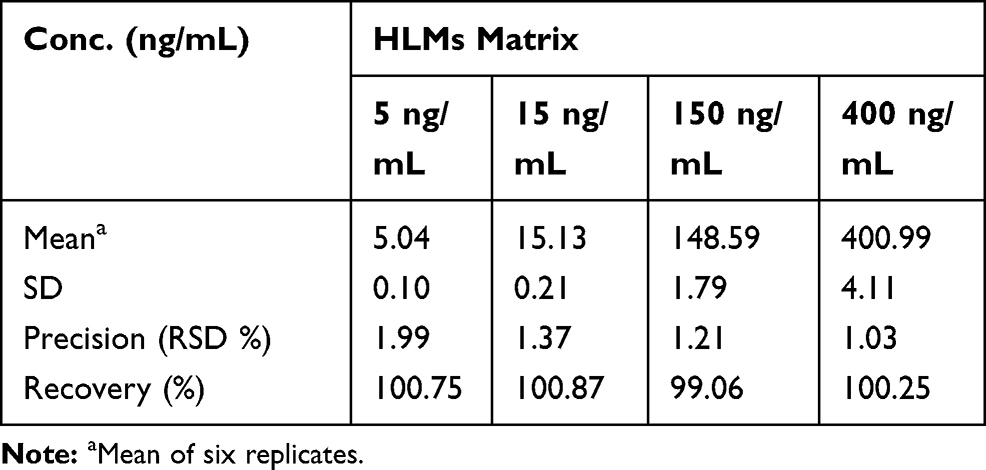 |
Table 4 Recovery of LRB Samples in the HLMs Matrix |
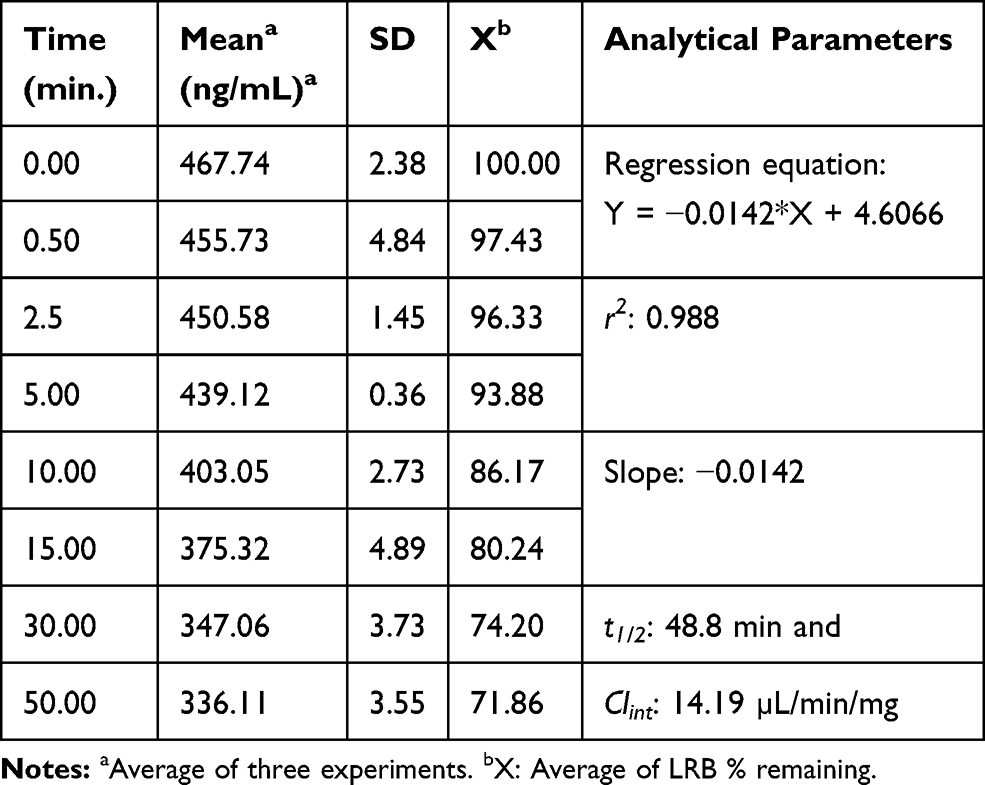 |
Table 5 Parameters of LRB Metabolic Stability |
The tested HLMs containing LRB and LTP exhibited matrix effects of 99.65 ± 1.31% and 97.2 ± 1.3, respectively. IS normalized matrix effect (IS normalized MF) was calculated by applying the next equation:

The IS normalized MF was 1.02 and it lies in the satisfactory range.25 Hence, these findings revealed that the HLMs matrix had no obvious impact on the ionization of LRB and LTP.
Metabolic Stability
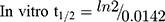
LRB conc. during HLMs incubation is 1 µM to be sure it is below the Michaelis-Menten constant to establish a linear relationship between the ratio of metabolism and incubation time. One mg/mL microsomal protein is utilized to confirm the absence of non-specific protein binding. The LRB concentration in the incubated samples was computed by displacing the peak area ratios in the generated calibration regression equation. The curve for metabolic stability was established by plotting the percentage remaining of LRB on the y-axis against the incubation time on the x-axis (Figure 4A). From this curve, time points in the linear range (0–15 min.) are chosen to plot the natural logarithm (Ln) of LRB remaining versus time (Figure 4B). The slope of the linear part (0.0142) gives the rate constant for the disappearance of LRB. The regression equation for the linear part of the curve was y = −0.0142x + 4.6066 with r2 = 0.9888 that was used for in vitro t1/2 calculation (Table 5).17,26–28
 |
Figure 4 LRB Metabolic stability curve in HLMs (A) and Linear part regression line (B). |
Using the next equations:
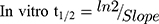
Slope was 0.0142.
LRB intrinsic clearance was calculated using the in vitro t1/2 method14 by applying using the next equation:23
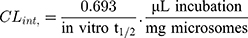

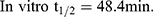
In vitro t1/2 and Clint were 48.4 min and 14.19 µL/min/mg, respectively. From the previous outcomes, LRB could be considered as medium excretion drug. These data in addition to other parameters could be also utilized for the prediction of LRB in vivo pharmacokinetics using the simulation software Cloe PK.29
Conclusions
An analytical LC-MS/MS method was described and validated for determining LRB. The developed method showed good sensitivity, was ecofriendly (owing to using little volume of acetonitrile), fast, accurate, and exhibited high recovery. The LC-MS/MS methodology was applied for the evaluation of LRB metabolic stability in the HLMs matrix. Our findings demonstrated that the metabolic stability of LRB showed moderate Clint (14.19 µL·min−1·kg−1) and in vitro t1/2 values (48.4 min) that would generate a moderate clearance of LRB by the liver, thus good in vivo bioavailability can be expected. From these results, we can predict that this drug could be given to patients without dose accumulation or fast excretion from the blood.
Acknowledgments
The authors would like to extend their sincere appreciation to the Deanship of Scientific Research at the King Saud University for funding this work through the Research Group Project No. RGP-322.
Disclosure
The authors declare no conflicts of interest in this work.
References
1. Doebele RC, Davis LE, Vaishnavi A, et al. An oncogenic NTRK fusion in a patient with soft-tissue sarcoma with response to the tropomyosin-related kinase inhibitor LOXO-101. Cancer Discov. 2015;5(10):1049–1057. doi:10.1158/2159-8290.CD-15-0443
2. Amatu A, Sartore-Bianchi A, Siena S. NTRK gene fusions as novel targets of cancer therapy across multiple tumour types. ESMO Open. 2016;1(2):e000023. doi:10.1136/esmoopen-2015-000023
3. Drilon A, Laetsch TW, Kummar S, et al. Efficacy of larotrectinib in TRK fusion–positive cancers in adults and children. N Engl J Med. 2018;378(8):731–739. doi:10.1056/NEJMoa1714448
4. Kummar S, Lassen UN. TRK inhibition: a new tumor-agnostic treatment strategy. Target Oncol. 2018;13(5):545–556. doi:10.1007/s11523-018-0590-1
5. Laetsch TW, Hawkins DS. Larotrectinib for the treatment of TRK fusion solid tumors. Expert Rev Anticancer Ther. 2019;19(1):1–10. doi:10.1080/14737140.2019.1538796
6. A key Genetic ODT. Recent FDa news advancing treatments in oncology. Oncology Times. 2019.
7. Berger S, Martens UM, Bochum S. Larotrectinib (LOXO-101). Recent Results Cancer Res; 2018:141–151.
8. Sparidans RW, Wang Y, Schinkel AH, Schellens JH, Beijnen JH. Quantitative bioanalytical assay for the tropomyosin receptor kinase inhibitor larotrectinib in mouse plasma and tissue homogenates using liquid chromatography-tandem mass spectrometry. J Chromatogr B. 2018;1102:167–172. doi:10.1016/j.jchromb.2018.10.023
9. Schellinger AP, Carr PW. Isocratic and gradient elution chromatography: a comparison in terms of speed, retention reproducibility and quantitation. J Chromatogr A. 2006;1109(2):253–266. doi:10.1016/j.chroma.2006.01.047
10. Rowland M, Benet LZ, Graham GG. Clearance concepts in pharmacokinetics. J Pharmacokinet Biopharm. 1973;1(2):123–136. doi:10.1007/BF01059626
11. Wilkinson GR, Shand DG. Commentary: a physiological approach to hepatic drug clearance. Clin Pharmacol Ther. 1975;18(4):377–390. doi:10.1002/cpt.1975.18.issue-4
12. Houston JB. Utility of in vitro drug metabolism data in predicting in vivo metabolic clearance. Biochem Pharmacol. 1994;47(9):1469–1479. doi:10.1016/0006-2952(94)90520-7
13. Obach RS, Baxter JG, Liston TE, et al. The prediction of human pharmacokinetic parameters from preclinical and in vitro metabolism data. J Pharmacol Exp Ther. 1997;283(1):46–58.
14. Baranczewski P, Stanczak A, Sundberg K, et al. Introduction to in vitro estimation of metabolic stability and drug interactions of new chemical entities in drug discovery and development. Pharmacol Rep. 2006;58(4):453–472.
15. Darwish HW, Attwa MW, Kadi AA. Rapid validated liquid chromatographic method coupled with Tandem mass spectrometry for quantification of nintedanib in human plasma. Trop J Pharm Res. 2016;15(11):2467–2473. doi:10.4314/tjpr.v15i11.23
16. Darwish HW, Kadi AA, Attwa MW, Almutairi HS. Investigation of metabolic stability of the novel ALK inhibitor brigatinib by liquid chromatography tandem mass spectrometry. Clin Chim Acta. 2018;480:180–185. doi:10.1016/j.cca.2018.02.016
17. Attwa MW, Kadi AA, Darwish HW, Amer SM, Alrabiah H. A reliable and stable method for the determination of foretinib in human plasma by LC-MS/MS: application to metabolic stability investigation and excretion rate. Eur J Mass Spectrom. 2018;24(4):344–351. doi:10.1177/1469066718768327
18. Amer SM, Kadi AA, Darwish HW, Attwa MW. Liquid chromatography tandem mass spectrometry method for the quantification of vandetanib in human plasma and rat liver microsomes matrices: metabolic stability investigation. Chem Cent J. 2017;11(1):45. doi:10.1186/s13065-017-0274-4
19. Kadi AA, Abdelhameed AS, Darwish HW, Attwa MW, Al‐Shakliah NS. A highly efficient and sensitive LC‐MS/MS method for the determination of afatinib in human plasma: application to a metabolic stability study. Biomed Chromatogr. 2016;30(8):1248–1255. doi:10.1002/bmc.3674
20. Attwa MW, Kadi AA, Abdelhameed AS. Reactive intermediates and bioactivation pathways characterization of avitinib by LC–MS/MS: in vitro metabolic investigation. J Pharm Biomed Anal. 2019;164:659–667. doi:10.1016/j.jpba.2018.11.033
21. Attwa MW, Kadi AA, Darwish HW, Amer SM, Al-Shakliah NS. Identification and characterization of in vivo, in vitro and reactive metabolites of vandetanib using LC-ESI-MS/MS. Chem Cent J. 2018;12(1):99. doi:10.1186/s13065-018-0467-5
22. Abdelhameed AS, Attwa MW, Kadi AA. An LC–MS/MS method for rapid and sensitive high‐throughput simultaneous determination of various protein kinase inhibitors in human plasma. Biomed Chromatogr. 2017;31(2):e3793. doi:10.1002/bmc.v31.2
23. Manzo A, Montanino A, Costanzo R, et al. Chapter 33 - EGFR mutations: best results from second- and third-generation tyrosine kinase inhibitors. In: Dammacco F, Silvestris F, editors. Oncogenomics. Academic Press; 2019:477–486.
24. Health UDo, Services H. Bioanalytical method validation, guidance for industry. 2001. Available from: http://www.fda.gov/cder/guidance/4252fnl.htm.
25. Kadian N, Raju KSR, Rashid M, Malik MY, Taneja I, Wahajuddin M. Comparative assessment of bioanalytical method validation guidelines for pharmaceutical industry. J Pharm Biomed Anal. 2016;126:83–97. doi:10.1016/j.jpba.2016.03.052
26. Scott WJ, Hentemann MF, Rowley RB, et al. Discovery and SAR of Novel 2,3-Dihydroimidazo[1,2-c]quinazoline PI3K Inhibitors: identification of Copanlisib (BAY 80-6946). ChemMedChem. 2016;11(14):1517–1530. doi:10.1002/cmdc.201600148
27. Attwa Mohamed W, Kadi AA, Darwish HW, Abdelhameed AS. Investigation of the metabolic stability of olmutinib by validated LC-MS/MS: quantification in human plasma. RSC Adv. 2018;8(70):40387–40394. doi:10.1039/C8RA08161A
28. Kadi AA, Darwish HW, Attwa MW, Amer SM. Validated LC-MS/MS method for the quantification of ponatinib in plasma: application to metabolic stability. PLoS One. 2016;11(10):e0164967. doi:10.1371/journal.pone.0164967
29. Leahy DE. Integrating in vitro ADMET data through generic physiologically based pharmacokinetic models. Expert Opin Drug Metab Toxicol. 2006;2(4):619–628. doi:10.1517/17425255.2.4.619
 © 2020 The Author(s). This work is published and licensed by Dove Medical Press Limited. The full terms of this license are available at https://www.dovepress.com/terms.php and incorporate the Creative Commons Attribution - Non Commercial (unported, v3.0) License.
By accessing the work you hereby accept the Terms. Non-commercial uses of the work are permitted without any further permission from Dove Medical Press Limited, provided the work is properly attributed. For permission for commercial use of this work, please see paragraphs 4.2 and 5 of our Terms.
© 2020 The Author(s). This work is published and licensed by Dove Medical Press Limited. The full terms of this license are available at https://www.dovepress.com/terms.php and incorporate the Creative Commons Attribution - Non Commercial (unported, v3.0) License.
By accessing the work you hereby accept the Terms. Non-commercial uses of the work are permitted without any further permission from Dove Medical Press Limited, provided the work is properly attributed. For permission for commercial use of this work, please see paragraphs 4.2 and 5 of our Terms.