")
Back to Journals » Diabetes, Metabolic Syndrome and Obesity » Volume 11
Metabolic profiling of follistatin overexpression: a novel therapeutic strategy for metabolic diseases
Authors Singh R , Pervin S, Lee S, Kuo A, Grijalva V, David J, Vergnes L , Reddy ST
Received 8 December 2017
Accepted for publication 8 January 2018
Published 26 March 2018 Volume 2018:11 Pages 65—84
DOI https://doi.org/10.2147/DMSO.S159315
Checked for plagiarism Yes
Review by Single anonymous peer review
Peer reviewer comments 2
Editor who approved publication: Professor Ming-Hui Zou
Rajan Singh,1,2 Shehla Pervin,1,2 Se-Jin Lee,3,4 Alan Kuo,5 Victor Grijalva,6 John David,7 Laurent Vergnes,8 Srinivasa T Reddy1,6
1Department of Obstetrics and Gynecology, UCLA School of Medicine, Los Angeles, CA, USA; 2Division of Endocrinology and Metabolism, Charles R. Drew University of Medicine and Science, Los Angeles, CA, USA; 3The Jackson Laboratory for Genomic Medicine, Farmington, CT, USA; 4Department of Genetics and Genome Sciences, University of Connecticut School of Medicine, CT, USA; 5Department of Biology, California State University Dominguez Hills, CA, USA; 6Department of Molecular and Medical Pharmacology, UCLA School of Medicine, Los Angeles, CA, USA; 7Department of Comparative Medicine, Pfizer Inc, San Diego, CA, USA; 8Department of Human Genetics, UCLA School of Medicine, Los Angeles, CA, USA
Background: Follistatin (Fst) promotes brown adipocyte characteristics in adipose tissues.
Methods: Abdominal fat volume (CT scan), glucose clearance (GTT test), and metabolomics analysis (mass spectrometry) of adipose tissues from Fst transgenic (Fst-Tg) and wild type (WT) control mice were analyzed. Oxygen consumption (Seahorse Analyzer) and lipidomics (gas chromatography) was analyzed in 3T3-L1 cells.
Results: Fst-Tg mice show significant decrease in abdominal fat content, increased glucose clearance, improved plasma lipid profiles and significant changes in several conventional metabolites compared to the WT mice. Furthermore, overexpression of Fst in 3T3-L1 cells resulted in up regulation of key brown/beige markers and changes in lipidomics profiles.
Conclusion: Fst modulates key factors involved in promoting metabolic syndrome and could be used for therapeutic intervention.
Keywords: follistatin, transgenic, adipocyte, fibroblast growth factor 21, AdipoQ
Introduction
Follistatin (Fst) binds several members of the transforming growth factor-β superfamily including activins and Mst to neutralize their biological activities.1–3 Several genetic studies have demonstrated an essential role for Fst in skeletal muscle development3–6; however, the role of Fst in other metabolic tissues is poorly understood. Fst KO pups die just after birth due to defects in musculoskeletal system4 making it difficult to assess the functional role of Fst in other metabolically relevant tissues. We utilized MEF cultures from WT and Fst KO embryos and analyzed differentially expressed genes and proteins.7 We demonstrated that Fst promotes “browning” of adipocytes, increases cellular bioenergetics through increased expression of markers for brown adipose, FA oxidation and mitochondrial markers.7 More recently, we have demonstrated that Fst-Tg mice have increased expression of BAT-specific proteins in both Epi and SC WAT and BAT when compared to WT mice. While Fst targets Myf5+ cells in BAT, it promotes phosphorylation of p38MAPK and ERK1/2 in WAT to promote adipose browning.8 Activation of white adipose browning program plays a critical role in positively regulating overall systemic metabolism as Epi and SC adipose tissues are the main site of energy storage and mobilization.9–13 Biochemical changes occurring during adipose browning are linked with alteration in several metabolic pathways.14–15 We therefore sought to determine whether Fst expression regulates (in addition to browning) the metabolic repertoire of adipocytes and adipose tissues.
Emerging technologies developed in recent years have allowed high-throughput profiling of various metabolites from blood and tissue specimens and have been helpful in predicting the risk for several diseases.16–18 These metabolites are particularly relevant for studying metabolic diseases and for prediction of potential biomarkers. Metabolomics and principal component analysis have identified several key metabolites that showed strongest difference between obese and lean groups and are strong predictors of metabolic conditions including insulin resistance and glucose intolerance.17
In this study, we have performed comprehensive metabolomics profiling of Epi and SC adipose tissues isolated from WT and Fst-Tg mice to identify key metabolites that are differentially present in these tissues and correlated their functional role in regulating various metabolic parameters. We demonstrated, for the first time, that Fst overexpression in Fst-Tg mice and in differentiating 3T3-L1 cells favorably alters key metabolites including BCAA and their catabolic pathways, carbohydrates, and lipoprotein profiles. We have further demonstrated that in both Tg adipose tissues and in differentiating 3T3-L1 cell culture models, Fst targets AdipoQ/FGF21/pAMPK axis which has been implicated as a key regulator of metabolic syndrome. Collectively, our data suggest that Fst favorably influences key adipose tissue metabolites and suggest a therapeutic role for Fst in the treatment of obesity and related metabolic conditions.
Materials and methods
Animals used and tissue collection
Fst-Tg expressing Fst under the control of a skeletal muscle-specific myosin light chain promoter/enhancer3 were used for our experiments. Since Fst transgene in Fst-Tg was found to be on Y chromosome,3 all experiments were performed using male Fst-Tg mice and age matched control mice. Food consumption was monitored in alternate days and body weights were measured every week. Epi and SC WAT were harvested from 5 week’s old Fst-Tg and WT (C57BL6/J) male mice.3 Mice were housed at a constant temperature (68°F) under artificial light/dark cycle (12 h/12 h) and allowed to have free access to water and food. The Charles R Drew University of Medicine and Science Institutional Animal Care and Use and Committee approved all animal experiments that were conducted by following the guidelines of United States Department of Agricultural Animal Care and Animal Welfare Act.
CT scan
Abdominal fat volume of WT and Fst-Tg mice were analyzed using MicroCAT II small animal CT system (Siemens Preclinical Solutions, Knoxville, TN, USA) and freely available software AMIDE (http://amide.sourceforge.net/) as previously described by Suckow and Stout19 and Wang et al.20
Glucose tolerance test
Four weeks old male WT and Fst-Tg mice were fasted overnight and anesthetized with an IP injection of sodium pentobarbitone (100 mg/kg). A silastic catheter filled with heparinized saline (20 µ/ml) was inserted into left carotid artery. A bolus of glucose (1g/kg body weight) was injected into the IP cavity. 25 µl of blood was collected at 0, 30, 60, 120, 180, and 240 minutes for plasma glucose using HemoCue Glucose 201 analyzer (Ängelholm, Sweden) analysis.
Serum analysis
Serum levels of TG, FFA, TC and HDL were determined by enzymatic colorimetric assays as described previously.21
Cloning of full-length mouse Fst into Piggyback vector and generation of Fst by overexpressing 3T3-L1 cell line
Full-length mouse Fst (NM_008046) was cloned into Piggyback Transposon cargo plasmid vector (Transposagen Inc.) and the sequence was verified. 3T3-L1 cells were transfected with Piggyback transposon containing CMV-Fst PuroTK along with the piggyback transposase, using standard transfection techniques (Figure S1A). The Piggyback transposase recognizes PB transposon sequence (IRT’s), cuts transposon carrying Fst out of the plasmid, and integrates it stably in the genome. Stable clones were selected in presence of 10 µg/ml puromycin. Confirmation of the puromycin resistant Fst overexpressing 3T3-L1 cells (3T3-L1 Fst) in PiggyBac backbone was performed by PCR analysis of the genomic DNA using T7 forward (1268–1283) and Fst reverse (2141–2121) primer sets (Figure S1B). Both control 3T3-L1 and 3T3-L1 Fst cells were allowed to differentiate under standard differentiation conditions for 6–9 days.8,22
Real-time quantitative PCR analysis
Gene expression analysis was performed using 2 µg of total RNA that were reverse transcribed using RNA High Capacity cDNA kit (Applied BioSystems, Foster City, CA, USA). The Power SYBR Green PCR master mix was used with 7500 fast real-time PCR system (Applied BioSystems). Gene-specific primer pairs were designed and experimental mRNA starting quantities were calculated from the standard curves and averaged using 7500 software v1.4 as previously described.7,8,23
Immunoblot analysis
Total cellular proteins (50–100 µg) were resolved on sodium dodecyl sulfate-polyacrylamide gels (10–15%), electrotransferred on polyvinylidene difluoride membranes and analyzed using the following antibodies-anti-Fst (1:1,000 dilutions, cat# ab64490; Abcam, Cambridge, MA, USA), anti-UCP1 (1:1,000 dilutions, cat# 10983; Abcam), p38 MAPK (1:1,000 dilutions, cat# 92125; Cell Signaling, MA, USA), anti-pp38 MAPK (1:1,000 dilutions, cat# 92115; Cell Signaling), anti-ERK1/2(1:1,000 dilutions, cat# 91025; Cell Signaling), anti-pERK1/2 (1:1,000 dilutions, cat# 91015; Cell Signaling), anti-COX-IV (1:1,000 dilution, cat# ab14744; Abcam), anti-SirT1 (1:1,000 dilution, cat# ab110304; Abcam), anti-SirT3 (1:1,000 dilution, cat# ab86671; Abcam), anti-BCAT2 (1:1,000 dilutions, cat# ab95976; Abcam); anti-BCKDHA (1:1,000 dilutions, cat# ab90691; Abcam); anti-AdipoQ (1:1,000 dilutions, cat# MAB 1119; R & D Systems); anti-AMPK/anti-pAMPK (1:1,000 dilutions, cat# 2532; 2535; Cell Signaling); anti-FGF21 (1:1,000 dilutions, cat# MAB25371; R & D Systems); anti-PGC-1α (1: 1,000 dilution, cat# ab54481; Abcam), anti-AdipoR1 (1: 1,000 dilution, cat# sc99183; Santa Cruz Biotech, Dallas, TX, USA), and anti-Mup1 (1: 1,000 dilution, cat# sc66976; Santa Cruz Biotech), anti-β-actin (1:5,000 dilutions, cat# sc-81178; Santa Cruz Biotech) or anti-GAPDH (1:5,000 dilutions, cat# MAB374; Millipore) antibodies with secondary antibodies (1:1,000 dilution) linked to horseradish peroxidase (Cell Signaling). Immunopositive bands were scanned and analyzed as described before.7,8
Analysis of cellular oxygen consumption
OCR of cells (4 × 10⁴ cells per well) were analyzed in a XF24 Extracellular Flux Analyzer (Seahorse Bioscience Inc., North Billerica, MA, USA) as previously described.7
Lipidomics analysis
Analysis of various lipids in differentiated 3T3-L1 control and Fst overexpressing 3T3-L1-Fst cells were performed using gas chromatography time-of-flight technology platform at UC Davis Metabolomics Core Laboratory (http://metabolomics.ucdavis.edu/core-services/metabolomics-central-service-core). The workflow involves sample extraction in methyl tert-butyl ether with addition of internal standards, followed by ultra-high pressure liquid chromatography on a Waters CSH column, interfaced to a quadrupole–time-of-flight mass spectrometer (high resolution, accurate mass), with a 15 minute total run time. Peak areas of lipid species within the range of calibration curves were analyzed by comparing the individual peak areas with those of corresponding internal standards for determining the final concentrations. Data were collected in both positive and negative ion mode and analyzed using MassHunter (Agilent). Approximately 400 lipids species including mono-, di-, and triacylglycerols, glycerophospholipids, sphingolipids, cholesterol esters, ceramides, and FAs can be identified from plasma, with additional unknowns. The method is highly stable and has been validated on large datasets (>8,000 samples) collected over long time periods (>1 year).24
Metabolomic and statistical analysis
Entire metabolomics analysis of Epi and SC adipose tissues from WT and Fst-Tg mice was performed at Metabolon Inc (Morrisville, NC, USA) (www.metabolon.com). Samples were prepared using the automated MicroLab STAR® system from Hamilton Company and processed either with liquid chromatography/mass spectrometry or gas chromatography/mass spectrometry as described before.25 Accurate mass determination, compound identification, bioinformatics, and statistical analysis (R, version 2.6.0, http://www.r-project.org/ and SPSS for Windows version PASW 17.0; SPSS Inc: Chicago, USA) were done by Metabolon Inc. essentially as described before.25
General statistical analysis
Data are presented as mean ± SD. Differences between the groups were analyzed by ANOVA using GraphPad Prism Version 5.3 (GraphPad Software, San Diego, CA, USA). If the overall ANOVA revealed significant differences, then pair-wise comparisons between groups were performed by Newman-Keuls multiple group test. All comparisons were two-tailed and P-values ≤ 0.05 were considered statistically significant. The experiments were repeated at least three times, and data from representative experiments are shown.25
Results
Fst-Tg mice have decreased abdominal fat volume, increased glucose clearance and improved serum lipid profiles
We recently demonstrated that adipose browning of Epi and SC WAT is increased in Fst-Tg mice.8 To test whether increased adipose browning in Fst-Tg mice tissues alters their abdominal fat mass, we performed CT scans of 6 weeks old WT and Fst-Tg male mice fed a normal chow diet. Weekly food consumption was significantly decreased (11.3%; P≤0.05) in Fst-Tg mice compared to the WT mice (Figure 1A). Fst-Tg mice had higher body weights (24.8±1.7 g vs. 18.5±1.1 g) compared to the WT (Figure 1B) because of significant increase in muscle mass as previously reported.3 Analysis of fat content by quantitative analysis of CT scans showed significantly lower percentage of abdominal fat in Fst-Tg mice (15.2±3.6%) compared to the WT (28.4±6.2%) mice (Figure 1C and D). Comparative analysis of whole body glucose disposal in fasting Fst-Tg and WT mice by glucose tolerance test after IP injection of glucose (1 g/kg) showed a significant decrease in glucose levels after 1 and 2 hours, but no significant difference in subsequent time points (3–4 h) (Figure 1E). Comparison of serum TG, TC, HDL, FFA, and glucose levels show significantly decreased levels of TG, UC, FFA and glucose in Fst-Tg mice compared to the WT mice (Figure 1F). However, the changes in TC and HDL levels were not significantly altered between the groups. Mup1 is a key regulator of glucose and lipid metabolism,26 and increases energy expenditure through enhanced mitochondrial function.27 We have previously identified Mup1 as an Fst-inducible gene7 and in this study, we show that Mup1 gene and protein expression are upregulated in liver tissues isolated from WT and Fst-Tg mice (Figure S2A–D), suggesting a potential role for Mup1 in Fst-mediated metabolic changes. These data collectively suggest that Fst upregulation in distant muscle tissues could affect whole body metabolism through increased systemic levels of Fst as reported previously by our group.8
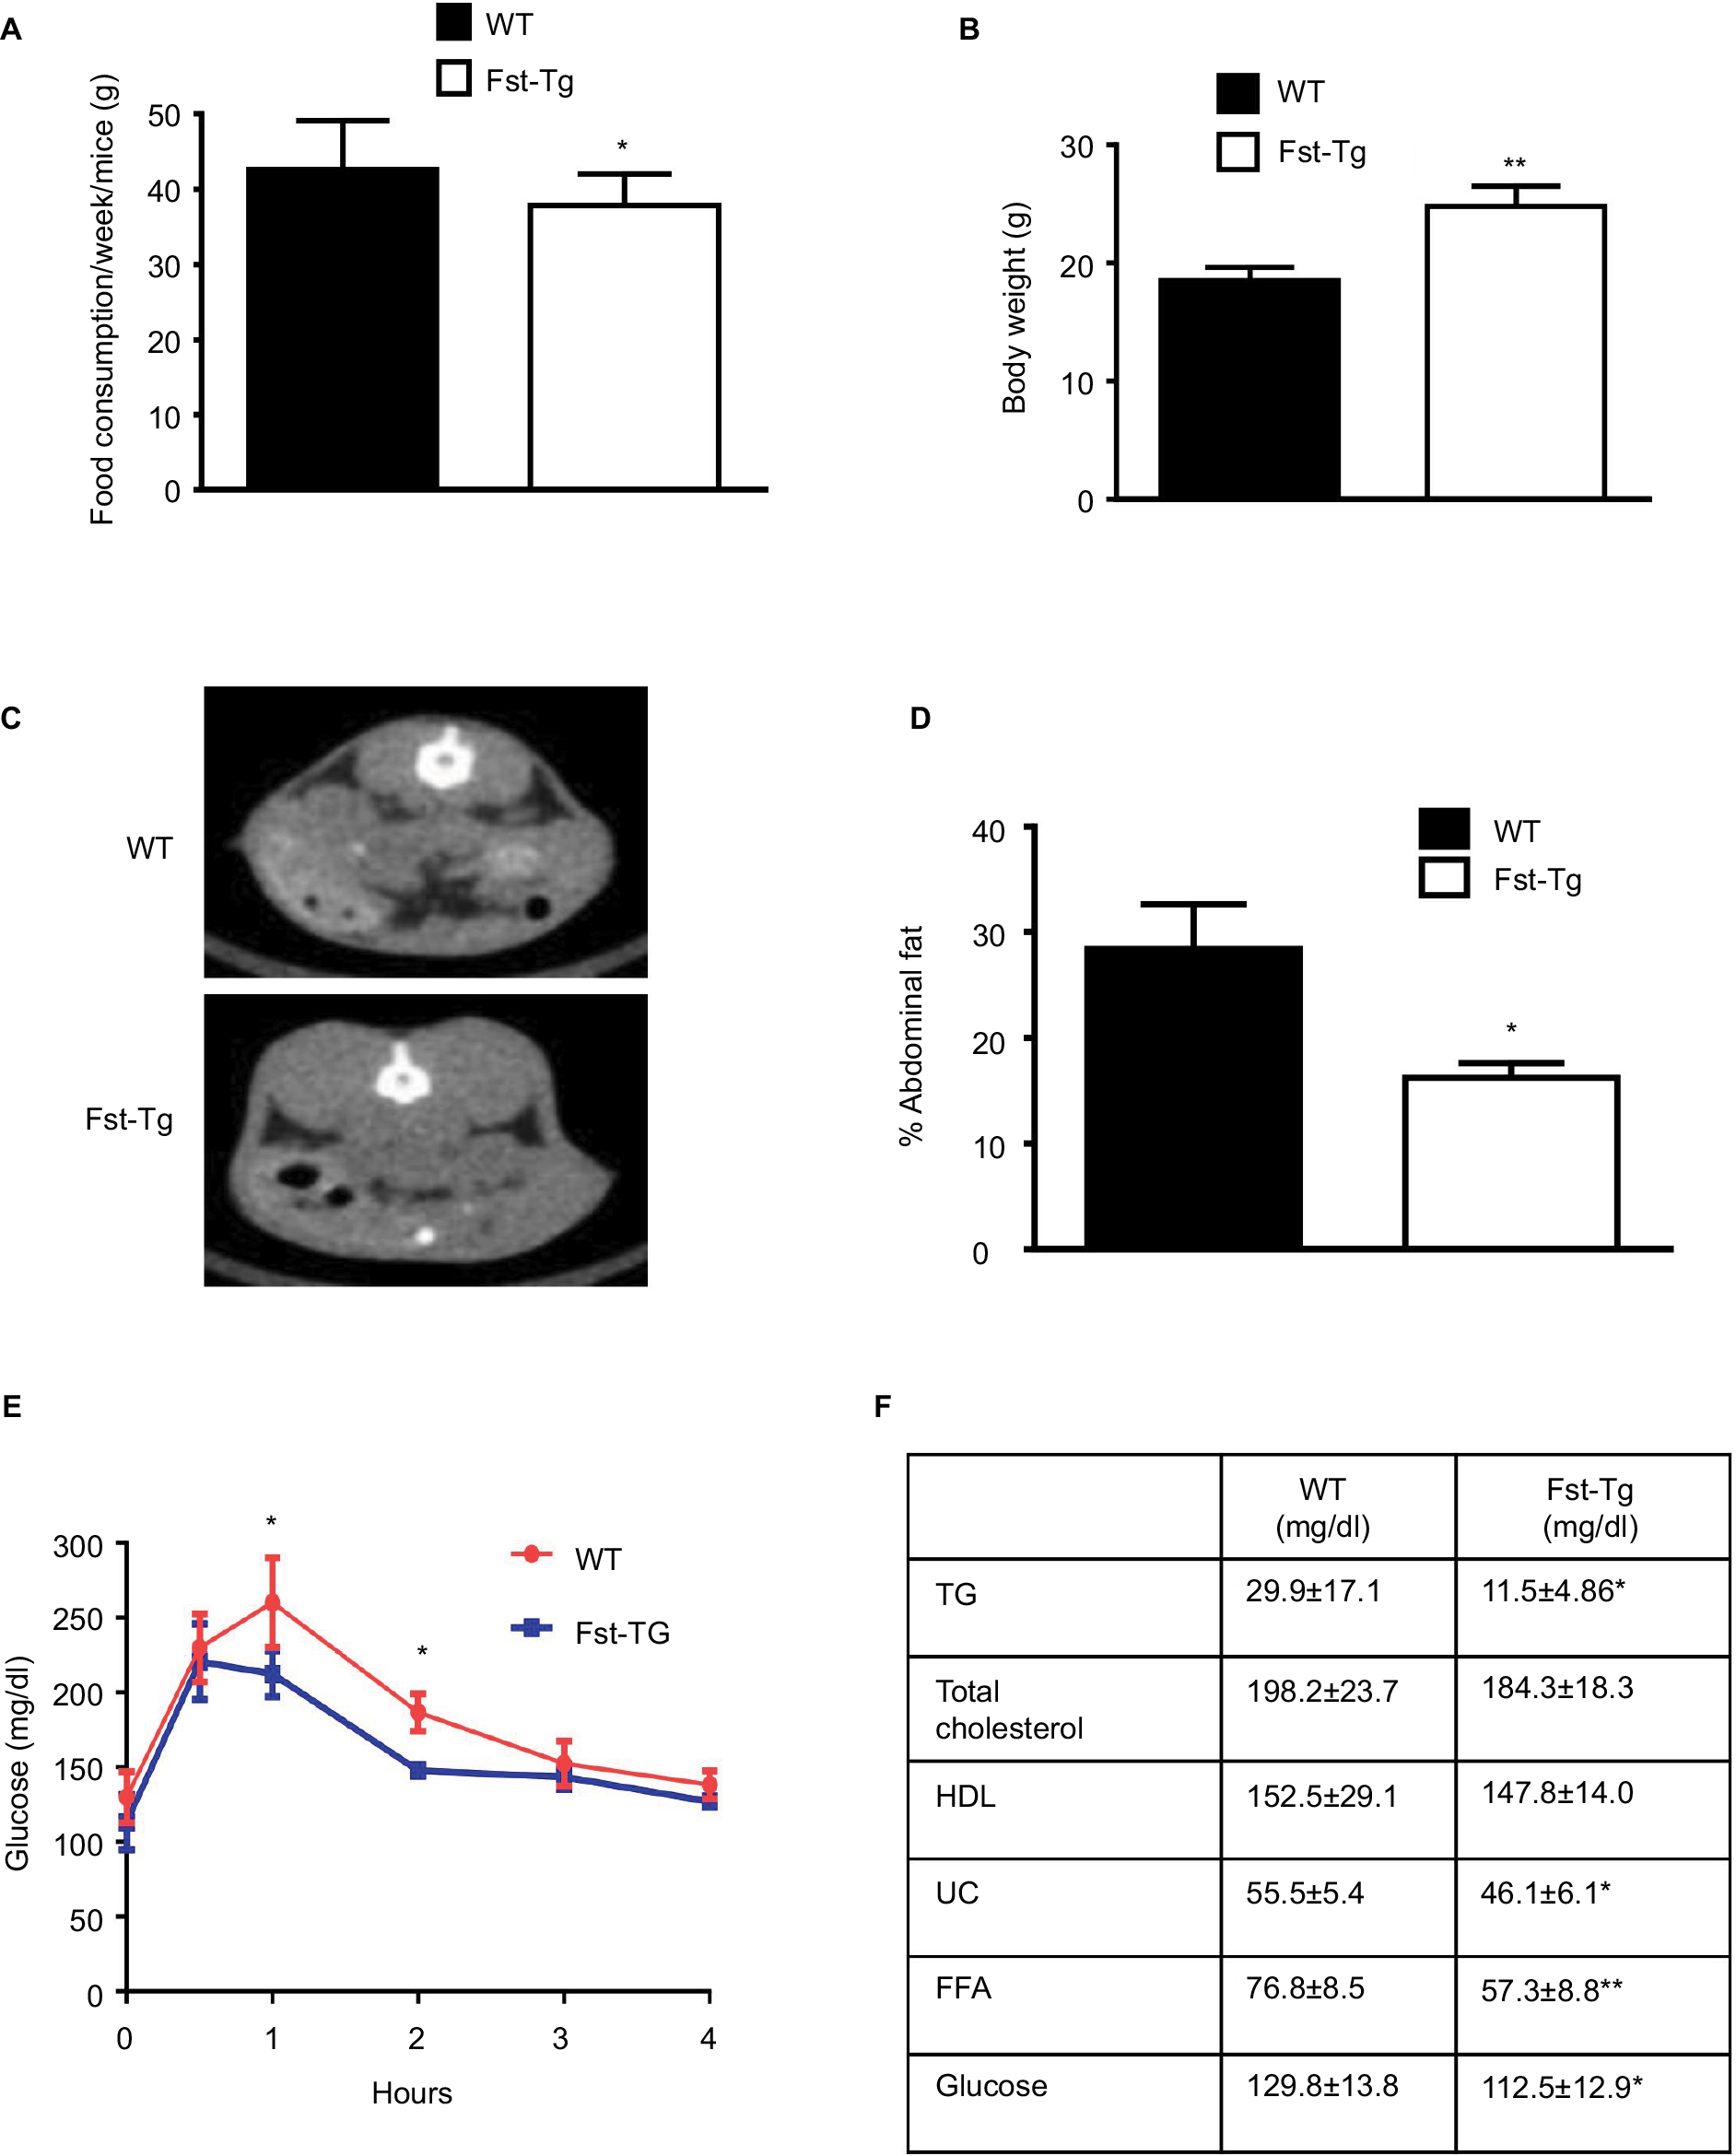 | Figure 1 Analysis of abdominal fat volume, glucose clearance, and serum profiles of WT and Fst-Tg mice. (A) Analysis of weekly total food consumption, (B) body weight, (C) abdominal fat volume by CT-scan, and (D) quantitative analysis of abdominal fat volume in 10 week-old male WT and Fst-Tg mice fed on normal chow. (E) Glucose tolerance test (GTT), 10-week-old male WT and Fst-Tg mice were fasted overnight and given D-glucose (1 g/kg) by IP injection. Blood glucose was measured at different time points. (F) Analysis of serum profiles of 10-week-old WT and Fst-Tg mice. Data are expressed as mean ± SD. *P≤0.05, **P≤0.01 (n=10). Abbreviations: WT, wild type; Fst-Tg, follistatin transgenic; TG, triglyceride; HDL. high-density lipoprotein; UC, unesterified cholesterol; FFA, free fatty acid. |
Differentiated 3T3-L1 cells overexpressing Fst have significantly higher levels of key adipose browning markers and increased maximum OCRs
We cloned the full-length mouse Fst gene into Piggyback Transposon cargo plasmid vector (Transposagen Inc.) and generated 3T3-L1 Fst stable cell line as described in the “Materials and methods” section. Cellular Fst protein content (Figure 2A), Fst gene expression (Figure 2B) and secreted Fst in cell culture supernatants (Figure 2C) were all significantly higher in 3T3-L1 Fst cells compared to the control 3T3-L1 cells. Next, we performed a comprehensive gene expression analysis in 3T3-L1 Fst and 3T3-L1 cells that were allowed to differentiate under standard adipogenic differentiation conditions for 9 days. Key beige adipocyte-related genes including Cd137, Tmem26, Tbx1, Th, and Ptgs2a, mitochondrial markers Ucp1, Cox7a1, Cox8b, and Cpt1a and other key genes implicated in regulating overall energy and lipid metabolism including Fgf21, Bmp7, and Pgc1a were all significantly increased in 3T3-L1 Fst cells compared to 3T3-L1 cells (Figure 2D). Fasn, a key lipogenic marker, and Mst levels were also significantly decreased in 3T3-L1 Fst cells (Figure 2D). Moreover, key beige-related proteins (UCP1, Cd137), mitochondrial protein (COX-IV) along with AdipoQ and SirT-1 and -3 (Figure 2E) were also significantly increased in 3T3-L1 Fst cells, underscoring the role of Fst in adipose browning and regulation of energy metabolic pathways. Furthermore, two key signaling pathways implicated in adipose browning p38 MAP kinase and ERK1/2 phosphorylation,8 were upregulated in differentiated 3T3-L1 Fst cells compared to the 3T3-L1 cells (Figure 2E). Analysis of OCR further suggest significant increase (~62%) in maximal OCR in 3T3-L1 Fst cells compared to 3T3-L1 cells undergoing adipogenic differentiation (Figure 2F), suggesting increased mitochondrial biogenesis. Taken together, our results in cell culture and mice show that Fst is a potent inducer of browning related signaling pathways and may influence overall energy and lipid metabolism.
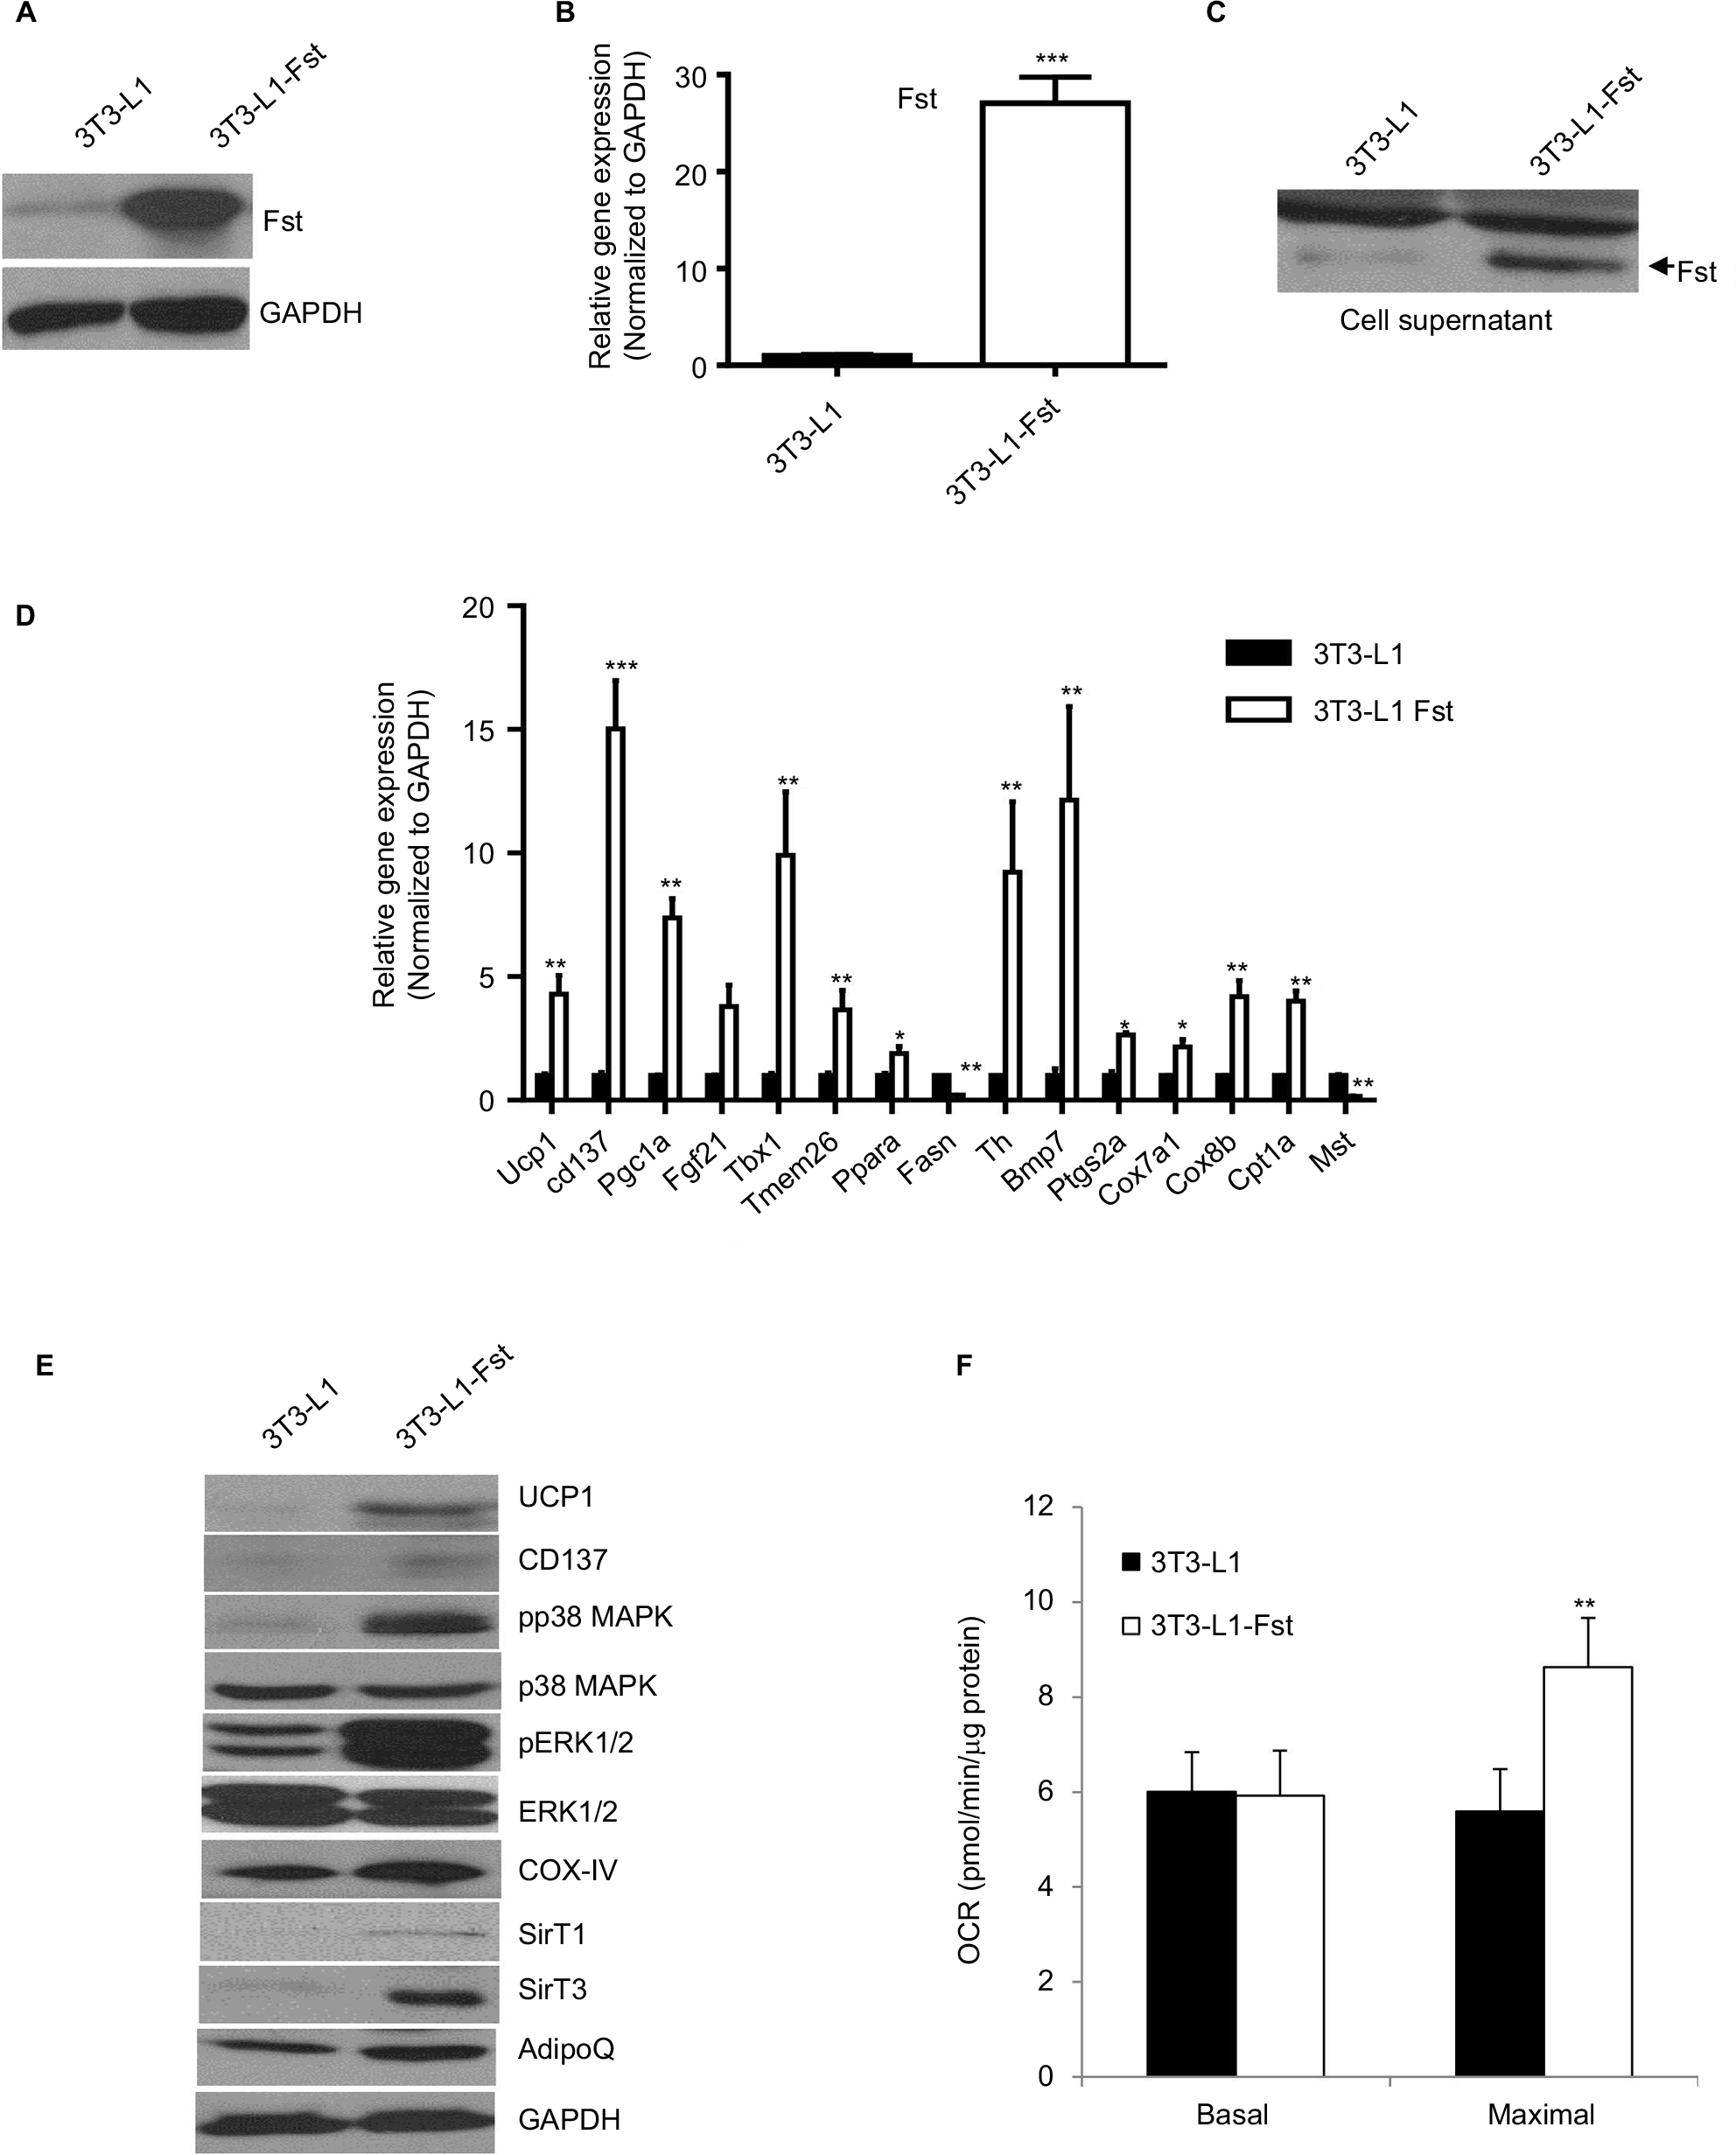 | Figure 2 Comparative analysis of Fst expression, key brown/beige related markers and oxygen consumption in Fst overexpressing 3T3-L1 Fst and 3T3-L1 cells. Analysis of relative Fst protein (A), gene expression (B), and Fst release in cultured medium (30 µl supernatant) (C) in 3T3-L1 and 3T3-L1 Fst grown under normal growth conditions. (D) Quantitative gene expression analysis of key markers involved in adipose browning, mitochondrial biogenesis pathway in cells allowed to differentiate under standard adipogenic differentiation conditions for 9 days. (E) Western blot analysis of key proteins involved in adipose browning and regulation of key signaling pathway involved during the process in differentiated 3T3-L1 and 3T3-L1 Fst cells. (F) Analysis of OCR in differentiated 3T3-L1 and 3T3-L1 Fst cells after 9 days using Seahorse Bioscience XF24 extracellular flux analyzer. Data are expressed as mean ± SD. *P≤0.05, **P≤0.01, and ***P≤0.001. (n=3). Abbreviations: Fst, follistatin; GADPH, glyceraldehyde 3-phosphate dehydrogenase; OCR, oxygen consumption rate; UCP, uncoupling protein; MAPK, mitogen-activated protein kinase; ERK, extracellular-signal-regulated kinase; COX, cyclooxygenase; SirT, sirtuin; AdipoQ, adiponectin. |
Analysis of lipidomic profiles of differentiated 3T3-L1 Fst and 3T3-L1 cells
To test the effect of Fst overexpression on various endogenous lipid metabolites, we performed lipid profiling of day 9 differentiated cells. There was a general reduction in diglycerides, TG; ceramide (d42:0), FA, PC, PE, lysophosphatidylethanolamine (16:0), and LPC (16:1) levels in differentiated 3T3-L1 Fst cells compared to the control 3T3-L1 cells (Table 1). On the other hand, we found significant increase in several LPCs including LPC (16:0), LPC (18:0), and LPC (18:1) in 3T3-L1 Fst cells in comparison to 3T3-L1 cells (Table 1). Ceramide (d42:0) was found to be significantly decreased in 3T3-L1 Fst cells compared to the control 3T3-L1 cells. Our cell culture data, therefore, suggest that Fst overexpression in 3T3-L1 Fst cells favorably alters overall lipid profiling by 1) decreasing lipid metabolites known to contribute toward development of obesity and related metabolic diseases28,29 and 2) significantly increasing several LPCs which are reported to be reduced in obesity and type 2 diabetes associated change in body fat mass.30,31
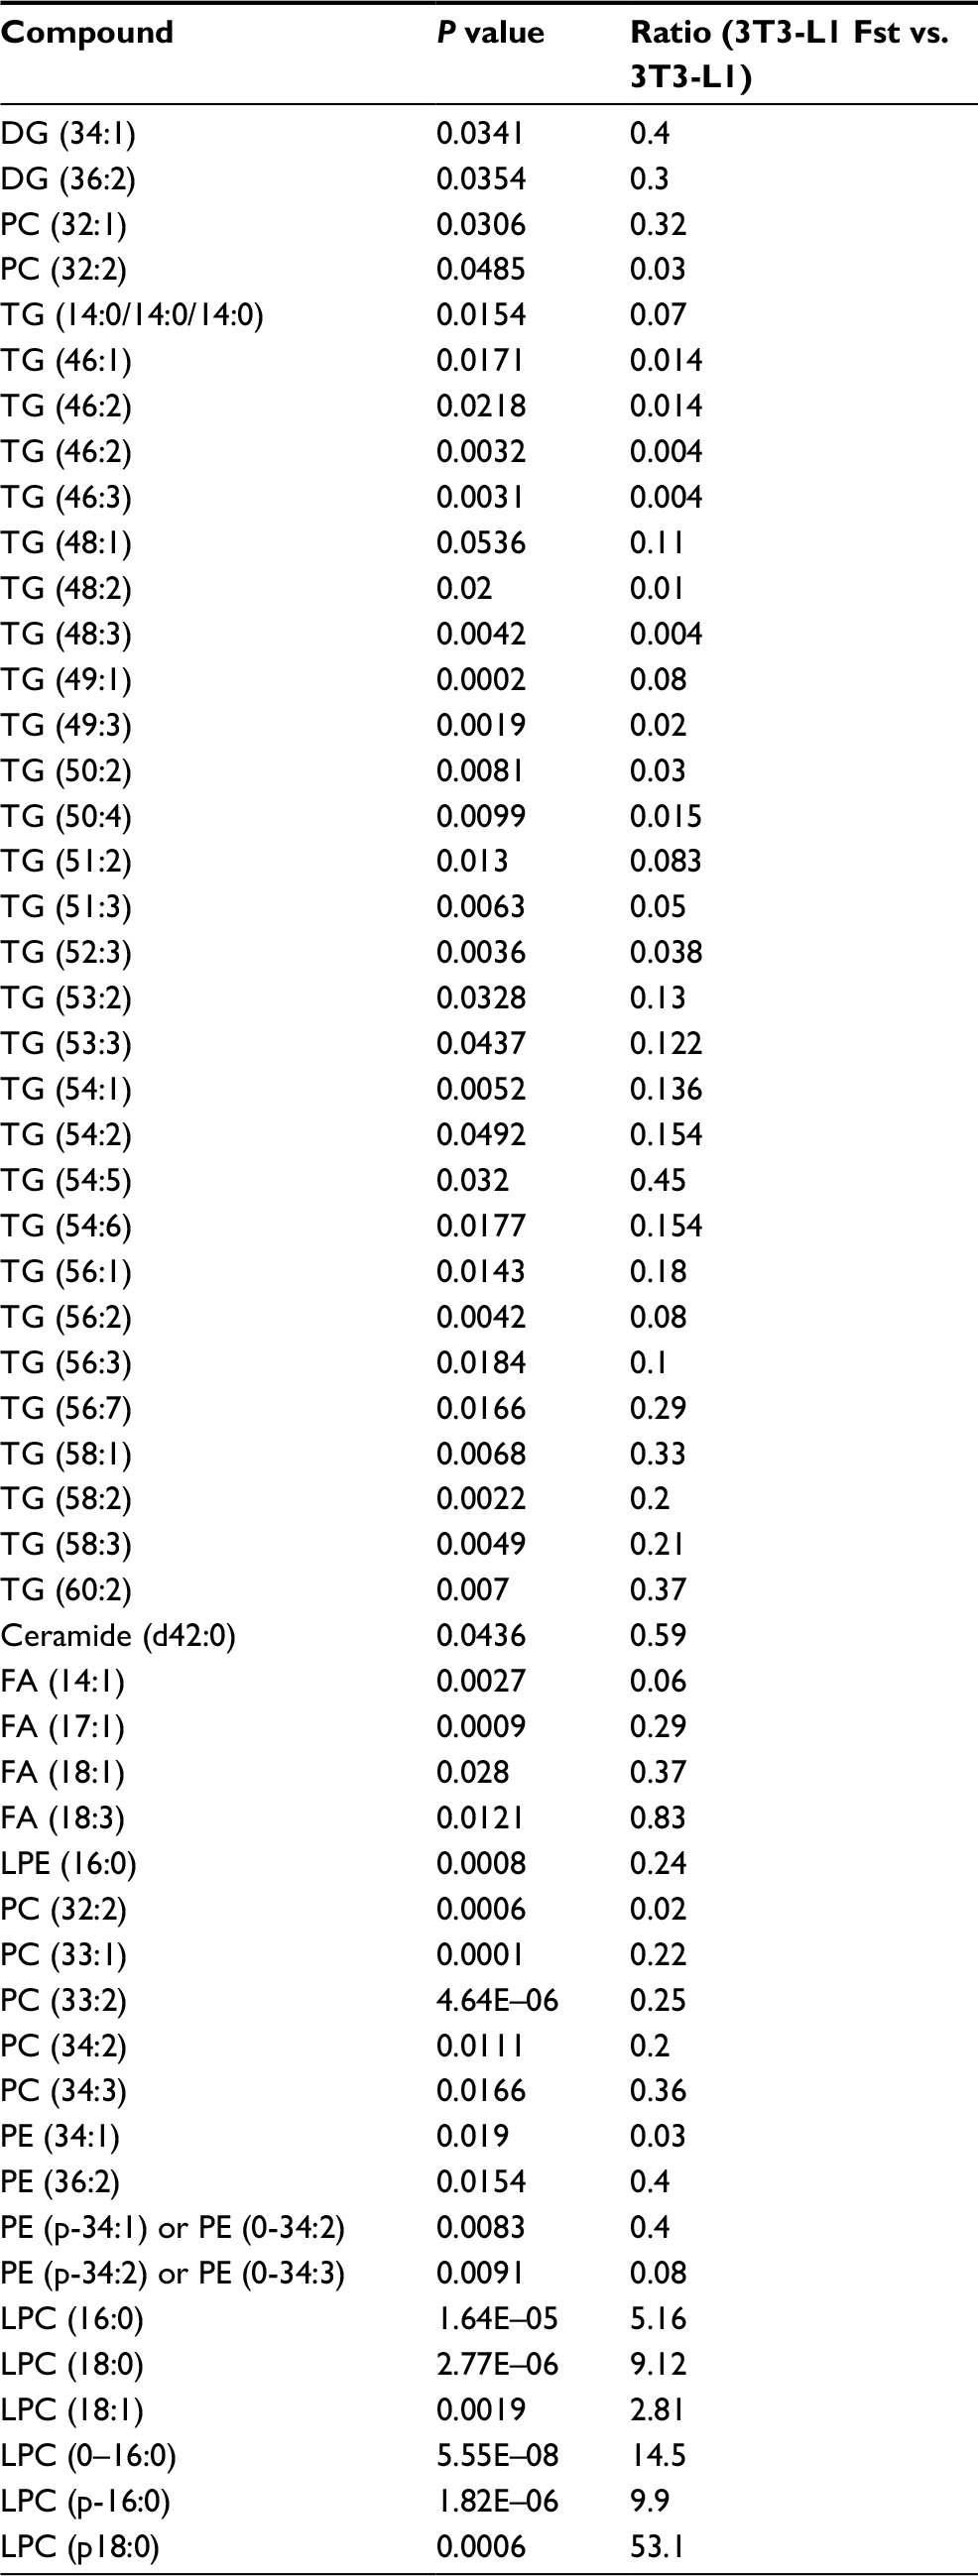 | Table 1 Lipidomics profiling of differentiated 3T3-L1 and 3T3-L1 Fst cells by gas chromatography time-of-flight (n=8). Abbreviations: DG, diacylglycerols; TG, triglyceride; FA, fatty acids; PC, phosphat- idylcholines; PE, phosphatidylethanolamines; LPE, lysophosphatidy-lethanolamine; LPC, lysophosphatidylcholine. |
Metabolomics profiling of Epi and SC adipose tissues from Fst-Tg and WT control mice
Adipose tissue, a key endocrine organ, has been widely implicated not only in the regulation of glucose and lipid homeostasis but also plays an important role in systemic protein and amino acid metabolism. Next, we have performed comprehensive metabolomics analysis of adipose tissues isolated from 6-week-old male WT and Fst-Tg mice. We have also analyzed adipose tissue for our metabolomics analysis to avoid possible confounding effects of secreted Fst produced from muscle tissues in these Fst-Tg mice. We observed significant differences in key metabolites including amino acids, components of FA and carnitine metabolism, carbohydrates, and nucleotides as well as some other chemicals and cofactors (Tables 2 and 3). These differences in various metabolites between WT and Fst-Tg were more prominent in Epi (Table 2) compared to the SC adipose tissues (Table 3).
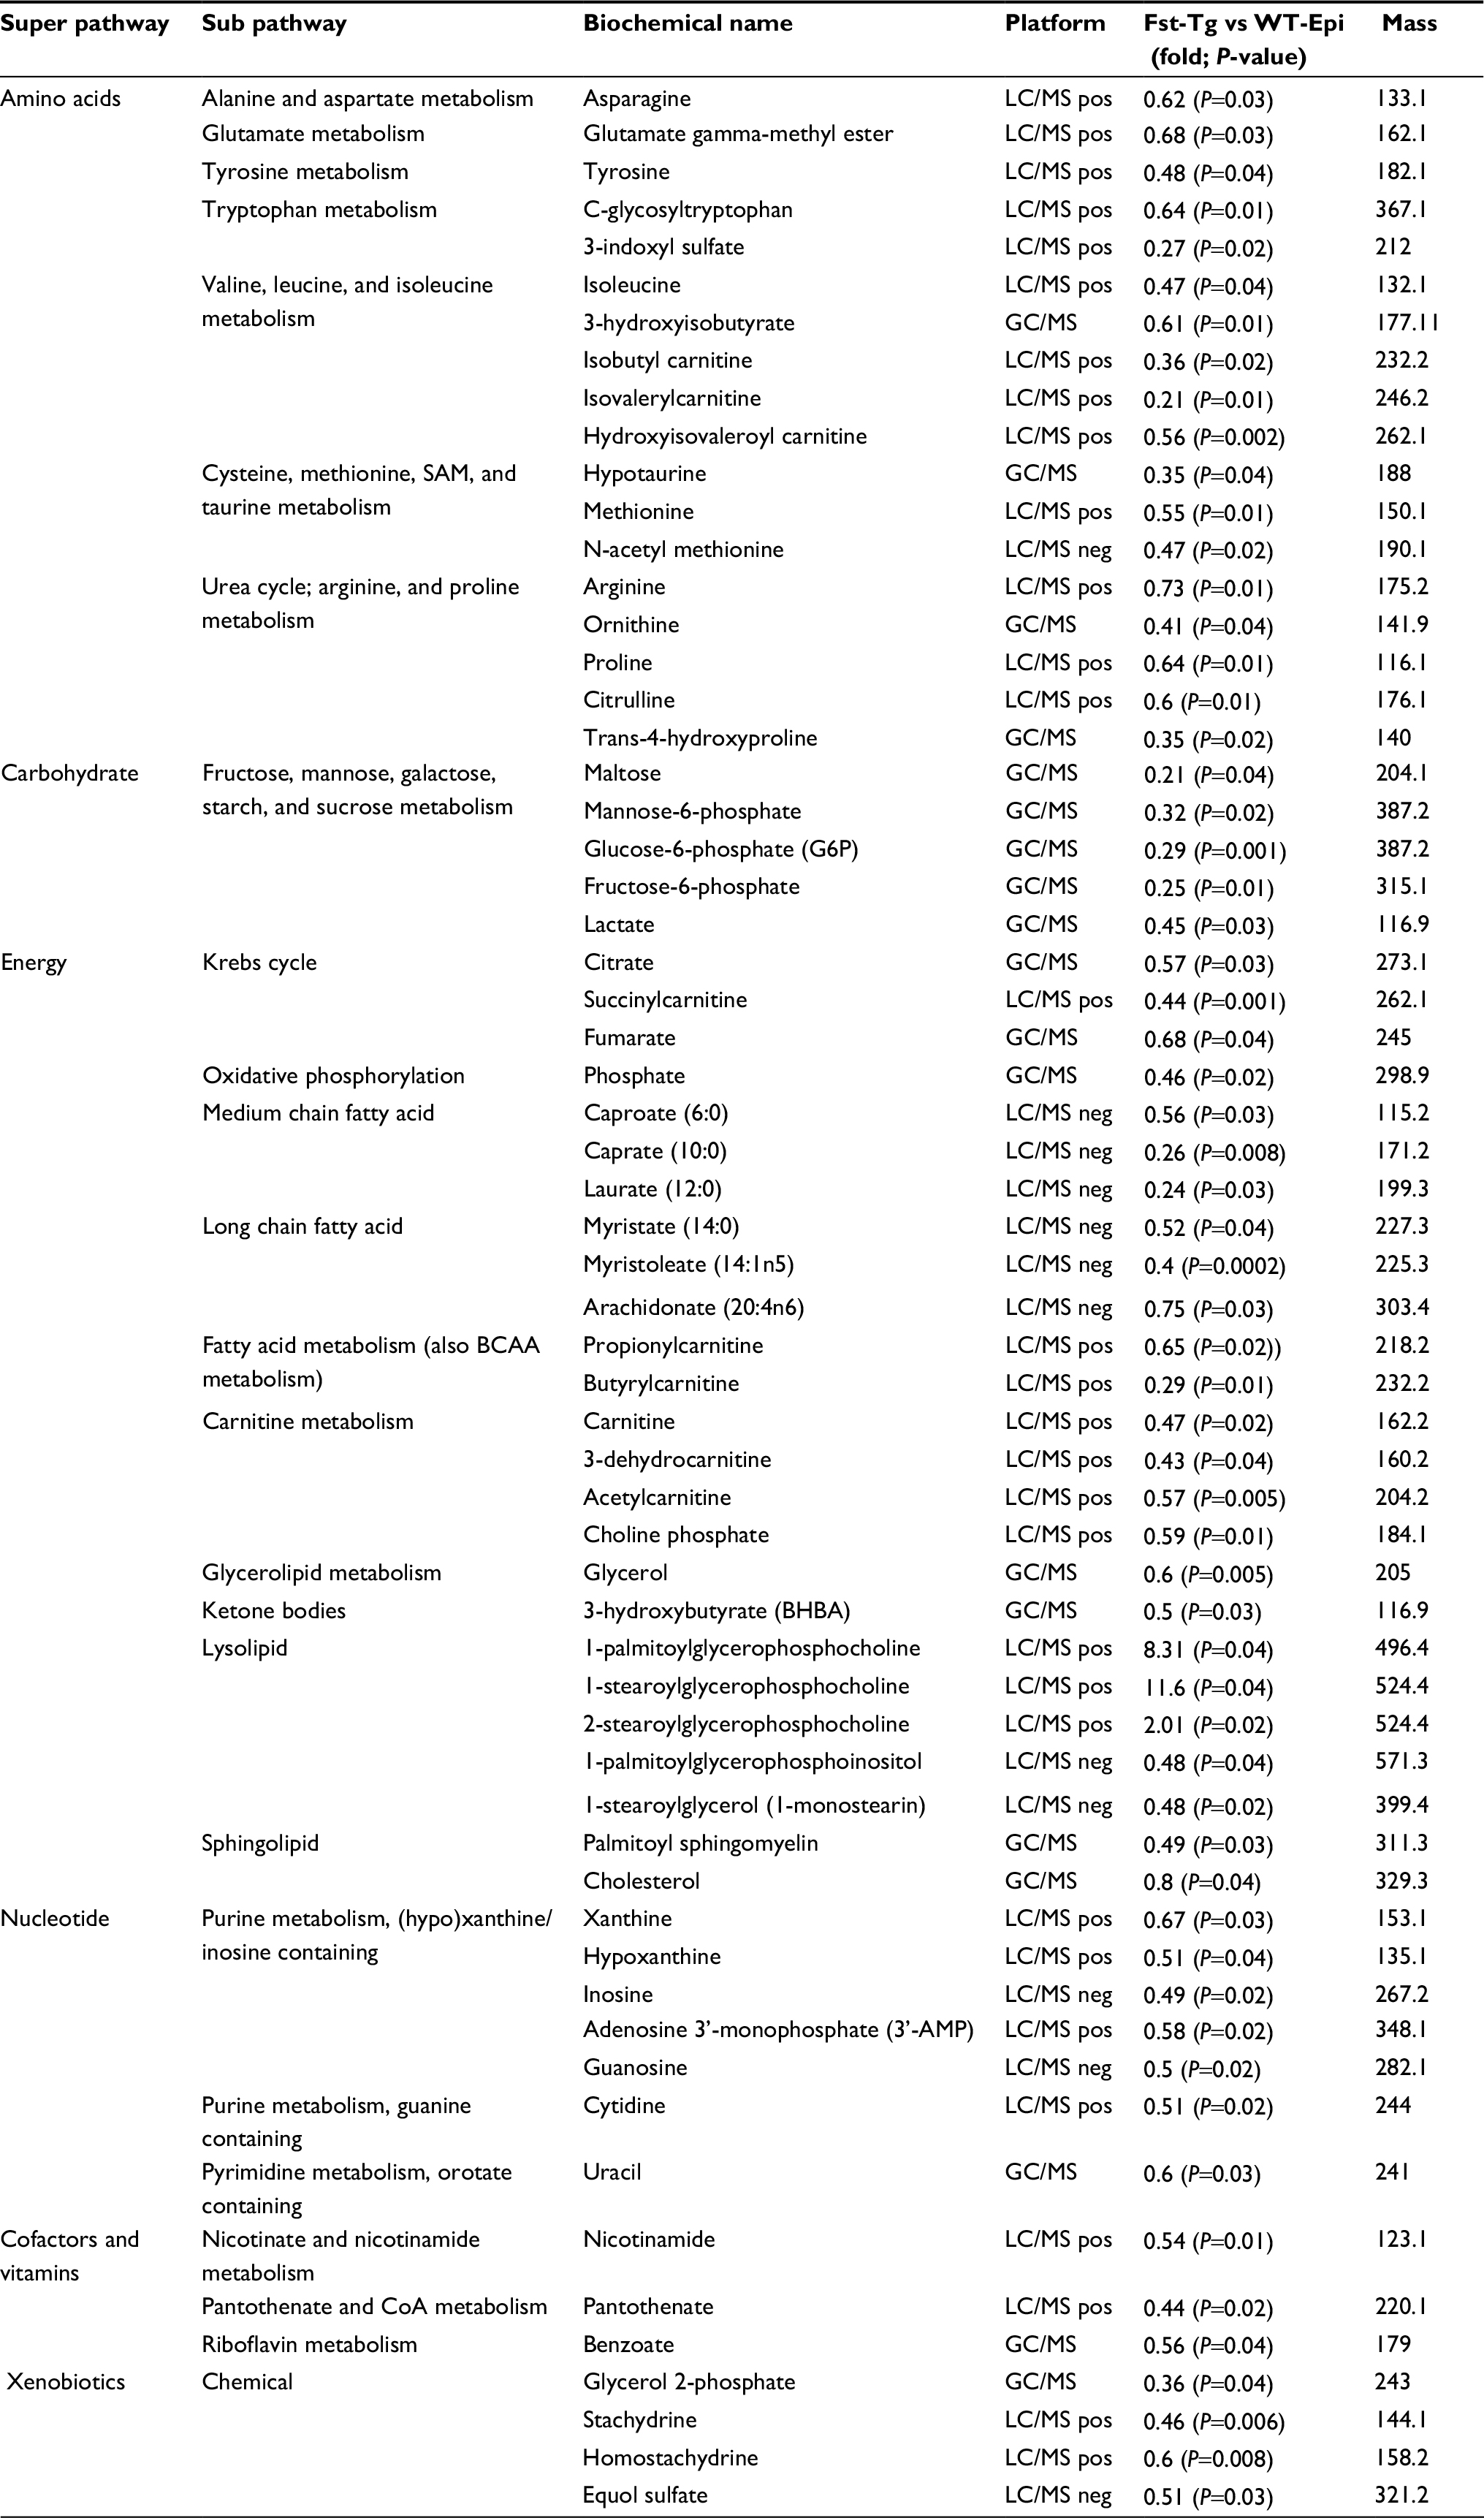 | Table 2 Metabolomics analysis (Metabolon Inc.) of Epi adipose tissues obtained from 6 weeks old WT and Fst-Tg mice showing relative differences in various metabolites involved in the regulation of key metabolic pathways (n=3). Abbreviations: Fst-Tg, follistatin transgenic; WT, wild type; Epi, epididymal; LC/MS, liquid chromatography–mass spectrometry; pos, positive; neg, negative; GC/MS, gas chromatography–mass spectrometry; SAM, S-adenosylmethionine; BCAA, branched chain amino acid; CoA, coenzyme A. |
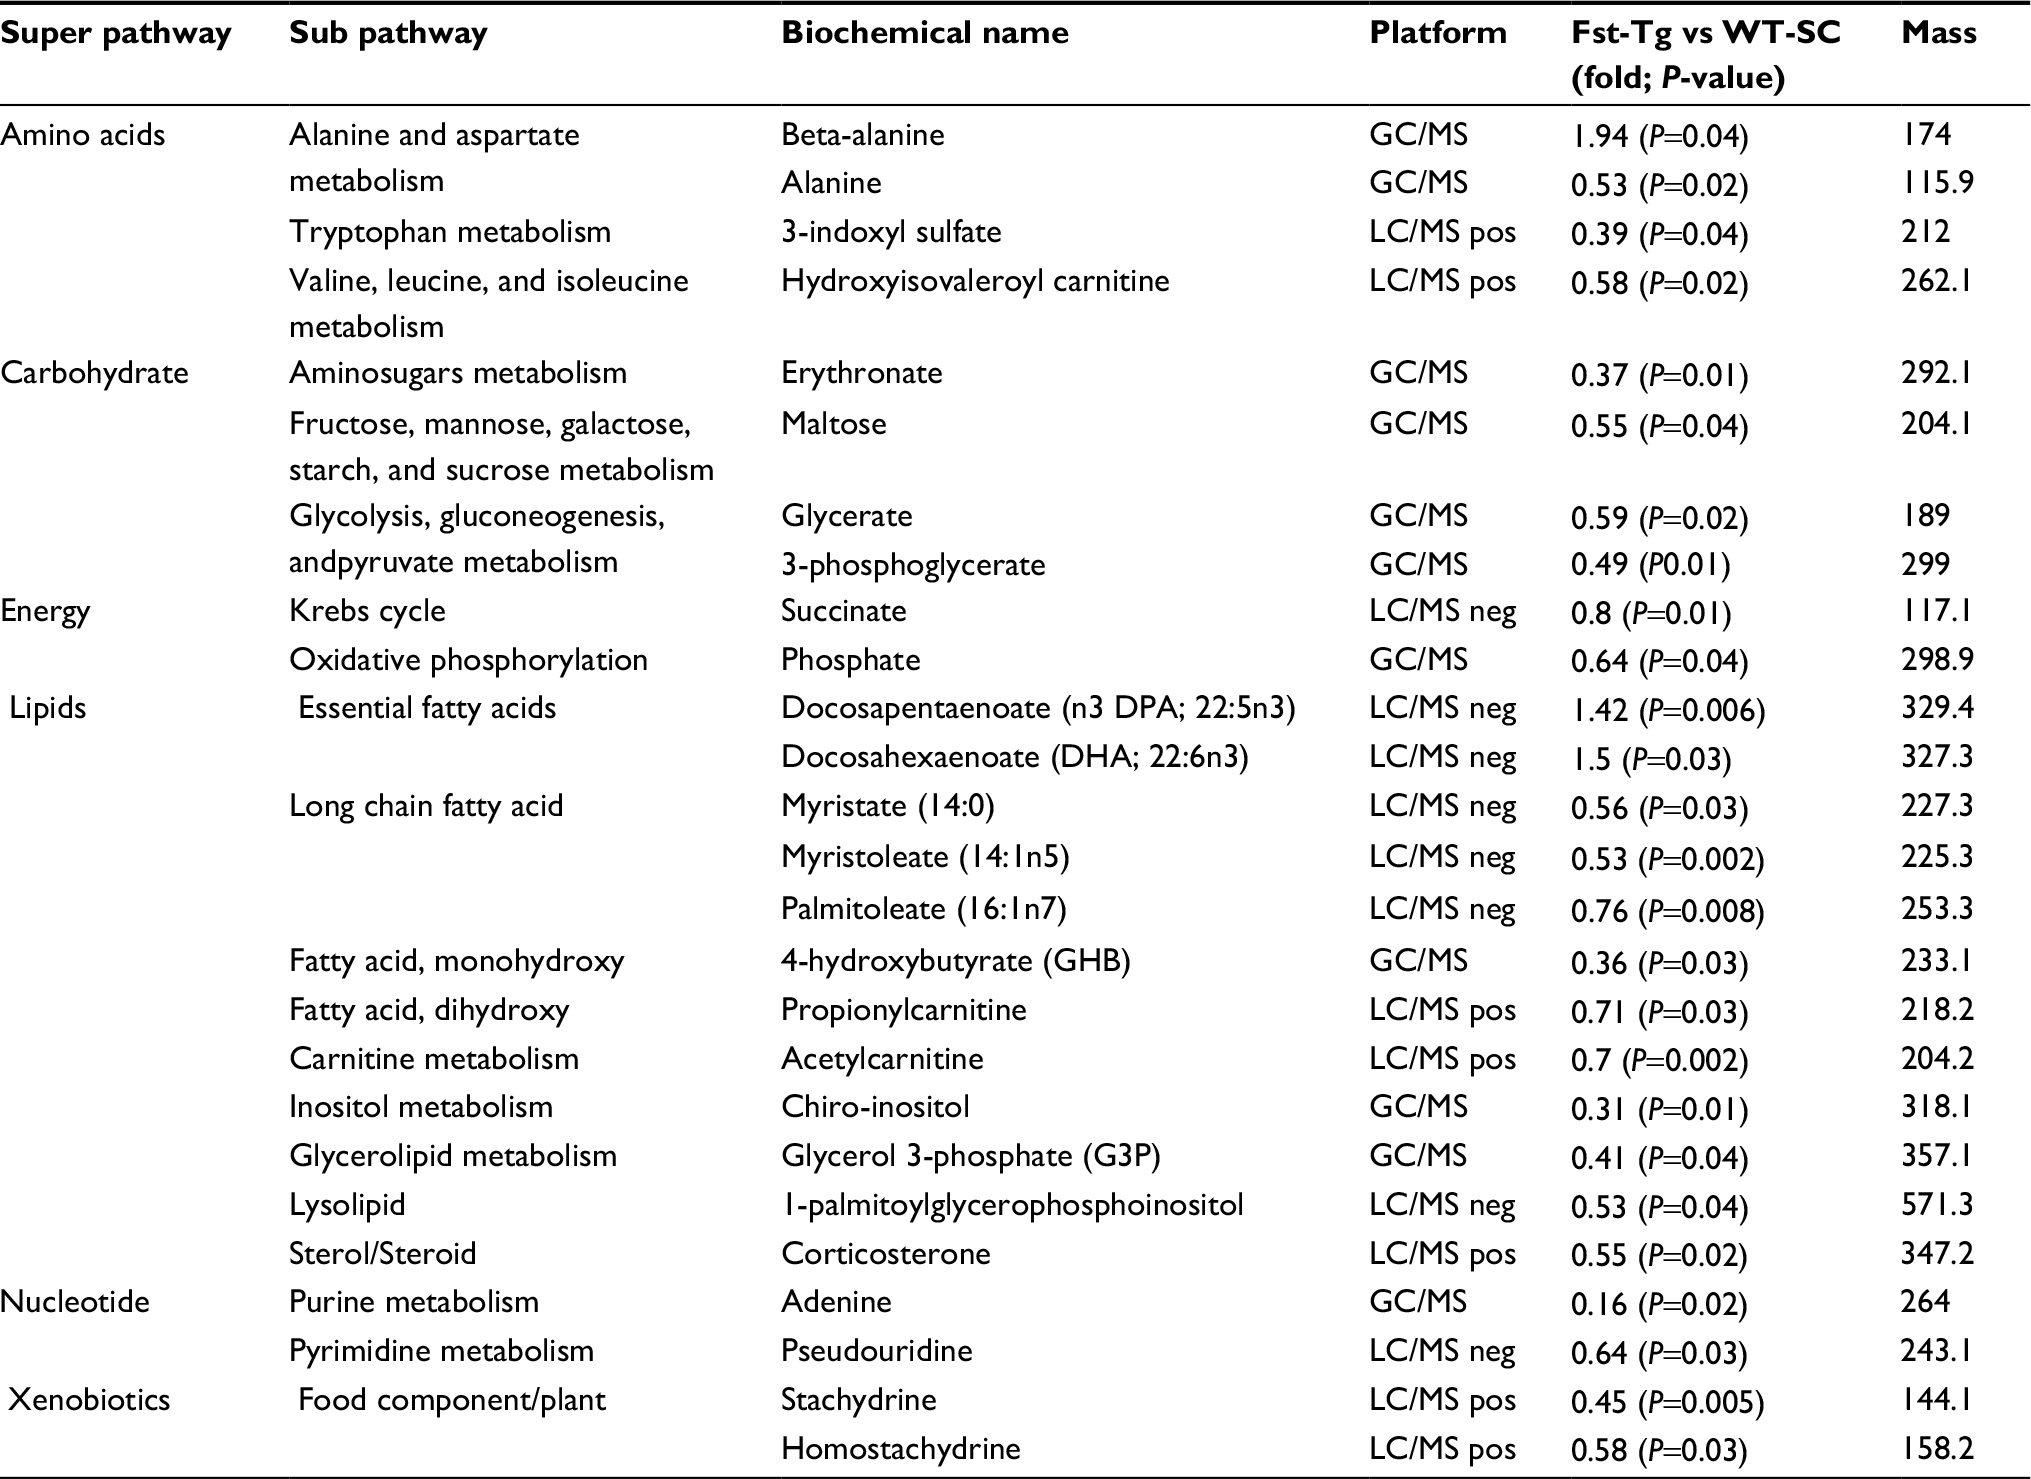 | Table 3 Metabolomics analysis (Metabolon Inc.) of SC adipose tissues obtained from 6-weeks-old WT and Fst-Tg mice showing relative differences in various metabolites involved in the regulation of key metabolic pathways (n=3). Abbreviations: Fst-Tg, follistatin transgenic; WT, wild type; SC, subcutaneous; GC/MS, gas chromatography–mass spectrometry; LC/MS, liquid chromatography–mass spectrometry; pos, positive; neg, negative. |
Energy and lipid metabolism
Comparative analysis of metabolites involved in energy and lipid metabolism in the two adipose tissue depots from WT and Fst-Tg mice display significant differences between the groups. Krebs cycle components including citrate, succinylcarnitine, and fumarate were significantly downregulated in Fst-Tg Epi tissues compared to the WT tissues (Table 2), whereas, only succinate was found to be downregulated in Fst-Tg SC adipose tissues compared to the WT (Table 3). Phosphate levels were significantly decreased in both Fst-Tg Epi and SC tissues. Significant decreases in several long chain FA levels were observed in both adipose tissues obtained from Fst-Tg group; however, the differences in medium chain FA levels were observed only in Epi adipose tissues. Comparative analysis of several components of carnitine metabolism display significant decrease in acetylcarnitine and propionylcarnitine levels in both adipose depots. However, there was also significant decrease in other carnitine metabolites (carnitine, 3-dehydroxycarnitine, butyrylcarnitine), and ketone bodies (3-hydroxybutyrate) selectively in Epi adipose tissue (Table 2). Glycerolipid levels were also significantly lower in Fst-Tg groups. Levels of several lysolipids were also found to be significantly lower in Fst-Tg groups compared to the WT (Tables 2 and 3). Interestingly, cholesterol levels were selectively lower only in Epi adipose tissues.
Amino acids
Several key amino acids involved in alanine and aspartate metabolism (asparagine), glutamate metabolism (glutamate) gamma-methyl ester, tyrosine, tryptophan metabolism, valine, leucine and isoleucine metabolism, cysteine, methionine, taurine metabolism as well as several key components of urea cycle metabolism including arginine, ornithine, proline, citrulline, and trans-4-hydroxyproline were significantly downregulated in Fst-Tg Epi adipose tissues compared to the WT (Table 2). On the other hand, SC adipose tissues displayed a significant but only a less dramatic decrease in certain amino acids including alanine, 3-indoxyl sulfate, and hydroxyisovaleroyl carnitine (Table 3). The levels of beta-alanine however was significantly increased in Fst-Tg SC adipose tissues compared to the WT control group (Table 3). Levels of 3-indoxyl sulfate, a key tryptophan metabolism component known to be upregulated in diabetic patients,25 was also found to be significantly lower in SC adipose depots of Fst-Tg mice (Table 3). However, in both adipose tissue depots, a general trend toward decreased amino acid levels were observed in Fst-Tg group compared to the WT group. Interestingly, several of these metabolites including BCAA (leucine, isoleucine, and valine) are known to be significantly induced in obese subjects compared to the lean humans and contribute to increased risk of type 2 diabetes insulin resistance in humans and in some rodent models.16–18, 32–36
Carbohydrates
In our metabolomics analysis, we observed several carbohydrate metabolites including maltose, mannose 6-phosphate, glucose-6-phosphate, fructose-6-phosphate, lactate as well as 3-phosphoglycerate were significantly lower in Fst-Tg groups compared to the WT (Tables 2 and 3). We also found significantly decreased levels of several purine metabolism components including xanthine/hypoxanthine, inosine, 3′-AMP, cytidine, uracil, guanosine, and adenine in Fst-Tg groups (Tables 2 and 3). Levels of several other metabolites including nicotinamide, pantothenate, and benzoate as well as xenobiotics such as glycerol 2-phosphate and equol sulfate were selectively decreased in Epi adipose tissues obtained from Fst-Tg groups compared to the WT group (Table 2). On the other hand, levels of stachydrine/homostachydrine were found to be significantly decreased in both adipose tissues obtained from Fst-Tg mice (Tables 2 and 3).
Omega-3 PUFAs
Comparative analysis of omega-3 levels PUFAs between the Fst-Tg and WT adipose tissue metabolites display highly significant increase in two key PUFAs including docosapentaenoate (n3; 22:5n3) (1.42 fold; P=0.006), and docosahexaenoate (22:6n3) (1.5 fold; P=0.03) selectively in SC adipose tissues (Table 3). However, these levels were not statistically different in the Epi adipose tissues obtained from WT and Fst-Tg groups. These n-3 long chain PUFAs are reported to improve obesity-associated metabolic orders including chronic inflammation, insulin resistance, and dyslipidemia in several studies by directly regulating several aspects of lipid metabolism, energy expenditure, and inflammation.37–40 Future studies will determine the role of Fst in the regulation of these additional pathways.
Selective induction of BCAA catabolic enzyme expression in Epi adipose tissues obtained from Fst-Tg mice
The specific decrease in BCAA observed in Epi tissues of the Fst-Tg could be explained either by decreased synthesis or by increased catabolism. We therefore, analyzed the expression levels of BCAT2 that catalyzes the first and reversible step in BCAA catabolism as well as components of BCKD complex that irreversibly catalyzes subsequent deamination steps to generate final BCAA metabolites (Figure 3). We found a significant increase in Bcat2 gene (1.8±0.2 fold) and BCAT2 protein (1.45±0.24 fold) expression selectively in Epi adipose tissues of Fst-Tg mice compared to the WT mice (Figure 4A–C). There was no significant change in its gene or protein expression in SC adipose tissues (Figure 4D and E). Further analysis of key genes of BCKDH complex show significant increase in Bckdhb (1.76±0.3 fold), Dbt (1.61±0.21 fold), and Dld (1.58±0.06 fold) gene expression selectively in Epi adipose tissues of Fst-Tg mice compared to WT mice (Figure 4A). Once again, SC adipose tissue display no significant difference in any of the BCKDH complex genes (Figure 4D). Furthermore, protein expression of BCKDHA was also selectively upregulated (1.3±0.16 fold) only in Epi adipose tissues (Figure 4B to C) obtained from Fst-Tg mice compared to the WT mice but not in SC adipose tissues (Figure 4E and F). It is not clear at this point as to why Fst selectively upregulates Epi adipose tissue BCAA catabolism in Fst-Tg mice; however, it is important to mention that Epi adipose tissues are known to play major role in BCAA homeostasis because of their larger capacity to catabolize BCAAs.41 Effect of Fst overexpression on quantitative gene expression profiles of these BCAA catabolizing enzymes in differentiating 3T3-L1 Fst cells were also analyzed. Our data clearly suggest a small but significant increase in Bcat2 (1.45±0.22 fold), Bckdha (1.34±0.08 fold), Backdhb (1.43±0.11 fold), Dbt (1.76±0.08 fold), and Dld (1.53±0.07 fold) (Figure 4G). We also observed that overexpression of Fst in C2C12 cells leads to significant induction of key BCAA catabolic genes (Figure S3). Therefore, our data suggest low but significant upregulation of BCAA catabolizing enzymes both in vitro and in vivo and provide putative mechanism for the decrease in several of these BCAA levels in Epi tissues of Fst-Tg mice (Table 2).
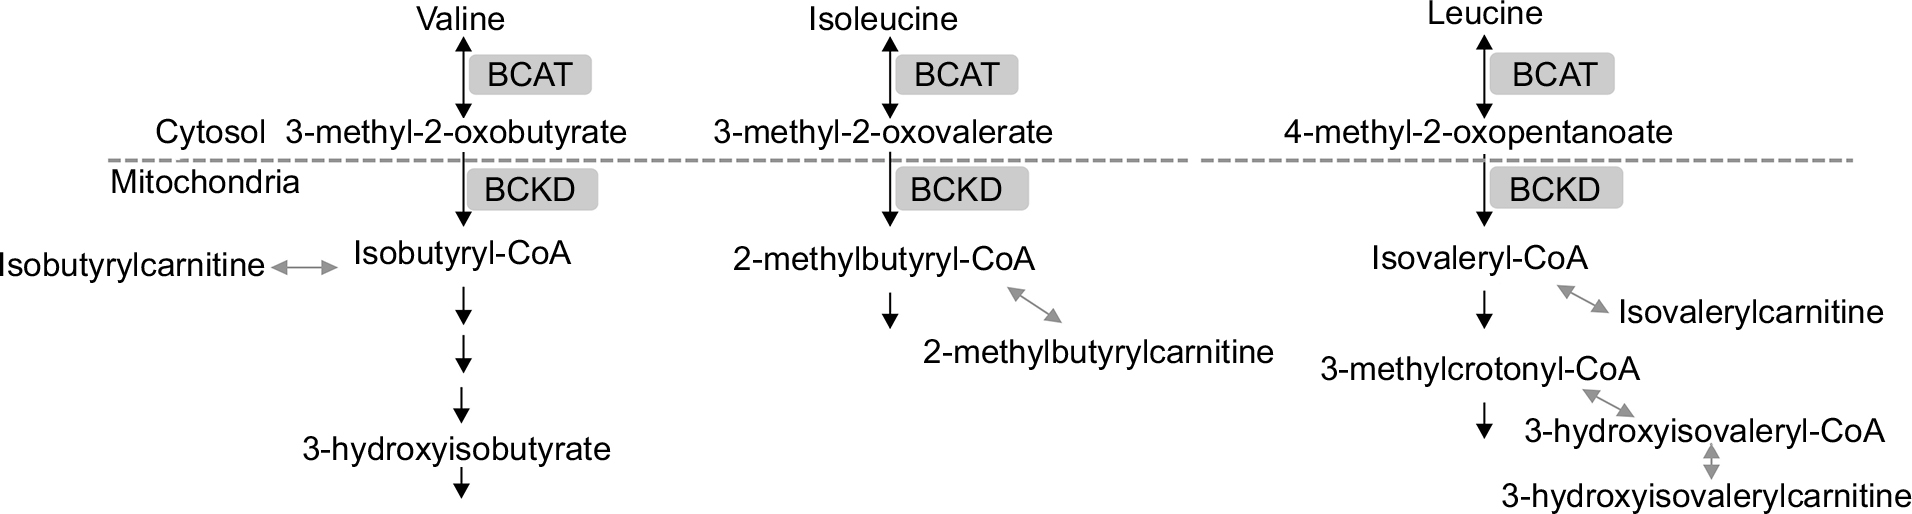 | Figure 3 Schematic presentation of key enzymes and metabolites involved in branched-chain amino acid (valine, isoleucine, leucine) catabolic pathways. Abbreviations: BCAT, branched chain amino transferase; BCKD, branched chain α-keto acid dehydrogenase (complex). |
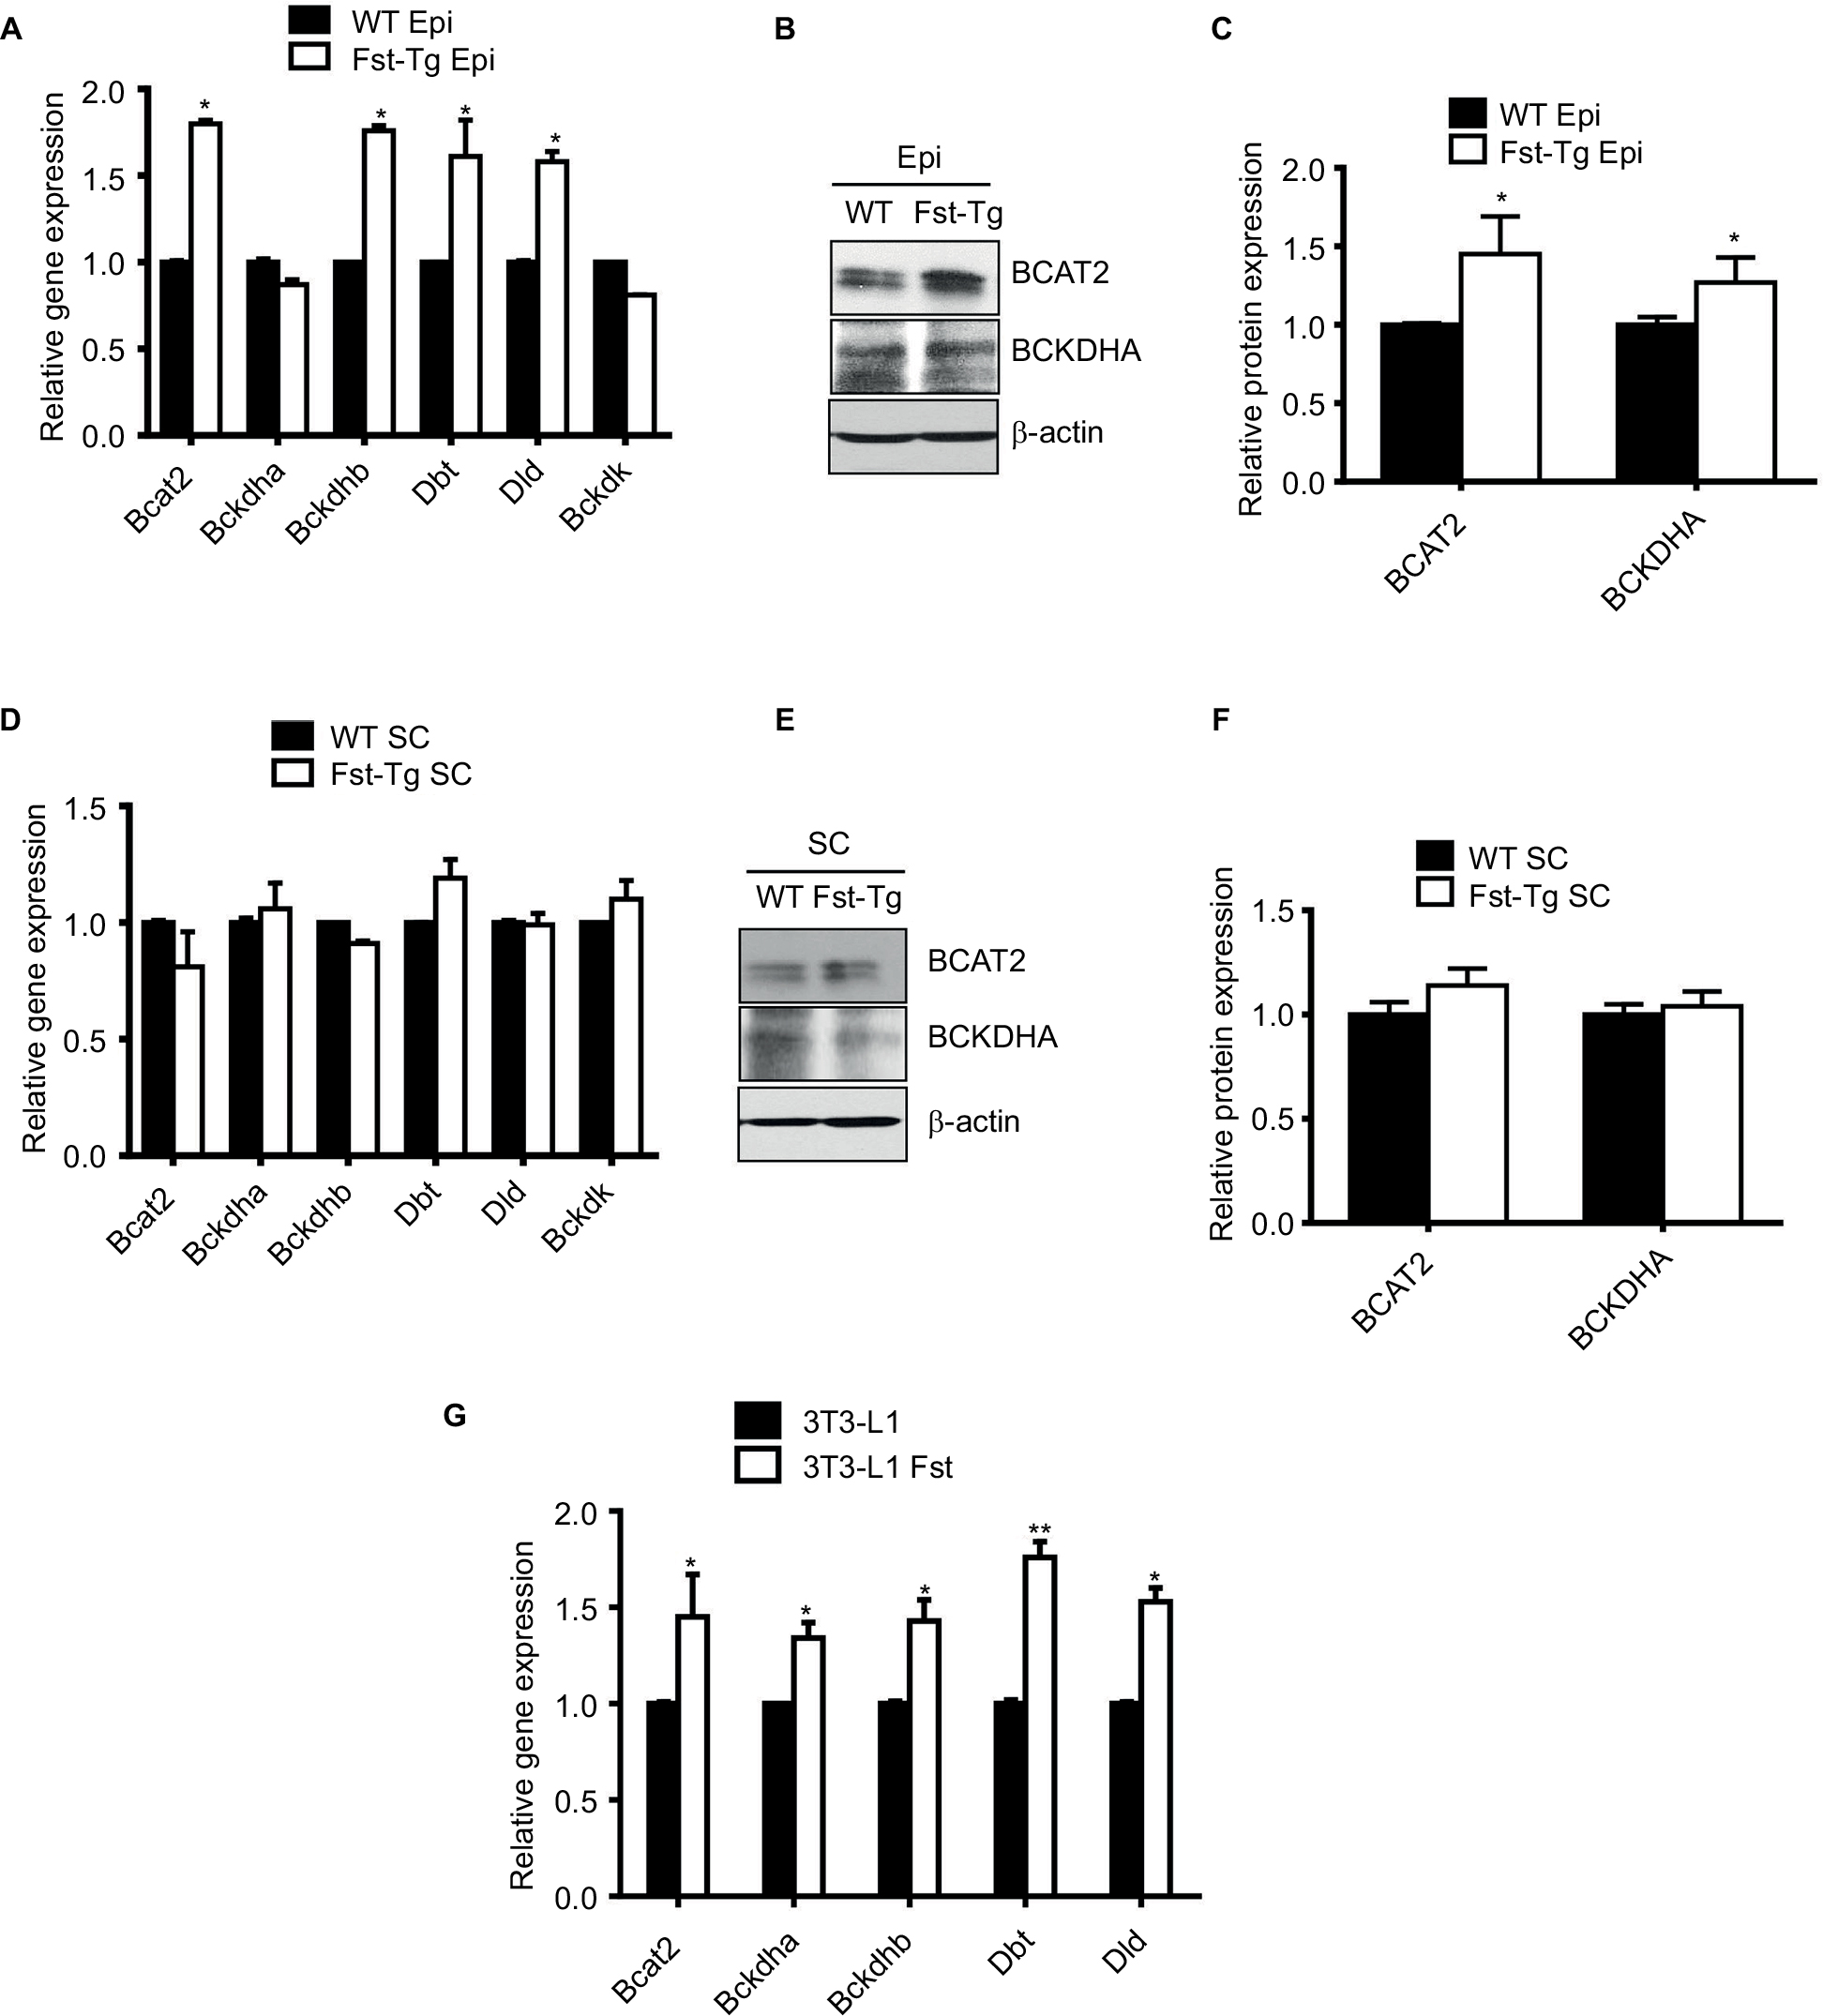 | Figure 4 Analysis of key genes and proteins involved in BCAA catabolic pathways. (A) Quantitative gene expression analysis of mitochondrial Bcat2 and key BCKDH complex enzymes in Epi adipose tissues isolated from male 10-week-old WT and Fst-Tg mice. Western blot analysis using 100 µg total cell lysates (B) and densitometric quantitation (C) of BCAT2 and BCKDHA proteins in Epi adipose tissues isolated from male WT and Fst-Tg mice. (D) Real-time quantitative gene expression analysis of mitochondrial Bcat2 and key BCKDH complex enzymes in SC adipose tissues isolated from male WT and Fst-Tg mice. Western blot analysis (E) and densitometric quantitation (F) of BCAT2 and BCKDHA proteins in SC adipose tissues isolated from male WT and Fst-Tg mice. Data are expressed as mean ± SD. *P≤0.05 (n=3). (G) Real-time quantitative gene expression analysis of mitochondrial Bcat2 and key BCKDH complex enzymes in differentiating 3T3-L1 and 3T3-L1 Fst cells. *P≤0.05, **P≤0.01 (n=3). Abbreviations: WT, wild type; Fst-Tg, follistatin transgenic; Epi, epididymal; BCAT, branched chain aminotransferase; BCKDHA, branched chain ketoacid dehydrogenase; BCAA, branched chain amino acid; SC, subcutaneous. |
Upregulation of FGF21/ AdipoQ/ AMPK signaling pathway in both Epi and SC adipose tissues compared to the WT mice
FGF21/AdipoQ/AMPK pathway is known to regulate key metabolic functions including energy homeostasis, glucose and lipid metabolism, and insulin sensitivity and has been implicated in metabolic diseases including diabetes, obesity, and hypertension.42–47 Previously, we had identified AdipoQ, Pgc1α, and FGF21 binding partner Klb as differentially expressed genes in differentiating Fst-KO MEF cultures compared to the WT group, suggesting that AdipoQ/ FGF21 axis may be a primary target of Fst action during its regulation of adipose tissue metabolic function.7 Since AdipoQ has been reported to be a downstream effector of FGF21,42 a well-known adipose browning and important regulator of key metabolic functions,43–46 we explored the potential role of FGF21/AdipoQ/pAMPK signaling pathway in eliciting Fst metabolic actions in both Epi and SC adipose tissues from WT and Fst-Tg mice. We observed significant increase in AdipoQ, FGF21, and PGC-1α, proteins as well pAMPK/AMPK ratio in both Epi and SC adipose tissues obtained from Fst-Tg mice compared to the WT control mice (Figure 5A). This effect of Fst-induced upregulation of FGF21/AdipoQ/pAMPK signaling pathway was also confirmed in our in vitro studies using differentiated 3T3-L1 cells treated either with recombinant Fst protein (0.5 µg/ml) or treatment of cell supernatant (500 µl in confluent 3T3-L1 cells on T25 flask) from 9-day differentiated 3T3-L1 Fst cells (Figure 5B). We have also observed basal expression of AdipoR1 (AdipoQ key adipose receptor) and SirT1 in differentiated 3T3-L1 cells, which were induced following treatment of these cells either with recombinant Fst protein or cell supernatant from 3T3-L1 Fst cells (Figure 5B). We next analyzed gene expression profile of key FGF21 target genes (Egr1, c-Fos), receptors (Fgfr1, Fgfr2, and Fgfr3), and its catalytic partner Klb along with Pgc1α in both Epi and SC adipose tissues from WT and Fst-Tg mice (Figure 5C and D).
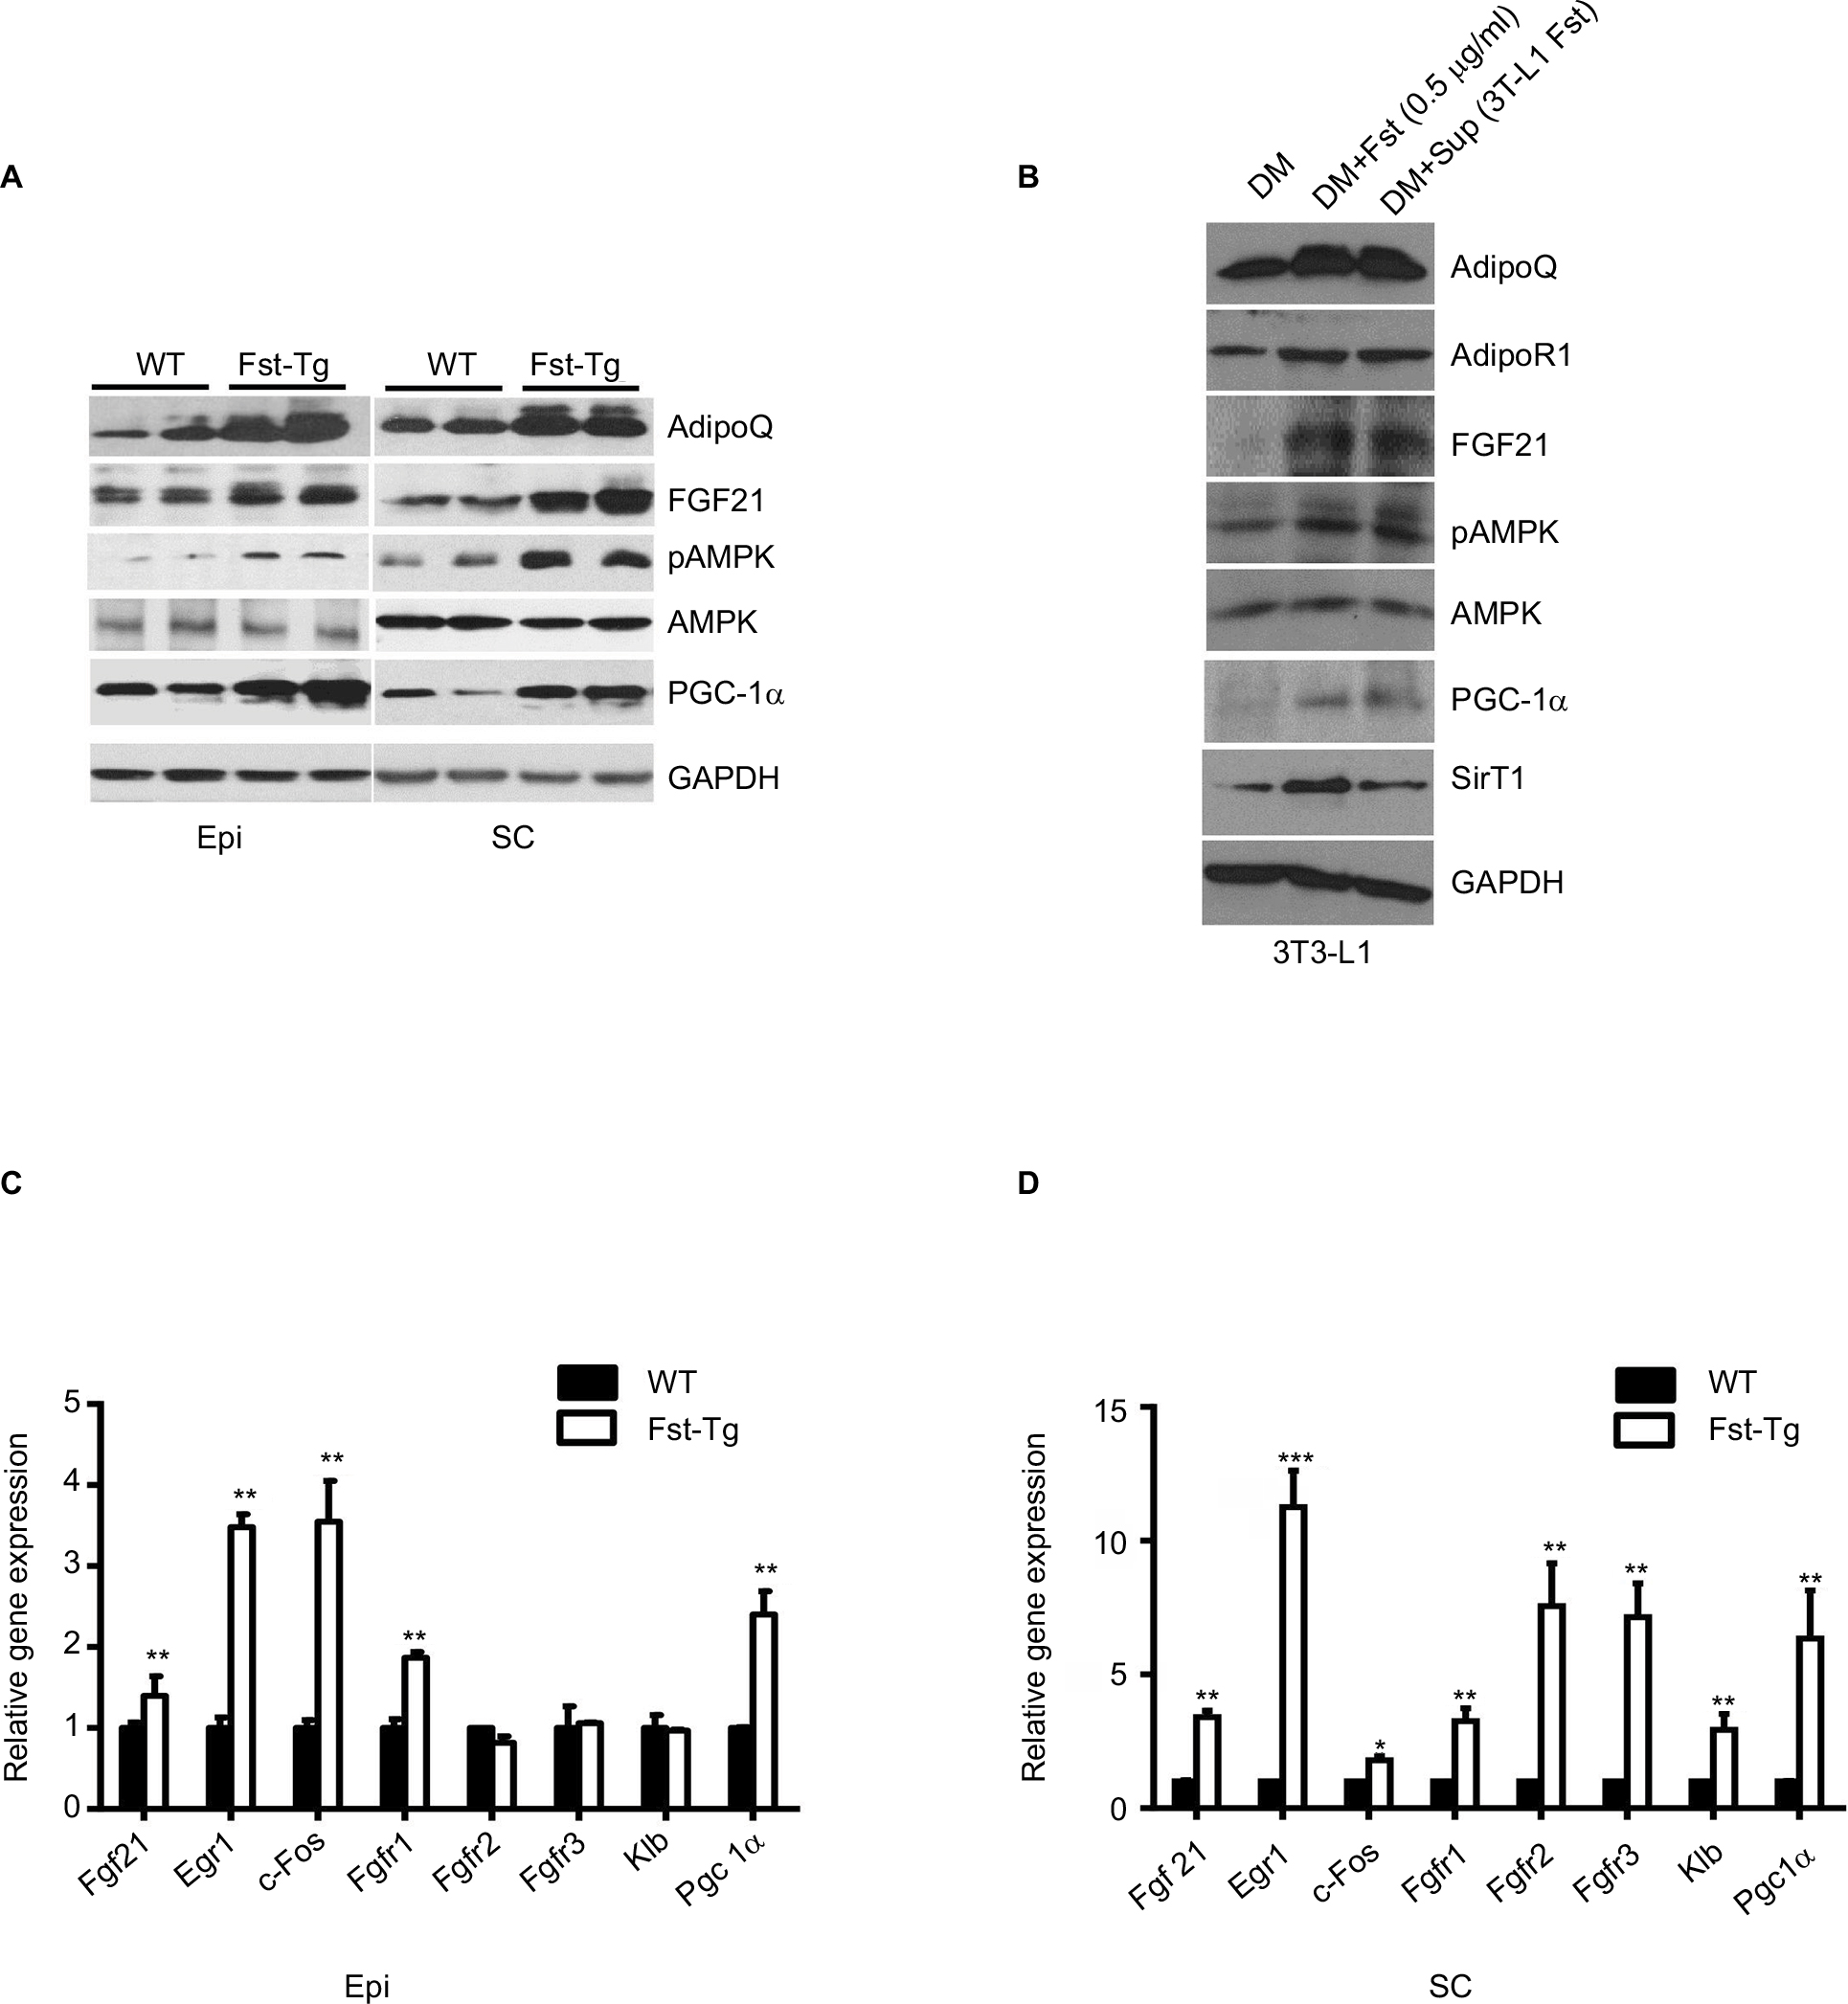 | Figure 5 Effect of Fst overexpression on AdipoQ/FGF21/pAMPK pathway and FGF21 target genes. Western blot analysis of key proteins in Epi and SC adipose tissues from WT and Fst-Tg mice (A), and recombinant Fst protein (0.5 µg/ml) or Fst-enriched supernatant treatment of differentiated 3T3-L1 cells (B) using 100 µg of total tissue or cell lysates. Real-time quantitative gene expression analysis of FGF21, its receptors (Fgfr1-r3) and target genes in Epi (C), and SC (D) adipose tissues obtained from 10-week old WT and Fst-Tg mice. Data are expressed as mean ± SD. *P≤0.05, **P≤0.01, and ***P≤0.001 (n=3). Abbreviations: WT, wild type; Fst-Tg, follistatin transgenic; DM, differentiation medium; AdipoQ, adiponectin; FGF, fibroblast growth factor; AMPK, AMP-activated protein kinase; PGC, peroxisome proliferator-activated receptor-gamma coactivator; SirT1, sirtuin1; GADPH, glyceraldehyde 3-phosphate dehydrogenase; Epi, epididymal; SC, subcutaneous. |
We found significant increase in Fgf21 (Epi: 1.4±0.24 fold, P≤0.05; SC: 3.4±0.24 fold), Egr1 (Epi: 3.48±0.16 fold; SC: 11.25±1.37 fold), c-Fos (Epi: 3.55±0.5 fold; SC: 1.8±0.14 fold), Fgfr1 (Epi: 1.87±0.07 fold; SC: 3.25±0.49 fold), Fgfr2 (SC: 7.56±1.6 fold), Fgfr3 (SC: 7.14±1.27 fold), Klb (SC: 2.93±0.6 fold) and Pgc1a (Epi: 2.4±0.29 fold; SC: 6.35±1.8 fold), gene expression in Fst-Tg compared to the WT adipose tissues (Figure 5C and D). These differences in FGF21-associated genes and protein were also evident in other metabolic tissues including interscapular BAT and liver (Figure S4A–C). Our data, therefore suggest a role for FGF21/AdipoQ/pAMPK signaling pathway in regulating key metabolic targets of Fst in both Epi and SC adipose tissues.
Discussion
We have recently identified Fst as a novel inducer of brown adipose characteristics and a regulator of key lipid and energy metabolism.7 Fst promotes browning of Epi and SC adipose tissues in Fst-Tg mice by targeting p38MAPK/ERK1/2 signaling pathways.8 Agents promoting adipose browning have recently been reported to provide significant therapeutic advantage for the treatment of obesity and related metabolic diseases because of their unique energy burning capacity.10,11,14 Fst-Tg mice have previously been reported to have significantly increased body weight and muscle mass because of muscle-specific overexpression of Fst, a well-known inducer of muscle mass.3 Our previous studies using these Fst-Tg male mice suggested that irrespective of the site of Fst production increased systemic Fst levels could significantly impact the metabolic outcomes of distant tissues, including both Epi and SC adipose tissues via increased adipose browning.8
In the present study, using Fst-Tg mice and 3T3-L1 Fst cells, we have applied a comprehensive set of lipidomics and biochemical analysis tools to gain a deeper understanding of key metabolic targets of Fst both in vivo and in cultured adipocytes. Our data demonstrate that despite having significantly increased body weight, the abdominal fat volume of Fst-Tg mice was significantly lower compared to the age-matched control WT mice, suggesting a role for Fst in regulating both muscle and fat mass. A strong relationship between glucose and lipid metabolism has been demonstrated in several studies.48–50 Increased lipolysis followed by increase in circulating FFAs in fasted state results in augmented FA oxidation to provide energy. Under these conditions, glucose oxidation is reduced partly because of the generation of FA oxidation byproducts. In addition, consequent accumulation of bioactive lipid species during obese states is known to interfere with insulin signaling.51 Since key metabolic characteristics including improved glucose clearance rate and serum lipid profiles observed in Fst-Tg mice could be confounded by reciprocal changes in muscle and fat content in these mice, we assessed the effect of Fst on key metabolites in adipose tissues and in differentiated 3T3-L1 Fst cells to dissect out its precise role in modulating key metabolic mediators.
Lipidomic profiling has been used effectively to analyze global lipid alterations during obesity and other metabolic diseases as well as in several animal studies.52–54 Our lipidomics data show significant decrease in several lipid metabolites including several TG, FA, PC, and PE of varying chain lengths in 3T3-L1 Fst cells compared to the 3T3-L1 cells. Levels of several LPCs which are reported to be decreased in obese patients30,31 were found to be significantly higher in Fst overexpressing cells. Several studies using liver and serum samples from obesity-resistant and obesity-prone mice on high fat diet and in obese subjects have shown similar changes in many of these lipid metabolites.52,55
In one or both adipose tissues from Fst-Tg mice, our data demonstrates that several amino acids including BCAA are less abundant. Many BCAA catabolites en route to TCA cycle including alanine, and several C3 and C5 acylcarnitines including isobutyl carnitine (valine catabolism intermediate), isovalerylcarnitine (leucine catabolism intermediate), and propionylcarnitine (isoleucine and valine catabolism intermediate) were also less abundant in Fst-Tg in one or both adipose tissues. Furthermore, expression levels of two key BCAA catabolic proteins BCAT2 and BCKDHA were significantly higher specifically in Fst overexpressing Epi adipose tissues, suggesting a predominant role for BCAA catabolic pathway in adipose tissues metabolism in Fst-Tg mice. Significantly, increased levels of tyrosine has been reported in several studies including obese subjects.17,56 The association between BCAA and amino acid with insulin resistance and type 2 diabetes have been noted in multiple studies over the years.33,34 Data obtained from our current findings therefore, strongly suggest that Fst could significantly inhibit local production of BCAA associated metabolites in adipose tissues and elicit metabolic advantage. A recent metabolic profiling identified significant association between visceral fat lactate levels and markers of type 2 diabetes, and insulin resistance, suggesting a metabolic link between perturbed lactate levels in visceral fat and cardiometabolic diseases.57 Increased mitochondrial activity and FA oxidation in Fst-Tg mice could reduce glycolysis leading to reduced lactate levels. Our metabolomics data in Epi adipose tissues from Fst-Tg mice demonstrate significant lower lactate levels compared to the WT along with several other carbohydrate metabolites, further suggest that Fst may favorably modulate overall carbohydrate metabolism and provide protection against these diseases. A detailed analysis of these sugar metabolites and their possible role needs to be investigated in future to assess the potential therapeutic use of Fst specifically in the context of diabetic atherosclerosis and hyperglycemia. Several studies including global metabolomic profiling of childhood obesity58 and high-fat-diet induced metabolic changes59 have identified lysolipids as important metabolic regulators. Our data identified significantly higher levels of three major lysolipids that are reported to be significantly lower in obese child in Fst overexpressing Epi adipose tissues.58 However, the levels of 1-palmitoylglycerophosphoinositol was found to be lower in both adipose tissue depots from Fst-Tg mice as compared to the WT group. Epi adipose tissues from Fst-Tg mice display significantly lower levels of betahydroxybutyric acid, an end-product of FA β-oxidation which is often associated with metabolic syndrome. In general, our metabolomics data show a clear pattern of favorable changes in key metabolites that have been implicated in several metabolic conditions and warrants future studies to explore in detail the therapeutic benefits of Fst.
In our previous studies, we had identified Fst as a novel inducer of adipose browning characteristics both in in vitro cultures of differentiating cells under adipogenic conditions and in adipose tissues from Fst-Tg mice. To explore the possible connection between Fst-induced adipose browning and observed metabolic alterations in adipose tissues in Fst-Tg mice, we assessed the possible role of FGF21/AdipoQ/pAMPK axis, which is known to regulate key metabolic functions including energy homeostasis, glucose and lipid metabolism and insulin sensitivity.42–47 While adipose-derived FGF21 can act in an autocrine/paracrine manner to increase thermogenic genes and adipose browning, it is also known to improve lipid profiles and influence glucose homeostasis as well as insulin sensitivity. FGF21 is reported to rapidly and robustly stimulate AdipoQ secretion.44 AdipoQ is a key target of Fst in differentiating MEF7 and reported to mediate the systemic effects of FGF21 in regulating energy metabolism and exerting its glycemic and insulin sensitizing effects.42 Furthermore, AdipoQ has also been shown to correct altered BCAA metabolism caused by high-fat diet in AdipoQ KO mice.59 Our data in both adipose tissues and 3T3-L1 cells treated either with recombinant Fst protein or cell supernatant highly enriched in secreted Fst from Fst overexpressing 3T3-L1 Fst cells display robust activation of FGF21/AdipoQ/pAMPK signaling pathway. Fst overexpression was associated with significant upregulation of FGF21 receptors, and its downstream targets in both adipose tissue depots compared to the WT group. Levels of AMPK phosphorylation was also significantly higher in both adipose tissues and in Fst treated 3T3-L1 cells. While AMPK activation has been known to inhibit acetyl CoA carboxylase, a key player in FA synthesis;60 decreased AMPK levels in adipocytes are known to promote insulin resistance and hepatic steatosis through brown and beige adipose tissue function.61 Our findings using these Fst-Tg mice thus clearly supports a cross-talk between muscle and adipose tissues resulting in modulation of key browning and associated metabolic characteristics. Recent studies have identified several myokines including myostatin, FGF21, IL-4, IL-6, IL-7, irisin, and sarcolipin among several others in regulating key metabolic characteristics in adipose tissues.62–65 Our findings, therefore, suggest for the first time that Fst released from skeletal muscle could directly target FGF21/AdipoQ/pAMPK signaling pathway and influence the levels of adipose tissue metabolites involved in regulating key metabolic processes implicated in obesity, type 2 diabetes, and insulin resistance.
Abbreviations
AdipoQ, adiponectin
AMP, adenosine monophosphate
AMPK, AMP-activated protein kinase
ANOVA, analysis of variance
BAT, brown adipose tissues
BCAA, branched chain amino acid
BCAT, branched chain aminotransferase
BCKDHA, branched chain ketoacid dehydrogenase
COX, cyclooxygenase
Epi, epididymal
ERK, extracellular-signal-regulated kinase
FA, fatty acid
FFA, free fatty acid
FGF, fibroblast growth factor
Fst, follistatin
Fst-KO, Fst knockout
Fst-Tg, Fst transgenic
LPC, lysophosphatidylcholine
IL, interleukin
IP, intraperitoneal
Klb, beta-klotho
MAPK, mitogen-activated protein kinase
MEF, mouse embryonic fibroblast
Mst, myostatin
Mup, major urinary protein
OCRS, oxygen consumption rates
PC, phosphotidylcholine
PE, phosphotidylethanolamine
PUFA, polyunsaturated fatty acid
SC, subcutaneous
SirT, sirtuin
TC, total cholesterol
TG, triglyceride
UCP, uncoupling protein
WAT, white adipose tissues
WT, wild type
Acknowledgments
The authors would like to acknowledge Metabolon Inc. (Morrisville, NC, USA) (www.metabolon.com) and UC Davis Metabolomics Core Services (http://metabolomics.ucdavis.edu/core-services/metabolomics-central-service-core) for adipose tissue metabolomics profiling and cell lysate lipidomics profiling, respectively. They would also like to thank the expert technical assistance from Melissa Braga and Dr Meher Parveen. This work was supported by National Institute of Health Grants SC1AG049682 (RS) and SC1CA1658650 (SP), and in part by RO1HL071776 (STR), R01AR060636 (SJL), and S21MD000103 (RS, SP) grants. CT scanning was done at UCLA Molecular Imaging services core.
Disclosure
The authors report no conflicts of interest in this work.
References
Singh R, Braga M, Pervin S. Regulation of brown adipocyte metabolism by myostatin/follistatin signaling. Front Cell Dev Biol. 2014;2:60. | ||
Sidis Y, Mukherjee A, Keutmann H, Delbaere A, Sadatsuki M, Schneyer A. Biological activity of follistatin isoforms and follistatin-like-3 is dependent on differential cell surface binding and specificity for activin, myostatin, and bone morphogenetic proteins. Endocrinol. 2006;147(7):3586–3597. | ||
Lee SJ, Lee YS, Zimmers TA, et al. Regulation of muscle mass by follistatin and activins. Mol Endocrinol. 2010;24(10):1998–2008. | ||
Matzuk MM, Lu N, Vogel H, Sellheyer K, Roop DR, Bradley A. Multiple defects and perinatal death in mice deficient in follistatin. Nature. 1995;374(6520):360–363. | ||
Jasuja R, Costello JC, Singh R, et al. Combined administration of testosterone plus an ornithine decarboxylase inhibitor as a selective prostate-sparing anabolic therapy. Aging Cell. 2014;13(2):303–310. | ||
Braga M, Bhasin S, Jasuja R, Pervin S, Singh R. Testosterone inhibits transforming growth factor-β signaling during myogenic differentiation and proliferation of mouse satellite cells: potential role of follistatin in mediating testosterone action. Mol Cell Endocrinol. 2012;350(1):39–52. | ||
Braga M, Reddy ST, Vergnes L, et al. Follistatin promotes adipocyte differentiation, browning, and energy metabolism. J Lipid Res. 2014;55(3):375–384. | ||
Singh R, Braga M, Reddy ST, et al. Follistatin targets distinct pathways to promote brown adipocyte characteristics in brown and white adipose tissues. Endocrinology. 2017;158(5):1217–1230. | ||
Hill BG. Insights into an adipocyte whitening program. Adipocyte. 2015;4(1):75–80. | ||
Cummins TD, Holden CR, Sansbury BE, et al. Metabolic remodeling of white adipose tissue in obesity. Am J Physiol Endocrinol Metab. 2014;307(3):E262–E277. | ||
Roberts LD, Boström P, O’Sullivan JF, et al. β-Aminoisobutyric acid induces browning of white fat and hepatic β-oxidation and is inversely correlated with cardiometabolic risk factors. Cell Metab. 2014;19(1):96–108. | ||
Gesta S, Tseng YH, Kahn CR. Developmental origin of fat: tracking obesity to its source. Cell. 2007;131(2):242–256. Erratum in: Cell. 2008;135(2):366. | ||
Peirce V, Carobbio S, Vidal-Puig A. The different shades of fat. Nature. 2014;510(7503):76–83. | ||
Abdullahi A, Jeschke MG. Taming the flames: targeting white adipose tissue browning in hypermetabolic conditions. Endocr Rev. 2017;38(6):538–549. | ||
Fabbiano S, Suárez-Zamorano N, Rigo D, et al. Caloric restriction leads to browning of white adipose tissue through type 2 immune signaling. Cell Metab. 2016;24(3):434–446. | ||
Wang TJ, Larson MG, Vasan RS, et al. Metabolite profiles and the risk of developing diabetes. Nat Med. 2011;17(4):448–453. | ||
Newgard CB, An J, Bain JR, et al. A branched-chain amino acid-related metabolic signature that differentiates obese and lean humans and contributes to insulin resistance. Cell Metab. 2009;9(4):311–326. | ||
Würtz P, Mäkinen VP, Soininen P, et al. Metabolic signatures of insulin resistance in 7,098 young adults. Diabetes. 2012;61(6):1372–1380. | ||
Suckow CE, Stout DB. MicroCT liver contrast agent enhancement over time, dose, and mouse strain. Mol Imaging Biol. 2008;10(2):114–120. | ||
Wang H, Stout DB, Chatziioannou AF. A deformable atlas of the laboratory mouse. Mol Imaging Biol. 2015;17(1):18–28. | ||
Mehrabian M, Qiao JH, Hyman R, Ruddle D, Laughton C, Lusis AJ. Influence of the apoA-II gene locus on HDL levels and fatty streak development in mice. Arterioscler Thromb. 1993;13(1):1–10. | ||
Singh R, Artaza JN, Taylor WE, et al. Testosterone inhibits adipogenic differentiation in 3T3-L1 cells: nuclear translocation of androgen receptor complex with beta-catenin and T-cell factor 4 may bypass canonical Wnt signaling to down-regulate adipogenic transcription factors. Endocrinology. 2006;147(1):141–154. | ||
Braga M, Pervin S, Norris K, Bhasin S, Singh R. Inhibition of in vitro and in vivo brown fat differentiation program by myostatin. Obesity (Silver Spring). 2013;21(6):1180–1188. | ||
Matyash V, Liebisch G, Kurzchalia TV, Shevchenko A, Schwudke D. Lipid extraction by methyl-tert-butyl ether for high-throughput lipidomics. J Lipid Res. 2008;49(5):1137–1146. | ||
Suhre K, Meisinger C, Döring A, et al. Metabolic footprint of diabetes: a multiplatform metabolomics study in an epidemiological setting. PLoS One. 2010;5(11):e13953. | ||
Zhou Y, Jiang L, Rui L. Identification of MUP1 as a regulator for glucose and lipid metabolism in mice. J Biol Chem. 2009;284(17):11152–11159. | ||
Hui X, Zhu W, Wang Y, et al. Major urinary protein-1 increases energy expenditure and improves glucose intolerance through enhancing mitochondrial function in skeletal muscle of diabetic mice. J Biol Chem. 2009;284(21):14050–14057. | ||
Xia JY, Holland WL, Kusminski CM, et al. Targeted induction of ceramide degradation leads to improved systemic metabolism and reduced hepatic steatosis. Cell Metab. 2015;22(2):266–278. | ||
Chimin P, Andrade ML, Belchior T, et al. Adipocyte mTORC1 deficiency promotes adipose tissue inflammation and NLRP3 inflammasome activation via oxidative stress and de novo ceramide synthesis. J Lipid Res. 2017;58(9):1797–1807. | ||
Barber MN, Risis S, Yang C, et al. Plasma lysophosphatidylcholine levels are reduced in obesity and type 2 diabetes. PLoS One. 2012;7(7):e41456. | ||
Kim JY, Park JY, Kim OY, et al. Metabolic profiling of plasma in overweight/obese and lean men using ultra performance liquid chromatography and Q-TOF mass spectrometry (UPLC-Q-TOF MS). J Proteome Res. 2010;9(9):4368–4375. | ||
She P, Van Horn C, Reid T, Hutson SM, Cooney RN, Lynch CJ. Obesity-related elevations in plasma leucine are associated with alterations in enzymes involved in branched-chain amino acid metabolism. Am J Physiol Endocrinol Metab. 2007;293(6):E1552–E1563. | ||
McCormack SE, Shaham O, McCarthy MA, et. al. Circulating branched-chain amino acid concentrations are associated with obesity and future insulin resistance in children and adolescents. Pediatr Obes. 2013;8(1):52–61. | ||
Lynch CJ, Adams SH. Branched-chain amino acids in metabolic signalling and insulin resistance. Nat Rev Endocrinol. 2014;10(12):723–736. | ||
Boulet MM, Chevrier G, Grenier-Larouche T, et al. Alterations of plasma metabolite profiles related to adipose tissue distribution and cardiometabolic risk. Am J Physiol Endocrinol Metab. 2015;309(8):E736–E746. | ||
Giesbertz P, Padberg I, Rein D, et al. Metabolite profiling in plasma and tissues of ob/ob and db/db mice identifies novel markers of obesity and type 2 diabetes. Diabetologia. 2015;58(9):2133–2143. | ||
Martínez-Fernández L, Laiglesia LM, Huerta AE, Martínez JA, Moreno-Aliaga MJ. Omega-3 fatty acids and adipose tissue function in obesity and metabolic syndrome. Prostaglandins Other Lipid Mediat. 2015;121(Pt A):24–41. | ||
Kunesová M, Braunerová R, Hlavatý P, et al. The influence of n-3 polyunsaturated fatty acids and very low calorie diet during a short-term weight reducing regimen on weight loss and serum fatty acid composition in severely obese women. Physiol Res. 2006;55(1):63–72. | ||
Krebs JD, Browning LM, McLean NK, et al. Additive benefits of long-chain n-3 polyunsaturated fatty acids and weight-loss in the management of cardiovascular disease risk in overweight hyperinsulinaemic women. Int J Obes (Lond). 2006;30(10):1535–1544. | ||
Kim J, Okla M, Erickson A, Carr T, Natarajan SK, Chung S. Eicosapentaenoic acid potentiates brown thermogenesis through FFAR4-dependent Up-regulation of miR-30b and miR-378. J Biol Chem. 2016;291(39):20551–205562. | ||
Lackey DE, Lynch CJ, Olson KC, et al. Regulation of adipose branched-chain amino acid catabolism enzyme expression and cross-adipose amino acid flux in human obesity. Am J Physiol Endocrinol Metab. 2013;304(11):E1175–E1187. | ||
Lin Z, Tian H, Lam KS, et al. Adiponectin mediates the metabolic effects of FGF21 on glucose homeostasis and insulin sensitivity in mice. Cell Metab. 2013;17(5):779–789. | ||
Fisher FM, Kleiner S, Douris N, et al. FGF21 regulates PGC-1α and browning of white adipose tissues in adaptive thermogenesis. Genes Dev. 2012;26(3):271–281. | ||
Holland WL, Adams AC, Brozinick JT, et al. An FGF21-adiponectin-ceramide axis controls energy expenditure and insulin action in mice. Cell Metab. 2013;17(5):790–797. | ||
Gimeno RE, Moller DE. FGF21-based pharmacotherapy–potential utility for metabolic disorders. Trends Endocrinol Metab. 2014;25(6):303–311. | ||
Potthoff MJ, Inagaki T, Satapati S, et al. FGF21 induces PGC-1alpha and regulates carbohydrate and fatty acid metabolism during the adaptive starvation response. Proc Natl Acad Sci U S A. 2009;106(26):10853–10858. | ||
Chau MD, Gao J, Yang Q, Wu Z, Gromada J. Fibroblast growth factor 21 regulates energy metabolism by activating the AMPK-SIRT1-PGC-1alpha pathway. Proc Natl Acad Sci U S A. 2010;107(28):12553–12558. | ||
Parhofer KG. Interaction between glucose and lipid metabolism: more than diabetic dyslipidemia. Diabetes Metab J. 2015;39(5):353–362. | ||
Rendell M, Hulthén UL, Törnquist C, Groop L, Mattiasson I. Relationship between abdominal fat compartments and glucose and lipid metabolism in early postmenopausal women. J Clin Endocrinol Metab. 2001;86(2):744–749. | ||
Boden G, Laakso M. Lipids and glucose in type 2 diabetes: what is the cause and effect? Diabetes Care. 2004;27(9):2253–2259. | ||
Savage DB, Petersen KF, Shulman GI. Disordered lipid metabolism and the pathogenesis of insulin resistance. Physiol Rev. 2007;87(2):507–520. | ||
Nam M, Choi MS, Jung S, et al. Lipidomic profiling of liver tissue from obesity-prone and obesity-resistant mice fed a high fat diet. Sci Rep. 2015;5:16984. | ||
Wang W, Yang J, Qi W, et al. Lipidomic profiling of high-fat diet-induced obesity in mice: importance of cytochrome P450-derived fatty acid epoxides. Obesity (Silver Spring). 2017;25(1):132–140. | ||
Graessler J, Schwudke D, Schwarz PE, Herzog R, Shevchenko A, Bornstein SR. Top-down lipidomics reveals ether lipid deficiency in blood plasma of hypertensive patients. PLoS One. 2009;4(7):e6261. | ||
Liu TW, Heden TD, Matthew Morris E, Fritsche KL, Vieira-Potter VJ, Thyfault JP. High-fat diet alters serum fatty acid profiles in obesity prone rats: implications for in vitro studies. Lipids. 2015;50(10):997–1008. | ||
Mohorko N, Petelin A, Jurdana M, Biolo G, Jenko-Pražnikar Z. Elevated serum levels of cysteine and tyrosine: early biomarkers in asymptomatic adults at increased risk of developing metabolic syndrome. Biomed Res Int. 2015;2015:418681. | ||
Menni C, Migaud M, Glastonbury CA, et al. Metabolomic profiling to dissect the role of visceral fat in cardiometabolic health. Obesity (Silver Spring). 2016;24(6):1380–1388. | ||
Butte NF, Liu Y, Zakeri IF, et al. Global metabolomic profiling targeting childhood obesity in the Hispanic population. Am J Clin Nutr. 2015;102(2):256–267. | ||
Liu Y, Turdi S, Park T, et al. Adiponectin corrects high-fat diet-induced disturbances in muscle metabolomic profile and whole-body glucose homeostasis. Diabetes. 2013;62(3):743–752. | ||
Smith BK, Steinberg GR. AMP-activated protein kinase, fatty acid metabolism, and insulin sensitivity. Curr Opin Clin Nutr Metab Care. 2017;20(4):248–253. | ||
Mottillo EP, Desjardins EM, Crane JD, et al. Lack of adipocyte ampk exacerbates insulin resistance and hepatic steatosis through brown and beige adipose tissue function. Cell Metab. 2016;24(1):118–129. | ||
Rodríguez A, Becerril S, Ezquerro S, Méndez-Giménez L, Frühbeck G. Crosstalk between adipokines and myokines in fat browning. Acta Physiol (Oxf). 2017;219(2):362–381. | ||
Vamvini MT, Aronis KN, Panagiotou G, et al. Irisin mRNA and circulating levels in relation to other myokines in healthy and morbidly obese humans. Eur J Endocrinol. 2013;169(6):829–834. | ||
Bal NC, Singh S, Reis FCG, et al. Both brown adipose tissue and skeletal muscle thermogenesis processes are activated during mild to severe cold adaptation in mice. J Biol Chem. 2017;292(40):16616–16625. | ||
Feldman BJ, Streeper RS, Farese RV, Yamamoto KR. Myostatin modulates adipogenesis to generate adipocytes with favorable metabolic effects. Proc Natl Acad Sci U S A. 2006;103(42):15675–15680. |
Supplementary materials
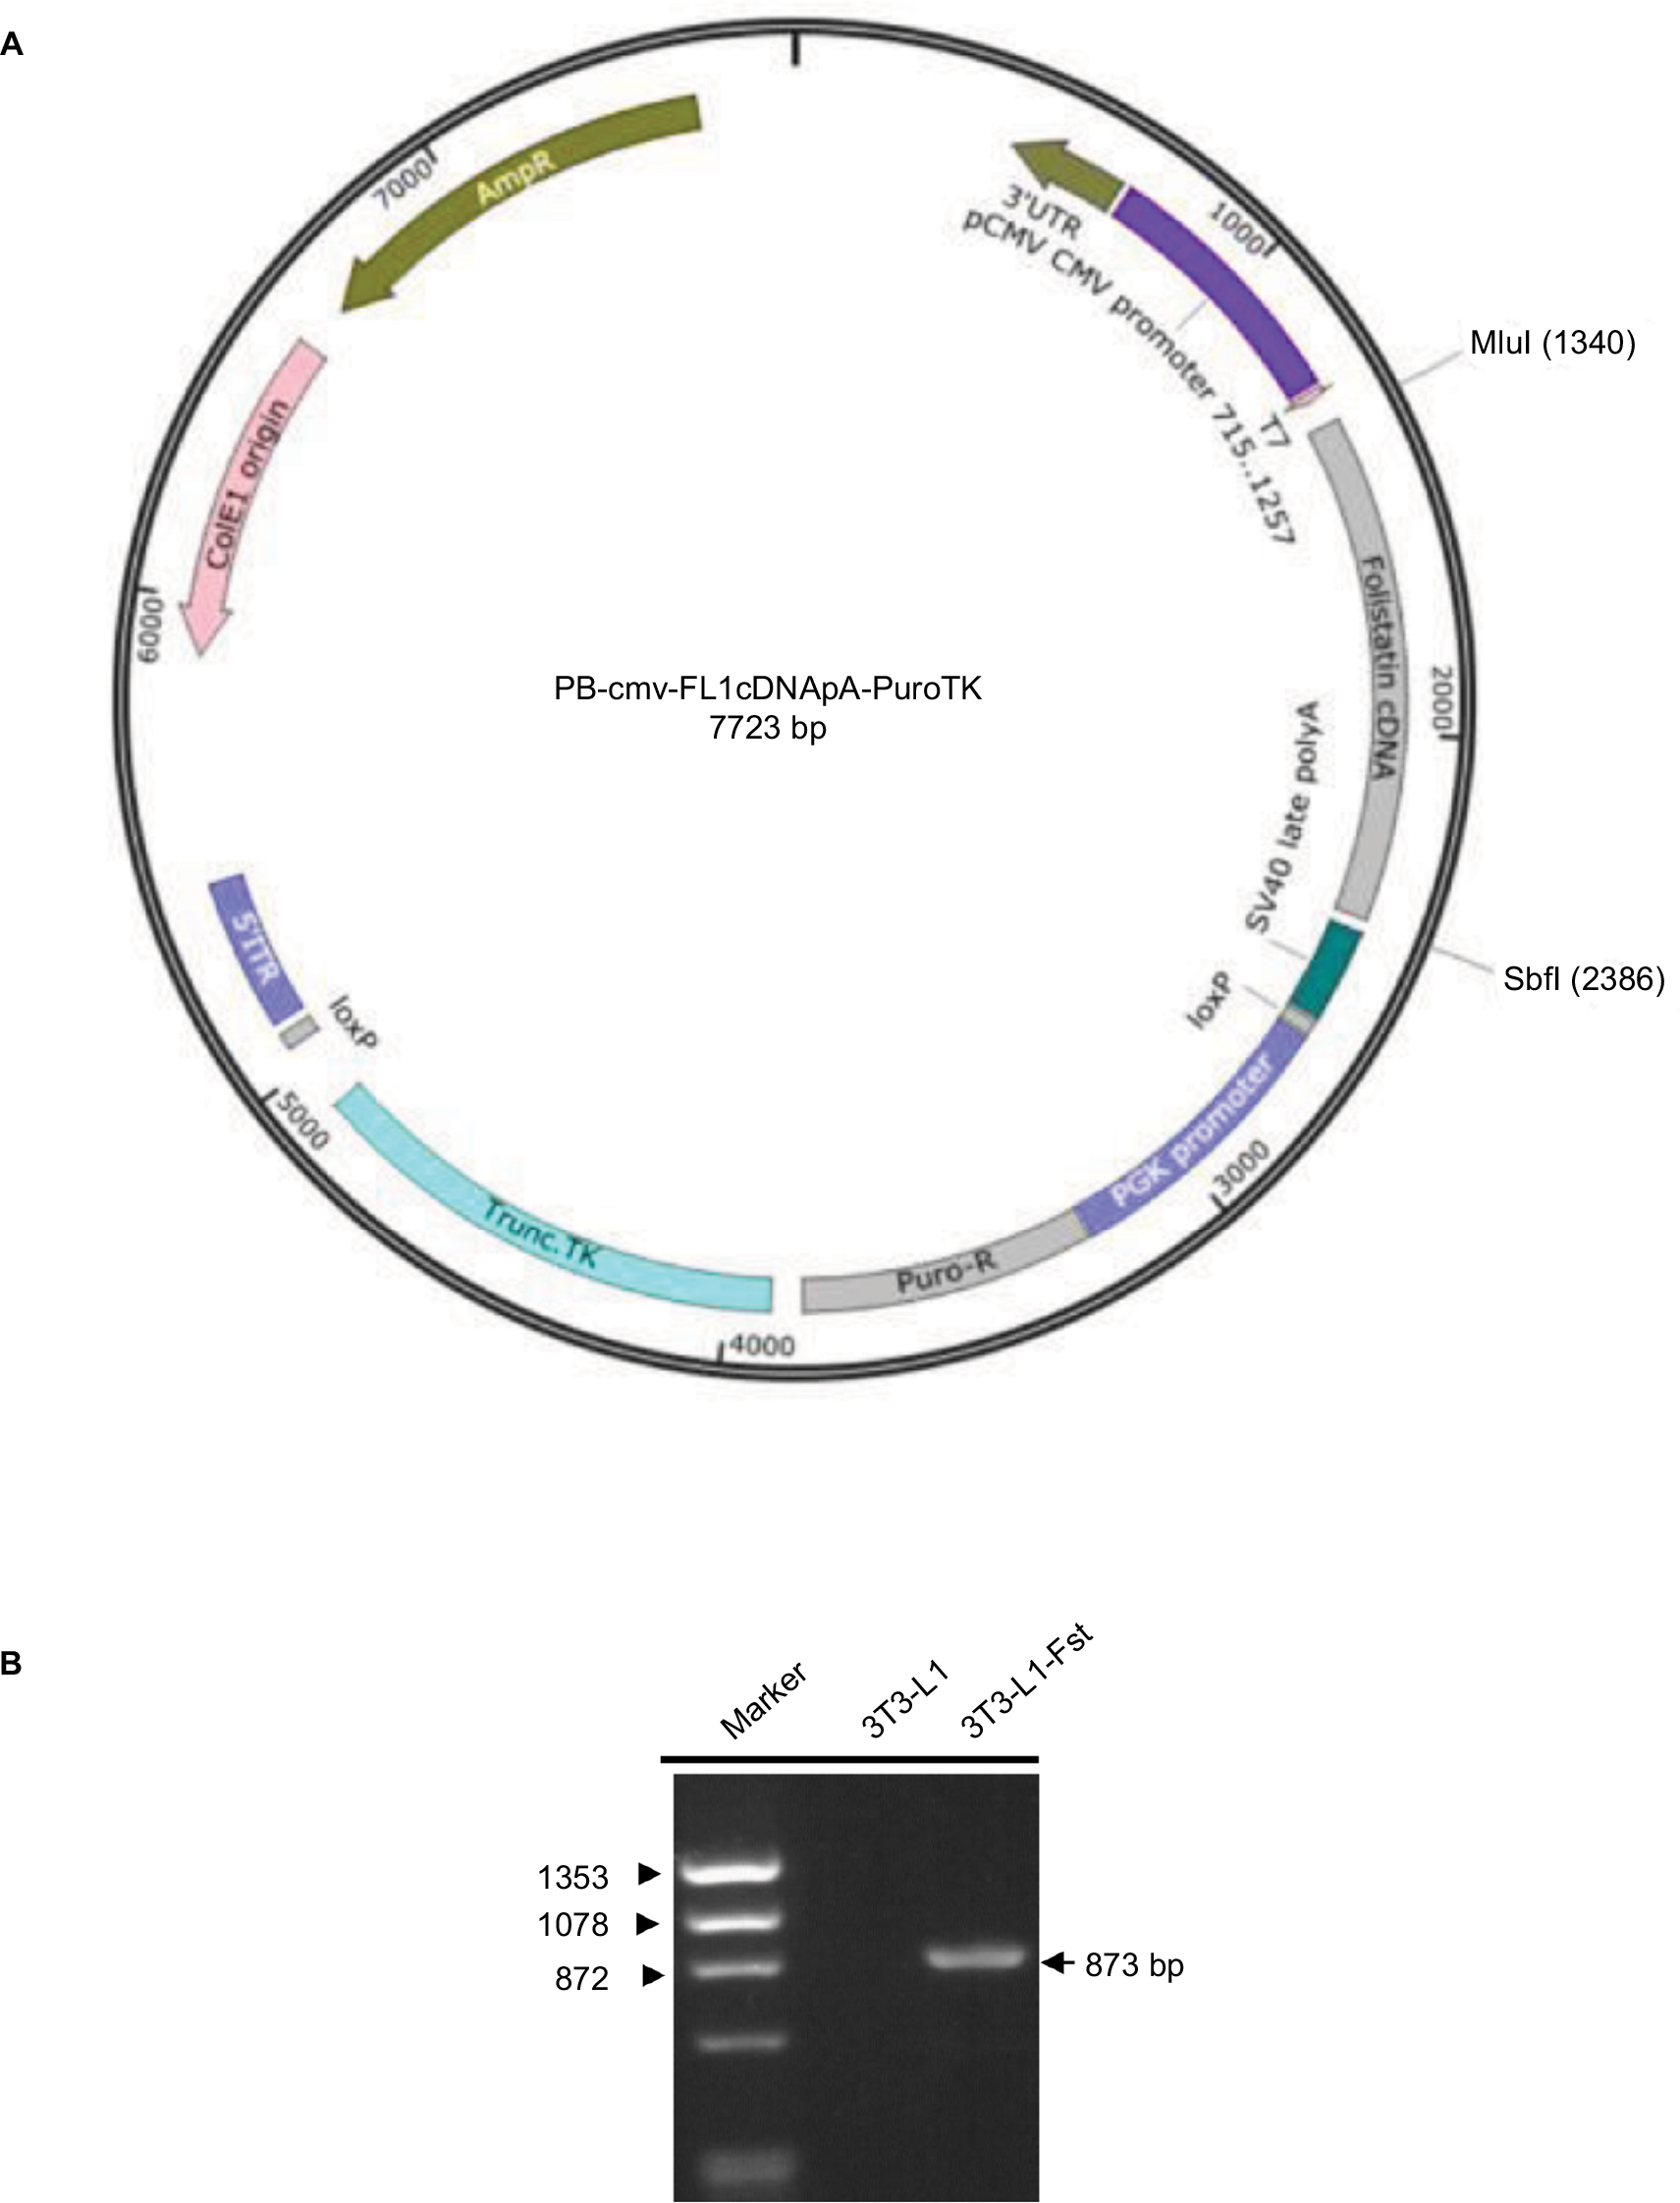 | Figure S1 (A) Vector map of PiggyBac-CMV-Fst-Puro. (B) Polymerase chain reaction analysis confirming Fst insertion in the PiggyBac-CMV-Fst-Puro construct. Abbreviation: Fst, follistatin. |
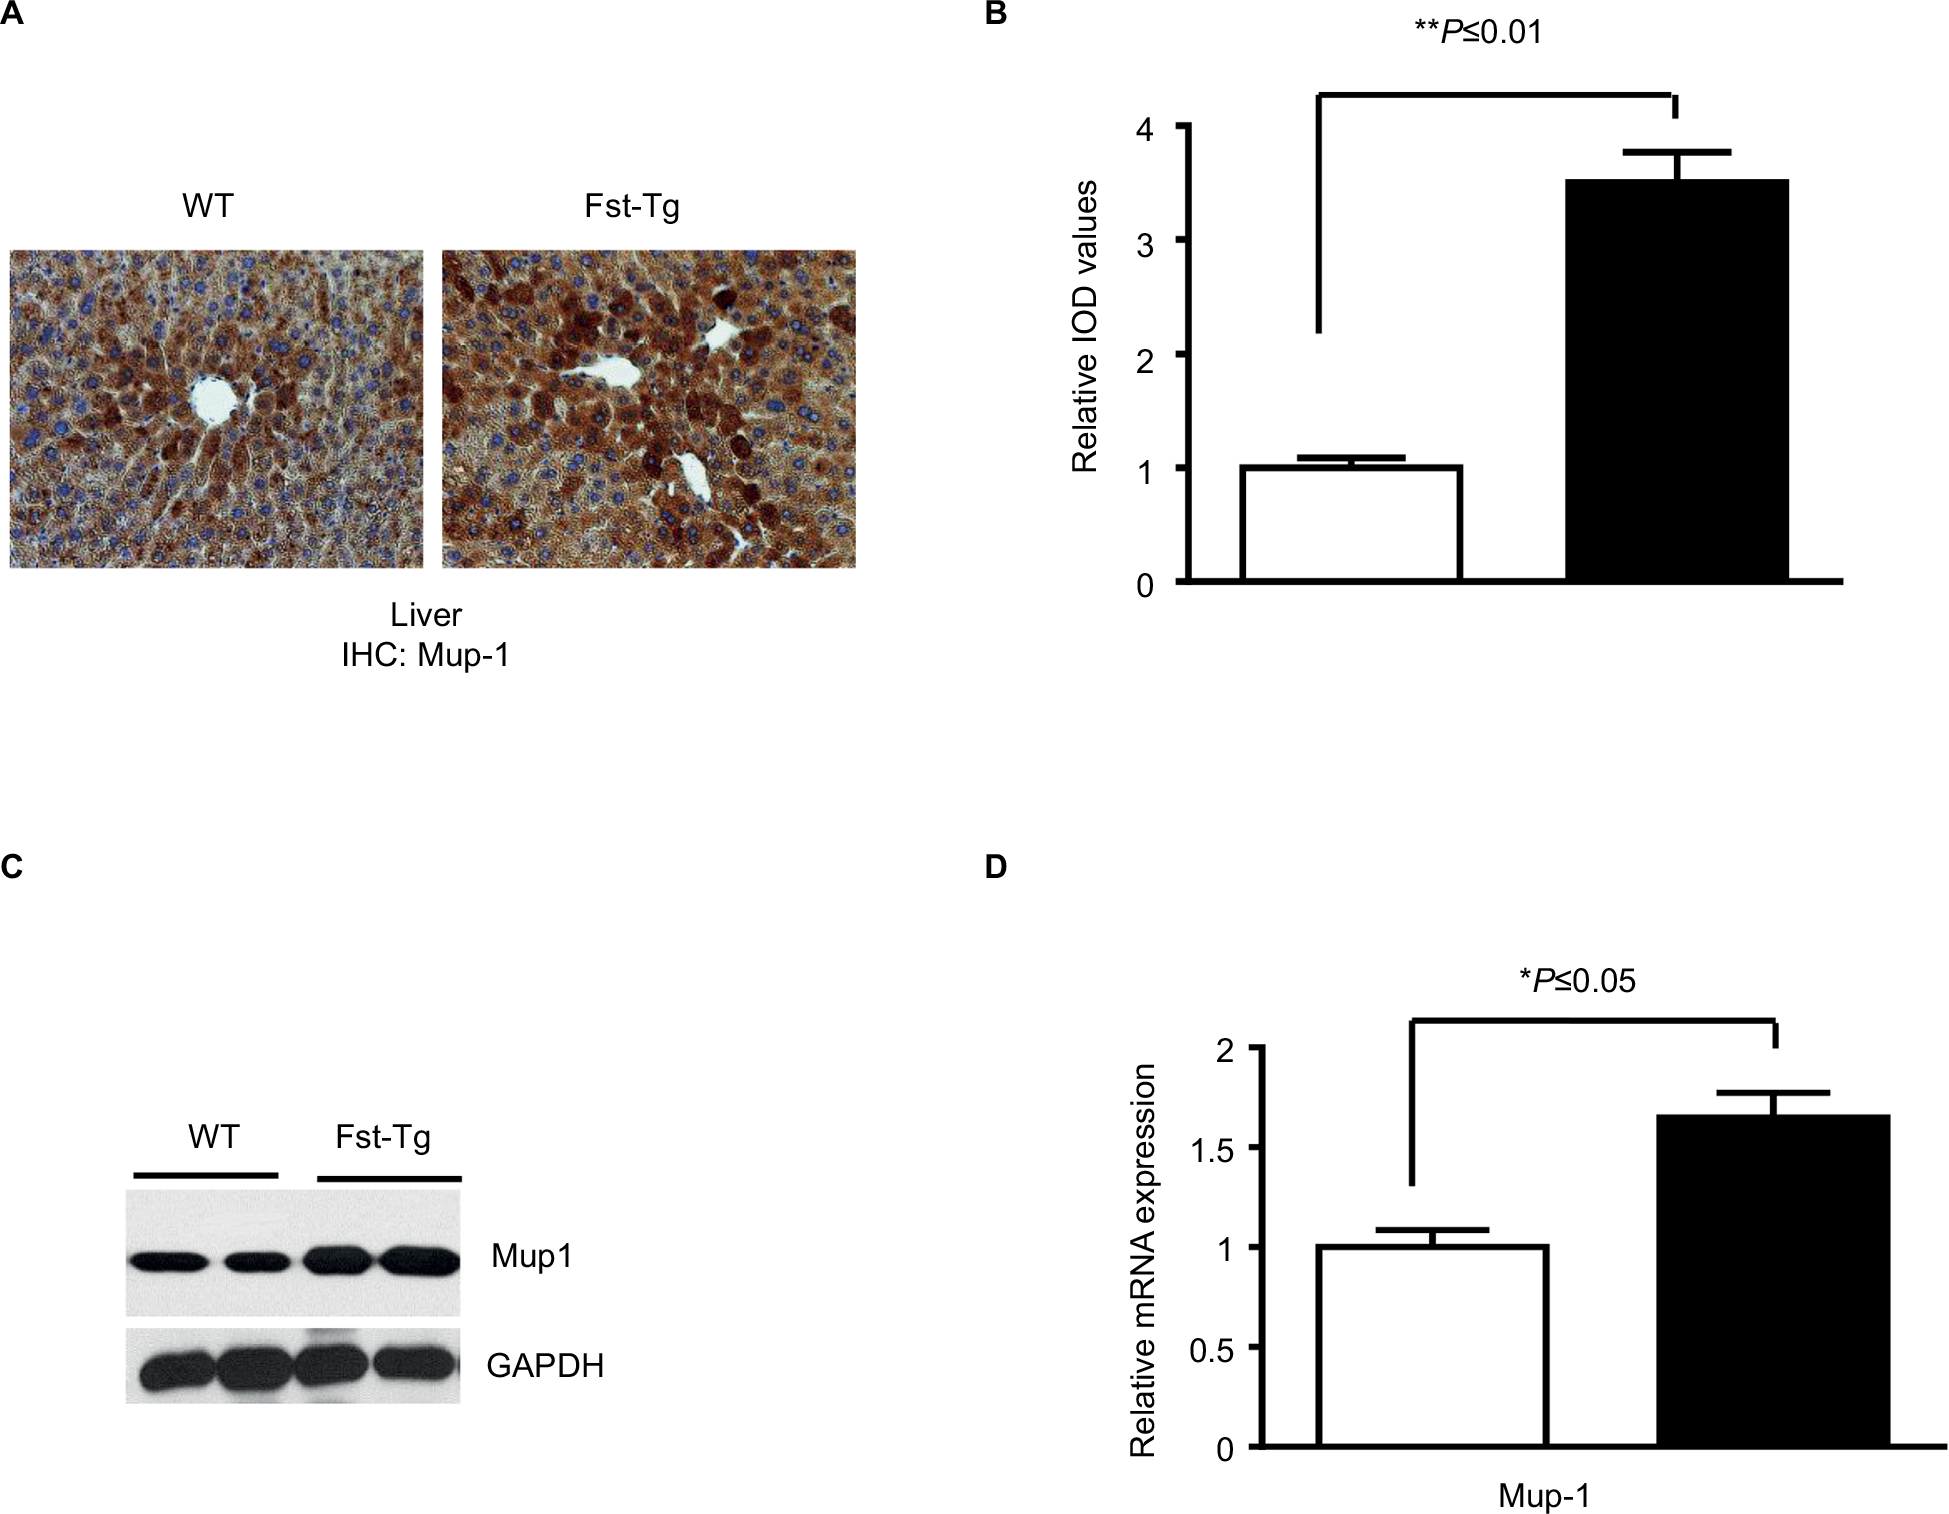 | Figure S2 Analysis of Mup1 expression in liver tissues from WT and Fst-Tg mice. Immunohistochemical analysis (A) and quantitative image analysis (B) of tissues sections. Integrated optical density (immunopositive area × intensity). Quantitation was performed using 20 images from 4 different areas as described previously.1–3 Analysis of Mup1 protein (C) and gene expression (D) by Western blot and quantitative real-time polymerase chain reaction analysis using standard procedures. Data are expressed as mean ± SD. *P≤0.05; **P≤0.01. Abbreviations: WT, wild type; Fst-Tg, follistatin transgenic; IHC, immunohistochemistry; Mup, major urinary protein; IOD, integrated optical density; GADPH, glyceraldehyde 3-phosphate dehydrogenase. |
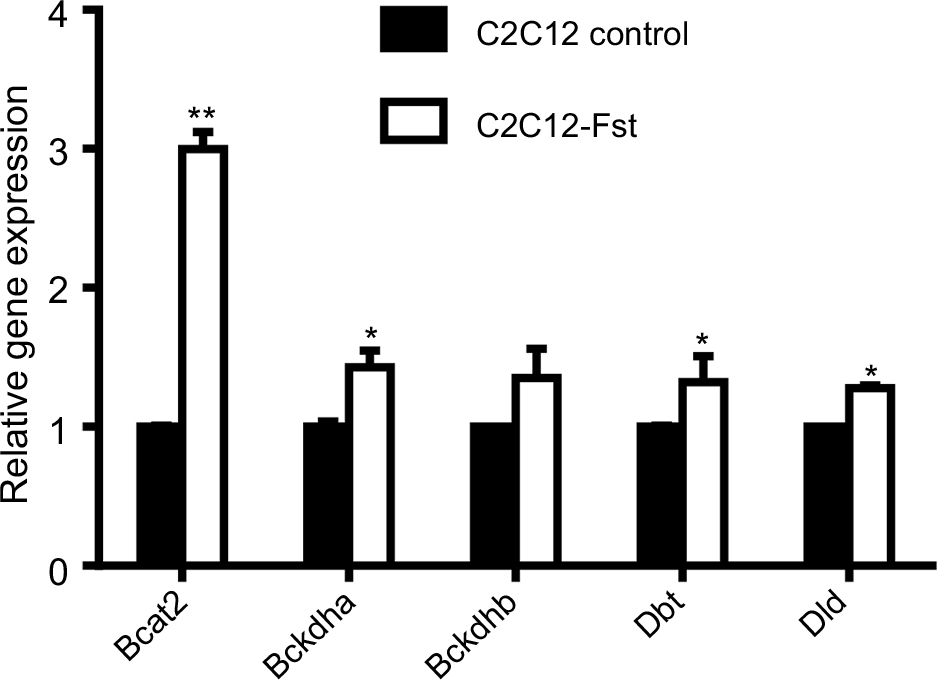 | Figure S3 Real-time quantitative polymerase chain reaction analysis of C2C12 and Fst overexpressing (C2C12-Fst) myoblast cells to compare gene expression profiles of key BCAA metabolizing enzymes. Data are expressed as mean ± SD. *P≤0.05; **P≤0.01 (n=3). Abbreviations: Fst, follistatin transgenic; BCAA, branched chain amino acid. |
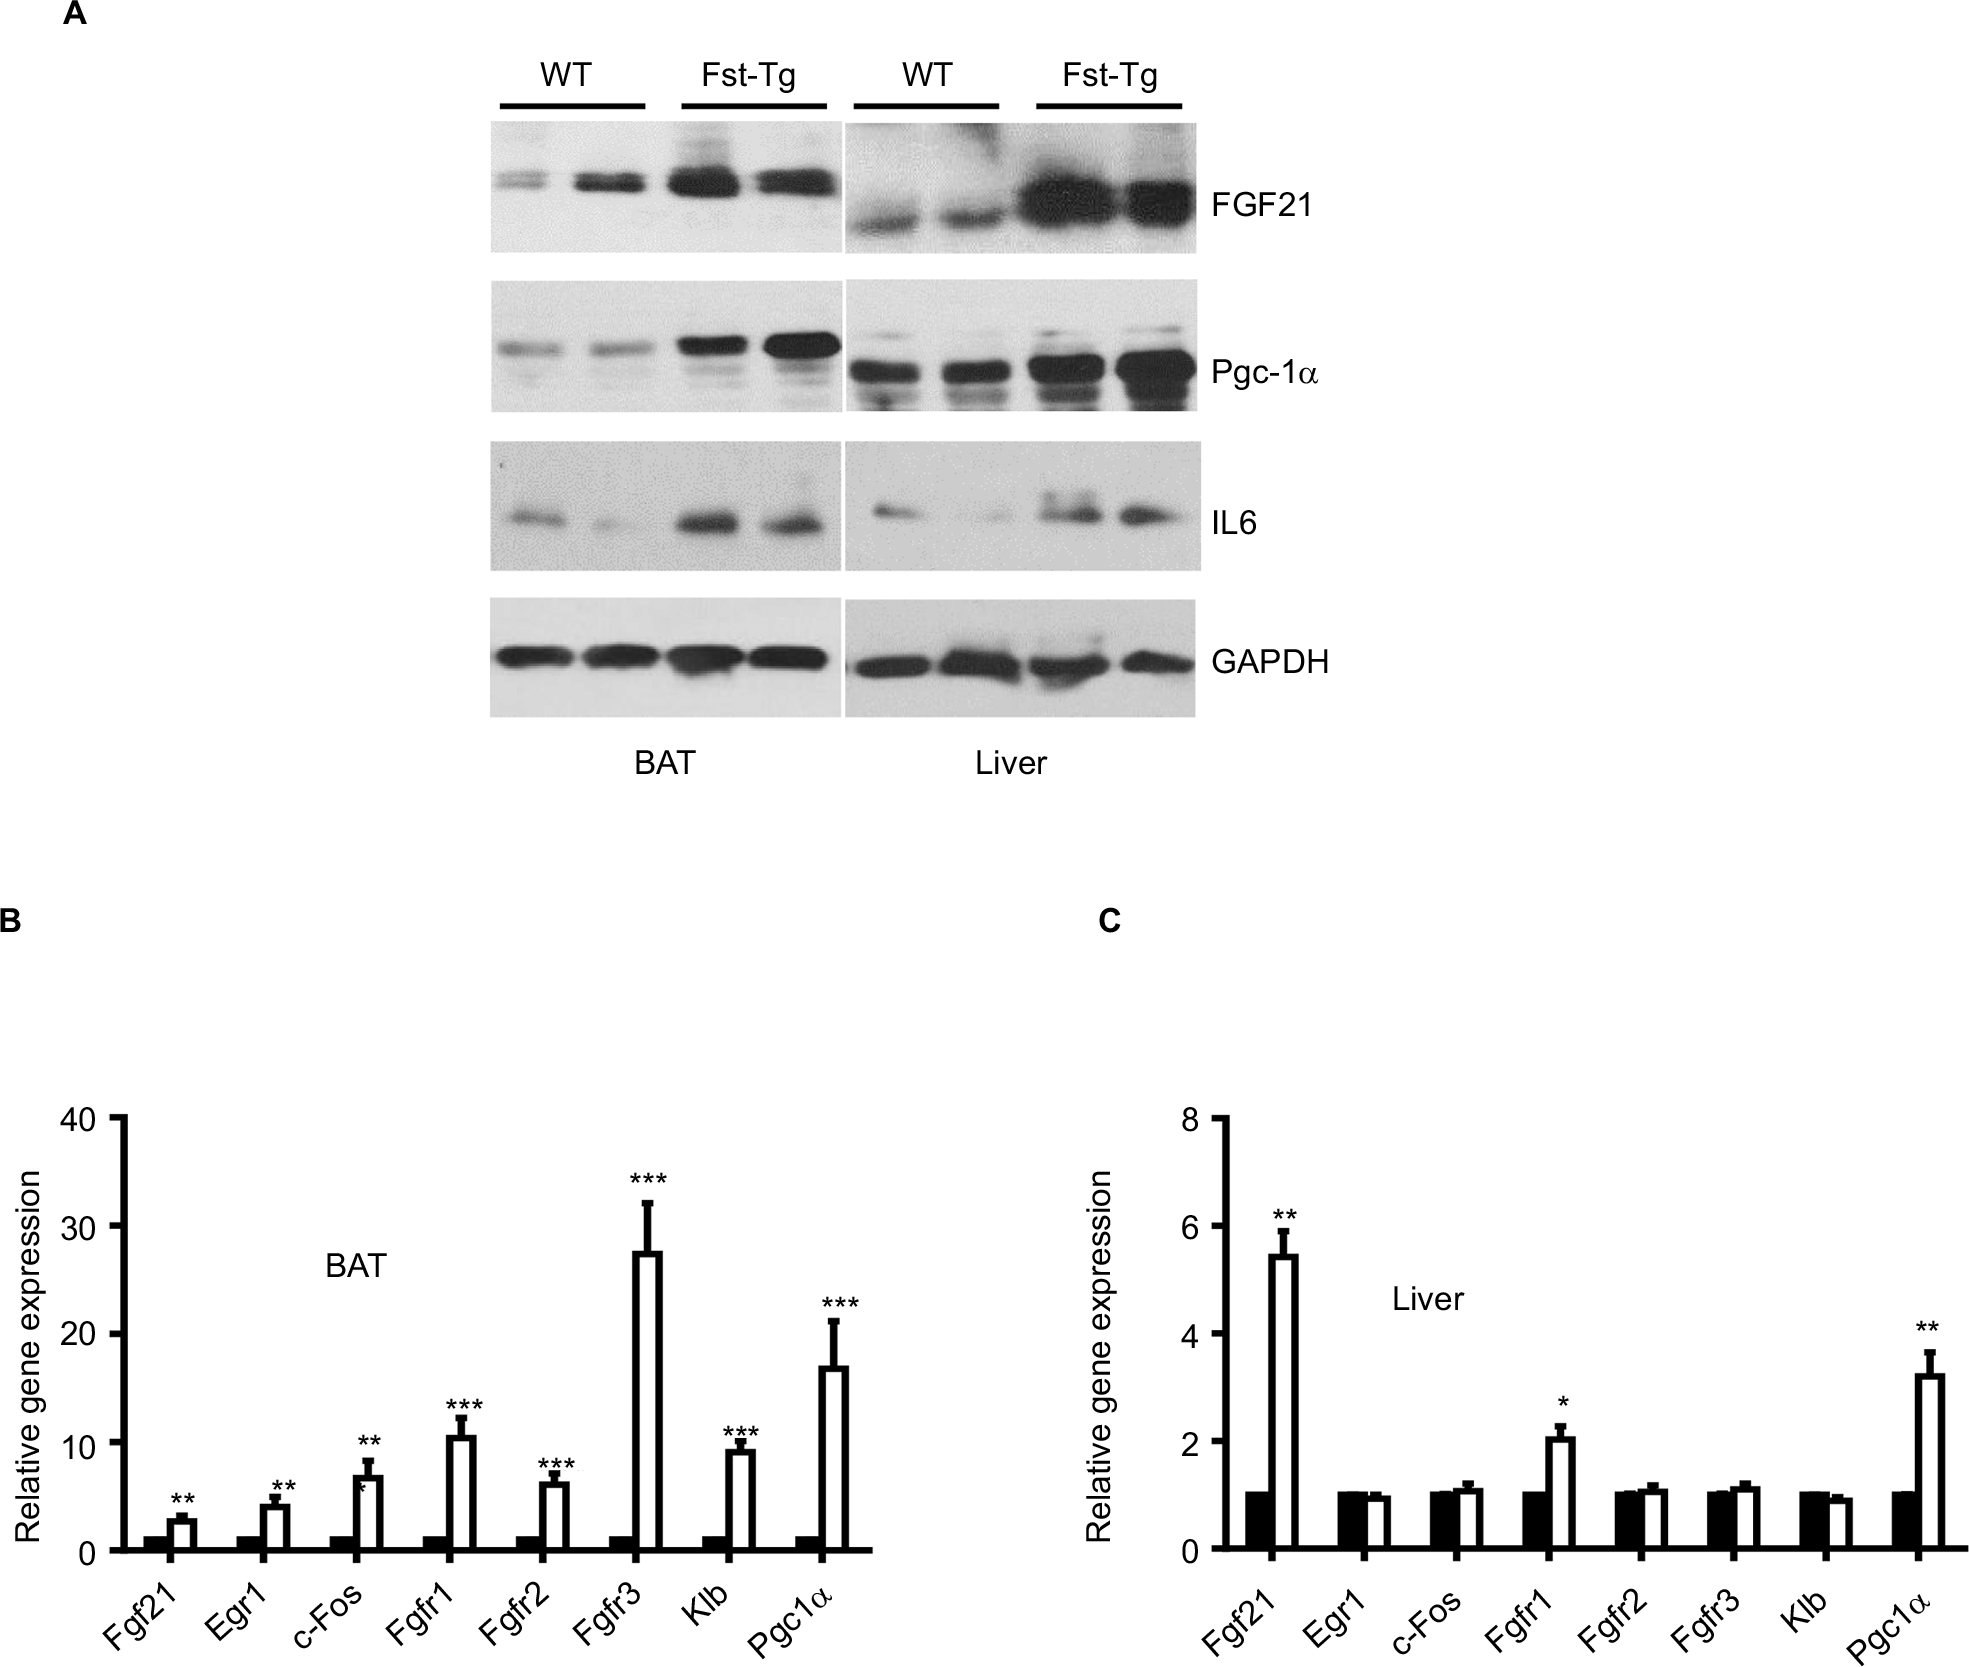 | Figure S4 Analysis of FGF21-associated markers in BAT and liver tissues from 6-weeks-old male WT and Fst-Tg mice. (A) Western blot analysis of FGF21, PGC-1α, and IL-6 proteins. (B to C) Quantitative gene expression analysis of FGF21, its receptors (Fgfr1-3), and beta-klotho (Klb) in BAT and liver tissues from WT and Fst-Tg mice. Data are expressed as mean ± SD. *P≤0.05; **P≤0.01; ***P≤0.001 (n=3). Abbreviations: WT, wild type; Fst-Tg, follistatin transgenic; FGF, fibroblast growth factor; PGC, peroxisome proliferator-activated receptor-gamma coactivator; IL, interleukin; GADPH, glyceraldehyde 3-phosphate dehydrogenase; BAT, brown adipose tissue. |
References
Braga M, Bhasin S, Jasuja R, Pervin S, Singh R. Testosterone inhibits transforming growth factor-β signaling during myogenic differentiation and proliferation of mouse satellite cells: potential role of follistatin in mediating testosterone action. Mol Cell Endocrinol. 2012;350(1):39–52. | ||
Braga M, Reddy ST, Vergnes L, et al. Follistatin promotes adipocyte differentiation, browning, and energy metabolism. J Lipid Res. 2014;55(3):375–384. | ||
Singh R, Braga M, Reddy ST, et al. Follistatin targets distinct pathways to promote brown adipocyte characteristics in brown and white adipose tissues. Endocrinology. 2017;158(5):1217–1230. |
 © 2018 The Author(s). This work is published and licensed by Dove Medical Press Limited. The full terms of this license are available at https://www.dovepress.com/terms.php and incorporate the Creative Commons Attribution - Non Commercial (unported, v3.0) License.
By accessing the work you hereby accept the Terms. Non-commercial uses of the work are permitted without any further permission from Dove Medical Press Limited, provided the work is properly attributed. For permission for commercial use of this work, please see paragraphs 4.2 and 5 of our Terms.
© 2018 The Author(s). This work is published and licensed by Dove Medical Press Limited. The full terms of this license are available at https://www.dovepress.com/terms.php and incorporate the Creative Commons Attribution - Non Commercial (unported, v3.0) License.
By accessing the work you hereby accept the Terms. Non-commercial uses of the work are permitted without any further permission from Dove Medical Press Limited, provided the work is properly attributed. For permission for commercial use of this work, please see paragraphs 4.2 and 5 of our Terms.