")
Back to Journals » International Journal of Nanomedicine » Volume 16
Metabolic Conversion and Removal of Manganese Ferrite Nanoparticles in RAW264.7 Cells and Induced Alteration of Metal Transporter Gene Expression
Authors Zhang L , Xiao S, Kang X , Sun T, Zhou C, Xu Z, Du M, Zhang Y, Wang G, Liu Y, Zhang D, Gong M
Received 2 November 2020
Accepted for publication 10 February 2021
Published 1 March 2021 Volume 2021:16 Pages 1709—1724
DOI https://doi.org/10.2147/IJN.S289707
Checked for plagiarism Yes
Review by Single anonymous peer review
Peer reviewer comments 4
Editor who approved publication: Dr Ebrahim Mostafavi
Liang Zhang, Shilin Xiao, Xun Kang, Tao Sun, Chunyu Zhou, Zhongsheng Xu, Mengmeng Du, Ya Zhang, Guangxian Wang, Yun Liu, Dong Zhang, Mingfu Gong
Department of Radiology, Xinqiao Hospital, Army Medical University, Chongqing, People’s Republic of China
Correspondence: Dong Zhang; Mingfu Gong
Department of Radiology, Xinqiao Hospital, Army Medical University, No. 183, Xinqiao Street, Shapingba District, Chongqing, People’s Republic of China
Tel +86 2368763843
Fax +86 2368755306
Email [email protected]; [email protected]
Background: Manganese Ferrite Nanoparticles (Mn-IONPs) are widely used in biomedical field and their cytotoxicity has been initially explored, but the mechanism remains obscure. The nano-bio interactions are believed to be crucial for cytotoxicity mechanism, while little data have been acquired.
Methods: Mn-IONPs were synthesized by thermal decomposition of acetylacetonate precursor. After physicochemical characterization, we analyzed the metabolic conversion and removal of Mn-IONPs in RAW264.7 cells by Prussian blue staining, TEM, HRTEM and elemental quantitative analysis, followed by gene expression evaluation using quantitative RT-PCR.
Results: Mn-IONPs were successfully synthesized. Both the uptake and cytotoxicity of Mn-IONPs on RAW264.7 cells were time- and dose-dependent. After internalized, Mn-IONPs were passed to daughter cells with passages on. Meanwhile, Mn-IONPs were exocytosed and digested to metal ions and further excreted out, resulted in the labeling rate and ions contents decreased gradually. As ion influx related genes, the expressions of ZIP14, IRP2, FtH and DMT1 were suppressed within 24 hours but overexpressed to a plateau at the 48th hour in a dose-dependent manner. At the 72nd hour, ZIP14 and DMT1 mRNA levels decreased toward normal, while IRP2 and FtH kept up-regulated. As efflux related genes, FPN, SLC30A10 and Hamp2 genes were up-regulated within 24– 72 hours; SPCA1 was suppressed at the 24th and 72nd hour, while overexpressed at the 48th hour. All the efflux related genes’ mRNA had a dose-dependent increasing manner at the corresponding time points.
Conclusion: Mn-IONPs showed time- and dose-dependent cytotoxicity and cell labeling rate in RAW264.7 cells. Accompanying with the intracellular catabolic breakdown and exocytosis of Mn-IONPs, RAW264.7 cells also secreted and re-uptook manganese and iron ions to maintain intracellular homeostasis in the succeeding passages. And the metabolic conversion of Mn-IONPs in RAW264.7 cells can affect the expression of ZIP14, DMT1, FPN, SLC30A10, IRP2, FtH, Hamp2 and SPCA1 genes.
Keywords: manganese ferrite nanoparticles, cytotoxicity, metabolism, metal transporter genes, RAW264.7 macrophage cells
Introduction
Benefiting from exceptionally good biocompatibility, and conferring effective spin relaxivity to protons undergoing nuclear spin transitions, superparamagnetic iron oxide (SPIO) nanoparticles (NPs) have aroused much attention and been studied intensively in magnetic resonance imaging (MRI), magnetic particle imaging (MPI), magneto-motive ultrasound imaging (MMUS), magneto-photoacoustic imaging (MPA) and magnetic fluid hyperthermia (MFH) community.1–8 In furtherance of these prospective objectives, some SPIO NPs based T2 contrast agents (CAs) (eg, Feridex, Resovist, and Combidex) have been approved for clinical MRI.9 In general, the performance of magnetic NPs in such biomedical application is closely relative with their magnetic properties. In the nuclear magnetic resonance-based application, the most important magnetic property is the relaxivity. Magnetic NPs with higher relaxivity are desirable to show better sensitivity. However, the relaxivity of SPIO has been demonstrated to be not good enough for the optimal performance for disease diagnosis and therapy.10 Especially in magnetic resonance molecular imaging (MRMI), SPIO is far from cell migration tracking and imaging because of their modest relaxivity.11,12 By doping manganese cation (Mn2+) in SPIO, their relaxivity can be improved.13 The doped Mn2+ is known to occupy both tetrahedral and octahedral holes of the oxygen-packed, face-centered cubic lattices, giving manganese ferrite nanoparticles (Mn-IONPs) a mixed spinel structure. Other metal-doped SPIO NPs, on the other hand, are often of inverse spinel structure.14 Coupling with the higher magnetic moment of Mn2+ (μB=5.92) and the synergetic enhancement between Mn2+ doped and SPIO NPs based on the embedding rationale, the Mn-IONPs are reasonably found to exhibit higher saturation magnetization (Ms) and greater longitudinal relaxivity (r1) and transverse relaxivity (r2) among the metal-doped SPIOs, making them more desirable candidates for MRMI.15–18
Good biocompatibility is one of the most important requirements of inorganic NPs for in vivo applications.19,20 SPIOs have been widely examined for toxicological effects both in vitro and in vivo.21–23 Mn-IONPs may exhibit totally different cytotoxicity, however, because Mn2+-doping changes the crystal structure and increases the number of structural defects that disrupt the well structured electronic configuration of SPIO NPs.18 Conceptually, the latent potential of Mn2+ release allows the possibility of metal ion interaction with the intracellular components, which may result in the adverse effects on cell survival.24,25 Thus, the biological effects of Mn-IONPs need to be specifically investigated. Until recently, researchers have examined the biocompatibility of Mn-IONPs and consistently found that they show a dose- and time-dependent cytotoxicity.16 However, further study of the cytotoxic mechanisms revealed different results, and most researchers believe that the cytotoxicity is mainly due to the reactive oxygen species (ROS) induced by the inorganic NPs, while others indicate ROS have little effect on toxic effect.26–29 The inconsistent conclusions are due to a poor understanding of the mechanisms of IONPs acting at the cellular level.30 NPs engulfed or the ions released from these NPs have the potential to bind to biological macromolecules or cellular organelles, and directly block or promote cellular activities.23 Concomitantly, the NPs or ions can induce secondary effector molecules that generate indirect harmful or protective effects.31 Therefore, exploring the metabolic fate of the intracellular Mn-IONPs and the changes they initiate in affected proteins may provide some new evidence that determines or supplements ideas about the cytotoxic mechanism.
Most inorganic NPs are introduced in vivo by intravenous injection (iv). As foreign bodies, NPs interact with various biomacromolecules such as blood plasma proteins and immediately become attached to primary proteins (eg, opsonin) on the NPs surface forming a protein corona.32,33 Mediated by the opsonization, which is the major host immune and inflammatory response against foreign objects, they attract innate immune cells. Most NPs are recognized and ingested by macrophages (Kupffer or reticular macrophages) and then become eliminated from the circulation.23 Therefore, unraveling the metabolic fate of Mn-IONPs in macrophages which interact with almost all the NPs intravenously injected is now recognized as critically necessary and appropriately representative to determine the cytotoxic mechanism of Mn-IONPs.34
Hence, in the present study, we firstly synthesized Mn-IONPs by thermal decomposition of iron acetylacetonate and manganese acetylacetonate. After characterization of the obtained Mn-IONPs by transmission electron microscopy (TEM), High-Resolution Transmission Electron Microscopy (HRTEM), X-ray diffraction (XRD), X-ray photoelectron spectroscopy (XPS), inductively coupled plasma-optical emission spectrometry (ICP-OES) and Inductively Coupled Plasma-Mass Spectrometry (ICP-MS), we evaluated their cytotoxic effect, uptake, and metabolism with the mouse monocyte-macrophage line RAW264.7 cells in vitro. Besides, we analyzed the mRNA expression of three types of metal-homeostasis-related proteins of the labeled cells using qRT-PCR to explore the molecular mechanisms of Mn-IONPs metabolism in macrophages at the gene level. These proteins are: the solute carrier family 39 member 14 (SLC39A14; Alias: ZRT/IRT-like Protein 14, ZIP14), the solute carrier family 11 member 2 (SLC11A2; Alias: divalent metal transporter 1, DMT1), ferroportin (FPN), the solute carrier family 30 member 10 (SLC30A10), iron regulatory protein 2 (IRP2), hepcidin (Hamp2), ferritin H chain (FtH), and the secretory pathway Ca2+-ATPase 1 (SPCA1). Our results revealed that both the uptake and cytotoxicity of Mn-IONPs on RAW264.7 cells were time- and dose-dependent. Accompanying with the intracellular catabolic breakdown and exocytosis of Mn-IONPs, RAW264.7 cells also secreted and re-uptook manganese and iron ions to maintain intracellular homeostasis in the succeeding generations. The internalized Mn-IONPs within cells can affect the expression of some genes, including ZIP14, DMT1, FPN, SLC30A10, IRP2, FtH, Hamp2 and SPCA1 genes. The findings of this study may contribute to the further understanding of the NPs’ kinetics and mechanism within cells and its influence on the metal transporter gene expression.
Materials and Methods
Materials
RAW264.7 cells were purchased from Procell Life Science & Technology Co., Ltd (Wuhan, China). Iron acetylacetonate, manganese acetylacetonate, 1.2-hexadecanediol, oleic acid, oleylamine, benzyl ether, hexyl hydride, and Tetramethylammonium Hydroxide (TMAH) were purchased from Sigma-Aldrich (St Louis, MO, USA). Absolute ethyl alcohol and hydrochloric acid were obtained from Chongqing Chuandong Chemical Co., Ltd. (Chongqing, China). Phosphate-buffered saline (PBS), 4% paraformaldehyde, and Cell Counting Kit-8 (CCK-8) were purchased from Boster (Wuhan, China). Penicillin, streptomycin, and L-glutamine were purchased from Beyotime (Shanghai, China). RNAsimple Total RNA kit was obtained from Tiangen (Beijing, China). PrimeScript™ 1st Strand cDNA synthesis kit, and TB Green™ Premix DimerEraser™ kit were purchased from TAKARA (Dalian, China). Dulbecco’s modified eagle medium high-glucose (DMEM-H) and fetal bovine serum (FBS) were purchased from Hyclone (South Logan, UT, USA). Potassium ferrocyanide and eosin solution were obtained from Solarbio (Beijing, China). Trypsin-EDTA (0.25%) was obtained from Gibco (Gaithersburg, MD, USA). All the reagents were used as received without further treatment.
Preparation and Characterization of Mn-IONPs
The Mn-IONPs were prepared according to a reported method with some modification.35 Briefly, 2 mmol iron acetylacetonate, 1 mmol manganese acetylacetonate, 5 mmol 1.2-hexadecanediol, 6 mmol oleic acid and 6 mmol oleylamine were mixed in 10 mL benzyl ether and deoxidized under argon atmosphere for 30 minutes (mins). The mixture was then successively heated to 110°C for 30 mins, 200°C for 2 hours, and refluxed for 1 hour. After cooling to room temperature, the mixture was washed with 20 mL ethanol twice and finally redispersed in 10 mL hexyl hydride for storage. To convert the hydrophobic surface of the Mn-IONPs to a hydrophilic surface, the NPs were treated with TMAH following a previously reported procedure.36 TEM (Hitachi HT-7700, Hitachi, Tokyo, Japan) was used to determine the morphology and size distribution of the prepared NPs. XRD (PANalytical X’Pert Powder, Almelo, Netherlands) was used to confirm the crystal structure, XPS (ESCALAB 250Xi, Waltham, MA, USA) and ICP-OES (iCAP 6300 Duo, Waltham, MA, USA) were used to detect the elemental composition of the Mn-IONPs and the concentrations of Fe and Mn in the NPs suspensions, respectively. To determine the colloidal stability, the zeta potential and hydrodynamic size distribution of Mn-IONPs suspended in milli-Q water and complete DMEM-H medium (C-DMEM-H) which consisted of 90% DMEM-H, 100 U/mL penicillin, 100 μg/mL streptomycin, 2 mM L-glutamine, and 10% FBS were measured by Nicomp ZLS Z3000 (PSS, Port Richey, FL, USA) at different time (12 hours, 24 hours, 48 hours and 72 hours). After kept at 37°C in a CO2 incubator (Thermo, Waltham, MA, USA) for different periods (1 day, 2 days, 3 days and 7 days), 5 mL suspensions were collected from the C-DMEM-H containing Mn-IONPs (Fe concentration was 900 μM). Following the centrifugation at 5000 rpm for 40 mins in the 1 kDa Millipore ultrafiltration centrifuge tubes (Millipore, Bedford, MA, USA), the collected filtered solutions were analyzed using ICP-MS (Thermo Electron Corp., Waltham, MA, USA) to evaluate the chemical stability of Mn-IONPs in cell media. The zeta potential of C-DMEM-H without Mn-IONPs was also determined and used as a reference group in this section.
Cell Viability Assay
RAW264.7 cells were routinely cultured in C-DMEM-H at 37°C in a CO2 incubator (Thermo, Waltham, MA, USA). The cytotoxic effect of Mn-IONPs on RAW264.7 cells was evaluated using CCK-8. Briefly, approximately 5 × 10³ cells per well were seeded in 96-well plates and incubated overnight. The cells were then incubated with 100 μL fresh medium containing Mn-IONPs of different Fe concentrations (0, 22.5, 45, 90, 180, 360, 900 and 1800 μM) for 12, 24 and 48 hours, respectively. After pre-established time intervals, the cells were washed with PBS three times, and further cultured with a mixed medium containing 10% 2-(2-methoxy-4-nitrophenyl)-3-(4-nitrophenyl)-5-(2,4-disulfophenyl)-2H-tetrazolium (WST-8) solution. After 1.5 hours of co-incubation, the optical density (OD) value was measured at 450 nm using a varioskan flash microplate spectrophotometer (Thermo, Waltham, MA, USA). The relative cell viability was acquired by calculating the percentage of viable cells in total cells. Cell proliferation of RAW264.7 cells exposed to different concentrations of Mn-IONPs (0, 22.2, 45, 90, 180, 360, 900 and 1800 μM) were evaluated using the linear regression: plots of Log2(OD) vs time (hours), and the cell doubling time was acquired by calculating the value of 1/linear regression coefficient.37
Cell Labeling and Prussian Blue Staining
Prussian blue staining assay was used to determine the location of Mn-IONPs within cells and the rate of uptake. Approximately 1×10⁴ cells per well were seeded overnight on tissue-culture treated glass coverslips (Solarbio, Beijing, China) in 24-well plates. Cells were then challenged with Mn-IONPs suspensions (Fe concentrations of 45, 90, 180 and 360 μM) for 24 hours. To ensure the accuracy of the labeling rate, the treated cells were washed three times with PBS to remove the free Mn-IONPs and the weakly attached NPs on the cytomembranes. The labeled cells were then fixed with 4% paraformaldehyde for 15 mins, incubated with Prussian blue staining solution (containing equal volumes of 2% hydrochloric acid and 2% potassium ferrocyanide) for 30 mins, and subsequently in 1% eosin solution for 15 mins in sequence. The labeling rate was acquired by calculating the percentage of prussian blue stained cells in total cells. The images were obtained using an inverted fluorescence microscope (Leica Microsystems, Wetzlar, Germany).
Monitoring Iron and Manganese in Passaging Cells
To monitor the intracellular metabolism of Mn-IONPs, the RAW264.7 cells were cultured in 25 cm2 flasks with a density of 4×10⁴ cells/cm2 and incubated with 360 μM Mn-IONPs suspensions for 24 hours. After removing cell medium and washed three times with PBS, the cells were collected (tagged as P1) and resuspended in 1 mL fresh culture medium for further use. A quarter of the P1 cells were sub-cultured for 48 hours and then collected (tagged as P2). Half of P1 cells were counted, centrifuged, and further digested with 0.5 mL chloroazotic acid (37% hydrochloric acid: 65% nitric acid = 3:1 v/v). This protocol was used to measure intracellular Mn and Fe contents by ICP-OES. The remaining quarter of P1 cells were seeded on glass coverslips for Prussian blue staining. The P2 cells were continuously passaged to the seventh passage (P7) and were treated similarly to P1 (Figure 1). Meanwhile, the removed cell medium of P1 cells was centrifuged, and the obtained precipitates were re-dispersed in milli-Q water and then observed by TEM. Some additional P1 and P2 cells were centrifuged, fixed, sliced, and then photographed with TEM and HRTEM to evaluate the size and morphology change of Mn-IONPs within cells. The corresponding size distribution of Mn-IONPs was measured using ImageJ software (National Institutes of Health, Bethesda, Maryland, USA).
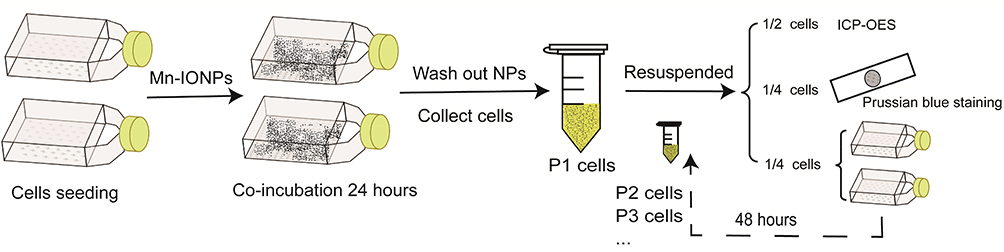 |
Figure 1 Cartoon of the protocol in this section. |
RNA Isolation, cDNA Synthesis, and Quantitative RT-PCR
For the mRNA expression evaluation of ZIP14, DMT1, FPN, SLC30A10, IRP2, Hamp2, FtH, and SPCA1, RAW264.7 cells were first seeded in 6-well plates at a density of approximately 1×10⁵ cells per well and co-incubated with Mn-IONPs suspensions with the series of Fe concentrations (0, 45, 90, 180, 360, 900 and 1800 μM) for 24 hours (group 1). Two more groups of cells were further cultured with fresh medium for another 24 hours (group 2, total 48 hours), or 48 hours (group 3, total 72 hours) after a 24 hours co-incubation with cell medium containing Mn-IONPs. All the cells were then collected and assayed using an RNAsimple Total RNA Kit for the total RNA extraction, according to the manufacturer’s protocol. RNAs were reverse-transcribed to the first-strand cDNA using a PrimeScript™ 1st Strand cDNA Synthesis Kit. Quantitative RT-PCR (qRT-PCR) was carried out using TB Green™ Premix DimerEraser™ in an ABI ViiA7 Real-Time PCR system (Applied Biosystems). Each sample was analyzed in triplicate. The thermocycling program consisted of holding at 95°C for 40 s, followed by 50 cycles of 8 s at 95°C and 35 s at 58°C. Primer sequences were designed by Primer Premier 5.0 and listed in Table S1. All the primers were synthesized by Sangon Biotech (Shanghai) Co., Ltd (Sangon, Shanghai, China). Data were normalized to the mRNA levels of the housekeeping gene β-actin. Relative gene expression data were analyzed using the 2−ΔΔCt method.
Statistical Analysis
All data were expressed as the mean ± SD and analyzed by GraphPad Prism 6.0 for Windows (GraphPad Software, San Diego, CA, USA). Statistical comparison of the means between two groups was performed using one-way ANOVA followed by Sidak’s post hoc test. The significance levels were identified as follows: *p < 0.05; **p <0.01; ns, not significant.
Results
NPs Characterization
The TEM images, as shown in Figure 2A, indicated that we successfully synthesized the expected NPs and they were of spheroidal appearance with good mono-dispersity in size. The average diameter of the synthesized NPs was ca. 8.6 ±1.4 nm and the size distribution was shown in Figure 2A (inset). The XRD pattern showed that the characteristic and broad diffraction peaks mainly originated from MnFe2O4 (JCPDS card no. 10–0319) (Figure 2B). XPS spectra of Fe 2p showed two binding energy peaks at 711.4 eV and 725.5 eV, which were ascribed to Fe 2p3/2 and Fe 2p1/2 of Fe3+ (Figure 2C). For the Mn 2p spectrum (Figure 2D), two strong peaks at 641.5 eV and 653.9 eV were assigned to Mn 2p3/2 and Mn 2p1/2 of Mn2+ in Mn-IONPS. The ICP-OES spectra further confirmed the presence of both Fe and Mn in the obtained NPs, and the mass concentrations of Fe and Mn mass were of 4.237 mg/mL and 1.52 mg/mL, respectively. Thus, the Fe/Mn molar ratio was ca. 2.8:1. All the results of XRD, XPS, and ICP-OES indicated that the expected Mn-IONPs were successfully prepared and could be denoted as Mn0.79Fe2.21O4.
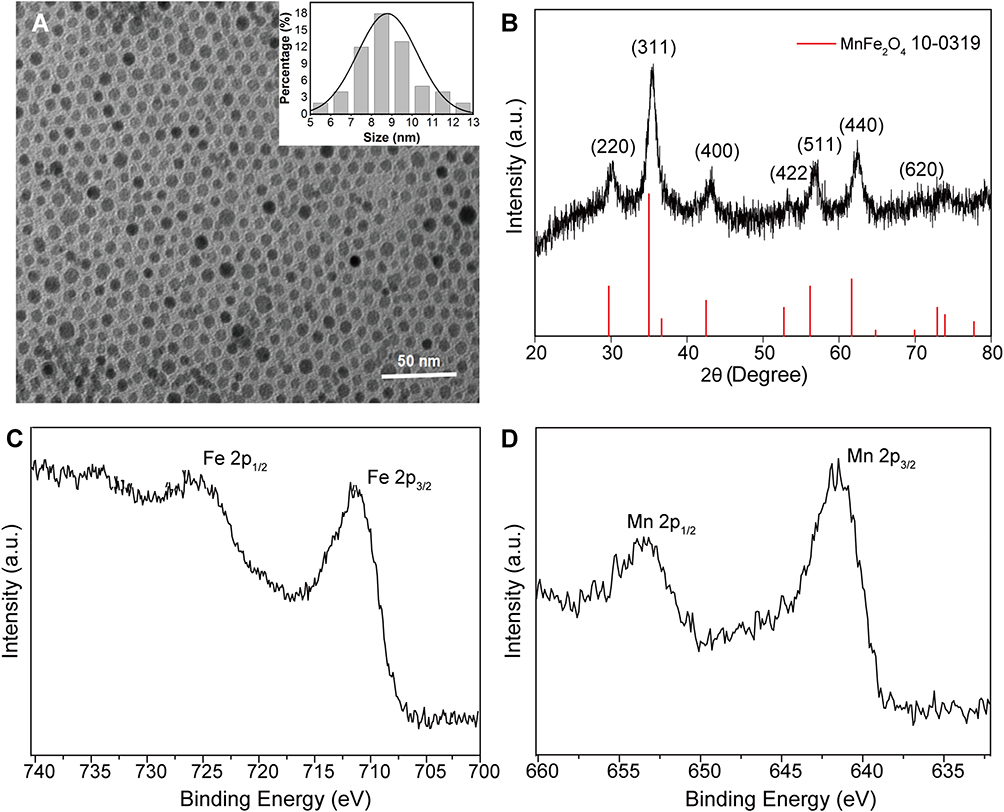 |
Figure 2 Characterization of Mn-IONPs. (A) TEM image and size distribution (inset) results and (B) X-ray diffraction patterns of Mn-IONPs. (C–D) High-resolution Fe 2p and Mn 2p XPS spectrum of Mn-IONPs. |
To evaluate the colloidal stability of Mn-IONPs, we measured the zeta potential and hydrodynamic size distribution. The Mn-IONPs dispersed in milli-Q water showed a zeta potential of −53.7±1.9 mV and hydrodynamic size of 10.3±1.6 nm. When the Mn-IONPs were dispersed in C-DMEM-H, both the zeta potential and hydrodynamic size were of great difference. As shown in Figure 3A and B, the Mn-IONPs showed a hydrodynamic size of 49.6±0.49 nm which was larger than that in milli-Q water and a zeta potential of −2.59±0.93 mV which was lower than that in milli-Q water in absolute value when resuspended in C-DMEM-H. Meanwhile, the C-DMEM-H without Mn-IONPs showed a zeta potential of −3.09±0.05 mV. With the increasing of suspending period in C-DMEM-H, the hydrodynamic size of Mn-IONPs showed slight increase from 49.6±0.49 nm (12 hours) to 54.6±0.33 nm (24 hours), 53.8±2.15 nm (48 hours) and 61.4±0.46 nm (72 hours), while its zeta potential was of negligible variation over the 72 hours’ duration. In addition, we measured the Fe and Mn ions contents of C-DMEM-H containing Mn-IONPs for different periods (1 day, 2 days, 3 days and 7 days) to determine their chemical stability. As shown in Figure S1, all C-DMEM-H had the similar Fe and Mn ions contents, which were of no significant difference compared with that of the fresh C-DMEM-H cell media containing no Mn-IONPs. After 1 day, 2 days, 3 days and 7 days’ suspending, the concentrations of Fe ion in C-DMEM-H were 0.99±0.12, 1.02±0.12, 1.04±0.19 and 1.04±0.18 mg/L. The corresponding Mn ion concentrations were 5.79±0.19, 5.8±0.36, 5.88±0.12 and 6.01±0.23 μg/L.
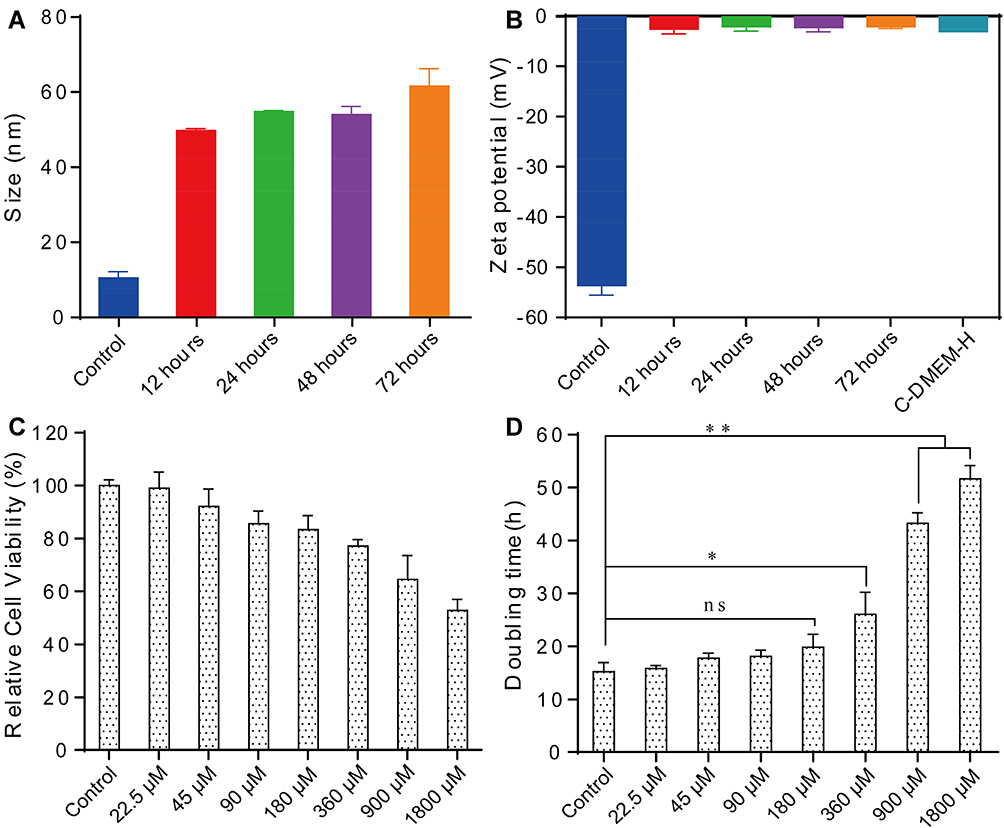 |
Figure 3 The stability and cytotoxic effect analysis of Mn-IONPs. (A) The hydrodynamic size of Mn-IONPs in C-DMEM-H for different periods (12 hours, 24 hours, 48 hours and 72 hours) based on dynamic light scattering. (B) Zeta potentials of Mn-IONPs in C-DMEM-H for different periods (12 hours, 24 hours, 48 hours and 72 hours). The control group in A and B is Mn-IONPs suspension in milli-Q water. (C) The relative cell viability of RAW264.7 cells treated with Mn-IONPs for 24 hours. (D) The doubling time of RAW264.7 cells treated with Mn-IONPs suspensions at selected concentrations. *p < 0.05; **p <0.01. |
Effect on Cell Proliferation
The cytotoxicity effect of Mn-IONPs on RAW264.7 cells was determined by the relative cell viability and the doubling time, which was drawn from the growth curves (Figure S2) generated according to the observed optical densities and exposure times in this study. After 24 hours’ treatment by Mn-IONPs, the RAW264.7 cells showed a decreased cell viability with the increased concentrations (Figure 3C). Although the relative cell viability of cells co-incubated with Mn-IONPs of 1800 μM was as low as 60%, the relative cell viability of cells co-incubated with Mn-IONPs within 360 μM were >80%. The doubling time of the treated cells indicated a similar cytotoxicity of Mn-IONPs. As shown in Figure 3D, the doubling time for treated RAW264.7 cells increased with the increasing of Mn-IONPs concentration. The doubling time of the negative control was found to be 15.2 hours. The RAW264.7 cells treated with low concentrations (Fe concentration <180 μM) of Mn-IONPs suspensions showed a similar doubling time to the negative control (p>0.05). However, the doubling time of the cells treated with the Mn-IONPs at higher concentrations (360 μM, 900 μM and 1800 μM) increased to 26.0 hours (p<0.05), 43.3 hours (p<0.01), and 51.6 hours (p<0.01), respectively, which were all significantly higher than control cells.
NPs Metabolism in RAW264.7 Cells
To analyze the metabolism of Mn-IONPs in RAW264.7 cells, we first evaluated the cellular uptake of Mn-IONPs by Prussian blue staining. The cells incubated with NPs suspensions of Fe concentrations below 360 μM for 24 hours were of good cell viability (Figure 4), thus they were used for the following labeling and metabolism analysis. As shown in Figure 4A–D, blue pigment can be clearly seen within all different concentrations’ Mn-IONPs treated cells. With increasing Fe concentrations, both the number of blue-stained cells and the intensity of pigment within the cells increased. Almost 100% RAW264.7 cells were color tagged when incubated with 360 μM Mn-IONPs. To further explore the cellular metabolism of Mn-IONPs, we stained all the P1-P7 RAW264.7 cells with Prussian blue solution and recorded their iron and manganese contents using ICP-OES measurements. As the passages continued, fewer blue granules appeared within the cells. All the P1 cells exhibited Prussian blue stained and the intensity of pigment within the cells was relatively high. However, few stained cells were visible for P5, and no blue-stained cells were found for P7 (Figure 4E–H). The latter presented the same cellular appearance as control cells.
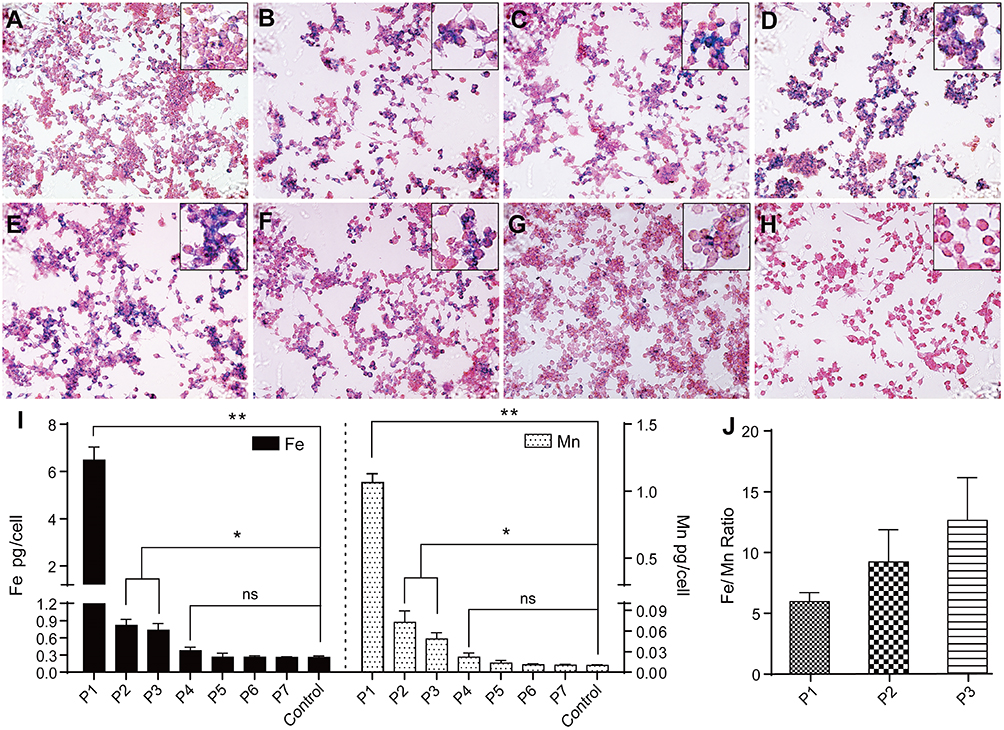 |
Figure 4 Prussian blue staining and ICP-OES measurement. (A–D) The prussian blue staining of cells incubated with 45, 90, 180 and 360 μM Mn-IONPs for 24 hours (×100). (E–H) The prussian blue staining of P1, P3, P5 and P7 cells (×100). Inset shows local enlarged image of panel (A–H). (I) Iron and manganese contents in control and P1-P7 cells detected by ICP-OES. (J) The molar ratio of Fe/Mn contents in the P1-P3 cells. *p < 0.05; **p <0.01; ns, not significant. |
The Fe concentration results from ICP-OES (Figure 4I) quantitatively confirmed the Prussian blue staining results. For untreated RAW264.7 cells, the iron and manganese contents were measured as 0.26 and 0.01 pg/cell, respectively. After 24 hours of co-incubation with 360 μM Mn-IONPs, the iron contents were 6.485, 0.816, 0.733, 0.376, 0.265, 0.264 and 0.261 pg/cell in P1-P7 cells, respectively. The corresponding manganese contents were 1.064, 0.072, 0.048, 0.022, 0.013, 0.011 and 0.010 pg/cell, showing a similar variation trend with intracellular iron contents in cell passage order. This trend also paralleled the results of Prussian blue staining. Compared with P1, there was a sudden decrease both in iron and manganese contents in RAW264.7 cells for P2. Although the cells of P2 and P3 were of comparable iron and manganese contents, they were both statistically higher than that of Fe and Mn contents in control cells. From P5 on, the iron and manganese contents within all the sub-generation cells were of no statistical difference compared with control cells (Figure 4I). Although both the intracellular Fe and Mn contents decreased with the passages on, the decrease rate of Mn is greater than that of Fe. As a result, the molar ratio of Fe/Mn within cells increased continuously from P1 to P3 (5.9, 9.0 and 12.4, respectively) (Figure 4J). For P4 cells, the decline of Fe slowed down due to the intracellular Fe content was much lower than that of P1. Moreover, because the similar contents of both the iron and manganese with control cells, the decrease rate of Mn was similar to that of Fe from P5 on.
The TEM and HRTEM were also used for exploring the Mn-IONPs metabolism in RAW264.7 cells and the related mechanism visually. As shown in Figure 5A, the internalized NPs in P1 cells were sequestered within some vacuoles which located in the perinuclear region. After transferred to the daughter cells, Mn-IONPs still located within the vesicles surrounding the nucleus (Figure 5B). However, the number of vacuoles in each cells and NPs in each vacuole for P2 cells were much lower compared with P1 cells. The size of Mn-IONPs within P1 and P2 cells were calculated based on the TEM images. The results showed that the average diameter of Mn-IONPs decreased from 8.6 nm (original Mn-IONPs) to 7.55 nm (Mn-IONPs in P1 cells) and 6.48 nm (Mn-IONPs in P2 cells) gradually (Figure 5A, B, F and G), suggesting that the Mn-IONPs kept being degraded within RAW 264.7 cells. However, the HRTEM images indicated that Mn-IONPs in P1 and P2 cells had the same lattice fringe pattern (Figure 5C and D) with pristine Mn-IONPs (Figure 5E), and the measured interplanar distance of 2.56Å was equivalent to the (311) lattice plane of MnFe2O4, indicating that the Mn-IONPs within RAW 264.7 cells can keep the same crystallinity for a relative long period. At the mean time, we collected the culture medium which have nourished P1 cells for 48 hours for further analysis. There a lot of Mn-IONPs were found in the medium, which indicated that some Mn-IONPs internalized in cells can be excreted out as intact NPs (Figure S3). Compared with the original Mn-IONPs, the Mn-IONPs excreted were of smaller size (ca. 5.18 nm), wider size distribution and more irregular shape, suggesting the degradation of Mn-IONPs within RAW 264.7 cells indirectly. The ICP-MS results showed that the cell medium also contained a lot of Fe and Mn ions in addition to Mn-IONPs because both the Fe and Mn ions contents were much higher than that of fresh cell medium, verifying the excretion of Fe and Mn ions from RAW264.7 cells.
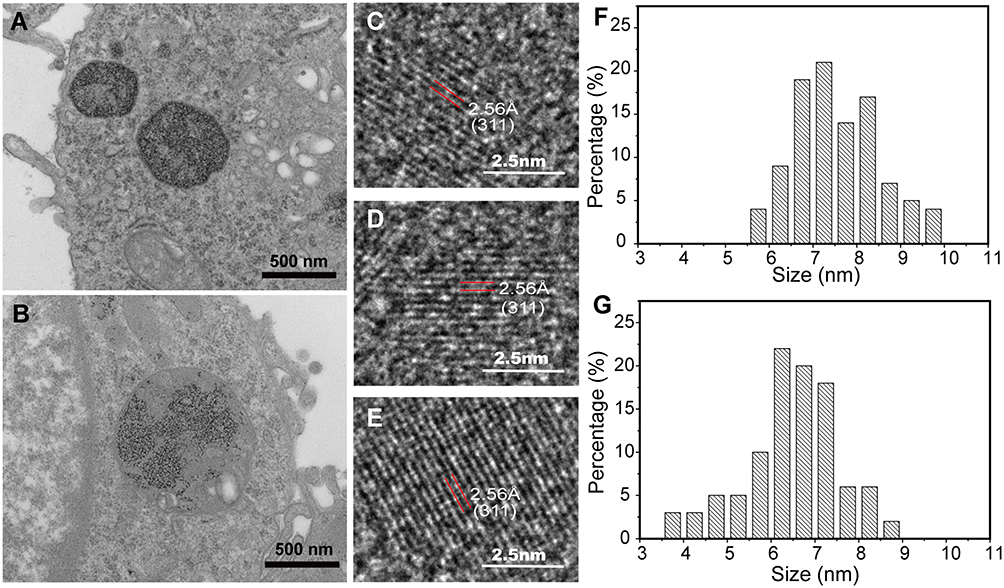 |
Figure 5 (A–B) TEM images of Mn-IONPs in P1 and P2 cells. (C–D) HRTEM images of Mn-IONPs in P1 and P2 cells. (E) HRTEM images of the pristine Mn-IONPs. (F–G) Size distribution of Mn-IONPs in P1 and P2 cells. |
Gene Expression Analysis
After mRNA extraction, the mRNA levels of metal-homeostasis-related genes in Mn-IONPs treated RAW264.7 cells were quantified by qRT-PCR assay. As shown in Figure 6A–G, all the metal-homeostasis-related genes’ mRNA expressions were influenced by Mn-IONPs in a concentration- and time-dependent manner. After treatment with the Mn-IONPs suspensions with series of concentrations (0, 45, 90, 180, 360, 900 and 1800 μM), the mRNA levels of ZIP14 and DMT1, which were reported to be functionally involved in iron and manganese uptake, were suppressed within 24 hours in a concentration-dependent manner. This manifested as a decrease in the expression of ZIP14 and DMT1 with increasing NPs concentration (Figure 6A and B). Compared with ZIP14, DMT1 expression was more down-regulated for any given concentration of Mn-IONPs. After removing the medium containing NPs, both the mRNA levels of ZIP14 and DMT1 became up-regulated in a dose-dependent increasing manner at 48 hours. When the incubation period was extended to 72 hours, the expression of ZIP14 and DMT1 both showed a reduction in expression compared with the 48 hours’ levels. All the cells treated with different concentrations of NPs showed the same ZIP14 mRNA level that was not significantly different from control cells. However, the DMT1 mRNA expression continued to be down-regulated in a concentration-dependent manner, manifesting mRNA levels that dropped gradually with increasing NPs concentrations, and they were all lower than that of the control group (Figure 6A and B).
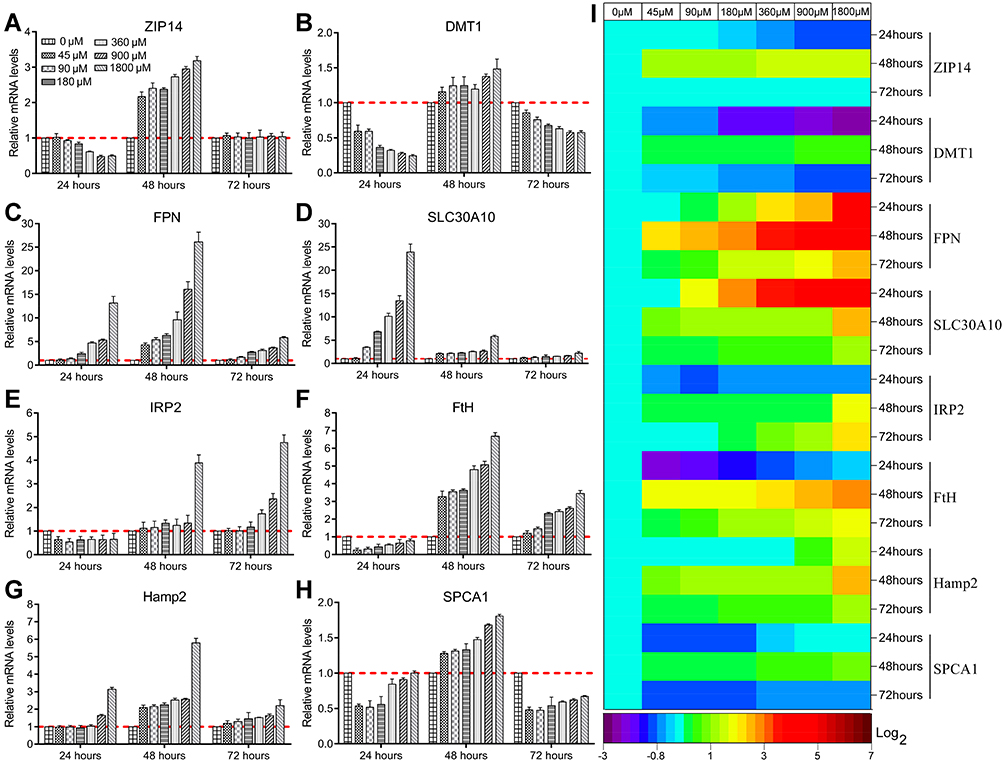 |
Figure 6 Metal-homeostasis-related genes (ZIP14 (A), DMT1 (B), FPN (C), SLC30A10 (D), IRP2 (E), FtH (F), Hamp2 (G), and SPCA1 (H)) expression of RAW264.7 cells challenged with Mn-IONPs with different concentrations (0, 45, 90, 180, 360, 900 and 1800 μM) for varied time period (24 hours, 48 hours and 72 hours). The mRNA levels in the control cells (incubated with 0 μM Mn-IONPs) were indicated with red dotted lines. (I) Heat map shows relative changes in all measured mRNA expression with respect to that before the Mn-IONPs challenge. |
FPN and SLC30A10 have been reported as two of the most important membrane proteins that transport metal ions out from cytoplasm.25,38 To investigate the metabolic fate of Mn-IONPs in cells further, we analyzed the mRNA levels of FPN and SLC30A10 in the labeled cells. Both FPN and SLC30A10 were overexpressed in the first 24 hours (Figure 6C and D). With increasing NPs exposure, greater expression of FPN and SLC30A10 mRNA was detected. And SLC30A10 exhibited a higher expression level than FPN at the same Mn-IONPs exposure. After culture for another 24 hours, the expression levels of FPN and SLC30A10 split from each other. FPN continued to be up-regulated and reached a higher level in a dose-dependent manner. SLC30A10, on the other hand, returned toward the normal control level, but still exhibited higher expression than that of control cells. The opposite variation of mRNA also made the mRNA of FPN reach a higher level than that of SLC30A10 for the same exposure to Mn-IONPs (at 48 hours after initial exposure). After extending the culture another 48 hours (to 72 hours after the original introduction of Mn-IONPs), the expression of FPN and SLC30A10 appeared to asymptotically descend toward normal levels, although both genes remained greater than their respective control groups. Compared with SLC30A10, FPN remained at a relative higher expression level for every exposure concentration (Figure 6C and D).
The cellular metabolic fate of NPs is also affected by intracellular physiological activities, such as those regulated by IRP2, FtH, Hamp2, and SPCA1. As shown in Figure 6E, IRP2, which is a key regulator of vertebrate iron metabolism, was initially down-regulated by the exposure to Mn-IONPs to a similar extent in all the treated cells, regardless of the magnitude of the challenge. However, the expression of IRP2 was stimulated to higher levels after removal of the NPs. With increasing exposure to Mn-IONPs, greater yields of IRP2 mRNA were produced. In particular, all the labeled cells showed a higher level of IRP2 mRNA at 72 hours compared with 48 hours. Similar to IRP2, the expression of both FtH and SPCA1 was suppressed within the first 24 hours. However, suppression relaxed and expression increased in cells that cultured for another 24 hours after removing the NPs. All cells showed a higher expression of FtH and SPCA1 than the control groups (Figure 6F and H). After another 48 hours of incubation after removing the NPs, both the FtH and SPCA1 became down-regulated. Compared with the control group, all the treated cells showed higher mRNA levels of FtH and lower mRNA levels of SPCA1 (Figure 6F and H).
As the master regulator of iron homeostasis, the mRNA expression level of Hamp2 was elevated at 24 hours when cells were exposed to a high concentration of NPs (>900 μM). After removing NPs, the Hamp2 expression of every group cells remained up-regulated in the following 24 hours in a concentration-dependent manner and then returned to more closer to normal levels by 72 hours, although it continued to manifest a slightly higher expression level than the control cells (Figure 6G).
Figure 6I shows the heat map of all detected mRNA expression levels in this study. FPN, SLC30A10, and FtH were greatly influenced by exposure to Mn-IONPs. Most mRNA expression levels reached their peak value within 48 hours and exhibited a magnitude of expression change that scaled with the concentration of Mn-IONPs.
Discussion
Because of the impressive T1/T2 relaxivity, Mn-IONPs have been widely studied and regarded as potential CAs to improve the sensitivity and specificity of molecular MRI.36,39,40 In addition, benefiting from the nano scale, Mn-IONPs can be easily engineered and functionalized, making them capable and dispersible agents for drug delivery and hyperthermia therapy.41,42 Even though Mn-IONPs have been studied in biomedicine for several years, there is a poor understanding of the nano-bio interaction of Mn-IONPs at the cellular levels. Although Mn-IONPs is an analogue to SPIO, they may exhibit totally different cytotoxicity because of the increased number of structural defects and released Mn2+ originating from Mn doping. In addition, it has been found that the metal oxide nanoparticles induce cytotoxic effects mainly by direct and indirect interactions between cells and the engulfed NPs. ROS generation and oxidative stress have become the best-developed paradigm to explain the nanotoxicity.27,43,44 However, studies have recently emerged that found no statistical difference in the ROS generation between the control cells and NPs-induced apoptotic cells.45,46 In addition, the metal ions released by dissolution from the inorganic NPs can react with organelles to influence enzyme activities and intracellular equilibria. These may fully or partially account for the inorganic NPs-related toxicity.47 Therefore, we evaluated the metabolism and removal of Mn-IONPs, and further explored the mRNA expression of related genes in RAW264.7 cells in an attempt to provide new perspectives for the related cytotoxicity of inorganic NPs.
After synthesis, the obtained NPs were comprehensively characterized and determined to be the expected composition with a diameter of 8.6 ± 1.4 nm and a Fe/Mn molar ratio of 2.8. As the stability of Mn-IONPs in simulated conditions was crucial for studying the metabolism, we evaluated the colloidal stability of Mn-IONPs in C-DEMEM-H by measuring the zeta potential and hydrodynamic size. After resuspended in C-DMEM-H for 12 hours, the Mn-IONPs showed a hydrodynamic size of 49.6 nm which was larger than that in milli-Q water. Meanwhile, the NPs showed a zeta potential of −2.59 mV, which was lower than that in milli-Q water in absolute value but close to that of C-DMEM-H, seemingly indicating a compromised colloidal stability. However, when we measured the zeta potential and hydrodynamic size within a relative long time period, an interesting result emerged. Both the hydrodynamic size and zeta potential of Mn-IONPs suspended in cell medium for 72 hours showed negligible variation compared with that at 12 hours, indicating that the NPs were of enough colloidal stability in cell medium. This phenomenon may result from the formation of a protein corona on the surface of Mn-IONPs. It is known that most inorganic NPs will interact with blood plasma proteins and are immediately coated with a protein corona because of the opsonization.23,32 The attached protein corona usually results in a larger size. In addition, the NPs’ zeta potential will be shielded by the protein shell, making the measured zeta potential originating from the plasma proteins rather than nanoparticles. The similar zeta potential of the C-DMEM-H containing NPs and that without any NPs confirmed the hypothesis. In addition, the similar Fe and Mn ions contents of C-DMEM-H containing Mn-IONPs for different periods (1 day, 2 days, 3 days and 7 days) revealed that the Mn-IONPs were chemical stable in cell medium (Figure S1).
Consistent with previous studies, Mn-IONPs showed a dose- and time-dependent cytotoxicity.16 Although low dose challenges of Mn-IONPs produced acceptable cytotoxicity levels, the viability of treated cells decreased dramatically after incubation with medium containing high concentration NPs for extended time periods. The doubling time of Mn-IONPs treated cells increased significantly at concentrations >360 μM, but the number of living cells increased nevertheless, indicating that the proliferation of Mn-IONPs treated cells were slowed down rather than blocked.
To further explore the cytotoxicity mechanism, we analyzed the metabolic breakdown of Mn-IONPs in RAW264.7 cells. Uptake is the first step of the nano-bio interaction. Prussian blue staining showed that the internalization of Mn-IONPs by RAW264.7 cells was dependent on particle concentration. Both the percentage of NPs-labeled RAW264.7 cells and the NPs uptake by every cell increased with increasing particle concentration. When the cells passed their contents to daughter cells, the labeling rate varied with passage. Compared with P1 cells, P2 showed a slightly lower labeling rate (86%). For the succeeding passages, the labeling rates were approximately 83%, 75% and 60% for P3, P4 and P5, respectively. These were all less than their parent cells, but higher than half the value of the parent cells. The results of ICP-OES confirmed that quantitatively. The Fe contents of P2, P3, P4, P5, P6 and P7 decreased by 87%, 10%, 49%, 30%, 1% and 1% compared with parent cells, respectively. Mn contents of P2, P3, P4, P5, P6 and P7 decreased by 93%, 33%, 55%, 39%, 8% and 6%, respectively. Both Fe and Mn decreased sharply for P2, while relatively gently for P3-P7. Theoretically, the Fe and Mn contents within cells change depending on the balance of uptake and excretion. The cellular content increases when uptake is dominant and decreases when excretion prevails. The abrupt decrease of Fe and Mn contents in P2 cells indicates that Fe and Mn excretion dominates in P2 cells. From P3 cells on, the intracellular Fe and Mn contents continued to decrease. However, the contents are greater than half of the parent cells, suggesting that the uptake of these cells prevails over excretion.
Compared with the parent cells, the decrease rate of Mn is greater than that of Fe for each generation of daughter cells. In addition, the molar ratio of Fe/Mn within cells increases continuously from P1 to P3 (5.9, 9.0 and 12.4, respectively), which are all greater than that of the original composition of Mn-IONPs (Fe: Mn = 2.8). Some explanations may rationalize this phenomenon. Upon their engulfment by macrophages, NPs usually experience two different biological processes. Some NPs are expelled from the cells by functional NP exocytosis, while others decompose inside lysosomes and release soluble metal ions that may be recycled for cellular activities or eliminated through the ion channels on the cell membrane.23,48 If NPs are eliminated as intact particles, the molar ratio of Fe/Mn in cells should reasonably fall close to 2.8. However, when a large proportion of NPs decompose within cells and transfer out through ion channels, the molar ratios may vary. At the early stage of NPs challenge, many NPs are engulfed by cells within a short time period and a considerable number are eliminated as intact NPs, which have been verified by TEM and HRTEM in the present study (Figure S3). This process appears to prevent the cell from entering apoptosis. In addition, the decomposition of NPs within the lysosomes is a time-consuming procedure (Figure 5), and there are few metal ions released within the first 24 hours. Therefore, the intact particle elimination process dominates the activity of P1 cells and the Fe/Mn molar ratio is slightly greater than the original ratio (5.9 vs 2.8). From P2 onward, the Fe/Mn molar ratio within cells increased sharply, which indicated that the intact NPs excretion diminishes and most of the engulfed NPs were decomposed. The increased Fe/Mn molar ratio also revealed that the efflux of Mn ions was more facile than Fe ions. This is reasonable because the greater iron mass could be retained for intracellular homeostasis and physiological activities. In addition, there is a special protein for Fe ion storage. Much less ionic Mn is needed for cell metabolism and no known protein or organelle exclusively stores Mn ions.
Many proteins have been reported to be involved in the metabolic conversion and removal of inorganic NPs (Figure 7).25,38 To clarify the role of Mn-IONPs conversion mechanisms, we quantitatively analyzed the gene expression of the transporters associated with metal removal by qRT-PCR. As shown in Figure 6, the mRNA level of associated proteins varied depending on their particular function. ZIP14 is a complex, broad-scope, metal-ion transporter that mediates non-transferrin-bound iron and manganese uptake into cells.49,50 DMT1 mediates H+-coupled Fe2+ and Mn2+ transport from the extracellular space to cytoplasm.49,51 FPN and SLC30A10 were identified as metal ions secretion proteins because they are known to transport Fe and Mn ions out of cells to maintain intracellular homeostasis and detoxification.52,53 IRP2 protein usually binds to the 5′-end of Iron Response Element (IRE) mRNA to reduce FPN and FtH translation, or to the 3′-terminus to enhance DMT1 translation.54 FtH is a marker of iron storage that keeps free iron ions balance in the cytoplasm. It can also mediate the uptake of iron from extracellular sources.38 Hamp2 binds to FPN and reduces its function to restrain cellular Fe2+ and Mn2+ efflux and thus maintains homeostasis of the extracellular ionic environment.55 SPCA1 is a Ca2+ dependent-ATPase that pumps cytoplasmic Mn2+ into the Golgi apparatus for secretion.56 Therefore, ZIP14, DMT1, and IRP2 promote Mn2+ and Fe2+ influx into cytoplasm, while FPN, SLC30A10 and Hamp2 are mainly functional in Mn2+ and Fe2+ efflux. It is known that SPCA1 is specific for manganese transport and FtH is primarily responsible for iron ion transport, respectively. Within the first 24 hours after their introduction, many Mn-IONPs were engulfed by RAW264.7 cells and then digested to their base metal ions in lysosomes. This resulted in an intracellular Fe and Mn ion storm. To maintain intracellular homeostasis and avoid activating apoptosis pathways, the proteins related to ion influx, including ZIP14, DMT1, IRP2 and FtH, were down-regulated. At the same time, proteins associated with efflux, such as FPN and SLC30A10, were overexpressed. At the 48th hours following NPs challenge, the majority of cells had passed to the 2–3 sub-generation based on the results of doubling time. Compared with the parent cells, P2 cells (at 72 hours after initial exposure) were observed to possess much lower Fe and Mn content, but greater than half of the parent cells. This finding suggests that cells started to re-uptake ions which were excreted by P1 cells during 24–72 hours (Figure S3), making it reasonable of the simultaneous overexpression of ZIP14, DMT1, FPN, SLC30A10, IRP2, FtH, Hamp2 and SPCA1 at 48 hours.
 |
Figure 7 Schematic illustration of the mechanism of uptake, excretion processes and intracellular trafficking of iron and manganese ions. |
Conclusion
In this study, we successfully synthesized Mn-IONPs with spheroidal appearance and good monodispersity. We evaluated the cytotoxicity of the prepared Mn-IONPs and their metabolic conversion and removal from RAW264.7 cells. The Mn-IONPs showed time- and concentration-dependent cytotoxic effects on RAW264.7 cells. Accompanied with the intracellular catabolic breakdown and exocytosis, the intracellular NPs could be transferred to daughter cells. In addition, RAW264.7 cells also secreted and re-uptook Mn-IONPs, manganese and iron ions to maintain intracellular homeostasis in the succeeding passages. For P7 cells, intracellular NPs were completely eliminated and metal ion concentrations were restored to normal levels. And most importantly, the intracellular Mn-IONPs and released metal ions can affect the mRNA expression of ZIP14, DMT1, FPN, SLC30A10, IRP2, FtH, Hamp2 and SPCA1 in RAW264.7 cells.
Acknowledgments
The work was supported by the Miaopu Foundation of Army Medical University (No. 2019R059), Natural Science Foundation of Chongqing (cstc2018jcyjAX0321, No. cstc2017jcyjBX0038, and cstc2019jcyj-msxmX0323), National Natural Science Foundation of China (No. 81471635) and Army Medical University Foundation for Introducing Talents (Y.L.).
Disclosure
The authors report no conflicts of interest in this work.
References
1. Zhao S, Yu X, Qian Y, Chen W, Shen J. Multifunctional magnetic iron oxide nanoparticles: an advanced platform for cancer theranostics. Theranostics. 2020;10(14):6278–6309. doi:10.7150/thno.42564
2. Suciu M, Ionescu CM, Ciorita A, et al. Applications of superparamagnetic iron oxide nanoparticles in drug and therapeutic delivery, and biotechnological advancements. Beilstein J Nanotechnol. 2020;11:1092–1109. doi:10.3762/bjnano.11.94
3. Jeon M, Halbert MV, Stephen ZR, Zhang M. Iron oxide nanoparticles as T1 contrast agents for magnetic resonance imaging: fundamentals, challenges, applications, and prospectives. Adv Mater. 2020;1906539. doi:10.1002/adma.201906539
4. Dadfar SM, Roemhild K, Drude NI, et al. Iron oxide nanoparticles: diagnostic, therapeutic and theranostic applications. Adv Drug Deliv Rev. 2019;138:302–325. doi:10.1016/j.addr.2019.01.005
5. Nikolova MP, Chavali MS. Metal oxide nanoparticles as biomedical materials. Biomimetics. 2020;5(2):27. doi:10.3390/biomimetics5020027
6. Du Y, Lai PT, Leung CH, Pong PW. Design of superparamagnetic nanoparticles for magnetic particle imaging (MPI). Int J Mol Sci. 2013;14(9):18682–18710. doi:10.3390/ijms140918682
7. Goodarz Naseri M, Ara MHM, Saion EB, Shaari AH. Superparamagnetic magnesium ferrite nanoparticles fabricated by a simple, thermal-treatment method. J Magn Magn Mater. 2014;350:141–147. doi:10.1016/j.jmmm.2013.08.032
8. Irshad R, Tahir K, Li B, Ahmad A, Nazir ARS. Antibacterial activity of biochemically capped iron oxide nanoparticles: a view towards green chemistry. J Photochem Photobiol B. 2017;170:241–246. doi:10.1016/j.jphotobiol.2017.04.020
9. Peng YK, Tsang SCE, Chou PT. Chemical design of nanoprobes for T1-weighted magnetic resonance imaging. Mater Today. 2016;19(6):336–348. doi:10.1016/j.mattod.2015.11.006
10. Liu XL, Wang YT, Ng CT, et al. Coating engineering of MnFe2O4 nanoparticles with superhigh T2 relaxivity and efficient cellular uptake for highly sensitive magnetic resonance imaging. Adv Mater Interfaces. 2014;1(2):1300069. doi:10.1002/admi.201300069
11. Xu Y, Wu C, Zhu W, et al. Superparamagnetic MRI probes for in vivo tracking of dendritic cell migration with a clinical 3 T scanner. Biomaterials. 2015;58:63–71. doi:10.1016/j.biomaterials.2015.04.016
12. Na HB, Song IC, Hyeon T. Inorganic nanoparticles for MRI contrast agents. Adv Mater. 2009;21(21):2133–2148. doi:10.1002/adma.200802366
13. Xiao S, Yu X, Zhang L, et al. Synthesis of PEG-coated, ultrasmall, manganese-doped iron oxide nanoparticles with high relaxivity for T1/T2 dual-contrast magnetic resonance imaging. Int J Nanomed. 2019;14:8499–8507. doi:10.2147/ijn.s219749
14. Botta M, Carniato F, Esteban-Gómez D, Platas-Iglesias C, Tei L. Mn(II) compounds as an alternative to Gd-based MRI probes. Future Med Chem. 2019;11(12):1461–1483. doi:10.4155/fmc-2018-0608
15. Ni D, Bu W, Ehlerding EB, Cai W, Shi J. Engineering of inorganic nanoparticles as magnetic resonance imaging contrast agents. Chem Soc Rev. 2017;46(23):7438–7468. doi:10.1039/c7cs00316a
16. Miao Y, Xie Q, Zhang H, et al. Composition-tunable ultrasmall manganese ferrite nanoparticles: insights into their in vivo T1 contrast efficacy. Theranostics. 2019;9(6):1764–1776. doi:10.7150/thno.31233
17. Yang L, Ma L, Xin J, et al. Composition tunable manganese ferrite nanoparticles for optimized T2 contrast ability. Chem Mater. 2017;29(7):3038–3047. doi:10.1021/acs.chemmater.7b00035
18. Pan D, Schmieder AH, Wickline SA, Lanza GM. Manganese-based MRI contrast agents: past, present, and future. Tetrahedron. 2011;67(44):8431–8444. doi:10.1016/j.tet.2011.07.076
19. Tahir K, Nazir S, Li B, et al. Nerium oleander leaves extract mediated synthesis of gold nanoparticles and its antioxidant activity. Mater Lett. 2015;156:198–201. doi:10.1016/j.matlet.2015.05.062
20. Tahir K, Li B, Khan S, et al. Enhanced chemocatalytic reduction of aromatic nitro compounds by biosynthesized gold nanoparticles. J Alloys Compd. 2015;651:322–327. doi:10.1016/j.jallcom.2015.08.109
21. Chen Y, Li J, Yuan Z, Feng J, Chen Z. Metabolic fate and subchronic biological effects of core–shell structured Fe3O4@SiO2-NH2 nanoparticles. Nanotoxicology. 2018;12(6):621–636. doi:10.1080/17435390.2018.1471537
22. Patil RM, Thorat ND, Shete PB, et al. Comprehensive cytotoxicity studies of superparamagnetic iron oxide nanoparticles. Biochem Biophys Rep. 2018;13:63–72. doi:10.1016/j.bbrep.2017.12.002
23. Arami H, Khandhar A, Liggitt D, Krishnan KM. In vivo delivery, pharmacokinetics, biodistribution and toxicity of iron oxide nanoparticles. Chem Soc Rev. 2015;44(23):8576–8607. doi:10.1039/c5cs00541h
24. Harischandra DS, Ghaisas S, Zenitsky G, et al. Manganese-induced neurotoxicity: new insights into the triad of protein misfolding, mitochondrial impairment, and neuroinflammation. Front Neurosci. 2019;13:654. doi:10.3389/fnins.2019.00654
25. Chen P, Chakraborty S, Mukhopadhyay S, et al. Manganese homeostasis in the nervous system. J Neurochem. 2015;134(4):601–610. doi:10.1111/jnc.13170
26. Sarkar A, Ghosh M, Sil PC. Nanotoxicity: oxidative stress mediated toxicity of metal and metal oxide nanoparticles. J Nanosci Nanotechnol. 2014;14(1):730–743. doi:10.1166/jnn.2014.8752
27. Paunovic J, Vucevic D, Radosavljevic T, Mandić-Rajčević S, Pantic I. Iron-based nanoparticles and their potential toxicity: focus on oxidative stress and apoptosis. Chem Biol Interact. 2020;316:108935. doi:10.1016/j.cbi.2019.108935
28. Rharass T, Gbankoto A, Canal C, et al. Oxidative stress does not play a primary role in the toxicity induced with clinical doses of doxorubicin in myocardial H9c2 cells. Mol Cell Biochem. 2016;413(1–2):199–215. doi:10.1007/s11010-016-2653-x
29. Versieren L, Evers S, AbdElgawad H, Asard H, Smolders E. Mixture toxicity of copper, cadmium, and zinc to barley seedlings is not explained by antioxidant and oxidative stress biomarkers. Environ Toxicol Chem. 2017;36(1):220–230. doi:10.1002/etc.3529
30. Frtús A, Smolková B, Uzhytchak M, et al. Analyzing the mechanisms of iron oxide nanoparticles interactions with cells: a road from failure to success in clinical applications. J Control Release. 2020;328:59–77. doi:10.1016/j.jconrel.2020.08.036
31. Choi SJ, Oh JM, Park T, Choy JH. Cellular toxicity of inorganic hydroxide nanoparticles. J Nanosci Nanotechnol. 2007;7(11):4017–4020. doi:10.1166/jnn.2007.085
32. Aggarwal P, Hall JB, McLeland CB, Dobrovolskaia MA, McNeil SE. Nanoparticle interaction with plasma proteins as it relates to particle biodistribution, biocompatibility and therapeutic efficacy. Adv Drug Deliv Rev. 2009;61(6):428–437. doi:10.1016/j.addr.2009.03.009
33. Sant S, Poulin S, Hildgen P. Effect of polymer architecture on surface properties, plasma protein adsorption, and cellular interactions of pegylated nanoparticles. J Biomed Mater Res A. 2008;87(4):885–895. doi:10.1002/jbm.a.31800
34. He B, Shi Y, Liang Y, et al. Single-walled carbon-nanohorns improve biocompatibility over nanotubes by triggering less protein-initiated pyroptosis and apoptosis in macrophages. Nat Commun. 2018;9(1):2393. doi:10.1038/s41467-018-04700-z
35. Sun S, Zeng H, Robinson DB, et al. Monodisperse MFe2O4 (M = Fe, Co, Mn) nanoparticles. J Am Chem Soc. 2004;126(1):273–279. doi:10.1021/ja0380852
36. Gong M, Yang H, Zhang S, et al. Targeting T1 and T2 dual modality enhanced magnetic resonance imaging of tumor vascular endothelial cells based on peptides-conjugated manganese ferrite nanomicelles. Int J Nanomed. 2016;11:4051–4063. doi:10.2147/ijn.s104686
37. Korzynska A, Zychowicz M. A method of estimation of the cell doubling time on basis of the cell culture monitoring data. Biocybern Biomed Eng. 2008;28:75–82.
38. Pantopoulos K, Porwal SK, Tartakoff A, Devireddy L. Mechanisms of mammalian iron homeostasis. Biochemistry. 2012;51(29):5705–5724. doi:10.1021/bi300752r
39. Li Y, Zhao X, Liu X, et al. A bioinspired nanoprobe with multilevel responsive T1-weighted MR signal-amplification illuminates ultrasmall metastases. Adv Mater. 2020;32(4):e1906799. doi:10.1002/adma.201906799
40. Zhang H, Li L, Liu XL, et al. Ultrasmall ferrite nanoparticles synthesized via dynamic simultaneous thermal decomposition for high-performance and multifunctional T1 magnetic resonance imaging contrast agent. ACS Nano. 2017;11(4):3614–3631. doi:10.1021/acsnano.6b07684
41. Veloso SRS, Magalhaes CAB, Rodrigues ARO, et al. Novel dehydropeptide-based magnetogels containing manganese ferrite nanoparticles as antitumor drug nanocarriers. Phys Chem Chem Phys. 2019;21(20):10377–10390. doi:10.1039/c9cp00352e
42. Sahoo B, Devi KS, Dutta S, Maiti TK, Pramanik P, Dhara D. Biocompatible mesoporous silica-coated superparamagnetic manganese ferrite nanoparticles for targeted drug delivery and MR imaging applications. J Colloid Interface Sci. 2014;431:31–41. doi:10.1016/j.jcis.2014.06.003
43. Sampaio AF, Silva M, Dornas WC, et al. Iron toxicity mediated by oxidative stress enhances tissue damage in an animal model of diabetes. Biometals. 2014;27(2):349–361. doi:10.1007/s10534-014-9717-8
44. Tahir K, Ahmad A, Li B, et al. Preparation, characterization and an efficient photocatalytic activity of Au/TiO2 nanocomposite prepared by green deposition method. Mater Lett. 2016;178:56–59. doi:10.1016/j.matlet.2016.04.176
45. Bellanger X, Schneider R, Dezanet C, et al. Zn2+ leakage and photo-induced reactive oxidative species do not explain the full toxicity of ZnO core Quantum Dots. J Hazard Mater. 2020;396:122616. doi:10.1016/j.jhazmat.2020.122616
46. Vergauwen L, Hagenaars A, Blust R, Knapen D. Temperature dependence of long-term cadmium toxicity in the zebrafish is not explained by liver oxidative stress: evidence from transcript expression to physiology. Aquat Toxicol. 2013;126:52–62. doi:10.1016/j.aquatox.2012.10.004
47. Soenen S, Rivera Gil P, Montenegro JM, Parak W, De Smedt S, Braeckmans K. Cellular toxicity of inorganic nanoparticles: common aspects and guidelines for improved nanotoxicity evaluation. Nano Today. 2011;6:446–465. doi:10.1016/j.nantod.2011.08.001
48. Foroozandeh P, Aziz AA. Insight into Cellular Uptake and Intracellular Trafficking of Nanoparticles. Nanoscale Res Lett. 2018;13(1):339. doi:10.1186/s11671-018-2728-6
49. Ji C, Kosman DJ. Molecular mechanisms of non-transferrin-bound and transferring-bound iron uptake in primary hippocampal neurons. J Neurochem. 2015;133(5):668–683. doi:10.1111/jnc.13040
50. Winslow JWW, Limesand KH, Zhao N. The Functions of ZIP8, ZIP14, and ZnT10 in the Regulation of Systemic Manganese Homeostasis. Int J Mol Sci. 2020;21(9):3304. doi:10.3390/ijms21093304
51. Wolff NA, Garrick MD, Zhao L, Garrick LM, Ghio AJ, Thévenod F. A role for divalent metal transporter (DMT1) in mitochondrial uptake of iron and manganese. Sci Rep. 2018;8(1):211. doi:10.1038/s41598-017-18584-4
52. Madejczyk MS, Ballatori N. The iron transporter ferroportin can also function as a manganese exporter. Biochim Biophys Acta. 2012;1818(3):651–657. doi:10.1016/j.bbamem.2011.12.002
53. Mercadante CJ, Prajapati M, Conboy HL, et al. Manganese transporter Slc30a10 controls physiological manganese excretion and toxicity. J Clin Invest. 2019;129(12):5442–5461. doi:10.1172/jci129710
54. Wallander ML, Leibold EA, Eisenstein RS. Molecular control of vertebrate iron homeostasis by iron regulatory proteins. Biochim Biophys Acta. 2006;1763(7):668–689. doi:10.1016/j.bbamcr.2006.05.004
55. Nemeth E, Ganz T. Regulation of iron metabolism by hepcidin. Annu Rev Nutr. 2006;26:323–342. doi:10.1146/annurev.nutr.26.061505.111303
56. Chen J, Smaardijk S, Mattelaer CA, et al. An N-terminal Ca2+-binding motif regulates the secretory pathway Ca2+/Mn2+-transport ATPase SPCA1. J Biol Chem. 2019;294(19):7878–7891. doi:10.1074/jbc.RA118.006250
 © 2021 The Author(s). This work is published and licensed by Dove Medical Press Limited. The full terms of this license are available at https://www.dovepress.com/terms.php and incorporate the Creative Commons Attribution - Non Commercial (unported, v3.0) License.
By accessing the work you hereby accept the Terms. Non-commercial uses of the work are permitted without any further permission from Dove Medical Press Limited, provided the work is properly attributed. For permission for commercial use of this work, please see paragraphs 4.2 and 5 of our Terms.
© 2021 The Author(s). This work is published and licensed by Dove Medical Press Limited. The full terms of this license are available at https://www.dovepress.com/terms.php and incorporate the Creative Commons Attribution - Non Commercial (unported, v3.0) License.
By accessing the work you hereby accept the Terms. Non-commercial uses of the work are permitted without any further permission from Dove Medical Press Limited, provided the work is properly attributed. For permission for commercial use of this work, please see paragraphs 4.2 and 5 of our Terms.