")
Back to Journals » International Journal of Nanomedicine » Volume 9 » Issue 1
Mesenchymal stromal cell labeling by new uncoated superparamagnetic maghemite nanoparticles in comparison with commercial Resovist – an initial in vitro study
Authors Skopalik J, Polakova K, Havrdova M, Justan I, Magro M, Milde D, Knopfova L, Smarda J, Polakova H, Gabrielova E, Vianello F, Michalek J, Zboril R
Received 29 April 2014
Accepted for publication 10 July 2014
Published 20 November 2014 Volume 2014:9(1) Pages 5355—5372
DOI https://doi.org/10.2147/IJN.S66986
Checked for plagiarism Yes
Review by Single anonymous peer review
Peer reviewer comments 2
Josef Skopalik,1 Katerina Polakova,2 Marketa Havrdova,2 Ivan Justan,1 Massimiliano Magro,3 David Milde,2 Lucia Knopfova,4 Jan Smarda,4 Helena Polakova,1 Eva Gabrielova,5 Fabio Vianello,2,3 Jaroslav Michalek,1 Radek Zboril2
1Department of Pharmacology, Masaryk University, Brno, Czech Republic; 2Regional Centre of Advanced Technologies and Materials, Department of Physical Chemistry and Analytical Chemistry, Faculty of Science, Palacky University, Olomouc, Czech Republic; 3Department of Comparative Biomedicine and Food Science, University of Padua, Padova, Italy; 4Department of Experimental Biology, Faculty of Science, Masaryk University, Brno, Czech Republic; 5Department of Medical Chemistry and Biochemistry, Faculty of Medicine, Palacky University, Olomouc, Czech Republic
Objective: Cell therapies have emerged as a promising approach in medicine. The basis of each therapy is the injection of 1–100×106 cells with regenerative potential into some part of the body. Mesenchymal stromal cells (MSCs) are the most used cell type in the cell therapy nowadays, but no gold standard for the labeling of the MSCs for magnetic resonance imaging (MRI) is available yet. This work evaluates our newly synthesized uncoated superparamagnetic maghemite nanoparticles (surface-active maghemite nanoparticles – SAMNs) as an MRI contrast intracellular probe usable in a clinical 1.5 T MRI system.
Methods: MSCs from rat and human donors were isolated, and then incubated at different concentrations (10–200 µg/mL) of SAMN maghemite nanoparticles for 48 hours. Viability, proliferation, and nanoparticle uptake efficiency were tested (using fluorescence microscopy, xCELLigence analysis, atomic absorption spectroscopy, and advanced microscopy techniques). Migration capacity, cluster of differentiation markers, effect of nanoparticles on long-term viability, contrast properties in MRI, and cocultivation of labeled cells with myocytes were also studied.
Results: SAMNs do not affect MSC viability if the concentration does not exceed 100 µg ferumoxide/mL, and this concentration does not alter their cell phenotype and long-term proliferation profile. After 48 hours of incubation, MSCs labeled with SAMNs show more than double the amount of iron per cell compared to Resovist-labeled cells, which correlates well with the better contrast properties of the SAMN cell sample in T2-weighted MRI. SAMN-labeled MSCs display strong adherence and excellent elasticity in a beating myocyte culture for a minimum of 7 days.
Conclusion: Detailed in vitro tests and phantom tests on ex vivo tissue show that the new SAMNs are efficient MRI contrast agent probes with exclusive intracellular uptake and high biological safety.
Keywords: mesenchymal stromal cells, stem cell tracking, magnetic resonance imaging, superparamagnetic iron oxide nanoparticles, stem cell labelling
Introduction
Cellular therapies exploit the high regenerative potential of stem cells or multipotent cells. Mesenchymal stromal cells (MSCs) are currently the type of multipotent cells most extensively used in preclinical and clinical applications. These cells are able to repair damaged tissues, support the growth of original cells, and regulate inflammation. They are able to halt numerous degenerative diseases. MSC therapy procedures are based on injecting 1–100×106 MSCs directly into the body’s target (eg, heart, skin scar tissue, knee joint) or infusing MSCs into the blood circulation.1–3 A very complex biophysical process begins after the administration of MSCs, consisting of their interaction with the patient’s healthy and pathological cells and with the extracellular matrix. This leads either to cell attachment or cell rejection.4 Physicians should ideally have a monitoring tool capable of determining the fate of the injected stem cells. Such tools should provide information about the stem cell biodistribution immediately after injection, migration after several hours or days, and, over a longer term, stem cell survival and differentiation of grafted stem cells in vivo. Among the many diagnostic tools available, magnetic resonance imaging (MRI) is today the most widespread and seemingly ideal noninvasive method for monitoring stem cell migration and biodistribution in clinical practice.5,6 MRI enables in vivo imaging of the transplanted cells with high spatial resolution in three dimensions, together with visualization of the surrounding tissues, and without promoting cell toxicity or negative side effects.7
In order to monitor the cells’ biodistribution in a patient’s body, the MSCs must be labeled with a suitable contrast agent because unlabeled MSCs cannot be differentiated from other original cells in the body. Superparamagnetic iron oxide (SPIO) nanoparticles present the most convenient alternative among MRI contrast agents for stem cell labeling and monitoring by MRI. In fact, since they promote negative hypointense signal of the transplanted MSCs, SPIO particles increase the T2-weighted contrast of the transplanted tissue from surroundings.8
The commonly used SPIO nanoparticles consist of maghemite and/or a magnetite magnetic core. Because of the spinel structure with two nonequivalent magnetic sublattices favoring the establishment of ferrimagnetic ordering, these two iron oxide polymorphs exhibit strong magnetic properties achievable under low applied magnetic fields (<1.5 T), which makes them suitable for many biomedical applications. Moreover, when the size of iron oxide nanoparticles falls below a certain value (~30 nm), they become superparamagnetic even at room temperature.9,10 Besides their use in MRI,5,11 they are used in biomagnetic separations, magnetic hyperthermia treatment, or targeted drug delivery.9,12,13 The size of the SPIO nanoparticles in biomedical applications ranges from a few nanometers for individual particles to several hundred nanometers for clusters. SPIO particles are characterized by extremely large magnetic moments (with a saturation magnetization in the range of 60–80 emu/g), which affect the MRI signal.9,10,14
SPIO nanoparticles require a surface coating to prevent destabilization and agglomeration of the colloidal suspension. Most generally, SPIO nanoparticles are coated with dextran, carboxydextran, starch, poly(ethylene glycol) (PEG), or poly(vinyl alcohol) (PVA).14,15 However, most commercial SPIO contrast agents (eg, Endorem or Resovist, which are stabilized with dextran or carboxydextran) show low efficiency in endocytosis and other processes of uptake by MSCs. Moreover, the coating on the nanoparticles reduces the magnetic properties of the material, introduces a magnetically inert polymer, and selects a defined surface chemistry. We have recently developed new SPIO maghemite nanoparticles, known as surface-active maghemite nanoparticles (SAMNs), wherein good colloidal and surface properties have been combined harmoniously even without the polymer coating. It was also shown that they have the ability to bind biomolecules from the suspensions16 and can be internalized into HeLa cells successfully.17 It is therefore meaningful to test their potential for stem cell labeling and to compare their MRI contrast efficacy with the commercial contrast agent Resovist. Moreover, the bare nanoparticles are commonly said to be more toxic than the coated ones and therefore not appropriate for bioapplications. It is also questionable whether the protein corona or biomolecules in media, which are strongly adsorbed on the surface of bare SPIO nanoparticles during the incubation, form a self-assembled biomimetic system more natural and less toxic than various synthetic polymer-coated nanoparticles.
The aim of this study was threefold: 1) to assess the complex in vitro characteristics (viability, proliferation, migration, and differentiation) of SAMN-labeled stem cells in rat and human MSCs (rMSCs and hMSCs, respectively); 2) to investigate the SPIO labeling efficiency using various microscopic (optical microscopy, scanning electron microscopy [SEM], atomic force microscopy [AFM]) and spectroscopic techniques (atomic absorption spectroscopy [AAS]), and long-term labeling analysis and cocultivation of SAMN-labeled stem cells with myocytes; and 3) to test the contrast properties of SAMN- and Resovist-labeled cells at 1.5 and 7 T clinical MRI in T2-weighted images. All these tests were designed to prove the preliminary hypothesis that 48-hours labeling of rMSCs and hMSCs by novel SAMN nanoparticles using 50 μg/mL or 100 μg/mL is safe and that this labeling method will ensure sufficient incorporation of SAMNs into the internal space of cells, giving a satisfactory contrast of MSCs under T2 MRI scanning modes with a detection limit better than 100×103 cells per cubic centimeter.
Materials and methods
Synthesis and characterization of SAMN nanoparticles
Maghemite nanoparticles (SAMNs) were synthesized by borohydride reduction (53 mmol in liquid ammonia) of ferric chloride FeCl3·6H2O (37 mmol), both purchased from Sigma-Aldrich Co. (St Louis, MO, USA), at room temperature. After the reduction reaction (indicated by change of color to black), the temperature of the mixture was increased to 100°C and held constant for 2 hours. After cooling the mixture to room temperature, the magnetic fraction was separated using an external magnet and washed several times with water. The final step of the synthesis included thermal treatment of the intermediate at 400°C for 2 hours. The product obtained was dispersed in deionized water (Milli-Q) in an ultrasonic bath, giving the suspension its stable colloidal character as confirmed by monitoring over a few months. Detailed description of the synthesis and the precise physical and chemical characterization of these maghemite nanoparticles are described in our previous paper.18
Magnetic relaxometry of SAMNs was performed with a 3 T MRI scanner (Siemens Skyra, Erlangen, Germany) at the specialized experimental laboratory at Graz University, Graz, Austria. For all measurements, a circular polarized coil (“animal-coil”) with an inner diameter of 7.5 cm (RAPID Biomedical GmbH, Rimpar, Germany) was used to obtain a high signal-to-noise ratio. More information about the measurement and evaluation of relaxivity indexes is given in the Supplementary materials.
Cell cultures
Rat bone marrow stromal cells were harvested and cultured as described by Gallo et al.19 Briefly, bone marrow cells were isolated from the bone marrow of femurs by flushing the medium into the bone shaft. The cell suspension was filtered through a 40 μm nylon filter (Falcon) and plated at a density 2.5×10³/cm2 in chambers of 24-well plates. Cells were grown in complete Iscove’s modified Dulbecco Modified Eagle’s Medium (DMEM) (with 10% fetal bovine serum [FBS] and 2% penicillin–streptomycin) at 37°C and 5% CO2. Passaging was repeated when 80% confluence was obtained. MSCs from the third or fourth passage were used for our experiments.
hMSCs were isolated from the fatty tissue of three healthy donors who had undergone cosmetic liposuction (one male, two female). Isolation of hMSCs was based on the incubation of lipoaspirates with collagenase. MSCs were expanded in complete DMEM supplemented with 5% platelet lysate. The passaging procedure was the same as in the case of rMSCs.
Morphology and cluster of differentiation (CD) markers of rMSCs and hMSCs were checked before and after SPIO labeling. We analyzed CD90, CD73, D105, and CD34 expression using fluorescence-activated cell sorting (FACS) (BD FACSCanto, BD Biosciences, San Jose, CA, USA).
All animal experiments were performed in accordance with the law of Czech Republic (Law on Animal Protection and Decree of Ministry of Agriculture on Experimental Animal Use and Breeding) and were approved by the Committees for the Use of Experimental Animals at Masaryk University and Palacky University. All collection of waste lipoaspirates from liposuction was performed after approval of the Ethical Committee of Masaryk University and with signature-documented informed consent of patients.
Analysis of viability, proliferation, and migration capacity
For both rMSCs and hMSCs, we tracked the potential negative effect of SPIO nanoparticles on the growth rate of the cells. At the “pre-analysis” stage, we performed hMSC cultivation in SAMN solutions (over a wide range of 10–200 μg SAMN/mL in the cultivation medium for 24–48 hours). On the basis of this screening, we selected a narrow concentration interval and pertinent labeling time for the next main analysis; hMSCs and rMSCs were seeded at a density 2.5×10³/cm2 and incubated for 48 hours in the medium with the addition of new SAMNs at concentrations of 50 μg and 100 μg ferumoxides/mL for 48 hours. After this simple labeling process, the MSCs were washed out by culture medium exchange. Viability of the MSCs was detected using the LIVE/DEAD Viability/Cytotoxicity Kit for detection of viable and dead cells (Molecular Probes, Eugene, OR, USA) and flow cytometry assay based on propidium iodide (PI) staining (BD FACSCanto).
Proliferation of the labeled and nonlabeled cells was compared using two independent methods: 1) visual microscopic quantification of viable cells with ferumoxide staining (at the beginning of incubation with SPIO, at the end of incubation, and after the next 24 hours and 48 hours). Olympus IX 70 and CKX41 light fluorescence microscopes (Olympus Corporation, Tokyo, Japan) were used; 2) the xCELLigence system for measuring growth of adherent cells (Roche Diagnostics GmbH, Mannheim, Germany), which is a modern automatic quantification method based on the measurement of impedance.
Results of the described measurements on SAMN-labeled MSC were compared with those for control MSCs without SAMNs and with results using Resovist-labeled MSCs (with the same ferumoxide concentration and time of labeling). Part of the labeled hMSCs (1×10⁶) was trypsinized after 48 hours of labeling and used for MRI contrast evaluation (details in section “MRI phantom experiments”).
Migration capacity of labeled and unlabeled hMSCs was compared using two methods: 1) transwell dish with 8 μm pore filters (Corning® Costar®, Sigma-Aldrich Co., St Louis, MO, USA) inserted in normal 24-well combined with gradient 0%–30% FBS between the upper and bottom dish (bottom dish 300 μL DMEM + FBS, upper dish DMEM with 10×103 hMSC, percentage of migrated cells computed after 48 hours); 2) 24 wells with sterile plastic stoppers (6 mm diameter) in the central area and DMEM (stopper was removed after 10×103 hMSC attachment to dish, migration of cells to central area in 24 hours was computed using light microscopy). Differentiation properties of unlabeled hMSCs and SAMN-labeled hMSCs were compared using the StemPro Osteogenesis and StemPro Adipogenesis differentiation kits (Thermo Fisher Scientific).
Qualitative and quantitative cell uptake analysis of SAMNs
The localization of SAMN uptake during incubation and incorporation in the cells were analyzed by optical microscopy (Olympus IX 70), Prussian blue staining by commercial kit Accustain® (Sigma-Aldrich), by advanced SEM (SU6600, Hitachi Ltd., Tokyo, Japan), and by AFM (INTEGRA Aura). Details of SEM and AFM sample preparation are described in the Supplementary materials.
Iron concentration inside the cells was determined by AAS (Avanta Suma; GBC - Scientific Equipment, Braeside, VIC, Australia) in an acetylene–air flame. After the simple labeling process (50 μg ferumoxides/mL for 24 hours, 36 hours, and 48 hours, variable SAMNs and Resovist), the hMSCs were washed out by the culture medium, exchanged, and trypsinized, and 0.5×10⁶ of hMSC from three different donors were diluted in HCl and water (demineralized water 18.2 MΩ·cm). External calibration solutions in the range 0.5–10 mg/L were prepared by diluting a certified reference material–water calibration solution with an Fe concentration 1.000±0.002 g/L (Analytika, s.r.o., Praha, Czech Republic). The iron content per cell for each variant was computed.
The immunophenotype and forward/side scatter of MSCs (SAMN-labeled cells, Resovist-labeled cells, and control cells) were characterized by flow cytometry. Briefly, the cells were washed twice in Dulbecco’s phosphate-buffered saline (PBS) containing 1% bovine serum albumin (Sigma-Aldrich) and stained for 30 minutes at 4°C with antiCD90 – FITC, antiCD73 – PE, antiCD105 – APC, and antiCD34 – PerCP-Cy5 (BD Biosciences, Franklin Lakes, NJ, USA). The cells were washed with PBS and measured by a flow cytometer (BD FACS Canto II, BD Biosciences).
Long-term labeling experiment
For gaining additional insights into the potentially adverse effects after SAMN labeling, we arranged two types of long-term analyses.
First, we measured the growth curve using the xCELLigence impedance system (Roche). MSCs were seeded at density 2.5×10⁶/cm2 and cultivated in 96-well plates (E-Plate16 for the xCELLigence system). MSCs were exposed to the medium containing 50 μg and 100 μg ferumoxides/mL (SAMNs and Resovist) for ~100 hours without washing or exchanging the medium.
Second, after a standard 48-hours labeling (50 μg ferumoxides/mL), the morphology of three samples of labeled hMSCs and rMSCs (3×24 wells, initial confluence 2.5×10⁶/cm2, cultivation in DMEM with 5% PL) was imaged after 3 weeks and 6 weeks by optical microscopy. Passaging was done in each case after the first 2 weeks.
MRI phantom experiments
All MRI measurements were performed on a 1.5 T MRI scanner (Signa HORIZON Lx, GE Healthcare) with the acquisition of two-dimensional T2 fast-recovery fast spin echo (FRFSE) or gradient-recalled echo (GRE) sequences. Three types of tests were run.
First, we compared the negative contrast effect in the T2-weighted images of SAMN and Resovist nanoparticles in the concentration series 10 μg, 20 μg, 30 μg, 40 μg, 80 μg ferumoxides/mL (nanoparticles were resuspended in hot agar and then the sample was put into 1 mL test tubes; they were solidified at 4°C before MRI measurements) (Figure 1A). For this measurement, the following parameters for FRFSE sequence were used: TR (repetition time) =2,600 ms, TE (echo time) =91.7 ms, field of view (FOV) =11 cm ×11 cm. The horizontal section of each tube was displayed as a circle with a certain gray-scale value, and this value (“signal intensity index”) was quantified by the Signa Horizon LX software.
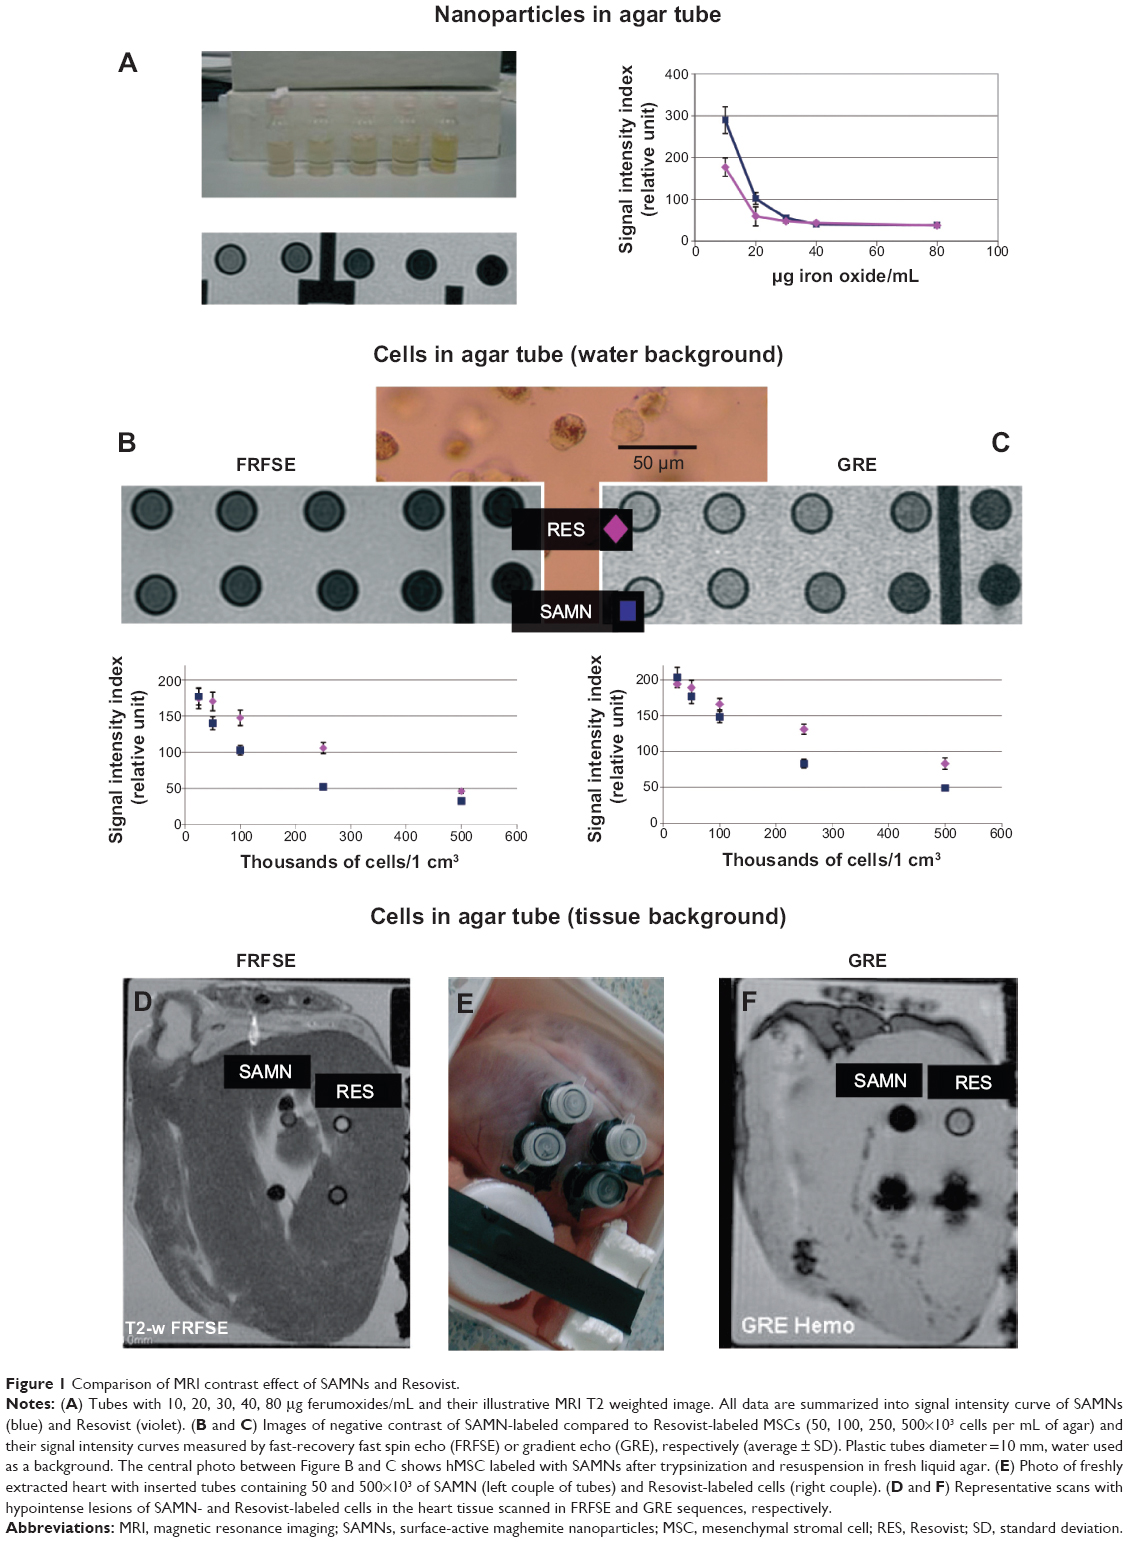 | Figure 1 Comparison of MRI contrast effect of SAMNs and Resovist. |
Second, the tubes with SAMN- and Resovist-labeled cells (50, 100, 250, 500×103 hMSC per mL of agar) were measured by FRFSE sequences in T2-weighted images (TR=2,500 ms, echotime =32.6 ms, FOV =14 cm ×14 cm (Figure 1B) and by GRE sequence (TR =1,740 ms, TE =90 ms, FOV =14×14 cm) (Figure 1C). Cells were prepared by incubation with the 50 μg ferumoxides/mL solution as described earlier. We made measurements of the tube’s horizontal section; each tube was measured for a minimum of three sections, and the same measurements were carried out for cells of the other two donors. The graphs showing the dependence of the signal intensity index (defined earlier) of cell solutions on the concentrations of cells were constructed.
Third, SAMN- and Resovist-labeled cell samples of 50 and 500×103 were inserted into fresh swine heart (illustrative Figure 1F) and scanned by two-dimensional T2 FRFSE and GRE sequences (Figure 1D and E). The parameters for FRFSE were as follows: TR =1,740 ms, TE =90, matrix =256×192, FOV =12×12 cm. For the GRE sequences, these parameters were set as follows: TR =420 ms, TE =15, matrix =320×224, FOV =24×18 cm. The quantification of the mean signal intensity index of the desired dark spots containing SPIO nanoparticles or SPIO-labeled stem cells in phantoms was processed using the original GE Signa Horizon Lx software.
We also made additional scans of tubes containing 50–500×103 hMSC per mL of agar in MERGE sequence mode on the 7 T experimental machine (Figure S4).
SAMNs-labeled MSC implantation into in vitro myocyte culture
SAMN-labeled MSCs totaling 5×10³ were pipetted into the 2 cm2 chamber containing 5-day-old beating rat neonatal myocytes. Neonatal myocytes in the chamber were prepared by the Department of Medical Chemistry and Biochemistry (obtained by methods of Chlopcikova et al,20 arranged on collagen I-coated plastic at density 5×10⁴/cm2). The MSC cell surface was stained with a fluorescence probe (antiCD90-FITC cn 568-F [BD Biosciences] or PKH26 [Sigma-Aldrich]) immediately before cocultivation and washed by PBS. The fate of SAMN-labeled MSCs in coculture was analyzed using bright-field and fluorescence microscopy at 1 hour, 24 hours, and 7 days after application.
Statistical analysis
Test of viability: three independent experiments were performed for the statistical analysis of viability. For quantification of cell viability using the calcein methods, we acquired random images of each sample using a 20× objective, and quantified the number of calcein-positive MSCs as a percentage of the total number of cells. For quantification of cell viability using the PI flow cytometry method, we acquired a minimum 1×10³ freshly trypsinized cells, and quantified the number of PI-negative MSCs as a percentage of the total number of cells using the BD FACS Diva Software version 4.
Test of proliferation: the growth curve for each SAMN, Resovist, and control MSC samples from each donor or experimental animal was measured in triplicate and an average curve was constructed. Three average curves from the three independent donors or animals were used to construct the final growth curve for each species and to calculate standard deviations. Tests for statistical significance of differences at defined time checkpoints on the growth curves were analyzed using paired two-sided t-tests.
The migration assays were measured in triplicates. Tests for statistical significance of differences were analyzed by t-tests. The iron concentration was determined for hMSCs from three donors, and the results are given in Table 1.
 | Table 1 Physicochemical properties of novel SAMN and traditional Resovist nanoparticles |
MRI contrast measurements of sets of tubes with SAMN- and Resovist-labeled hMSC cells were done independently for hMSCs from each donor. Each tube was measured in three horizontal sections and the average of signal intensity index was computed (± standard deviation [SD]). We used the results from donor 1 as representative of all donors in Figure 1B and C (average ± SD for each tube). All calculations were made using MS Excel 2003 and MedCalc version 12.
Results
Characterization of SAMN nanoparticles
From Mössbauer spectroscopy, it was determined that the SAMN nanoparticles had a maghemite polymorphic structure without traces of any other chemical phase (data not shown). As shown in Figure 2, the particles have a globular shape with a size distribution of ~10–20 nm (transmission electron microscopy imaging). Based on gas analysis and spectral data from Fourier transform infrared spectroscopy published in our previous work,18 we could confirm that the surface of the particles interacted with surrounding water molecules, maintaining low interparticle forces and good colloidal stability.
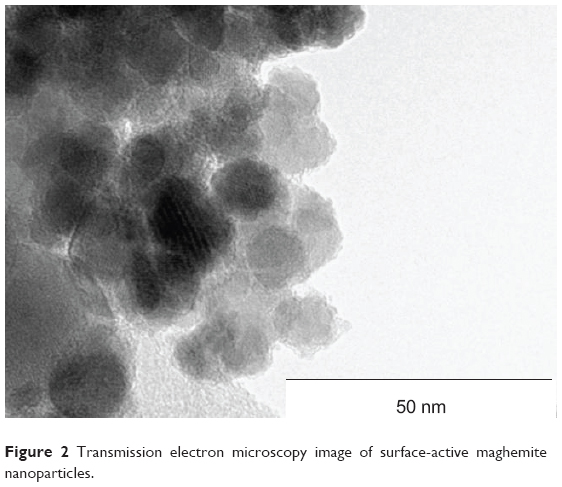 | Figure 2 Transmission electron microscopy image of surface-active maghemite nanoparticles. |
From the measurement of the hysteresis loop of particles at 300 K, a very high magnetization value was observed (nearly 71 A·m2/kg at 7 T), which is comparable to the value for bulk maghemite (85 A·m2/kg).21 The bare SAMN nanoparticles exhibit at 293 K longitudinal relaxation rate (r1) of 0.419 mM−1 (Fe) s−1 and transverse relaxation rate (r2) of 44.79 mM−1 (Fe) s−1, whereas Resovist has an r2 of 151 mM−1(Fe) s−1. We also measured the r2* index in SAMN particles, which reaches the very high value of 400 mM−1 (Fe) s−1, demonstrating a rapid loss of phase coherence of protons. A summary of all basic physical properties of SAMNs and Resovist is given in Table 1.
Analysis of viability, proliferation, and migration capacity of labeled cells
Results from main viability experiments, where hMSCs were labeled using 50 and 100 μg ferumoxides/mL for 48 hours, are presented in Figure 3A, and data for rMSCs in Figure 3E. In light of the results from this viability assay, we can say that 100 μg ferumoxides/mL can have a small negative effect on the viability (rMSC). A subsequent detailed proliferation assay was run using just only 50 μg ferumoxides/mL (results from microscopy analysis are presented in Figure 3B and F, representative data from xCELLigence assay in Figure 3C and G, and the statistical summary of all xCELLigence assay in Figure 3D and H). Both the microscopy assay (Figure 3B, F) and xCELLigence assay (Figure 3D, H) confirmed that SAMN solution of 50 μg ferumoxides/mL in combination with 48 hours labeling time did not affect cell proliferation.
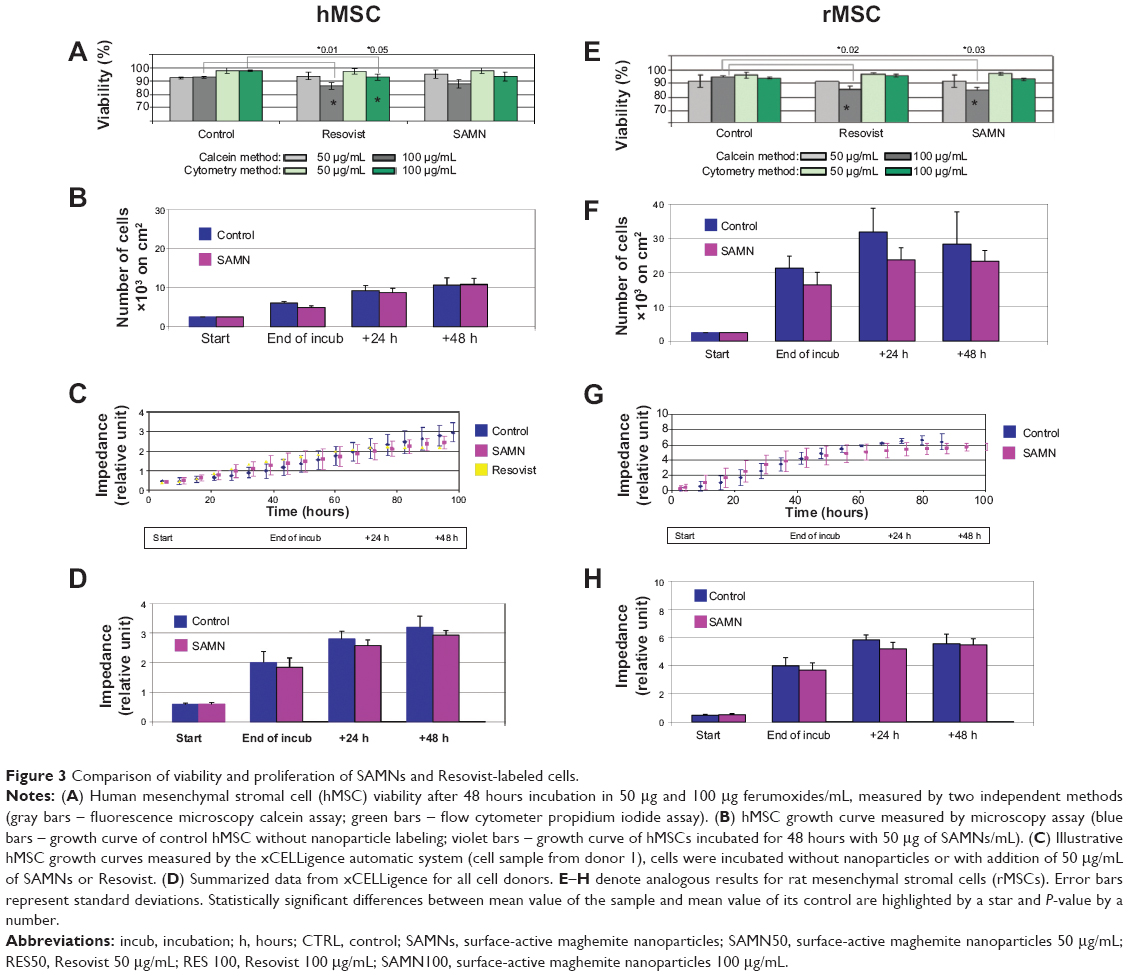 | Figure 3 Comparison of viability and proliferation of SAMNs and Resovist-labeled cells. |
Migration capacity of labeled and unlabeled hMSC quantified by the FBS gradient migration method was 6.2%±1.0% and 6.8%±0.8%, whereas the central stopper method gave 104±19 and 112±16 (number of cells that migrated into free central area). Differences between control and labeled cells were without statistical significance, and differentiation properties of SAMN-labeled hMSCs were not affected. The result from differentiation assay was the amount of adipogenic and osteogenic cells in the samples; the assay showed minimal differences between control and labeled samples (data not shown).
Qualitative and quantitative cell uptake analysis of SAMNs
The important physiological markers of labeled MSCs are their shape and surface area after SAMN labeling. The images from optical microscopy presented in Figure 4A demonstrate that 50 μg ferumoxides/mL labeled cells are identical to the control cells (microphotographs were taken 2 days after staining). After 48 hours of labeling, more than 95% of the hMSCs or rMSCs had internalized SAMN nanoparticles (Figure 4C). Light microscopy images of SAMN-labeled MSCs after Prussian blue staining show the presence of iron in the cell cytoplasm (Figure 4B).
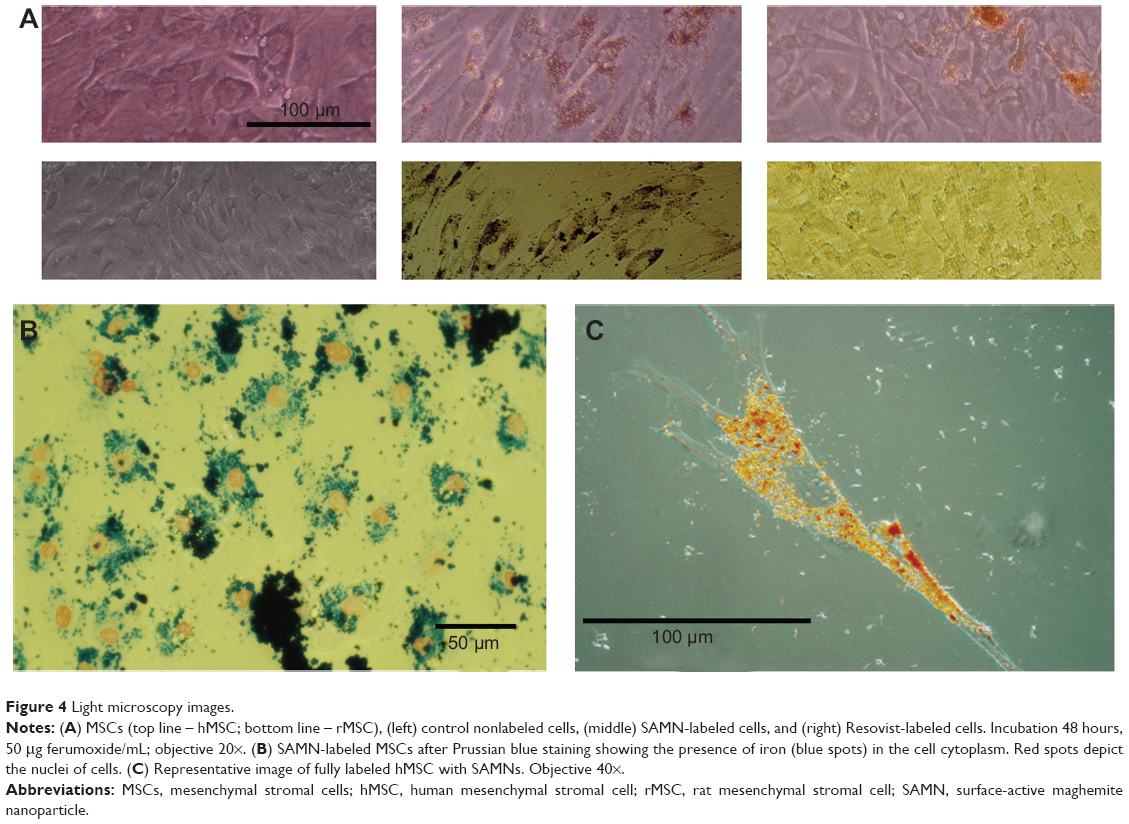 | Figure 4 Light microscopy images. |
SEM images showing cell morphology also demonstrate the flattened shape of SAMN-labeled cells with lamellipodia and their similarity to the normal native MSCs. It can be seen clearly (Figure S2A) that the intracellular nanoparticles are distributed around and close to the nucleus, where lysosomes should be largely and mostly situated. The image in Figure S2B is created using backscattered electrons, which improves the material contrast. In this case, we can see the presence of iron oxide nanoparticles as black dots (as heavy element here) whereas the rest of the cell body, grown on the FTO film (soda-lime glass slides with a fluorine-doped tin oxide [SnO2:F] layer) (methods in the Supplementary materials), is almost colorless (due to tin from the FTO). Moreover, the energy dispersive X-ray spectrum of this sample was also measured and the significant peaks were assigned to the iron from the nanoparticles and tin from the FTO film (detailed methods in the Supplementary materials).
The Figure S2C presents a detailed three-dimensional map of the same stem cell body as was measured by SEM but constructed using AFM. There is a noticeable difference between the fuzzy shaped SAMN internalized within the cell body and those adsorbed on the cell surface membrane, for which the bounds of the globular nanoparticles are sharply delineated.
Results of flow cytometry confirmed that a concentration of 50 μg/mL of SAMN labeling does not alter the CD phenotype of hMSCs and rMSC (Figure S3). Cytometry analysis also showed no increase of autofluorescence after the nanoparticle uptake.
Determination of iron content in labeled hMSC cells brought significantly higher Fe concentration in SAMN-labeled cells (113±9 pg Fe/cell) compared to Resovist (39±9 pg Fe/cell) after 48 hours of labeling (Table 2). Measurements after 24, 36 and 48 hours show almost linearly increasing Fe content in SAMN-labeled hMSC (data not shown). Another interesting point of view could be the correlation between the results from AAS method and flow cytometry. The ratio of higher Fe content in SAMN-labeled cells correlates well with their higher side scatter in comparison to lower side scatter of Resovist-labeled cells (Figure S3).
 | Table 2 Comparison of Fe concentration per cell for SAMNs and Resovist-labeled hMSCs (three donors, 48 hours of incubation) |
Long-term labeling experiment
In the first long-term experiment, measured in situ by the xCELLigence system, the cells were exposed to 50 and 100 μg/mL of ferumoxides for 110 hours. From the graph in Figure S1A, we can see that during the standard 48-hours incubation, all growth curves show negligible differences in comparison with nonlabeled control cells. After 48 hours, only the shape of the SAMN-labeled MSCs (50 μg/mL) is similar to the control curve (less than 20% difference). The rest of the curves show statistically significant differences compared to the control curve (30% and more).
During additional long-term monitoring (up to 96 hours) of labeled cells by optical microscopy, it was illustrated that the high ferumoxide concentration (visible dark dots under light microscopy; probably lysozomes full of SAMNs) in the cytoplasm was divided into the daughter cells. Another very important aspect of SAMN uptake is the absence of nanoparticles in the cell nucleus. Cell morphology was depicted on all microphotos after the first 48 hours of labeling (Figure 4A) and also after 3 and 6 weeks (Figure S1C) and shows that the exposed cells kept standard shape and size as nonlabeled cells.
MRI phantom experiments
Nanoparticle concentration series (10 μg, 20 μg, 30 μg, 40 μg, 80 μg of ferumoxides per milliliter of agar in tubes) were scanned simultaneously using a 1.5 T MRI instrument. The value of gray inside the circles well correlates with the concentration of iron oxide nanoparticles. With increasing ferumoxide concentration, the signal intensity decreases. These two curves (each point is the average from three independent experiments) show that SAMNs display no hypointensity of the signal intensity index (images of SAMN display are less dark than Resovist) at lower concentrations (0-30 μg/mL), but the degree of gray in the case of higher ferumoxide concentrations of SAMNs and Resovist nanoparticles is almost identical (Figure 1A).
As can be seen in Figure 1B and C, 50–500×103 cells labeled with both SAMNs and Resovist (dispersed in 1 mL of agar inside a tube of 1 cm diameter) provide very good negative contrast. From the curves of signal intensities, it is obvious that in both sequences (FRFSE and GRE) the cells labeled with SAMNs give more hypointense signal in comparison with Resovist-labeled cells. Consequently, we compared T2 FRFSE sequences and GRE heme sequences (GRE is historically established for detecting hemosiderin in the brain)22 for samples of labeled cells incorporated into freshly extracted heart (Figure 1F). The signal intensity of the labeled cells (especially in the 50×103 MSC tube) scanned by FRFSE (Figure 1D) is comparable with that of fresh heart tissue. On the contrary, GRE sequences display the tube with 50×103 SAMN-labeled cells with a sufficient contrast, similar to results of Smirnov et al23 enabling very clear visualization of this amount of MSC cells (Figure 1E). Another detailed comparison of contrast properties of labeled cells under different scanning modes and labeling methods is part of Figure S4.
MSC implantation into in vitro myocyte culture
Figure 5A shows the shape of MSCs immediately after injection into myocardial culture. They have a globular appearance, with ferumoxide complexes visible inside the cells. MSCs attached very well to the beating myocardial tissue (strong attachment was tested by moderate flushing using a micropipette), changed to a flattened shape, and displayed strong adherence but also excellent elasticity in cases where the surrounding tissue was contracting (Figure 5B and Video S1). The MSCs survived in the myocardial culture for at least 7 days (Figure 5C), still with strong adherence, elasticity, and visible ferumoxide SPIO clusters inside their cytoplasm. Our preliminary data show that the incorporated MSCs are recognizable in that contractile myocyte layer also after 15 days and 30 days.
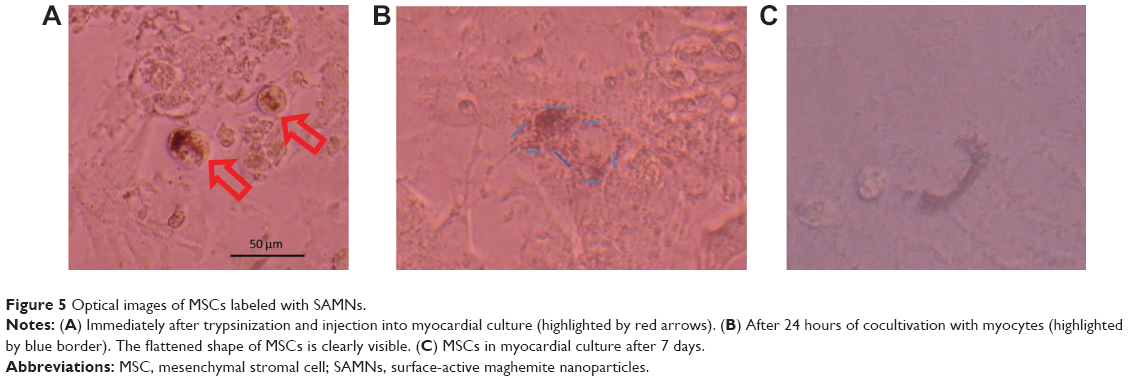 | Figure 5 Optical images of MSCs labeled with SAMNs. |
Discussion
The increasing demand for new MRI probes suitable for clinical cell tracking, and the lack of commercial contrast agents based on SPIO nanoparticles at the same time, has led to intensive research in this field. Several traditional contrast agents have been withdrawn from the market7 recently or have displayed insufficient biocompatibility.24,25 Thus, the quest to fabricate economically accessible and yet efficient new contrast probes has taken on great importance. Our bare stoichiometric maghemite (γ-Fe2O3) nanoparticles are named “SAMNs” because their most prominent characteristic is their ability to form stable colloidal suspensions in water without any organic or inorganic coating. Moreover, SAMNs reveal unique spectroscopic properties and a well-defined crystalline structure.26
The usual way to incorporate nanoparticles with size smaller than 100 nm into the cell in vitro is through their direct addition to the cultivation medium. The incorporation process of the SPIO nanoparticles involves adsorption to cell membrane, which is followed by active/passive transport across the cell membrane.27–29 Cationic particles are taken into cells through clathrin- or caveolin-mediated endocytosis, but anionic particles enter by mediator-independent endocytosis.30 We can assume that our anionic SAMNs enter the MSCs in the same way. Numerous publications describe nanoparticles with positive surface charge which are internalized into cells more efficiently than those with negative surfaces.31–33 Some studies, however, show an uptake behavior that is just the opposite.34,35 Despite the fact that the cellular membrane is in general negatively charged, it does have some areas with cationic sites which allow the binding of anionic nanoparticles.36 We also must have in mind that, although bare SAMNs surface characteristics confer the ability to form stable colloidal suspensions, suggesting a network of interactions with water molecules and repulsive forces inhibiting nanoparticle aggregation, the nanoparticle surface is able to interact with organic molecules in solution.26,37 SAMN’s ability to bind molecules could lead to a fast opsonization in the cell culture media and, subsequently, the resulting protein shell could make SAMNs a nontoxic biomimetic nanosystem recognizable by stem cells and stimulate the nanoparticle uptake. As we can see from time-lapse microscopy movies, SAMN clusters are efficiently internalized into the cells followed by their dynamic reordering among cells during cell life and cell division (Figure S1B).
It is very promising that all hMSC and rMSC proliferation experiments together lead to the conclusion that toxicity induced by 48 hours of incubation in 50 μg/mL of SAMN is minimal and without statistical significance during the first 2 days of staining and minimal during the next 2 days after cultivation in complete medium. Our 48-hours SPIO labeling process with precise cell washing yields well-labeled cells where most of the ferrous complexes are actually inside the cells and not on the cell surface.
We also demonstrate this excellent SAMN intracellular integration by advanced microscopy techniques such as SEM and AFM with unique cell sample preparation using an FTO substrate for cell fixing. This novel universal cell fixing method provides two- or three-dimensional mapping of the same MSC sample under AFM and SEM.
Quantification and comparison of magnetic response of 50, 100, 250, and 500×103 cells containing SAMN or Resovist show significant advantages of SAMN over Resovist (Figure 1B, C and Figure S4). Additionally, the better parameters of SAMN-labeled cells were also proved under the 7 T scanner (Figure S4). The quantified higher MRI contrast correlates well with the higher Fe content in SAMN-labeled cells. Following the physical theory of magnetic resonance, we can identify only two possible reasons that can explain this more hypointense signal: 1) a higher content of ferumoxide inside the cell (within the given volume); and/or 2) a higher relaxivity index of the SAMN sample over Resovist having the same Fe concentration (pg/mL) within the same volume (1 cm3). Nevertheless, the SAMN sample (phantom solution without cells) does not show a higher contrast effect than Resovist (as proved by the experiments featured in Figure 1A and by relaxivity measurements). Thus, the latter reason is not relevant. The higher contrast effect (hypointensity) of SAMN-labeled cells can therefore be explained in terms of the higher content of ferumoxide per cell compared to that in Resovist. This higher content was also confirmed by the AAS measurements (Table 2).
This deduction brings the secondary question, namely how to explain better SAMN uptake over Resovist. We hypothesized that SAMNs have a more suitable size and their nanoparticle surface provides better biomolecule opsonization for the following internalization process into the cells; SAMN could also exhibit higher saturation limit for the storage of nanoparticles in internal organelles (probably in lysozomes), but the confirmatory confocal analysis is now at the beginning stage.
This higher ferumoxide content definitely stems from a more efficient uptake of the SAMNs compared to Resovist during the 48-hours incubation period. From the quantitative analysis of Fe concentration per cell (measured by AAS), it was confirmed that the amount of Fe in cells labeled with SAMNs incubated for 48 hours is more than two times that in 48-hours incubated Resovist-labeled cells. Nevertheless, it did not show any higher toxicity over Resovist (as shown in the complex viability analysis results).
Another important result is that labeled MSCs survived very well in in vitro monoculture and also in the heterogeneous cocultures, for example, in coculture with myocytes for at least 7 days (Figure 5C). Our preliminary data show that the incorporated MSCs are viable and recognizable in the contractile myocyte layer also after 15 days and 30 days (data not shown).
The next crucial point for future in vivo MRI monitoring of SAMN-labeled cells is also the choice of suitable scanning sequences. We compared FRFSE sequences and GRE heme sequences for several phantom samples. As seen in Figure 1D and E and Figure S4, our SPIO-labeled stem cells in tissue phantoms are more visible in GRE than in FRFSE sequences. This GRE experiment shows that the detection limit for SAMN-labeled cells in heart tissue is minimally 50×106, which is better than limit of Resovist under the same staining conditions (ferumoxide concentration and time) and scanning conditions.
Results of this study confirm our assumed hypothesis described in the introduction, that bare SAMNs could become favorable contrast agent for noninvasive MRI stem cell tracking. From the clinical perspective, there are, however, some additional aspects that should be clarified in the near future such as the kinetics of the nanoparticle elimination from the cell cytoplasm, nanoparticle storage, and degradation in internal organelles.
Conclusion
The newly and easily synthesized maghemite nanoparticles, called SAMNs, with their peculiar surface colloidal properties, show a high efficiency in labeling rat and human MSCs. A concentration of 50 μg/mL and 48 hours of labeling were found to be optimal for hMSC and rMSC labeling. The uptake efficiency under these conditions is significantly higher than that of commercial Resovist. Moreover, the viability and proliferation profile of both human and rat SAMN-labeled MSCs were not affected. These SAMN-labeled MSCs provide excellent contrast in T2-weighted 1.5- and 7 T MRI measurements. Phantom cell samples with concentration of 50–500×103 SAMN-labeled cells/mL offer significantly higher contrast than Resovist-labeled cell samples. Thus, SAMNs can be a promising contrast agent for future noninvasive in vivo MSC tracking by MRI.
Acknowledgments
This study was financially supported by the Czech Ministry of Education (project LM2011017), the Czech Ministry of Health (project NT11137), the European Regional Development Funds (CZ.1.05/2.1.00/03.0058, CZ.1.07/2.3.00/20.0183), Ministry of Education, Youth and Sports of Czech Republic (project LO1304), and IGA_PrF_2014017. The authors wish to thank Clemens Diwoky (Graz University, Austria) for the measurement of MR relaxivity indexes of SAMNs, Dr Pavol Szomolanyi (General Hospital, Vienna) for the performance of MRI phantom experiments, Monika Homolkova (Institute of Complex Systems, Nove Hrady, Czech Republic) for time-lapse measurement of labeled cells, and the company Medihope s.r.o. for tissue MRI measurements.
Disclosure
All authors report no conflicts of interest in this work.
References
Martin-Rendon E, Brunskill SJ, Hyde CJ, Stanworth SJ, Mathur A, Watt SM. Autologous bone marrow stem cells to treat acute myocardial infarction: a systematic review. Eur Heart J. 2008;29:1807–1818. | ||
Wakitani S, Mitsuoka T, Nakamura N, Toritsuka Y, Nakamura Y, Horibe S. Autologous bone marrow stromal cell transplantation for repair of full-thickness articular cartilage defects in human patellae: two case reports. Cell Transplant. 2004;13:595–600. | ||
Kebriaei P, Robinson S. Treatment of graft-versus-host-disease with mesenchymal stromal cells. Cytotherapy. 2011;13:262–268. | ||
Wang Z, Ruan J, Cui DX. Advances and prospect of nanotechnology in stem cells. Nanoscale Res Lett. 2009;4:593–605. | ||
Corot C, Robert P, Idée JM, Port M. Recent advances in iron oxide nanocrystal technology for medical imaging. Adv Drug Deliv Rev. 2006;58:1471–1504. | ||
Kraitchman DL, Heldman AW, Atalar E, et al. In vivo magnetic resonance imaging of mesenchymal stem cells in myocardial infarction. Circulation. 2003;107:2290–2293. | ||
Berman SMC, Walczak P, Bulte JWM. Tracking stem cells using magnetic nanoparticles. Wiley Interdiscip Rev Nanomed Nanobiotechnol. 2011;3:343–355. | ||
Bulte JWM, Kraitchman DL. Iron oxide MR contrast agents for molecular and cellular imaging. NMR Biomed. 2004;17:484–499. | ||
Pankhurst QA, Connolly J, Jones SK, et al. Applications of magnetic nanoparticles in biomedicine. J Phys D Appl Phys. 2003;36:R167–R181. | ||
Wang YXJ, Hussain SM, Krestin GP. Superparamagnetic iron oxide contrast agents: physicochemical characteristics and applications in MR imaging. Eur Radiol. 2001;11:2319–2331. | ||
Weissleder R, Moore A, Mahmood U, et al. In vivo magnetic resonance imaging of transgene expression. Nat Med. 2000;6:351–355. | ||
Berry CC, Curtis ASG. Functionalisation of magnetic nanoparticles for applications in biomedicine. J Phys D Appl Phys. 2003;36:198–206. | ||
Alexiou C, Jurgons R, Seliger G, Iro H. Medical applications of magnetic nanoparticles. J Nanosci Nanotechnol. 2006;6:2762–2768. | ||
Laurent S, Forge D, Port M, et al. Magnetic iron oxide nanoparticles: synthesis, stabilization, vectorization, physicochemical characterization, and biological applications. Chem Rev. 2008;108:2064–2110. | ||
Thanh NTK. Magnetic Nanoparticles from Fabrication to Clinical Applications. Boca Raton: CRC Press, Taylor & Francis; 2012. ISBN 978-1-4398-6932-1. | ||
Sinigaglia G, Magro M, Miotto G, et al. Catalytically active bovine serum amine oxidase bound to fluorescent and magnetically drivable nanoparticles. Int J Nanomedicine. 2012;7:2249–2259. | ||
Venerando R, Miotto G, Magro M, et al. Magnetic nanoparticles with covalently bound self-assembled protein corona for advanced biomedical applications. J Phys Chem C. 2013;117:20320–20331. | ||
Magro M, Sinigaglia G, Nodari L, et al. Charge binding of rhodamine derivative to OH- stabilized nanomaghemite: universal nanocarrier for construction of magnetofluorescent biosensors. Acta Biomater. 2012;8:2068–2076. | ||
Gallo MP, Ramella R, Alloatti G, et al. Limited plasticity of mesenchymal stem cells cocultured with adult cardiomyocytes. J Cell Biochem. 2007;100:86–99. | ||
Chlopcikova S, Psotova J, Miketova P. Neonatal rat cardiomyocytes – a model for the study of morphological, biochemical and electrophysiological characteristics of the heart. Biomed Pap Med Fac Univ Palacky Olomouc Czech Repub. 2001;145:49–55. | ||
Tucek J, Zboril R, Petridis D. Maghemite nanoparticles by view of Mossbauer spectroscopy. J Nanosci Nanotechnol. 2006;6:926–947. | ||
Shapiro EM, Skrtic S, Sharer K, Hill JM, Dunbar CE, Koretsky AP. MRI detection of single particles for cellular imaging. Proc Natl Acad Sci U S A. 2004;101:10901–10906. | ||
Smirnov P, Gazeau F, Beloeil JC, Doan BT, Wilhelm C, Gillet B. Single-cell detection by gradient echo 9.4 T MRI: a parametric study. Contrast Media Mol Imaging. 2006;1:165–174. | ||
Kostura L, Kraitchman DL, Mackay AM, Pittenger MF, Bulte JW. Feridex labeling of mesenchymal stem cells inhibits chondrogenesis but not adipogenesis or osteogenesis. NMR Biomed. 2004;17:513–517. | ||
Chang YK, Liu YP, Ho JH, Hsu SC, Lee OK. Aminesurface-modified superparamagnetic iron oxide nanoparticles interfere with differentiation of human mesenchymal stem cells. J Orthop Res. 2003;30:1499–1506. | ||
Magro M, Faralli A, Baratella D, et al. Avidin functionalized maghemite nanoparticles and their application for recombinant human biotinyl-SERCA purification. Langmuir. 2012;28:15392–15401. | ||
da Rocha EL, Caramoni GF, Rambo CR. Nanoparticle translocation through a lipid bilayer tuned by surface chemistry. Phys Chem Chem Phys. 2013;15:2282–2290. | ||
Stark WJ. Nanoparticles in biological systems. Angew Chem Int Ed Engl. 2011;50:1242–1258. | ||
Singh N, Jenkins G, Asadi R. Potential toxicity of supermagnetic iron oxide. Nano Rev. 2010;1:538–553. | ||
Haruhs-Frenkel O, Debotton N, Benita S, Altschuler Y. Targeting of nanoparticles to the clathrin-mediated endocytic pathway. Biochem Biophys Res Commun. 2007;353:26–32. | ||
Kralj S, Rojnik M. Effect of surface charge on the cellular uptake of fluorescent magnetic nanoparticles. J Nanopart Res. 2012;14(10):1–14. | ||
Jo JI, Aoki I, Tabata Y. Design of iron oxide nanoparticles with different sizes and surface charges for simple and efficient labeling of mesenchymal stem cells. J Control Release. 2010;142(3):465–473. | ||
Bhattarai SR, Kim SY, Jang K. Laboratory formulated magnetic nanoparticles for enhancement of viral gene expression in suspension cell line. J Virol Methods. 2008;147(2):213–218. | ||
Pradhan P, Giri J, Banerjee R. Cellular interactions of lauric acid and dextran-coated magnetite nanoparticles. J Magn Magn Mater. 2007;311(1):282–287. | ||
Luciani N, Gazeau F, Wilhelm C. Reactivity of the monocyte/macrophage system to superparamagnetic anionic nanoparticles. J Mater Chem. 2009;19(35):6373–6380. | ||
Wilhelm C, Gazeau F, Roger J, et al. Interaction of anionic superparamagnetic nanoparticles with cells: kinetic analysis of membrane adsorption and subsequent internalization. Langmuir. 2002;18:8148–8155. | ||
Golovko DM, Henning T, Bauer JS, et al. Accelerated stem cell labeling with ferucarbotran and protamine. Eur Radiol. 2010;20:640–648. |
Supplementary materials
Preparation of stem cells for SEM and AFM microscopy
For microscopy imaging of superparamagnetic iron oxide (SPIO)-labeled stem cells, soda-lime glass slides with a fluorine-doped tin oxide (SnO2:F) layer (FTO glass slides) were used. The human mesenchymal stromal cells (hMSCs) were incubated for 48 hours with surface-active maghemite nanoparticles (SAMNs) (50 μg Fe/mL) in 24-well plates, where a special matrix consisting of the FTO slides was inserted. Adherent SPIO-labeled cells were fixed on this surface in 3% glutaraldehyde (dissolved in phosphate buffer) and washed two times with 0.2 M phosphate buffer (pH 7.2). The cells were then dehydrated using an ethanol series and dried overnight at room temperature. Samples were observed using scanning electron and atomic force microscopy.
Scanning electron microscopy
The distribution and localization of nanoparticles adsorbed or internalized within the stem cells were observed using a scanning electron microscope (Hitachi SU6600) at an acceleration voltage of 15 kV. The presence of iron oxide nanoparticles was confirmed by energy dispersive X-ray spectroscopy.
Atomic force microscopy
The morphology, shape, and visualization of individual nanoparticles on the cellular surface of the fixed and labeled cells on FTO were observed by using an AFM (INTEGRA Aura). The measurements were taken in semicontact mode with a scanning range of 100 μm.
Relaxivity measurement
Measurements were performed with a clinical 3T whole-body magnetic resonance (MR) scanner (Siemens Skyra, Erlangen, Germany). For all measurements, a circularly polarized coil (animal coil) with an inner diameter of 7.5 cm (RAPID, Biomedical GmbH, Rimpar, Germany) was used to obtain a high signal-to-noise ratio.
All complexes were diluted in agarose. A dilution series starting from 0.5 mM Fe to 0.031 mM Fe was filled into 2 mL Eppendorf tubes.
R2 relaxometry measurements were realized with a two-dimensional Carr–Purcell–Meiboom–Gill (CPMG) sequence with an echo spacing of 8 ms and 20 echoes. TR =6,000 ms; FOV =120×49 mm; matrix =192×156; single 5 mm slice.
R2* was measured based on a unipolar multiecho two-dimensional gradient-echo (GRE) sequence with an inter echo spacing of 3.31 ms and 12 echoes; TR =500 ms; α=30°; NEX =4; FOV =120×71 mm; matrix =192×114; slice thickness =1.5 mm.
R1 was measured by employing an inversion–recovery fast spin echo (IRFSE) and six different inversion times (50, 100, 200, 400, 800, 1,600, 3,200 ms), at a temperature of 23.2°C, a turbo factor of 3, TR =5,000 ms, TE =7.7 ms, FOV =115×93 mm, matrix =192×156 at 5 mm slice thickness. Transverse and longitudinal relaxation times were calculated using a self-written program (IDL, Exelis Inc., McLean, VA, USA). T2 and T2* were determined with a linear fit of the logarithmized signal intensity over echo time (for all used TEs the SNR was >5), whereas the first echo of the T2 dataset was ignored. T1 was calculated using a three-parameter fit of the IR-FSE dataset according to the signal equation.
Finally, r1, r2, and r2* were computed as the slope of the linear regression between R1, R2, and R2* and the Fe concentration in mM.
Labeled MSCs by ferrous nanoparticles display very good contrast under light microscopy. Nanoparticle clusters are visible as brown dots inside the cytoplasm.
 | Figure S1 Additional long-term experiments. |
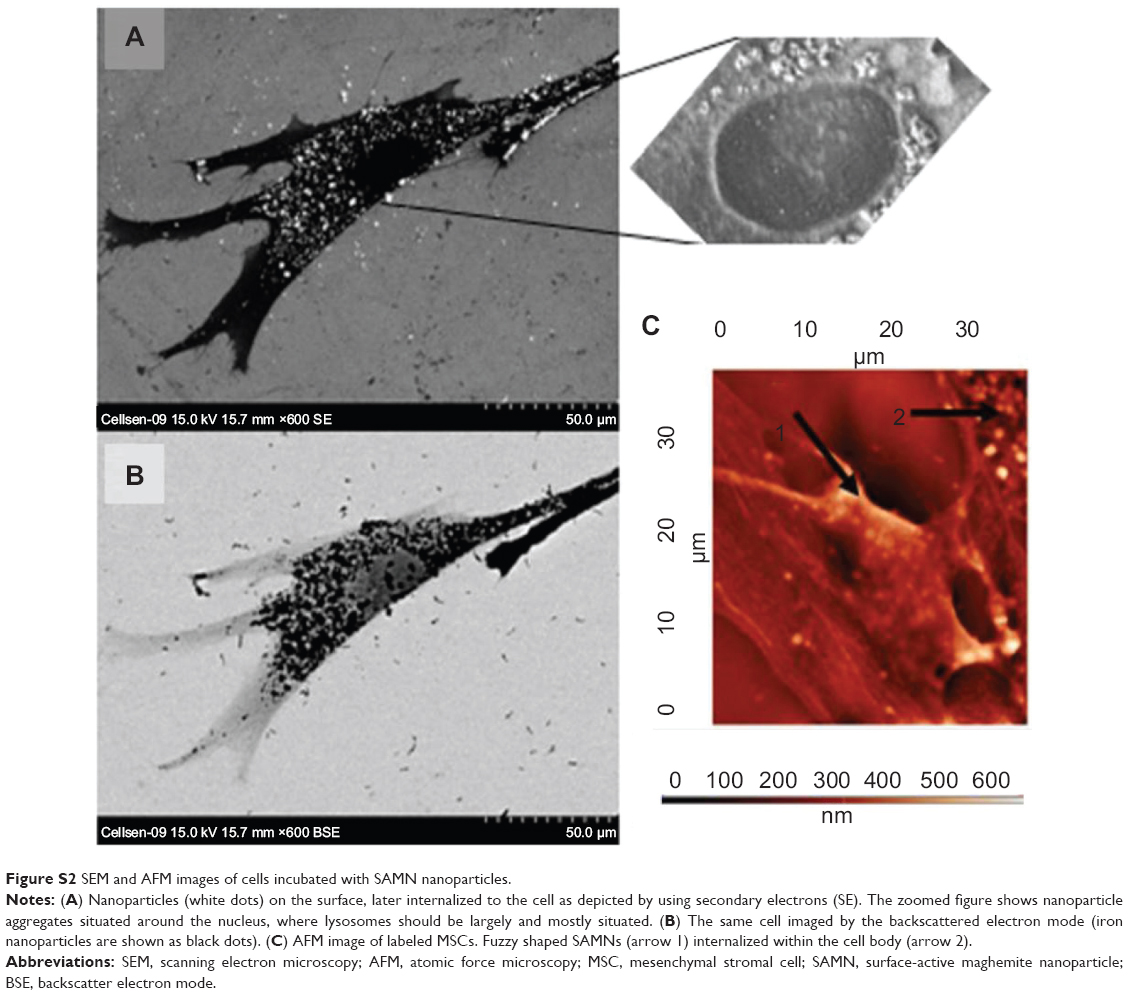 | Figure S2 SEM and AFM images of cells incubated with SAMN nanoparticles. |
 | Figure S3 Flow-cytometry analysis of hMSC: side scatter, forward scatter, CD90 positivity, CD73 positivity, CD105 positivity, and CD34 negativity. |
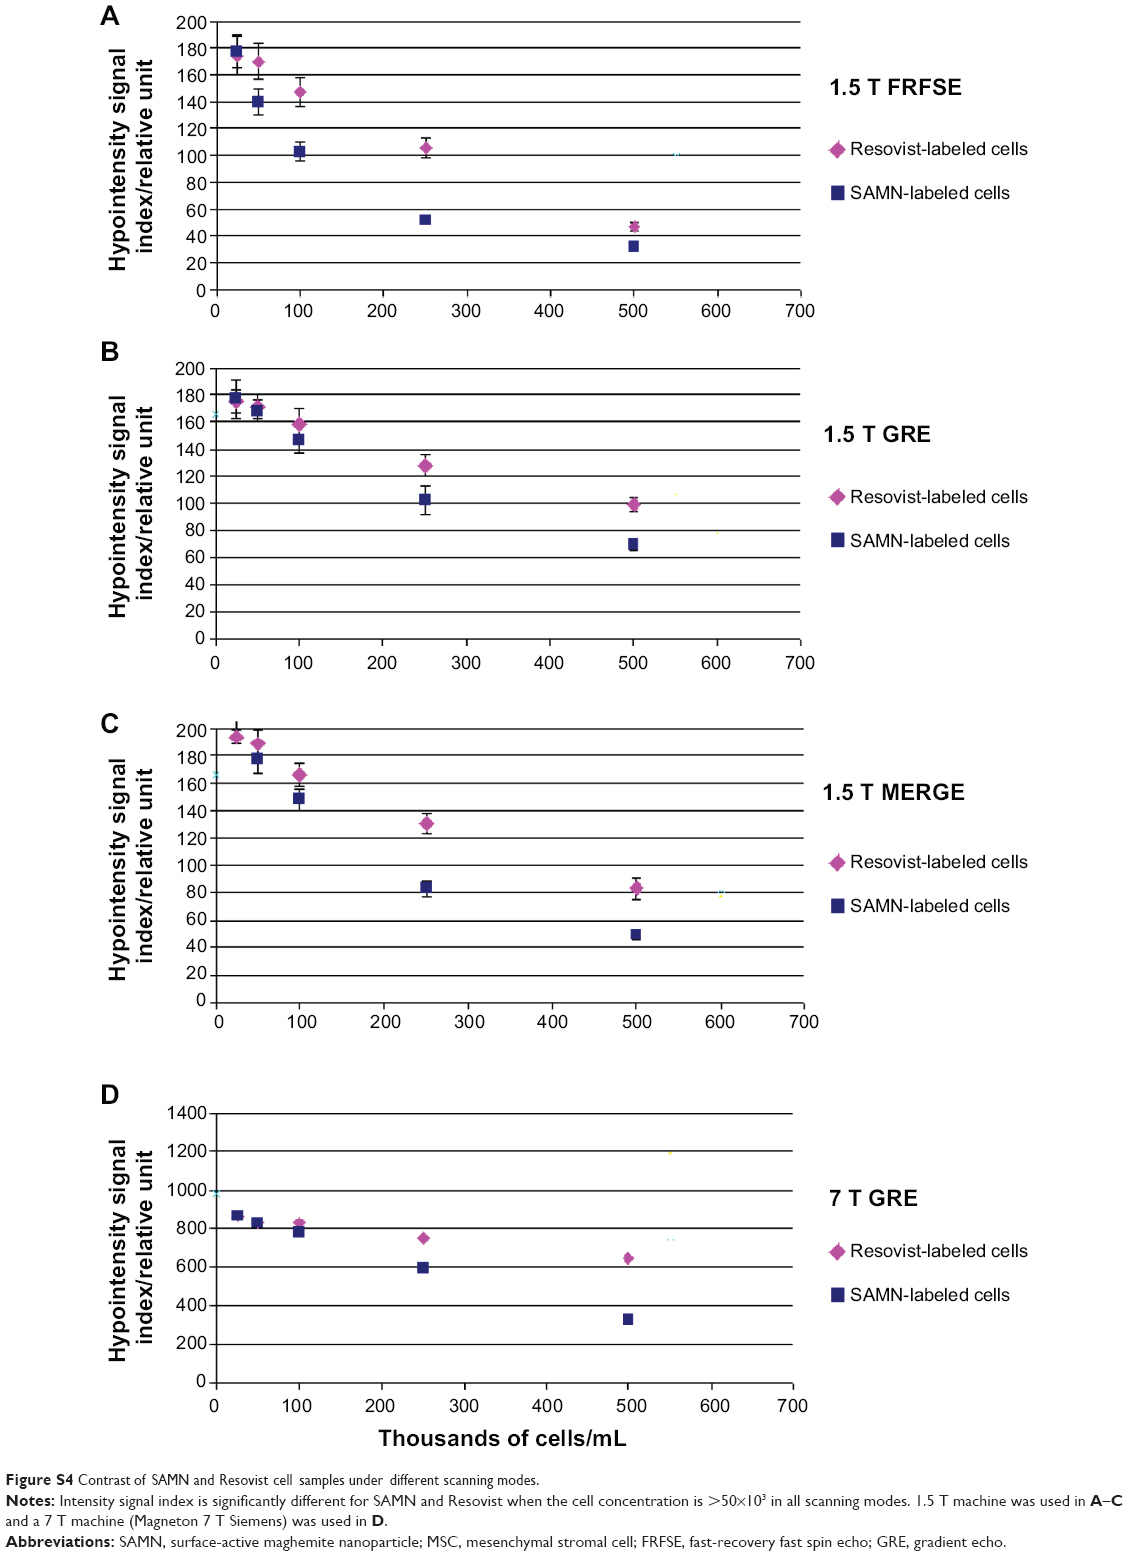 | Figure S4 Contrast of SAMN and Resovist cell samples under different scanning modes. |
 © 2014 The Author(s). This work is published and licensed by Dove Medical Press Limited. The full terms of this license are available at https://www.dovepress.com/terms.php and incorporate the Creative Commons Attribution - Non Commercial (unported, v3.0) License.
By accessing the work you hereby accept the Terms. Non-commercial uses of the work are permitted without any further permission from Dove Medical Press Limited, provided the work is properly attributed. For permission for commercial use of this work, please see paragraphs 4.2 and 5 of our Terms.
© 2014 The Author(s). This work is published and licensed by Dove Medical Press Limited. The full terms of this license are available at https://www.dovepress.com/terms.php and incorporate the Creative Commons Attribution - Non Commercial (unported, v3.0) License.
By accessing the work you hereby accept the Terms. Non-commercial uses of the work are permitted without any further permission from Dove Medical Press Limited, provided the work is properly attributed. For permission for commercial use of this work, please see paragraphs 4.2 and 5 of our Terms.